Article

Live Crown Ratio Models for Loblolly Pine (Pinus taeda) with Beta Regression

by
Krishna P. Poudel
*,
Samantha C. Avery
and
Joshua J. Granger
Department of Forestry, Mississippi State University, P.O. Box 9681, Mississippi State, MS 39762, USA
*
Author to whom correspondence should be addressed.
Forests 2021, 12(10), 1409; https://doi.org/10.3390/f12101409
Submission received: 20 September 2021 / Revised: 14 October 2021 / Accepted: 14 October 2021 / Published: 15 October 2021
(This article belongs to the Section Forest Ecology and Management)

Abstract

:
The growth and production potential of a tree depends on its crown dimensions as these are closely related to a tree’s photosynthetic capacity. However, tree crowns have been studied less compared to their main stems because of their lower market value and because the measurement of crown dimensions, such as crown volume or surface area, is difficult. Frequently, an individual tree’s live crown ratio (LCR) is predicted by linear or nonlinear models that are a function of easy-to-measure dendrometric variables using ordinary least-squares techniques. Using the long-term data from established genetic and spacing trials, we developed and evaluated the predictive performance of three nonlinear models and introduced a new generalized linear model for predicting LCR. The nonlinear models were fit using exponential, Weibull, and Richards functions. The generalized linear model was based on beta regression. This resulted in a slightly smaller error than the other models in predicting the LCR of loblolly pine trees used in this study. Crown ratio is measured in percentage unit and should be modeled using generalized linear models that assume a beta distribution for error terms.

1. Introduction

The growth potential and production potential of a tree depend on its crown dimensions because these determine a tree’s photosynthetic capacity [1,2,3]. Depending on the tree and its site characteristics, the tree crown accounts for a substantial portion of the tree’s total biomass and provides critical information in the assessment of economic feasibility of crown utilization for bioenergy production. Tree crowns are also relevant in the studies of stand growth due to their close correlation with stem diameter and stand density. From a wildlife management perspective, crown dimensions impact the availability of the type and amount of understory vegetation, which correlates with the habitat suitability of different wildlife species. However, tree crowns have been studied much less compared to main stems as a result of their lower market value [1,2]. Additionally, crown dimensions such as crown volume or surface area are difficult to measure directly; therefore, live crown length, height to the base of the live crown, or live crown ratio (LCR) are often used as surrogate predictors in individual tree growth and yield models [3]. The LCR plays a key role in determining thinning and other treatment (e.g., fertilization) responses in individual tree growth and yield models [4]
Individual tree LCR is defined as the ratio of live crown length to tree height and provides an estimate of potential photosynthetic surface area for a tree compared to its total respiration area [5]. Therefore, LCR is considered an indirect measure of a tree’s photosynthetic capacity and serves as an indicator of a tree’s competitive status in the stand [6]. A tree with an LCR of 1.0 (or 100%) has the maximum possible leaf surface area and biomass, whereas an LCR value closer to zero indicates that a tree’s growth is inhibited because of limited leaf surface area [1]. A tree with a greater LCR can take greater advantage of available light resources than a tree with a smaller LCR [5]. Accordingly, for a given species and age, trees with larger crown sizes have higher growth rates [7]. For example, Patton et al. [8] observed higher annual diameter growth after thinning in planted white spruce (Picea glauca (Moench) Voss) trees with larger crown ratios in Minnesota, USA.
The size of a live crown, as well as its distribution along the bole, affects the shape of a tree’s bole [9] and biomechanics. This also affects the quality of logs that can be retrieved from a tree. Therefore, crown dimensions have also been used as predictors of stem taper in addition to diameter and height (e.g., [10,11]). Tree crowns can also be critical in fuel load assessments and in the development of fire management strategies [12]. For example, the height to base of a live crown, a variable algebraically related to LCR, is a critical factor in modeling fire behavior, as it relates to the rate of spread of a crown fire. Additionally, smaller heights to the base of live crowns (i.e., larger crown ratios) are associated with an increased risk of crown fires developing from surface fires [13].
The LCR is indicative of tree vigor, and an LCR of 0.33 or higher is optimal for the optimum growth of southern pines [14]. Crown ratio itself is influenced by many tree and site factors such as species, age, and stand density. Younger trees have a high LCR, with almost 100% of the stem eligible to be considered as a live crown and, when the stand is at its oldest and growth is slowing, the LCR reaches its minimum [14]. The increase in stand density causes lower branches to die and reduces LCR [14,15,16]. Similarly, increasing management intensity, such as bedding, chemical site preparation, pest control treatments, and micronutrient applications, tends to decrease the LCR [14].
The LCR follows an inverse sigmoidal curve, with trees having almost 100% LCR in their early years, rapidly declining as stands enter a period of height growth, and then gradually leveling off at the minimum value as stands grow older [14]. This LCR property has been modeled using several nonlinear functions such as exponential, logistic, Richards, and Weibull functions. The objective of this study was to develop an LCR model based on beta regression using tree- and stand-level variables and compare its performance with the LCR models based on commonly used functions to predict individual tree LCR for loblolly pine (Pinus taeda L.) trees.

2. Materials and Methods

2.1. Data

Data used in this study were obtained from a long-term genetic and spacing study established to evaluate their effects on the growth and yield of loblolly pine. Seedlings from eight open-pollinated families (families NC1–NC8) of loblolly pine in North Carolina, and one open pollinated “local commercial check” (LCK) from east-central Mississippi and west-central Alabama, were planted between 22 April and 7 May 1985, at two sites on the John Starr Memorial Forest in Winston County, MS. Families NC1 and NC8 are fast growing with small crowns, NC4 and NC7 are fast growing with large crowns, NC3 and NC6 are slow growing with small crowns, and NC2 and NC5 are characterized by slow growth and large crowns. The eight NC families were selected based on the 12-year-old progeny tests to represent the range of growth rates and crown dimensions [17]. The soil was an acidic, silty clay loam with fragipan, and was somewhat poorly drained [17]. The soil series was the same at both sites; however, one site was previous forest ground that was cleared and site-prepared, while the other site was an agriculture field [17].
The experimental design was a randomized complete block design with four blocks at each site. The family treatments were arranged in split–split plots, with each replication split into three spacing levels (1.5 m × 1.5 m, 2.4 m × 2.4 m, and 3.0 m × 3.0 m). A single- or double-border row was planted around each subplot, with the interior trees of each subplot covering a square area of 0.015 hectares consisting of 16, 25, and 64 individuals for 3.0 m × 3.0 m, 2.4 m × 2.4 m, and 1.5 m × 1.5 m spacings, respectively. Survival, dbh, total height, and crown class of all trees were measured at ages 5, 9, 13, 17, and 21 years, and height-to-crown base was recorded for ages 9, 13, 17, and 21 years. There were 2553, 2243, 2079, 2329, 2285, 2159, 2326, 2156, and 2200 measurement observations for NC1–NC8 and local check (LCK) family, respectively. Summary statistics of individual tree dbh, height, and crown ratio on family level are presented in Table 1.

2.2. Methods and Models

Several model forms, linear and nonlinear, are used to model crown ratios. The most commonly used functions include the exponential, logistic, Richards, and Weibull. One important consideration in modeling ratios and percentages such as LCR is to select a model form that ensures predictions are biologically meaningful. Since the LCR is bounded between zero and 1.0 (0 to 100%), the selected models should provide predictions that are confined within this range. Depending on model formulations, many functions allow predictions to fall outside the (0, 1) boundary. In this study, we used three common nonlinear functions (i.e., exponential, Richards, and Weibull) and one generalized linear model based on beta regression (Table 2). Although initially considered, the logistic function was dropped because, compared to other functions, it performed poorly for ages 9 and 21 and was similar to other nonlinear functions for ages 13 and 17. The exponential function was selected from the model used in the distance-dependent individual tree loblolly pine growth and yield model PTAEDA 4.0. Therefore, we refer to this model as PTAEDA 4.0 in this study. All statistical analyses were carried out using statistical software R 4.1.1 [18].

2.3. Beta Regression

Beta regression was introduced by [20] and is useful for modeling variables that take on values that are bounded in (0, 1) intervals. Beta regression is based on the assumption that the dependent variable is beta-distributed and that its mean is related to a set of predictors through a linear predictor and a link function and naturally incorporates features such as heteroscedasticity or skewness, commonly observed in data that take on values in (0, 1) intervals, such as rates or proportions [21]. This approach has been used to model percentage of canopy cover in conifer-dominated stands [22], riparian percentage of shrub cover [23], proportion of biomass components [24], and fire severity in forested landscapes [25].
Complete statistical details about the beta regression formulation and estimation can be found in [20]. Briefly, with the parameterization of beta distribution suggested by [20], the beta regression model can be formulated as:
g ( μ i ) = x i T β = η i
where, g ( · ) is a strictly increasing and double differentiable link function that maps (0, 1) into the real line , x i = ( x i 1 , , x i k ) T is a vector of k explanatory variables, β = ( β 1 , , β k ) T is a vector of unknown k unknown regression parameters ( k < n ) , and η i is a linear predictor (i.e., η i = β 1 x i 1 + + β k x i k ). Usually, x i 1 = 1 for all i such that the model has an intercept [20].
Beta regression was implemented in R 4.1.1 [18] with the betareg function in betareg package [21]. We used logit link function g ( μ ) = log ( μ 1 μ ) ; therefore, the predicted LCR was obtained as LCR i ^ = exp ( η i ) 1 + exp ( η i ) .

2.4. Model Evaluation and Additional Predictors

The selected models were compared with one another using mean absolute error (MAE), mean absolute percentage error (MAPE), root mean square error (RMSE), and RMSE percent, computed as follows
MAE = i = 1 n | y i y i ^ | n
MAPE = 100 n i = 1 n | y i y i ^ | y i
RMSE = i = 1 n ( y i y i ^ ) 2 n
RMSE % = RMSE y _ × 100
where y i , y i ^ , and y _ are observed, predicted, and mean live crown ratio, respectively, and n is the number of trees in the dataset.
Zhao et al. [14] reported that live crown ratio was affected by stand density and management intensity. Therefore, we first identified the best model using only tree-level variables (i.e., dbh, height, and their combinations as identified). Then, stand-level variables, namely trees per hectare (TPH) and the basal area per hectare (BAL, m2/ha) of trees larger than the subject tree in the given plot, were added to the model. The contribution of stand-level variables was assessed by comparing errors produced by enhanced models with the errors obtained from the base model.

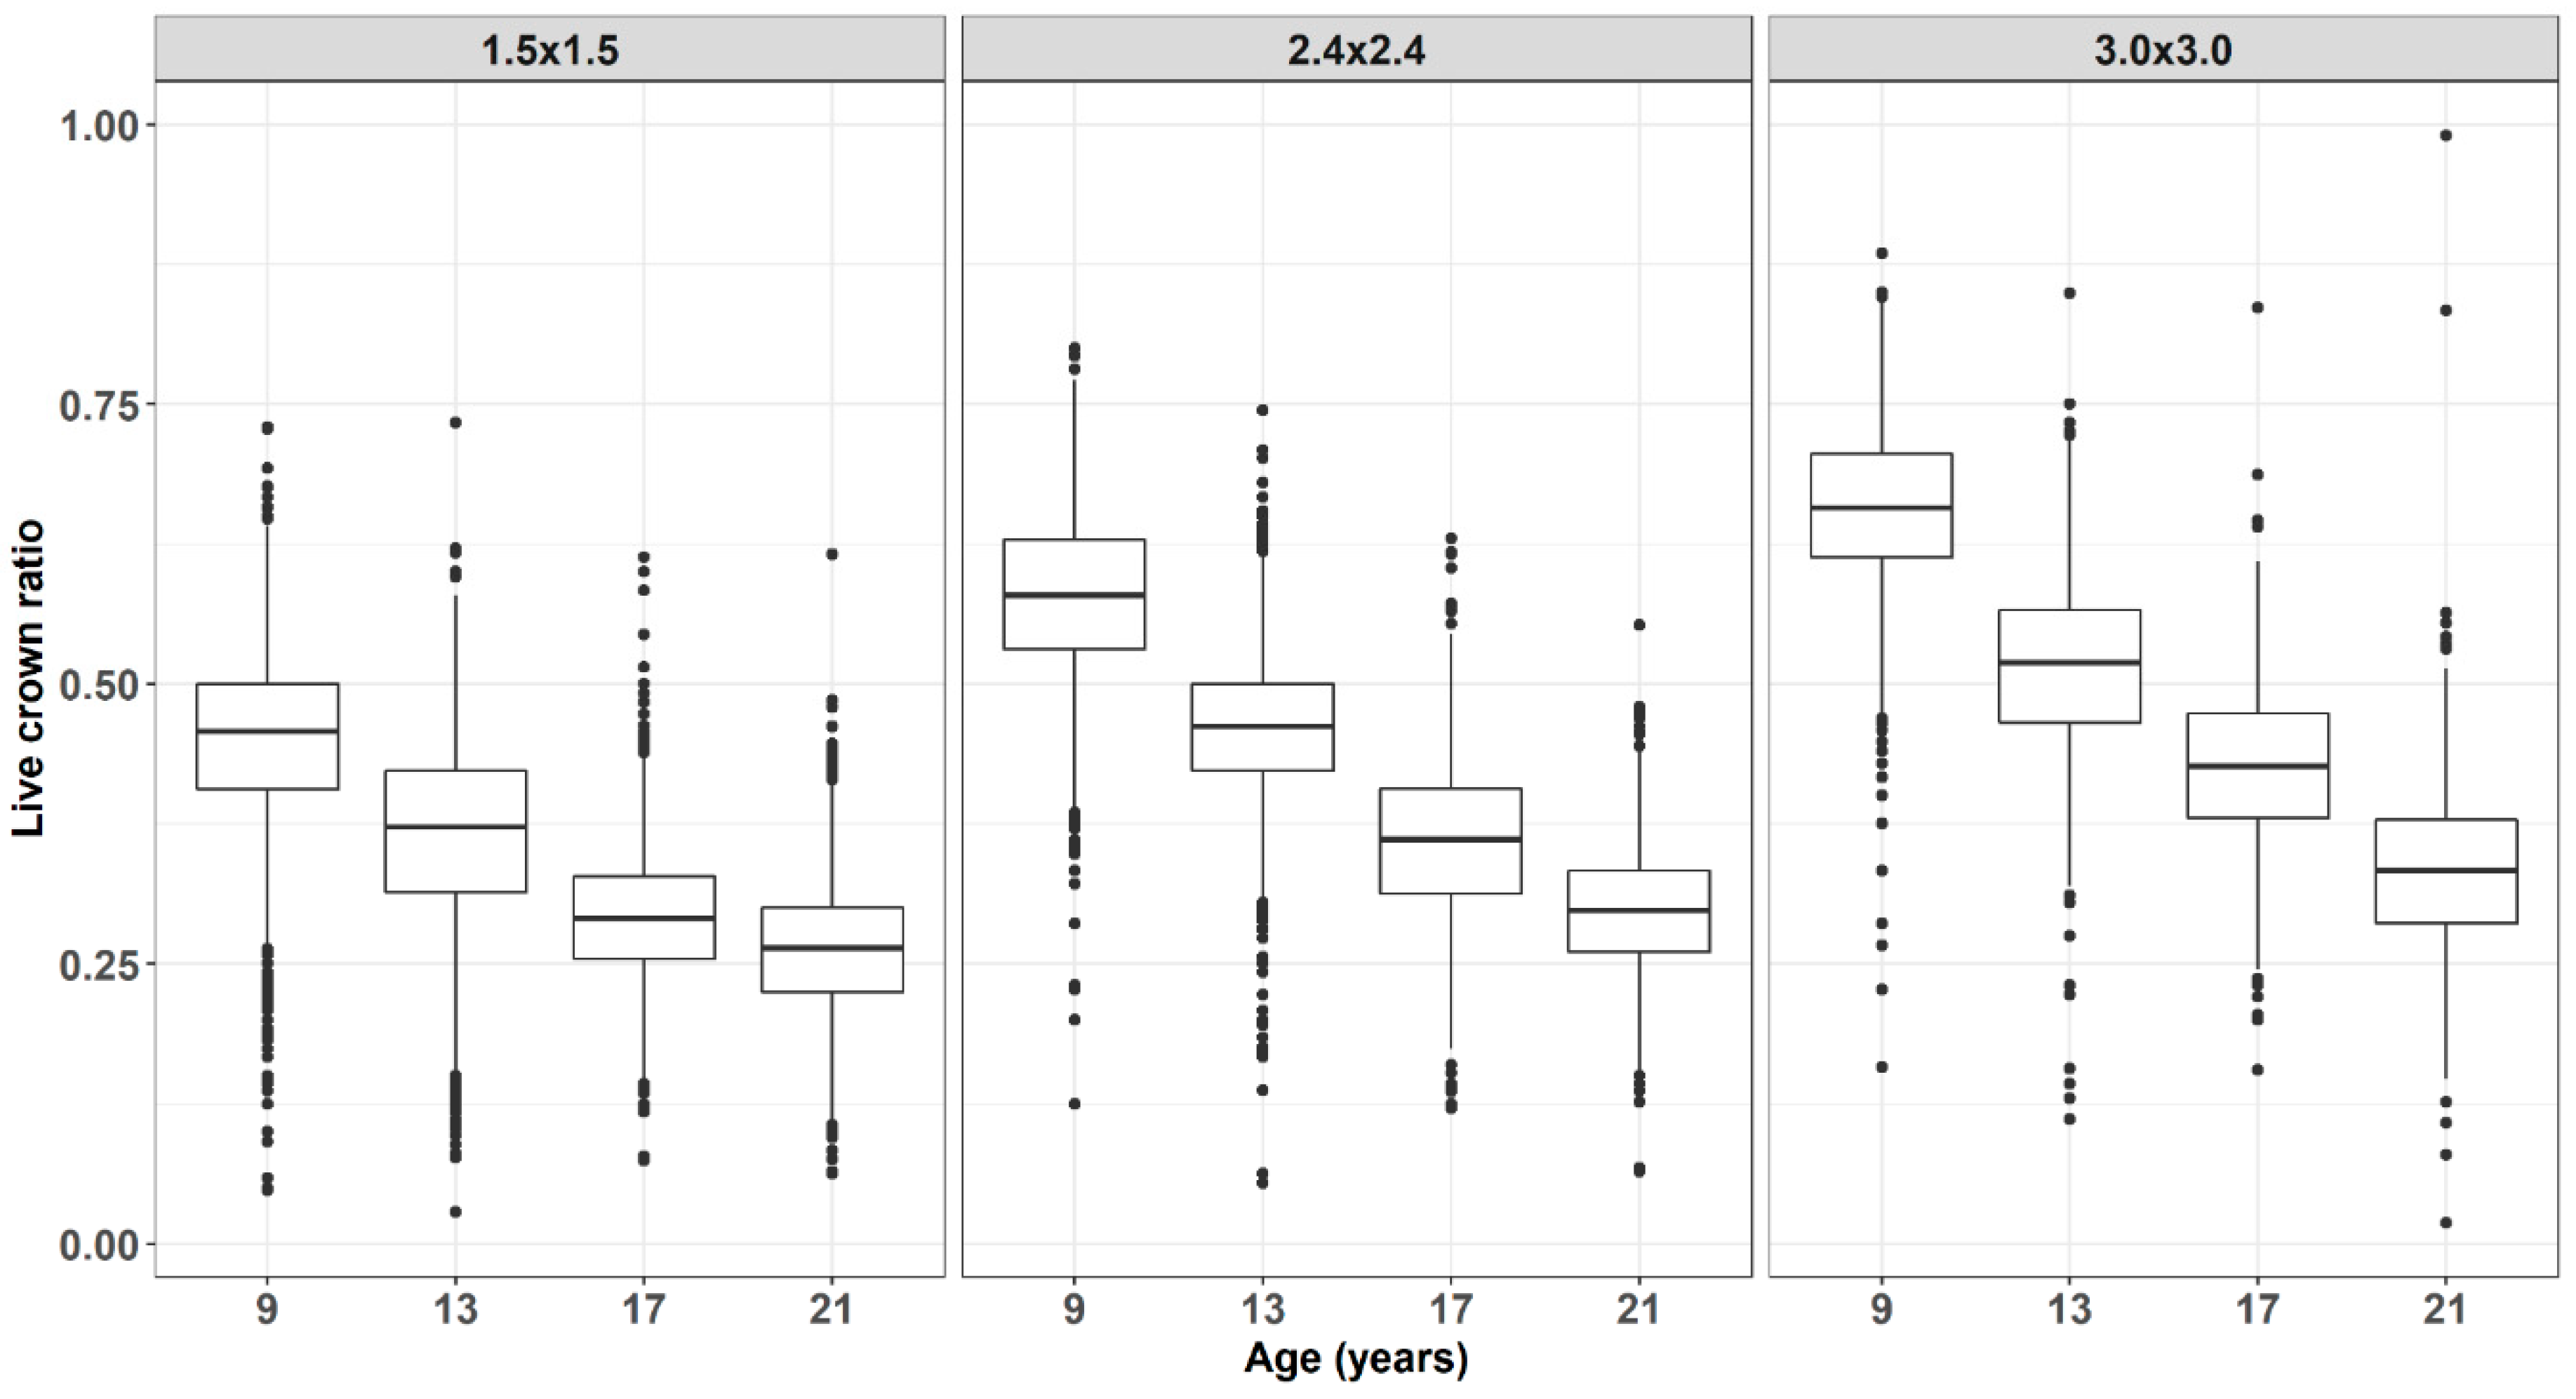
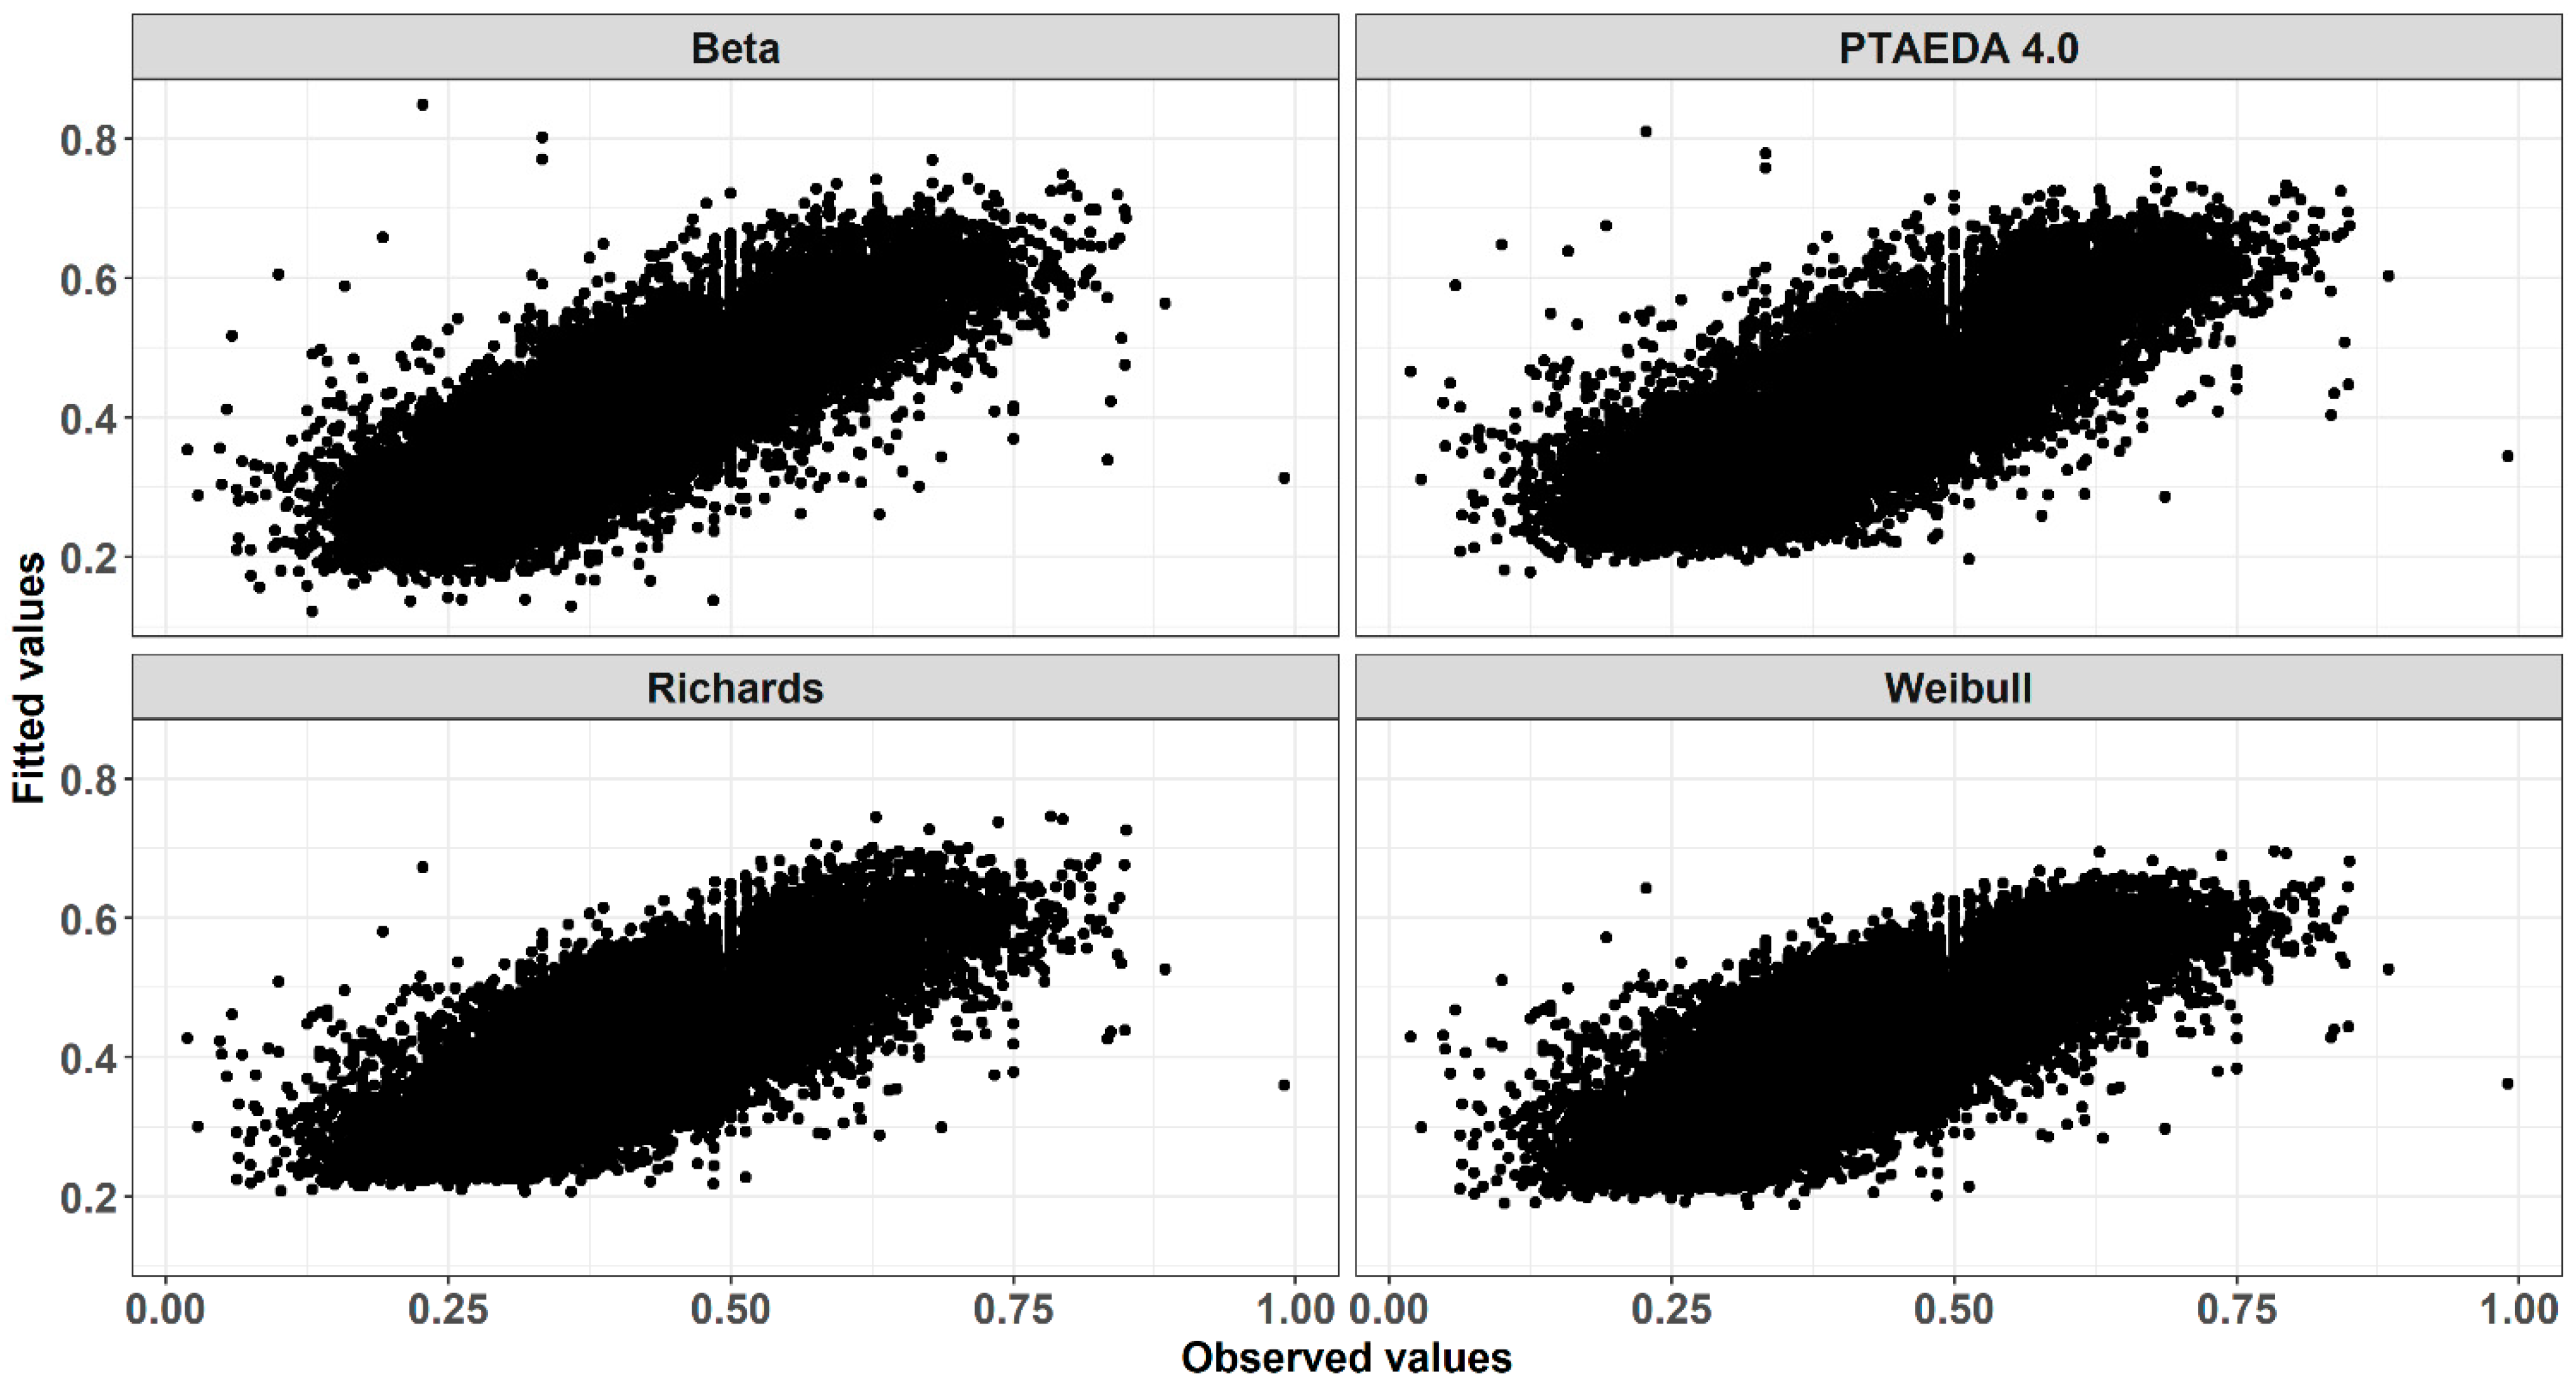
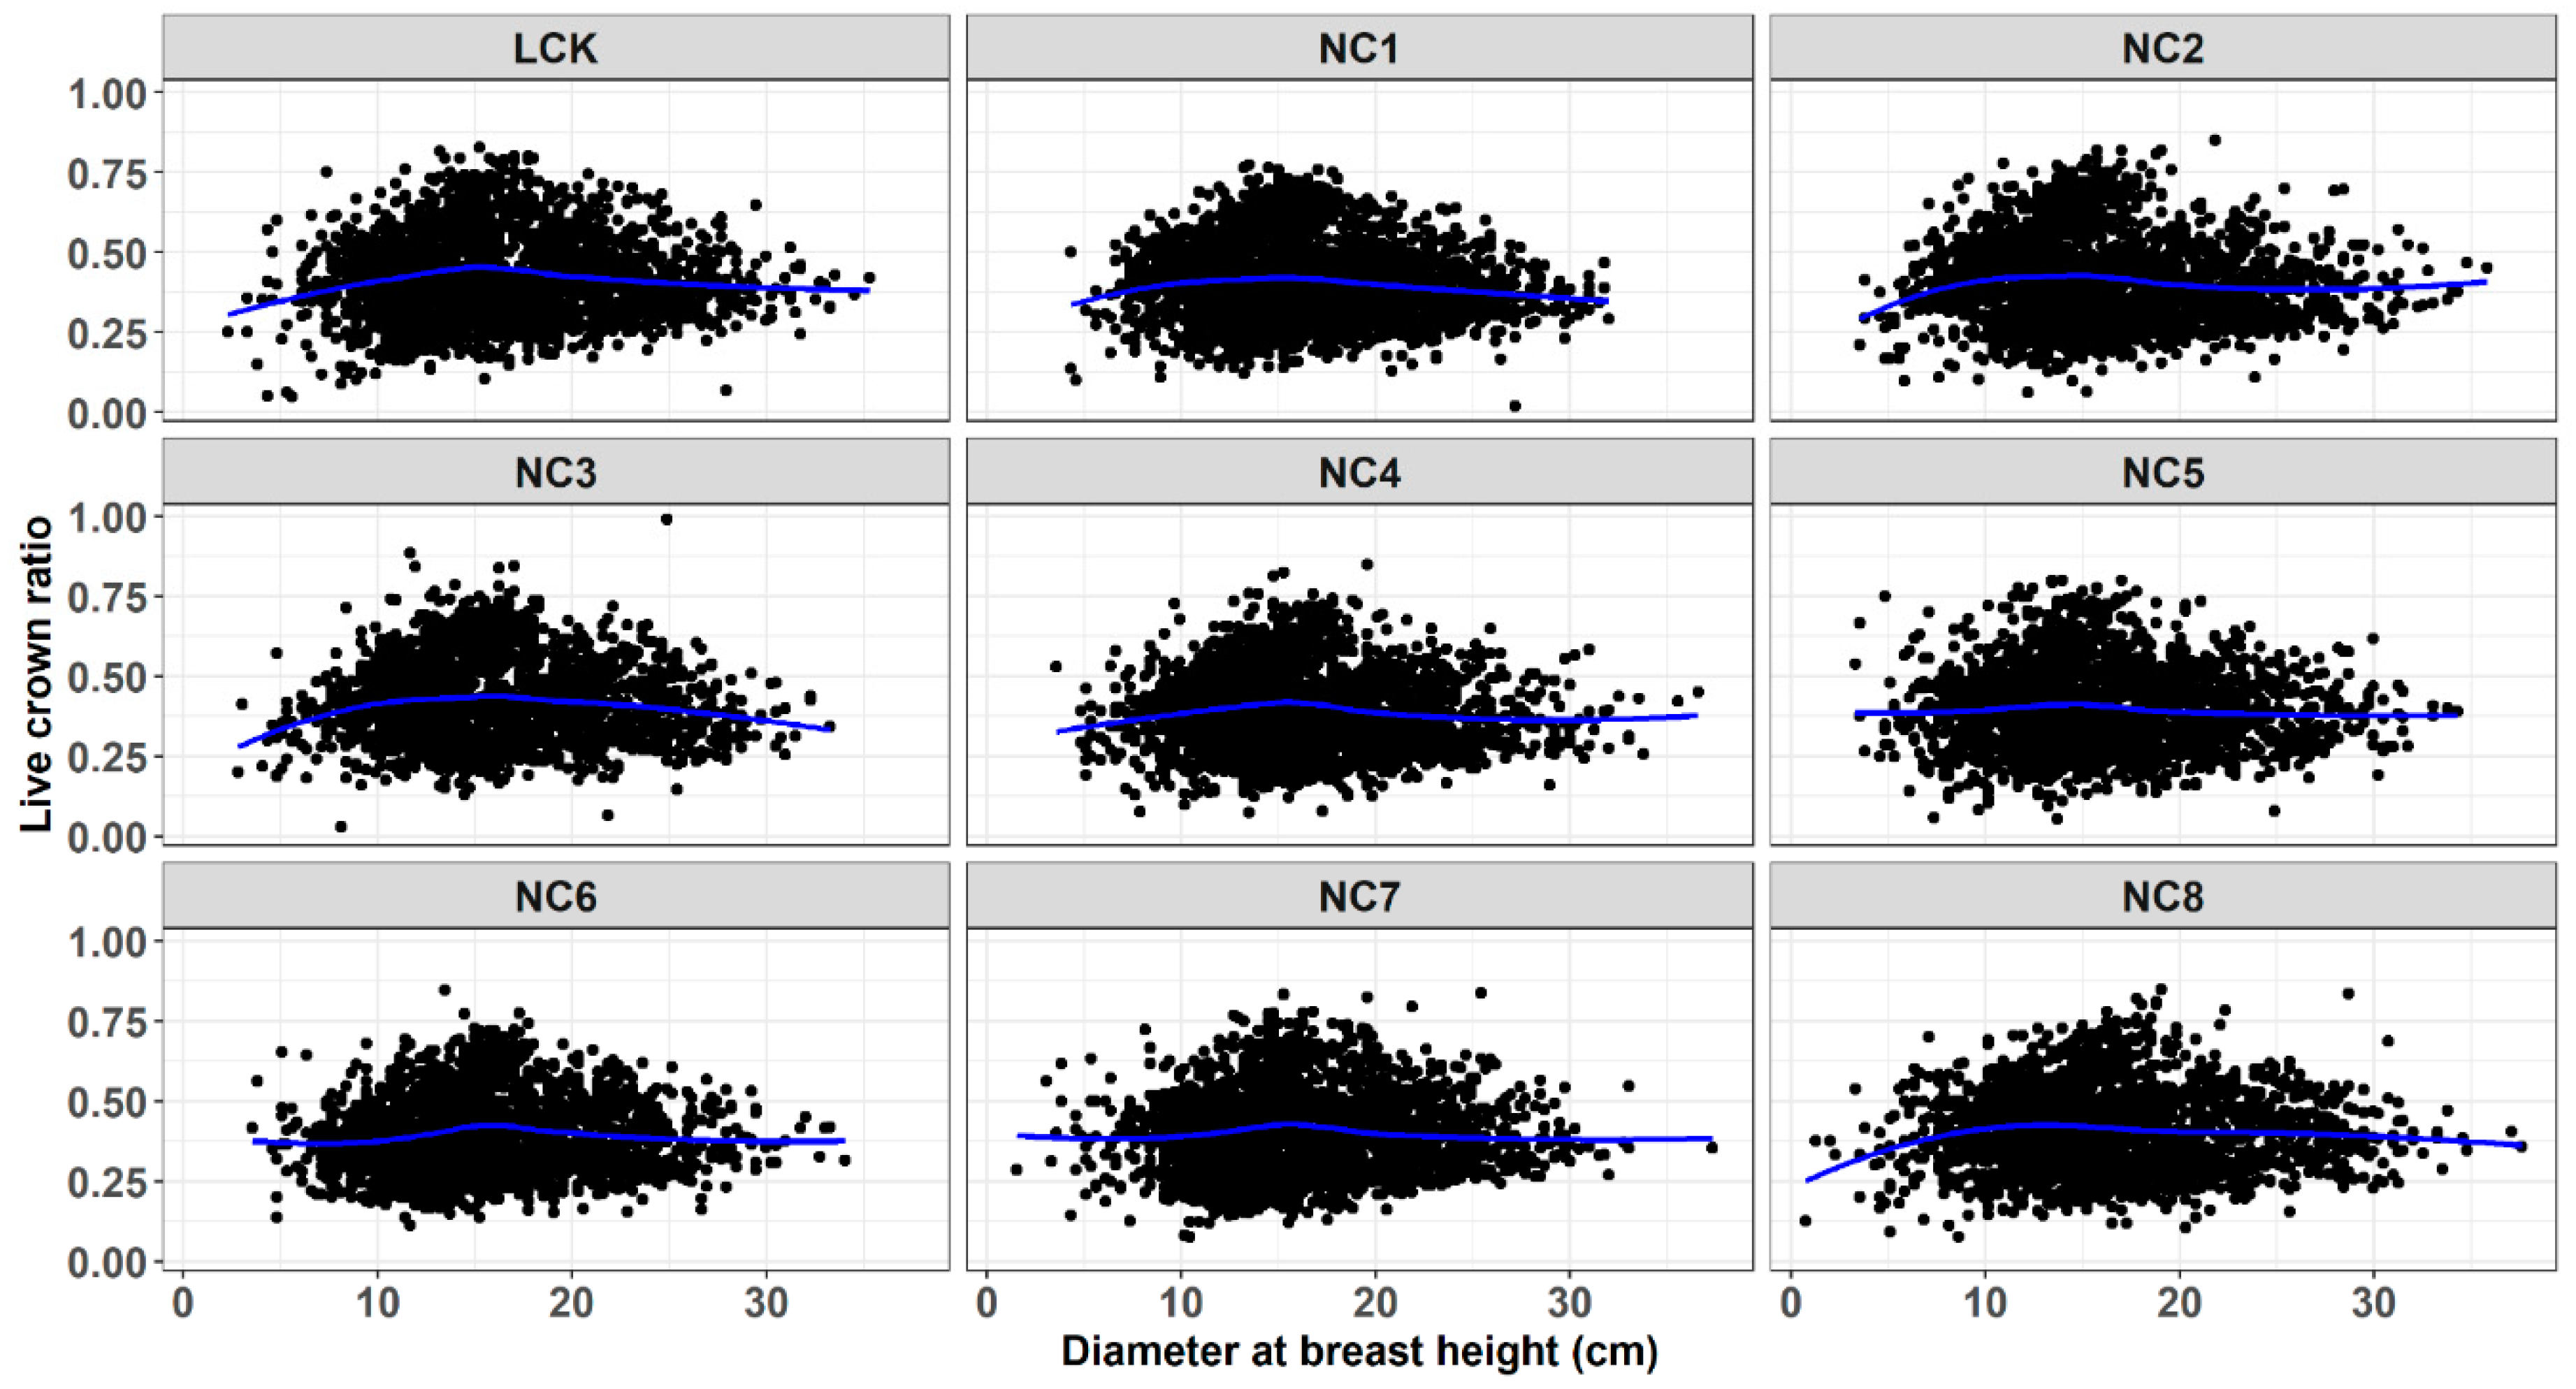
3. Results and Discussion

There were no obvious trends in the LCR and dbh relationship (Figure 1) for any family of loblolly pine trees used in this study. However, the LCR slightly increased with increasing tree heights up to a certain point (about 12 m), and then declined and remained constant (Figure 2) for all families. Although dbh and height are commonly used predictors, their regression relationship with LCR without any transformation or combination is not that obvious.
The LCR decreased with increasing age for all levels of initial plantation spacing (Figure 3). This is consistent with the findings of previous studies and is expected because, during the early stage of growth, trees retain almost all branches, which start to decline rapidly as they begin to grow in height [14]. At any given age, the LCR was higher for wider spacing. This is also expected as, the wider the spacings, the longer the crown length [26]. When these results were disaggregated, the trend was consistent across all families of loblolly pine used in this study. The average LCR at age 9 ranged from 0.45 for the narrow (1.5 × 1.5 m) spacing to 0.66 for the wide spacing (3.0 × 3.0 m), whereas the average LCR at age 21 was 0.26 for the narrow spacing and 0.34 at age 21 years. Age 9 average LCR for medium (2.4 × 2.4 m) spacing was 0.58, which was reduced to 0.30 by age 21. It should be noted that the percent decline in LCR from ages 9 to 21 was almost identical for 2.4 × 2.4 m and 3.0 × 3.0 m spacings, i.e., both spacings experienced the same reduction in percentage from the initial live crown ratio.
The coefficient of determination (R2) for the fitted models ranged from 0.65 for the exponential PTAEDA 4.0 model to 0.69 for the beta regression model (Table 3). Note that the number of parameters estimated in these models is different. The PTAEDA 4.0 model requires the estimation of only two parameters, the Weibull model has three parameters, and Richards and beta models have four parameters. However, since the number of samples used in this study is large (n = 20,330), the difference between R2 and adjusted R2 is negligible. Furthermore, the number of independent (predictor) variables required by all models is same, i.e., all models require age, dbh, and total height to predict LCR. All models had similar residual plots, with residuals forming a band around zero without any trend. The predicted values of LCR obtained from all models are plotted against measured (observed) values of loblolly pine LCR in Figure 4.
Although the error statistics produced by all models were very similar, beta regression produced the smallest error statistics compared to all other models (Table 4). Mean absolute error (MAE) for the beta regression model was 0.05, whereas all other models had an MAE value of 0.06, which could be interpreted as the predicted LCR being within 5.00% and 6.00% of the actual LCR for beta and other models, respectively.
The mean absolute percentage error (MAPE) ranged from 15.45% to 16.84% for beta and PTAEDA 4.0 models, respectively. The RMSE was 0.07 for the beta model and 0.08 for all other models. The RMSE percentage was 18.79%, 18.81%, 18.44%, and 17.58% for PTAEDA 4.0, Weibull, Richards, and beta models, respectively. Therefore, our final model for predicting the LCR of loblolly pine trees is in the form of Equation (10). However, we would like to note that the predictions from different models were not significantly different from each other (p-value = 0.753).
LCR ^ = exp ( 1.3176 0.1175 A 0.0389 D + 0.1006 H + 1.5514 ( D H ) ) 1 + exp ( 1.3176 0.1175 A 0.0389 D + 0.1006 H + 1.5514 ( D H ) )
The RMSE percent and MAPE values for all models generally increased with increasing age (Table 5). Except for age 17, the model based on beta regression produced comparatively smaller RMSEs than other models. For age 17, the PTAEDA 4.0 model had the highest RMSE percent (19.75%), and all other models had almost identical RMSE percentages: 18.32%, 18.26%, and 18.41% for Weibull, Richards, and beta models, respectively. Model performance was also identical in terms of MAPE (Table 5).
The LCR is bounded between 0 and 1. Hence, the most appropriate model for this type of data should assume an error distribution that is also within this interval. Another alternative is to fit models for predicting height to the base of a live crown (HCB) and then compute the LCR using HCB and total tree height. However, the relationship between HCB with dbh and total height may not be linear. For example, [13] found that the HCB models without transformation tended to overestimate HCB and produced heteroscedastic errors. They corrected the issue of overestimation and heteroscedasticity by using square root transformation of the dependent variable. However, any transformation of the dependent variable can result in erroneous prediction caused by the back-transformation bias.
As a tree crown is affected by competition, using stand-level variables such as stand density can further improve the predictive ability of individual tree LCR models [27]. Therefore, the basic beta regression model in Table 2 was enhanced by incorporating stand-level variables computed for each sampled plot. The additional stand-level variables used in the current study were basal area per hectare of trees larger than the subject tree (BAL) and trees per hectare (TPH). Adding BAL to the base model did not improve model performance at any age (Table 6). Adding TPH or both BAL and TPH to the base model reduced RMSE percent and MAPE at ages 9 and 13, but not ages 17 and 21 (Table 6). Liu and Burkhart [28] found a statistically significant correlation between crown height (which is algebraically related with LCR) and initial planting density for the loblolly pine trees through age 8, which is in contrast to the results obtained in the current study. This could be because the minimum age of the trees used in this study was 9 years and, potentially, the effect of the stand-level variables on crown dimensions was less evident during the later years of tree growth.
Chumra et al. [29] found statistically significant differences in crown lengths between two families of young loblolly pine trees growing on the same site in the U.S. Western Gulf. A likelihood ratio test of full versus reduced model showed statistically significant differences in crown ratio among families. Parameter estimates for the family-specific beta regression model are given in Table 7.
Family NC3, which is characterized by its slow growth and small crown, was, however, not significantly different from the local commercial check. It should be noted that crown length was measured in absolute units (e.g., m or ft.) but LCR was a relative measure. Trees with the same LCR can have different crown lengths and vice versa, depending on total tree height. Chumra et al. [29] also studied the differences in crown shape ratio, estimated as the ratio of maximum measured crown diameter to crown length. They found this ratio to be more impacted by environmental variables such as site conditions than genetic factors such as families. The final equation for predicting individual tree LCR by family is
LCR ^ = exp ( b 0 + b 1 A + b 2 D + b 3 H + b 4 ( D H ) ) 1 + exp ( b 0 + b 1 A + b 2 D + b 3 H + b 4 ( D H ) )
where b 0 b 4 are the coefficients for family in Table 7 and all other variables are described as previously.

4. Conclusions

Using data from a genetic and spacing study, we developed and evaluated the predictive performance of three nonlinear models and a generalized linear model for predicting the LCR of loblolly pine trees. The generalized linear model based on beta regression explained the most variability in LCR (i.e., had a higher R2) compared to the other models and generally produced a smaller root mean square error. The beta regression model used in this study produced slightly smaller error statistics (performed better) than the nonlinear models fit using the ordinary least-squares method, as well as the crown ratio model used in a widely used individual tree growth and yield model (PTAEDA 4.0) for loblolly pine in the southern United States. Furthermore, the assumption of error distribution in beta regression makes it more appropriate for fitting LCR models. Family effects were significantly different but family NC3, which was characterized by its slow growth and small crown, was not significantly different from the local commercial check. The basal area of larger trees did not reduce error, but the addition of trees per hectare did slightly improve model performance. Crown ratio is measured in percentage unit and should be modeled using generalized linear models that assume a beta distribution for error terms.

Author Contributions

Conceptualization, K.P.P.; Data curation, K.P.P. and S.C.A.; Formal analysis, K.P.P., S.C.A. and J.J.G.; Funding acquisition, K.P.P.; Investigation, K.P.P., S.C.A. and J.J.G.; Methodology, K.P.P.; Writing—roriginal draft, K.P.P. and S.C.A.; Writing—review & editing, K.P.P., S.C.A. and J.J.G. All authors have read and agreed to the published version of the manuscript.

Funding

This work was supported by the National Institute of Food and Agriculture, US Department of Agriculture, McIntire-Stennis project accession number MISZ-0621210 and MISZ-1019117.

Institutional Review Board Statement

Not applicable.

Informed Consent Statement

Not applicable.

Data Availability Statement

Not applicable.

Acknowledgments

The authors thank the Forest and Wildlife Research Center and the CFR/FWRC, Undergraduate Research Scholars Program, Mississippi State University. This material is a contribution of the Forest and Wildlife Research Center, Mississippi State University. This work was supported by the National Institute of Food and Agriculture, US Department of Agriculture, McIntire-Stennis project accession number MISZ-0621210 and MISZ-1019117. Any opinions, findings, conclusions, or recommendations expressed in this publication are those of the author(s) and do not necessarily reflect the view of the U.S. Department of Agriculture.

Conflicts of Interest

The authors declare no conflict of interest.

References

  1. Ritchie, M.W.; Hann, D.W. Equations for Predicting Height to Crown Base for Fourteen Tree Species in Southwest Oregon; Oregon State University, Forestry Research Laboratory: Corvallis, OR, USA, 1987; pp. 1–14. [Google Scholar]
  2. Ibrahim, E.M.; Osman, E.H. Diameter at Breast Height-Crown Width Prediction Models for Anogeissus Leiocarpus (DC.) Guill &Perr and Combretum Hartmannianum Schweinf. J. For. Prod. Ind. 2014, 3, 2325–4513. [Google Scholar]
  3. Sharma, R.P.; Vacek, Z.; Vacek, S.; Podrázský, V.; Jansa, V. Modelling individual tree height to crown base of Norway spruce (Picea abies (L.) Karst.) and European beech (Fagus sylvatica L.). PLoS ONE 2017, 12, e0186394. [Google Scholar] [CrossRef] [Green Version]
  4. Burkhart, H.E.; Amateis, R.L.; Westfall, J.A.; Daniels, R.F. PTAEDA4.0: Simulation of Individual Tree Growth, Stand Development and Economic Evaluation in Loblolly Pine Plantations; Division of Forestry and Wildlife Research, Virginia Polytechnic Institute and State University: Blacksburg, VA, USA, 2008; p. 27. [Google Scholar]
  5. Oliver, C.D.; Larson, B.C. Forest Stand Dynamics: Update Edition; John Wiley & Sons: New York, NY, USA, 1996; p. 520. [Google Scholar]
  6. Leites, L.; Robinson, A.; Crookston, N. Accuracy and equivalence testing of crown ratio models and assessment of their impact on diameter growth and basal area increment predictions of two variants of the Forest Vegetation Simulator. Can. J. For. Res. 2009, 39, 655–665. [Google Scholar] [CrossRef]
  7. Burkhart, H.E.; Tomé, M. Modeling Forest Trees and Stands; Springer Science & Business Media: Dordrecht, The Netherlands, 2012; p. 485. [Google Scholar]
  8. Patton, S.R.; Russell, M.B.; Windmuller-Campione, M.A.; Edgar, C.B. Modeled diameter growth response to intermediate treatments of planted white spruce (Picea glauca) affected by eastern spruce budworm (Choristoneura fumiferana) in Minnesota, USA. Can. J. For. Res. 2019, 49, 1633–1637. [Google Scholar] [CrossRef]
  9. Larson, P.R. Stem form development of forest trees. For. Sci. Monograph. 1963, 9, 1–42. [Google Scholar] [CrossRef]
  10. Burkhart, H.E.; Walton, S.B. Incorporating crown ratio into taper equations for loblolly pine trees. For. Sci. 1985, 31, 478–484. [Google Scholar]
  11. Leites, L.P.; Robinson, A.P. Improving taper equations of loblolly pine with crown dimensions in a mixed-effects modeling framework. For. Sci. 2004, 50, 204–212. [Google Scholar]
  12. Poudel, K.P.; Temesgen, H.; Gray, A.N. Evaluation of sampling strategies to estimate crown biomass. For. Ecosyst. 2015, 2, 1. [Google Scholar] [CrossRef] [Green Version]
  13. Li, Y.; Wang, W.; Zeng, W.; Wang, J.; Meng, J. Development of crown ratio and height to crown base models for Mason pine in southern China. Forests 2020, 11, 1216. [Google Scholar] [CrossRef]
  14. Zhao, D.; Kane, M.; Borders, B. Crown ratio and relative spacing relationships for loblolly pine plantations. Open J. For. 2012, 2, 110–115. [Google Scholar] [CrossRef]
  15. Dean, T.J. Using live-crown ratio to control wood quality: An example of quantitative silviculture. In Proceedings of the Paper presented at the Tenth Biennial Southern Silvicultural Research Conference, Shreveport, LA, USA, 16 February 1999. [Google Scholar]
  16. Akers, M.K.; Daniels, R.F.; Kane, M.; Teskey, R.O.; Zhao, D. Effects of planting density and cultural intensity on stand and crown attributes of mid-rotation loblolly pine plantations. For. Ecol. Manag. 2013, 310, 468–475. [Google Scholar] [CrossRef]
  17. Land, S.B., Jr.; Belli, K.L.; Duzan, H.W. Family, spacing, and family-by-spacing effects on loblolly pine during five years after planting. In General Technical Report SE-70, Proceedings of the Sixth Biennial Southern Silvicultural Research Conference, Memphis, TN, USA, 30 October–1 November 1990; Coleman, S.S., Neary, D.G., Eds.; U.S. Department of Agriculture, Forest Service, Southeastern Forest Experiment Station: Asheville, NC, USA, 1991. [Google Scholar]
  18. R Core Team. R: A Language and Environment for Statistical Computing; R Foundation for Statistical Computing: Vienna, Austria, 2021; Available online: https://www.R-project.org/ (accessed on 14 October 2021).
  19. Soares, P.; Tomé, M. A tree crown ratio prediction equation for eucalypt plantations. Ann. For. Sci. 2001, 58, 193–202. [Google Scholar] [CrossRef] [Green Version]
  20. Ferrari, S.; Cribari-Neto, F. Beta regression for modelling rates and proportions. J. Appl. Stat. 2004, 31, 799–815. [Google Scholar] [CrossRef]
  21. Cribari-Neto, F.; Zeileis, A. Beta regression in R. J. Stat. Softw. 2010, 34, 1–24. [Google Scholar] [CrossRef] [Green Version]
  22. Korhonen, L.; Korhonen, K.T.; Stenberg, P.; Maltamo, M.; Rautiainen, M. Local models for forest canopy cover with beta regression. Silva Fenn. 2007, 41, 671–685. [Google Scholar] [CrossRef] [Green Version]
  23. Eskelson, B.N.; Madsen, L.; Hagar, J.C.; Temesgen, H. Estimating riparian understory vegetation cover with Beta regression and copula models. For. Sci. 2011, 57, 212–221. [Google Scholar]
  24. Poudel, K.P.; Temesgen, H. Methods for estimating aboveground biomass and its components for Douglas-fir and lodgepole pine trees. Can. J. For. Res. 2016, 46, 77–87. [Google Scholar] [CrossRef] [Green Version]
  25. Hoe, M.S.; Dunn, C.J.; Temesgen, H. Multitemporal LiDAR improves estimates of fire severity in forested landscapes. Int. J. Wildl. Fire. 2018, 27, 581–594. [Google Scholar] [CrossRef]
  26. Smith, J.H.G.; Reukema, D.L. Effects of plantation and juvenile spacing on tree and stand development. In Douglas-Fir: Stand Management for the Future, Proceedings of a Symposium, 18–20 June 1985, Seattle, WA, USA; Oliver, C.D., Hanley, D.P., Johnson, J.A., Eds.; College of Forest Resources, University of Washington: Seattle, WA, USA, 1986; pp. 239–245. [Google Scholar]
  27. Fu, L.; Zhang, H.; Lu, J.; Zang, H.; Lou, M.; Wang, G. Multilevel nonlinear mixed-effect crown ratio models for individual trees of Mongolian Oak (Quercus mongolica) in Northeast China. PLoS ONE 2015, 10, e0133294. [Google Scholar] [CrossRef]
  28. Liu, J.; Burkhart, H.E. Spatial characteristics of diameter and total height in juvenile loblolly pine (Pinus taeda L.) plantations. For. Sci. 1993, 40, 774–786. [Google Scholar]
  29. Chumra, D.J.; Tjoelker, M.G.; Martin, T.A. Environmental and genetic effects on crown shape in young loblolly pine plantations. Can. J. Res. For. 2009, 39, 691–698. [Google Scholar] [CrossRef]
Figure 1. Relationship between live crown ratio (LCR) and dbh for different families of loblolly pine. There is no obvious trend in LCR-dbh relationship for any family used in this study. This trend was consistent when plotted by family and spacing.
Forests 12 01409 g001
Figure 2. Relationship between live crown ratio (LCR) and total tree height for different families of loblolly pine. LCR slightly increased with increasing height and then declined and stabilized. This trend was consistent when plotted by family and spacing.
Forests 12 01409 g002
Figure 3. Boxplot of live crown ratio by age for different levels of initial plantation spacing.
Forests 12 01409 g003
Figure 4. Fitted values for loblolly pine live crown ratio models evaluated within this study plotted against the observed values.
Forests 12 01409 g004
Table 1. Mean and standard deviation (in parenthesis) for tree-level variables by spacing and family. NC8 is fast growing with small crown, NC4 and NC7 are fast growing with large crown, NC3 and NC6 are slow growing with small crown, NC2 and NC5 are characterized by slow growth and large crown. LCK is a “local commercial check”.
Familydbh (cm)Height (m)Live Crown Ratio
1.5 × 1.52.4 × 2.43.0 × 3.01.5 × 1.52.4 × 2.43.0 × 3.01.5 × 1.52.4 × 2.43.0 × 3.0
NC113.26
(3.29)
18.45
(4.06)
21.24
(4.78)
15.09
(3.83)
16.79
(4.58)
16.81
(4.70)
0.37
(0.10)
0.44
(0.13)
0.48 (0.14)
NC213.35
(3.58)
18.19
(4.56)
21.36
(5.42)
14.82
(4.06)
16.32
(4.76)
16.28
(4.94)
0.36
(0.11)
0.44
(0.13)
0.51 (0.15)
NC313.33
(3.56)
18.44
(4.47)
20.97
(4.83)
14.48
(3.94)
15.83
(4.65)
16.08
(4.88)
0.37
(0.10)
0.46
(0.13)
0.51 (0.14)
NC413.51
(3.59)
18.27
(4.05)
21.50
(4.79)
14.86
(4.00)
16.41
(4.51)
16.74
(4.74)
0.36
(0.10)
0.41
(0.12)
0.47 (0.14)
NC513.16
(3.52)
17.94
(4.35)
20.76
(5.52)
14.58
(4.11)
15.91
(4.79)
15.96
(5.14)
0.35
(0.10)
0.43
(0.13)
0.49 (0.15)
NC613.11
(3.53)
18.17
(4.45)
20.20
(4.89)
14.16
(3.96)
15.49
(4.56)
15.27
(4.70)
0.35
(0.10)
0.43
(0.11)
0.49 (0.13)
NC713.69
(3.55)
18.89
(4.43)
20.89
(5.39)
15.23
(4.15)
16.72
(4.97)
16.23
(5.02)
0.36
(0.10)
0.44
(0.12)
0.50 (0.14)
NC813.81
(3.72)
18.67
(4.82)
21.94
(6.10)
14.98
(4.16)
16.56
(4.91)
16.29
(5.29)
0.37
(0.11)
0.44
(0.13)
0.50 (0.14)
LCK13.37
(3.86)
18.52
(4.66)
21.50
(5.18)
13.87
(3.95)
15.14
(4.60)
15.33
(4.66)
0.38
(0.11)
0.46
(0.14)
0.52 (0.14)
Table 2. Models and equations for predicting live crown ratio of loblolly pine trees used in this study.
ModelPrediction Equation
PTAEDA 4.0 LCR ^ = 1 exp ( ( b 0 b 1 A ) ( D H ) ) (1)
Richards LCR ^ = 1 [ 1 + exp ( ( b 0 + b 1 A + b 2 D + b 3 H + b 4 ( D H ) ) ) ] 1 6 (2)
Weibull LCR ^ = 1 exp ( ( b 0 + b 1 A + b 2 D + b 3 H ) 10 ) (3)
Beta LCR ^ = exp ( b 0 + b 1 A + b 2 D + b 3 H + b 4 ( D H ) ) 1 + exp ( b 0 + b 1 A + b 2 D + b 3 H + b 4 ( D H ) ) (4)
Note: LCR ^ = predicted live crown ratio; D = dbh (cm); H = total tree height (m); A = age (years). The sixth root in the denominator of Richards function and the tenth power in the Weibull functions were used based on the findings of Soares and Tomé [19] to overcome the issue of model convergence.
Table 3. Parameter estimates, standard errors, and the coefficient of determination (R2) for live crown ratio models fitted within the study. Prediction equations are provided in Table 2.
ModelParameter Estimate * (Standard Error)R2
b0b1b2b3b4
PTAEDA 4.0−0.1823 (0.0029)3.9966 (0.0364)---0.65
Richards−15.9744 (0.1858)66.4144 (0.9222)0.0728 (0.0075)0.1010 (0.0100)2.3063 (0.099)0.66
Weibull−0.7719 (0.0030)−1.403 (0.0191)−0.0048 (0.0001)0.0016 (0.0001)-0.65
Beta−1.3176 (0.0357)−0.1175 (0.0014)−0.0389 (0.0022)0.1006 (0.0028)1.5514 (0.0312)0.69
* All model coefficients were statistically significant at 0.05 level of significance.
Table 4. Evaluation statistics produced by different models for predicting crown ratio of loblolly pine. Smallest values are preferred, and the best results are given in bold.
ModelMAEMAPERMSERMSE %
PTAEDA 4.00.0616.840.0818.79
Weibull0.0616.720.0818.81
Richards0.0616.580.0818.44
Beta0.0515.450.0717.58
Table 5. Root mean square error percent and mean absolute percent error produced by four LCR models at different ages.
MethodRMSE PercentMAPE
Age 9Age 13Age 17Age 21Age 9Age 13Age 17Age 21
Beta15.7817.7018.4120.9113.5116.4515.7716.97
PTAEDA 4.016.1120.0019.7522.2614.4817.9016.5419.71
Richards15.9319.4418.2623.5114.3016.9015.1921.74
Weibull16.8518.9418.3224.1615.4316.7215.0120.98
Table 6. RMSE percent and MAPE by age by incorporating additional stand-level variables (BAL and TPH) in the beta regression model.
MethodRMSE PercentMAPE
Age 9Age 13Age 17Age 21Age 9Age 13Age 17Age 21
Base Model15.7817.718.4120.9113.5116.4515.7716.97
Base + BAL15.7817.6818.3520.9113.5216.4515.7216.97
Base + TPH14.2316.9118.0821.3312.3015.9415.6816.97
Base + BAL + TPH13.9916.7618.2621.4312.1415.7215.9816.99
Table 7. Parameter estimates and their standard errors (in parenthesis) for family-specific beta regression models for predicting live crown ratio of loblolly pine.
Familyb0b1b2b3b4
NC1−1.5167 (0.1031)−0.1252 (0.0038)−0.0619 (0.0063)0.1274 (0.0082)1.8206 (0.0927)
NC2−1.7774 (0.1138)−0.1186 (0.0045)−0.0671 (0.0069)0.1245 (0.0091)2.1049 (0.1011)
NC3−1.5013 (0.1101)−0.1059 (0.0044)−0.0487 (0.0070)0.1029 (0.0092)1.7306 (0.0959)
NC4−0.9988 (0.1094)−0.1433 (0.0042)−0.0209 (0.0068)0.1057 (0.0088)1.1797 (0.0965)
NC5−1.0764 (0.1047)−0.1174 (0.0042)−0.0234 (0.0065)0.082 (0.00840)1.3402 (0.0911)
NC6−1.4602 (0.1102)−0.0979 (0.0043)−0.0368 (0.0071)0.0926 (0.0093)1.4788 (0.0955)
NC7−1.3677 (0.1079)−0.1072 (0.0039)−0.0348 (0.0065)0.0882 (0.0082)1.5712 (0.0951)
NC8−1.1268 (0.0975)−0.1173 (0.0040)−0.0357 (0.0059)0.0923 (0.0075)1.4463 (0.0856)
LCK−1.4793 (0.1087)−0.1377 (0.0043)−0.0477 (0.0067)0.1359 (0.0090)1.6572 (0.0900)
Publisher’s Note: MDPI stays neutral with regard to jurisdictional claims in published maps and institutional affiliations.

