Article

Dynamics of Nocturnal Evapotranspiration and Its Biophysical Controls over a Desert Shrubland of Northwest China

1
School of Land Science and Space Planning, Hebei GEO University, Shijiazhuang 050031, China
2
Hebei Province Key Laboratory of Sustained Utilization and Development of Water Resources, Hebei GEO University, Shijiazhuang 050031, China
3
Yanchi Research Station, School of Soil and Water Conservation, Beijing Forestry University, Beijing 100083, China
4
Key Laboratory of State Forestry Administration on Soil and Water Conservation, Beijing Forestry University, Beijing 100083, China
5
Observation and Research Station of Ecological Restoration for Chongqing Typical Mining Areas, Ministry of Natural Resources, Chongqing Institute of Geology and Mineral Resources, Chongqing 401120, China
*
Author to whom correspondence should be addressed.
Forests 2021, 12(10), 1296; https://doi.org/10.3390/f12101296
Submission received: 11 August 2021 / Revised: 17 September 2021 / Accepted: 19 September 2021 / Published: 23 September 2021
(This article belongs to the Special Issue Forest Management, Hydrology and Biogeochemistry Modelling)

Abstract

:
Knowledge about the dynamics and biophysical controlling mechanism of nocturnal evapotranspiration (ETN) in desert-dwelling shrub ecosystem is still lacking. Using the eddy covariance measurements of latent heat flux in a dried shrubland in northwest China, we examined the dynamics of ETN and its biophysical controls at multiple timescales during growing-seasons from 2012 to 2014. The ETN was larger in the mid-growing season (usually in mid-summer) than in spring and autumn. The maximum daily ETN was 0.21, 0.17, and 0.14 mm night−1 in years 2012–2014, respectively. At the diel scale, ETN decreased from 21:00 to 5:00, then began to increase. ETN were mainly controlled by soil volumetric water content at 30 cm depth (VWC30), by vapor pressure deficit (VPD) and normalized difference vegetation index (NDVI) at leaf expanding and expanded stage, and by air temperature (Ta) and wind speed (Ws) at the leaf coloring stage. At the seasonal scale, variations of ETN were mainly driven by Ta, VPD, and VWC10. Averaged annual ETN was 4% of daytime ET. The summer drought in 2013 and the spring drought in 2014 caused the decline of daily evapotranspiration (ET). The present results demonstrated that ETN is a significant part of the water cycle and needs to be seriously considered in ET and related studies. The findings here can help with the sustainable management of water in desert ecosystems undergoing climate change.

1. Introduction

Water is lost from the land surface to the atmosphere through evapotranspiration (ET) [1]. This process interlinks the water, energy, and carbon cycles and hence influences climate, ecology, agriculture, and the economy [1,2]. An increasing number of studies have demonstrated the occurrence of nocturnal evapotranspiration (ETN), with the estimation of nocturnal transpiration (TN) from the plant, which have the nighttime stomatal opening found in many species around the world [1,3,4]. Stomata opens at night and can increase plant growth rate through increased photosynthesis in the early morning hours of the following day in one way [5,6,7], and decrease plant growth rate through exacerbated O3 concentrations in the other [7,8]. However, the global prediction is that the opening of stomata and water loss at night increases transpiration, inhibits carbon increase, and exacerbates soil hydrological drought [3,7]. More studies have shown that TN can increase the drought tolerance of a plant in drylands (semiarid and arid areas) [9]. ETN is an important part of nighttime water vapor exchange and is of more interest than nighttime transpiration from the perspective of water balance [1,10]. Therefore, it is necessary to take ETN into consideration in the global surface and vegetation model [7]. However, the regulation mechanism of ETN is not fully understood, especially in dry areas [3,7].
Arid and semiarid ecosystems occupy approximately 40% of the earth’s terrestrial surface, which continues to expand globally [11,12]. Water shortage limits vegetation growth in this area [13]. This is especially crucial for desert ecosystems, which are predicted to become warmer and have more droughts [13]. It has been reported that the nighttime temperature has increased more than daytime temperature in the northern latitudes [13,14,15]. The increase in nighttime temperature may increase nighttime transpiration and thus lead to the change in ETN. In order to assess and predict the feedback of how desert ecosystems respond to climate change, further understanding of the dynamics and biophysical controls of ETN is needed [7].
Quantification and analysis of the dynamics of ETN is very important for understanding plant adaptability to dry environments. Previous studies have reported a ratio of 6.3% of nocturnal water loss to the total ET by eddy covariance measurements (EC) and lysimeters, and 7.9% by climate models [1]. Other studies have reported that the annual amount of ETN in daytime ET accounts for 3.5~9.5% in grass fields [16], 1% in Pinus ponderosa forest [17], and 12~23% in row crops [18]. However, knowledge about the amount and dynamics of ETN in desert shrubland remains lacking.
ETN is influenced by a variety of biophysical factors, e.g., vapor pressure deficit (VPD), air temperature (Ta), soil volumetric water content (VWC), and wind speed (Ws), which have aroused wide concern [7,19,20]. As for biotic factors, stomatal conductance (gs) and the normalized difference vegetation index (NDVI) were the two most important factors for driving ETN. However, the relationship between ETN and biophysical variables may vary among ecosystems due to the differences in the plant functional type [13]. Previous studies have reported a large difference in correlations between ETN and biophysical factors among different ecosystems in similar geographic areas [13]. For example, Novick et al. [21] have reported that ETN was strongly and near linearly related to Ws in the old fields and pine plantations, but had no significant correlation in the hardwood forest. The influences of these biophysical variables on ETN vary with temporal scales. At a small timescale (e.g., diurnally), VPD and temperature exerted the largest role in controlling transpiration [12]. At a larger timescale (e.g., seasonally), however, soil water and leaf phenology are more important [12,13]. Therefore, an investigation of the dynamics of ETN in relation to changing biophysical variables at muti-time scales in different ecosystems is critical for figuring out plant water-consumption and water balance [13].
The Mu Us Desert is one of the main sandy deserts of China [13]. The study area lies in the south edge of the Mu Us Desert, which is an ecotone between arid and semi-arid climates in northern China [22] and is vulnerable to anthropogenic disturbances and land-use changes [22]. Shrubland dominates this area by large and is an important ecosystem [12]. Guo et al. (2016) have reported the dynamics of dewfall (at diel and seasonal scales) and its abiotic controls in this desert shrubland, located in the southern Mu Us desert, using eddy covariance method (EC) [23]. Dewfall was 21.3 mm during the growing season and was equivalent to 8.9% of evapotranspiration. Hayat et al. [13] reported the biophysical controls on nighttime sap flow in Salix psammophila. However, so far, the dynamics and biophysical controls of ETN in this ecosystem have not been elucidated. Here, we focus on the dynamics of ETN and how biophysical factors control ETN. We hypothesized that ETN might be greater for a desert ecosystem and varies significantly during the season. The objectives were: (1) To examine the occurrence and magnitude of ETN at diurnal and seasonal scales; (2) To understand the mechanism controlling ETN; (3) To estimate the contribution of ETN to ET and the effects of droughts on ETN.

2. Materials and Methods

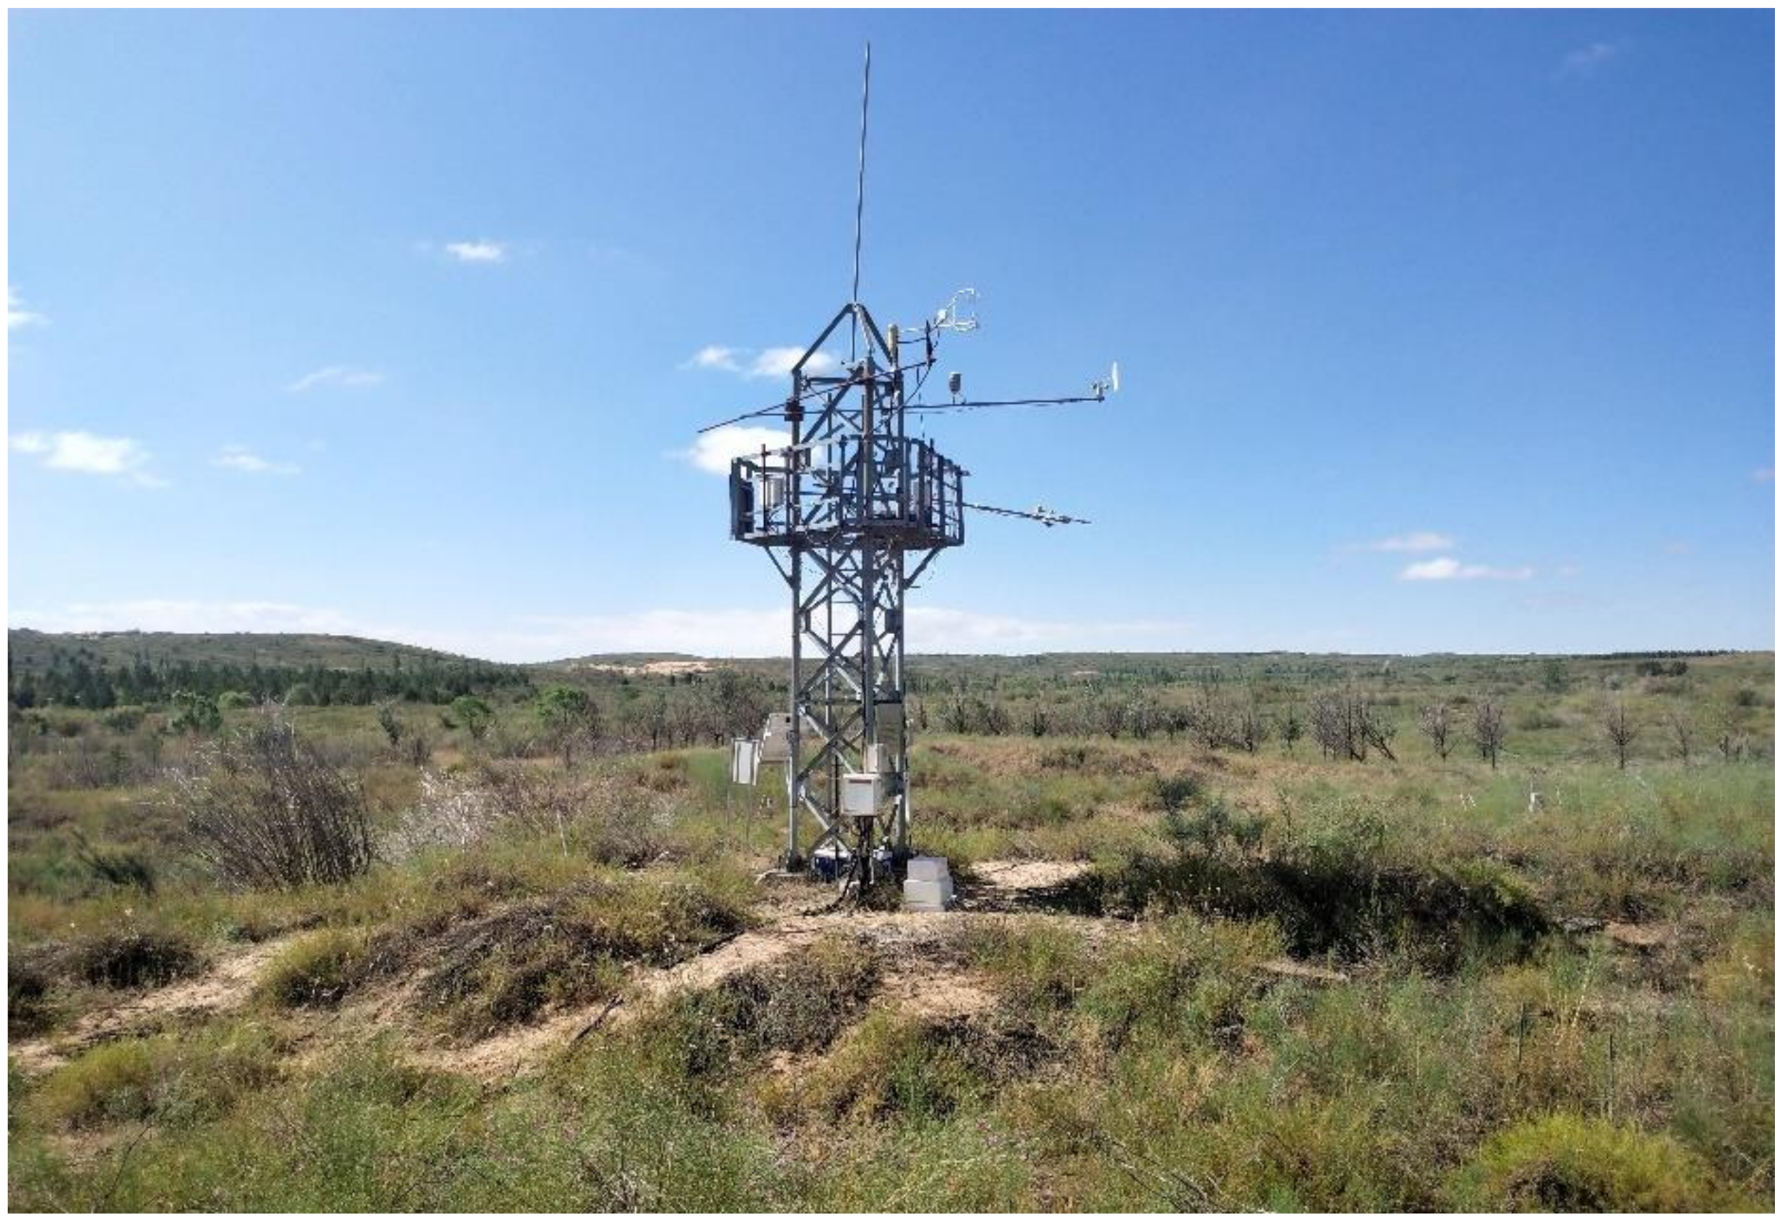
2.1. Site Description

ETN was observed at the Yanchi Research Station (37°42′31″ N, 107°13′45″ E, 1530 m a.s.l.) of Beijing Forestry University (Figure 1), Ningxia Province, northwest China [24]. The site is located at the southern edge of the Mu Us Desert and is characterized by a semiarid continental monsoon climate. The mean annual air temperature (1954–2014) is 8.24 °C and the frost-free season lasts for 165 days on average [23,24,25]. The mean annual pan-evaporation is 2024 mm, which is much higher than the precipitation (287 mm) [22]. In addition, precipitation shows large seasonal (80% falling during June–September) and inter-annual variation (145–587 mm for the period 1954–2004) [22]. The percentages of sand, silt, and clay were 90%, 6%, and 4%, respectively. The bulk density was 1.54 ± 0.08 g cm−3, a total porosity of 35.70 ± 3.83%, a field capacity of 31.27 ± 5.13% (cm3 cm−3 × 100%), and a permanent wilting point of 5.61 ± 0.60% (cm3 cm−3 × 100%) (mean ± standard deviation, n = 16) in the upper 10 cm [26]. Soil organic matter, soil nitrogen, and pH were reported to be in the ranges of 0.21–2.14 g kg−1, 0.08–2.10 g kg−1, and 7.76–9.08, respectively [27]. The site is a mixture of deciduous shrub species, with the total vegetation coverage being ~92%, with Artemisia ordosica Krasch. accounting for ~35%, Hedysarum mongolicum Turez. for ~30%, Salix psammophila C. for ~20%, and scattered distributions of grass species accounting for ~15%, and the biocrusts for ~45%, underlying vegetation and between vegetation [22,28]. The perennials include Glycyrrhiza Linn., Cynanchum mongolicum (Maximowicz) Hemsley, Sophora alopecuroides L., and Leymus secalinus (Georgi) Tzvel.; the annuals include Setaria viridis (L.) Beauv., Salsola collina Pall., Corispermum puberulum Iljin, and Agriophyllum squarrosum (L.) Moq. The relative fractions of perennials and annuals were 60% and 26%, respectively [29]. The cover of algae, lichen, and moss were 25%, 20%, and 4%, respectively. The canopy height was about 1–1.5 m tall [19,30].

2.2. Flux and Biophysical Measurements

Eddy covariance (EC) method was used to obtain the sensible heat flux (H, W m−2) and latent heat flux (LE, W m−2). A 3-D ultrasonic anemometer (CSAT3, Campbell Scientific Inc., Logan, UT, USA) and a fast response infrared gas analyzer (LI-7200, LI-COR Inc., Logan, UT, USA) [23] were made up of the EC instruments, which were mounted at a height of 6.2 m and oriented in the prevailing wind direction (northwest). Next, 10 Hz of data was stored by a data logger (LI-7550, LI-COR Inc., Lincoln, NE, USA). The topography of the study site was homogeneous over 250 m in all directions from the flux tower [23]. Footprint analysis showed that >90% of the fluxes originated from within 200 m of the tower [31].
Incident and reflected photosynthetically active radiation (PAR, µmol m−2 s−1) was measured using a quantum sensor (PAR-LITE, Kipp and Zonen, the Netherlands) [22,32]. Net radiation (Rn, W m−2) was measured using a four-component radiometer (CNR-4, Kipp and Zonen, Delft, the Netherlands) [33]. Air temperature (Ta, °C) and relative humidity (RH, %) were measured with a thermohydrometer (HMP 155A, Vaisala, Finland). Wind speed and direction were measured with a wind speed and direction sensor (034B, Met One Instruments Inc., Grants Pass, OR, USA). Surface temperature (Ts, °C) was measured with an infrared radiometer (SI-111, Campbell Scientific, Inc., Logan, UT, USA). All these meteorological sensors were installed at 6 m above the ground on the EC tower. Soil temperature at 10 cm depth (Ts_10, °C) and soil volumetric water content at 10, 30, 70 cm depth (VWC10, VWC30, VWC70, m3 m−3) were monitored 10 m adjacent to the tower with three replicate sensors (ECH2O-5TE, Decagon Devices, Pullman, WA, USA) [34]. Five soil heat plates (HFP01, Hukseflux Thermal sensors, Delft, the Netherlands) were used to measure soil heat flux G (W m−2) as the sum of the fluxes at 10 cm depth. The soil heat plates were placed at a distance of 5 m from the flux tower. Precipitation (P) measurements started from 15 May 2012 [23]. All micrometeorological variables were recorded every 30 min by data loggers (CR200X for PPT, CR3000 for all others, Campbell Scientific Inc., Logan, UT, USA). The tower-based normalized difference vegetation index (NDVI) was obtained with PAR (incident and reflected) and global solar radiation measurements [22,28].
The rate of nocturnal evapotranspiration (ETN) was obtained directly from the EC measurements of LE at night [23]. Daytime and nighttime were distinguished by PAR at the threshold of 5 µmol·m−2 s−1. The mean duration of nighttime was 9 h and 10 min in May, 8 h and 40 min in June, 8 h and 55 min in July, 9 h and 44 min in August, 10 h and 50 min in September, and 11 h and 50 min in October. ETN was determined to occur during periods when nighttime LE was positive. The ETN rate E (mm period−1) was then estimated as Equation (1), where L is the latent heat of vaporization (2450 J kg−1).
E = L E / L

2.3. Data Processing

The flux data were screened and checked for quality based on the key criteria consisting of atmospheric stability, instrument quality flags, and turbulent mixing [35,36,37]. The 4%, 10%, and 5% missing records of flux data in 2012, 2013, and 2014, respectively, resulted from instrument failure and maintenance [19,37]. The friction velocity (u*) threshold, below which flux losses occur, was determined as outlined in [37,38]. The u* threshold differed across years, with 0.18, 0.22, and 0.25 m s−1 from 2012 to 2014, respectively [37,39]. Consequently, 12%, 15%, and 14% of daytime data and 45%, 42%, and 46% of nighttime data need to be gap-filled in order to estimate the amount of ETN for the three years over 2012 to 2014, respectively [22].
Inaccurate half-hourly fluxes caused by bad weather or instrument failure were excluded. Gaps of less than 2 h in all variables were filled by linear interpolation [23]. Longer gaps in LE were filled with the Penman–Monteith equation (Equation (2)). Mean variation method (MDV) was used to fill the longer gaps in meteorological variables [40]. The energy balance ratio (EBR) method showed that the nighttime EC measurements exhibited an acceptable energy-closure fraction of 0.67, 0.67, and 0.62 from 2012–2014, which falls in the range of 0.55–0.99 reported for FLUXNET [41]. We only used an energy-closure adjustment to the measurements of ETN when the Penman–Monteith equation was used for the evaluation of the ETN.

2.4. Calculation of Bulk Parameters

2.4.1. Penman–Monteith Equation

The Penman–Monteith equation estimate of LE was computed as Equation (2) [42]. In Equations (2)–(5),   Δ (kPa K−1) is the slope the saturation vapor pressure versus air temperature curve (Equation (2)) and can be calculated by Equation (5). γ is the psychrometric constant (0.055 k Pa °C−1), Cn and Cd are reference parameters which vary by plant type. Cn was set to 66 for both the daytime and nighttime period, and Cd was set to 0.25 during the day and 1.7 at night in our study. e s 0 (kPa) is the saturated vapor pressure at surface temperature and e a (kPa) is the ambient vapor pressure at the reference height of 6 m above the ground; they can be calculated with Equations (3) and (4) [43]. α   is 0.611 kPa, b is 17.502 (dimensionless), and c = 240.97 K in Equation (5).
L E = 0.408 Δ ( R n G ) + γ C n T S + 273 W s ( e s 0 e a ) Δ + γ ( 1 + C d W S )
e s 0 = a exp ( b T s T s + c )
e a = R H a e x p ( b T a T a + c )
Δ = b c e s 0 ( c + T s ) 2

2.4.2. Calculations of Extractable Water Content

We used the relative extractable water content (REW) to distinguish the drought period [44]. Daily REW was calculated as [44]:
R E W = V W C V W C min V W C max V W C min
VWCmin and VWCmax are the minimum and maximum daily mean soil volumetric water content at 30 cm below the ground during the period of Ts > 0 °C, respectively, during the study period for 2012–2014 [37]. We define REW < 0.2 for short (less than one month) or long (more than one month) droughts at our study site [38].

2.5. Growing Season, Phenological Phase and Data Analysis

Daily mean gross ecosystem photosynthesis (GEP) timeseries were used to determine the growing season length (GSL) [45]. The GSLs were the following days of year (DOY): 97–292, 94–287, 102–291 for 2012–2014, respectively. Seasons were defined as spring from March to May, summer from June to August, autumn from September to November, and winter from December to February [37]. Phenological phase was determined on the phenological observation, which was defined by three stages: leaf expanding stage, leaf expanded stage, and leaf coloring stage [12].
Linear regression methods were used to examine the relationships between ETN and selected biophysical variables (i.e., Ta, VWC, VPD, Ws, NDVI) at various timescales. Stepwise regression method was used to examine the dominant biophysical factors in controlling ETN at phenological and seasonal scales. Daily ETN was bin-averaged by 2 °C intervals of Ta as a function of Ta under different VWC30 by linear regression during the growing seasons. All data processing procedures were performed in MATLAB (ve. R2014b, Mathworks Inc., Portola Valley, CA, USA), and statistical analyses were conducted with the SPSS (version 20.0, Chicago, IL, USA).

3. Results

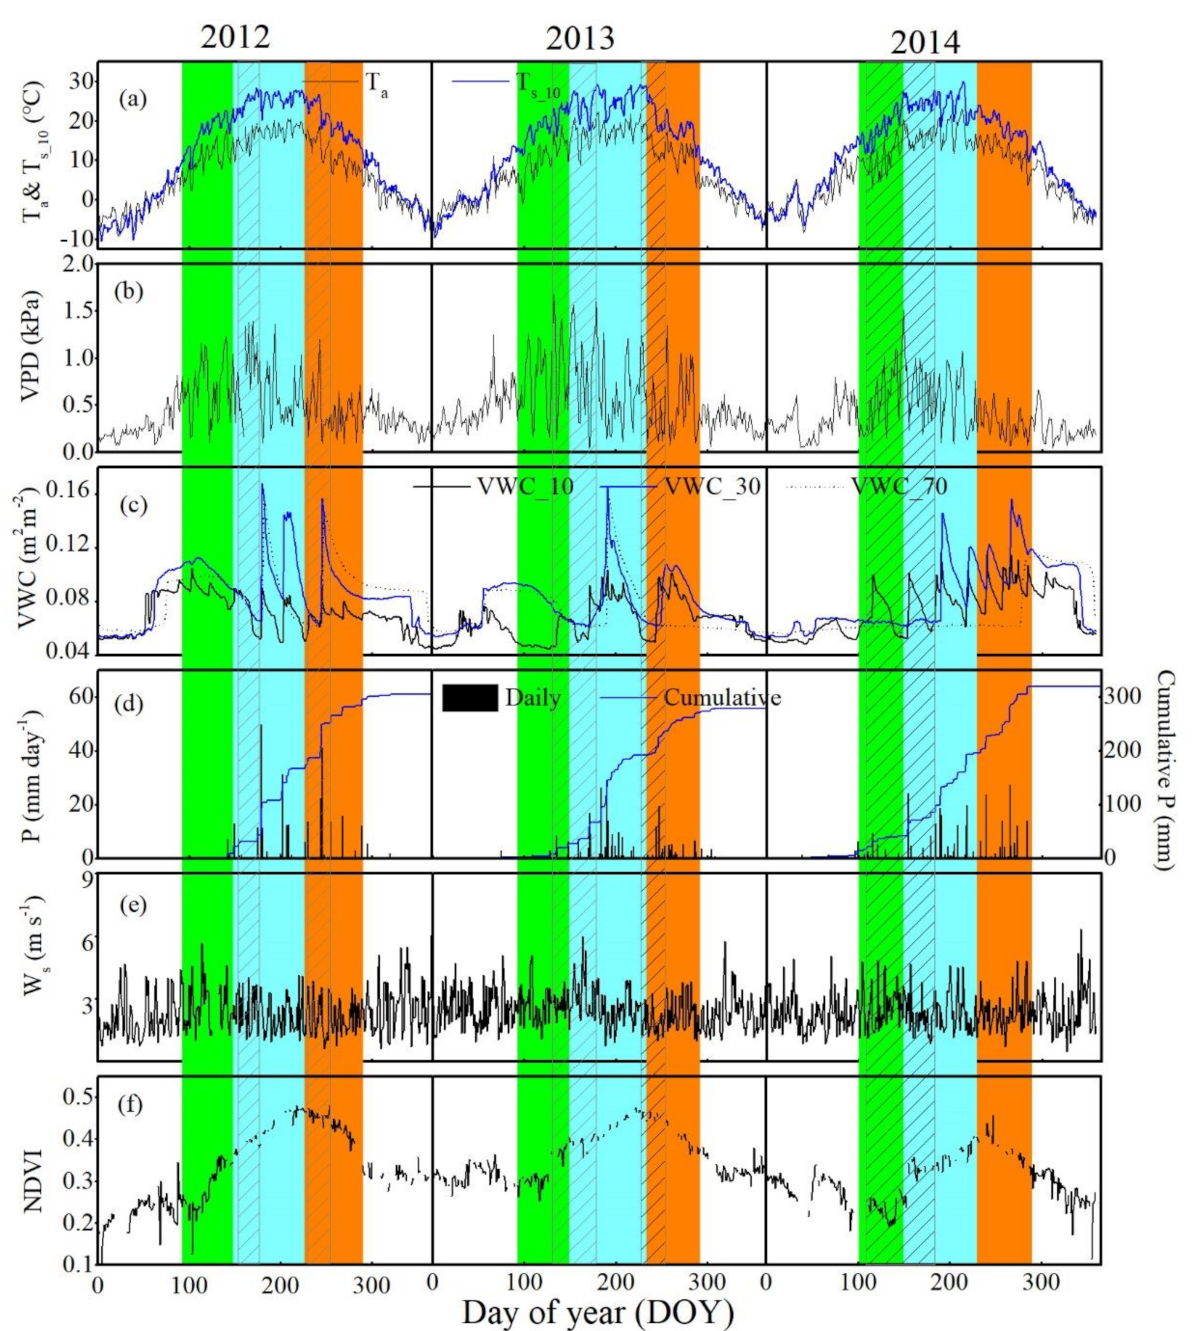
3.1. Biophysical Factors

During the observation period, the study site had significant interannual variation in mean nightly Ta, Ts_10, VPD, Ws, soil volumetric water content (VWC10, VWC30, and VWC_70), daily sum of precipitation (P), and daily mean NDVI (Figure 2). Eighty percent of rainfall occurred between June and September. Winter and spring were mostly without rain (Figure 2d). Daily P and VWC showed contrasting seasonal patterns during the three years (Figure 2c,d). Annual rainfall was highest in 2014 and lowest in 2013 (Table 1). It seems that VWC10 was more affected by rainfall events which were less than 20 mm day−1 and VWC30 responded mainly to rainfall events larger than 20 mm day−1 (Figure 2c,d). VWC70 was enhanced only by four heavy rainfall events (>30 mm day−1) over the observation period (Figure 2c,d). The total amount of rainfall in 2013 (278 mm) was lower than the mean annual rainfall (287 mm) (1955–2014). Little rainfall in the summer of 2013 lead to the low VWC10 in the autumn and winter of 2013 and in the early spring of 2014. According to the REW, the droughts events were 12 days in June and 15 days in August in 2012, 48 days from May to June, 30 days in August in 2013, and 90 days from April to July in 2014. REW showed two summer droughts of 27 and 78 days in 2012 and 2013, respectively, and a severe spring drought of 90 days (during the leaf expanding period) was observed in 2014.
The seasonal changes of nightly Ta, Ts_10, and VPD showed similar patterns for the three years (Figure 2a,b, Table 1). Nightly mean Ta ranged from about −9.19 °C in cold winter to 23 °C in summer. Nightly mean Ts_10 had a wider range than Ta, which was from −10.4 °C in winter to 30.0 °C in summer. Nightly mean VPD was slightly lower in 2012 than in 2013 and 2014. Annual mean of nightly Ta, Ts_10, and VPD were lowest in 2012 and highest in 2013 [22] (Table 1). Annual nighttime mean Ws was about 3 m s−1 during the study period (Table 1). Tower-based NDVI showed clear seasonal cycles. The maximum NDVI was the same in 2012 and 2013 (both were 0.47), which were higher than that in 2014 (0.37). Annual mean NDVI was higher in 2012 (0.33) and 2013 (0.35) than in 2014 (0.30). Besides, NDVI in spring peaked 20 days earlier in 2012 and 2013 than in 2014.

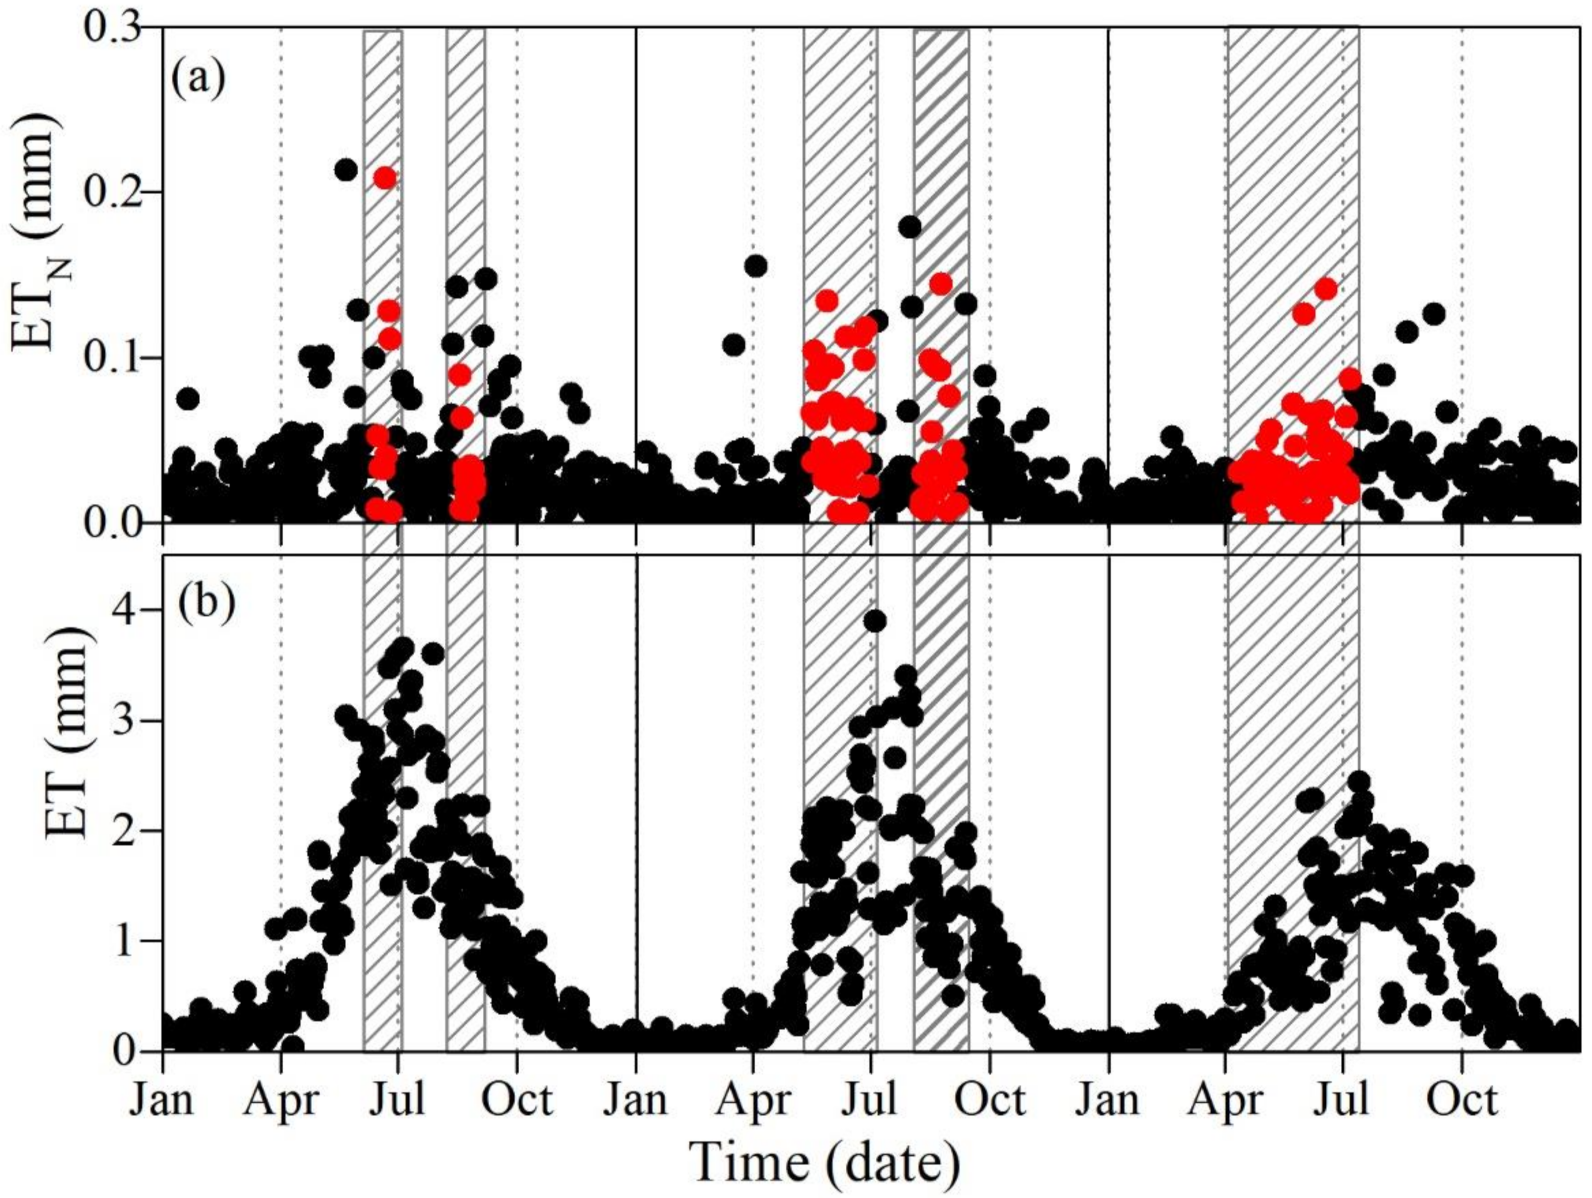
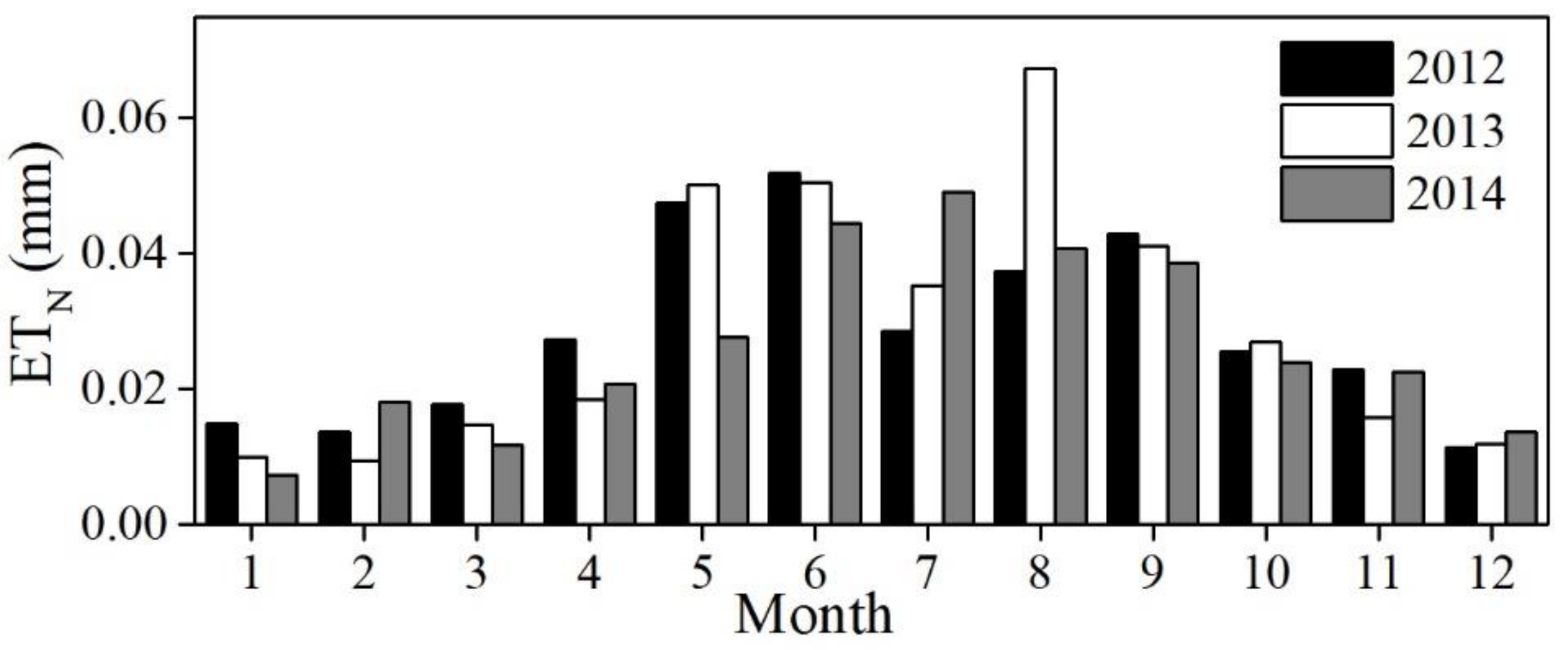
3.2. Diurnal, Seasonal and Interannual Variations in ETN

We calculated the monthly mean variation in ETN during 21:00–6:00 from May to September. Although the trend of the monthly mean diurnal ETN showed no statistical significance, it did show a decreasing trend before 5:00, and then began to increase from May to August, and showed an increasing trend in September (Figure 3). ETN in June and July had high evapotranspiration during night. ETN showed similar seasonal patterns among the three years (Figure 4). Daily ETN was mostly zero in winter, increased to a relatively high value during the growing season, and peaked during the mid-growing season (June to August) (Figure 4). Annual total amount of ETN was largest in 2013 and lowest in 2012. The maximum daily ETN was 0.21, 0.17, and 0.14 mm night−1 over 2012 to 2014, respectively. Monthly daily mean ETN peaked in June of 2012, August of 2013, and July of 2014 (Figure 5). Daily ET during the study period showed a similar seasonal pattern with ETN, which peaked in July and with a maximum daily ET of 3.60 mm occurred on 28 July in 2012, 3.90 mm on 5 July in 2013, 2.43 mm and on 14 July in 2014. The total annual amount was highest in 2012 (331 mm), which was much higher than the ETN in 2013 (260 mm) and 2014 (230 mm).

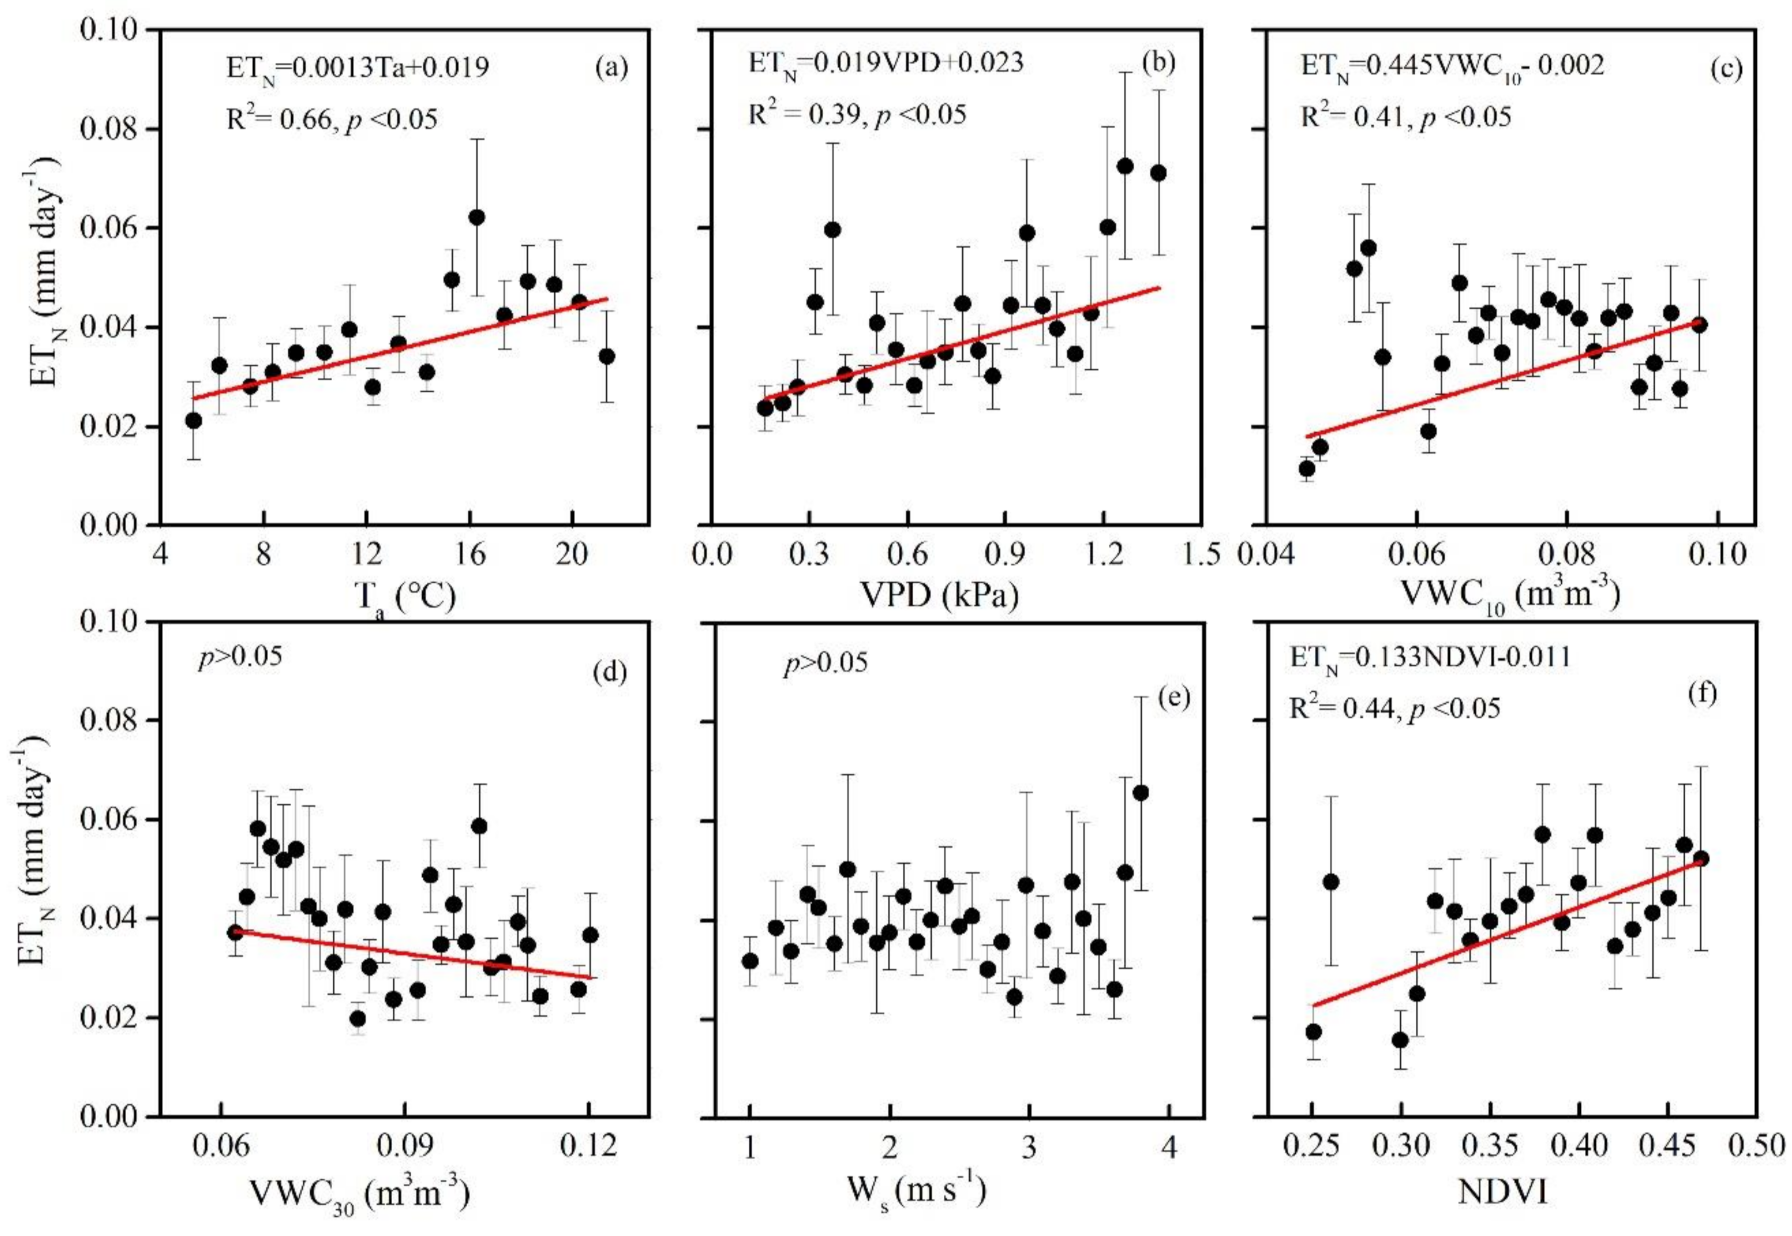
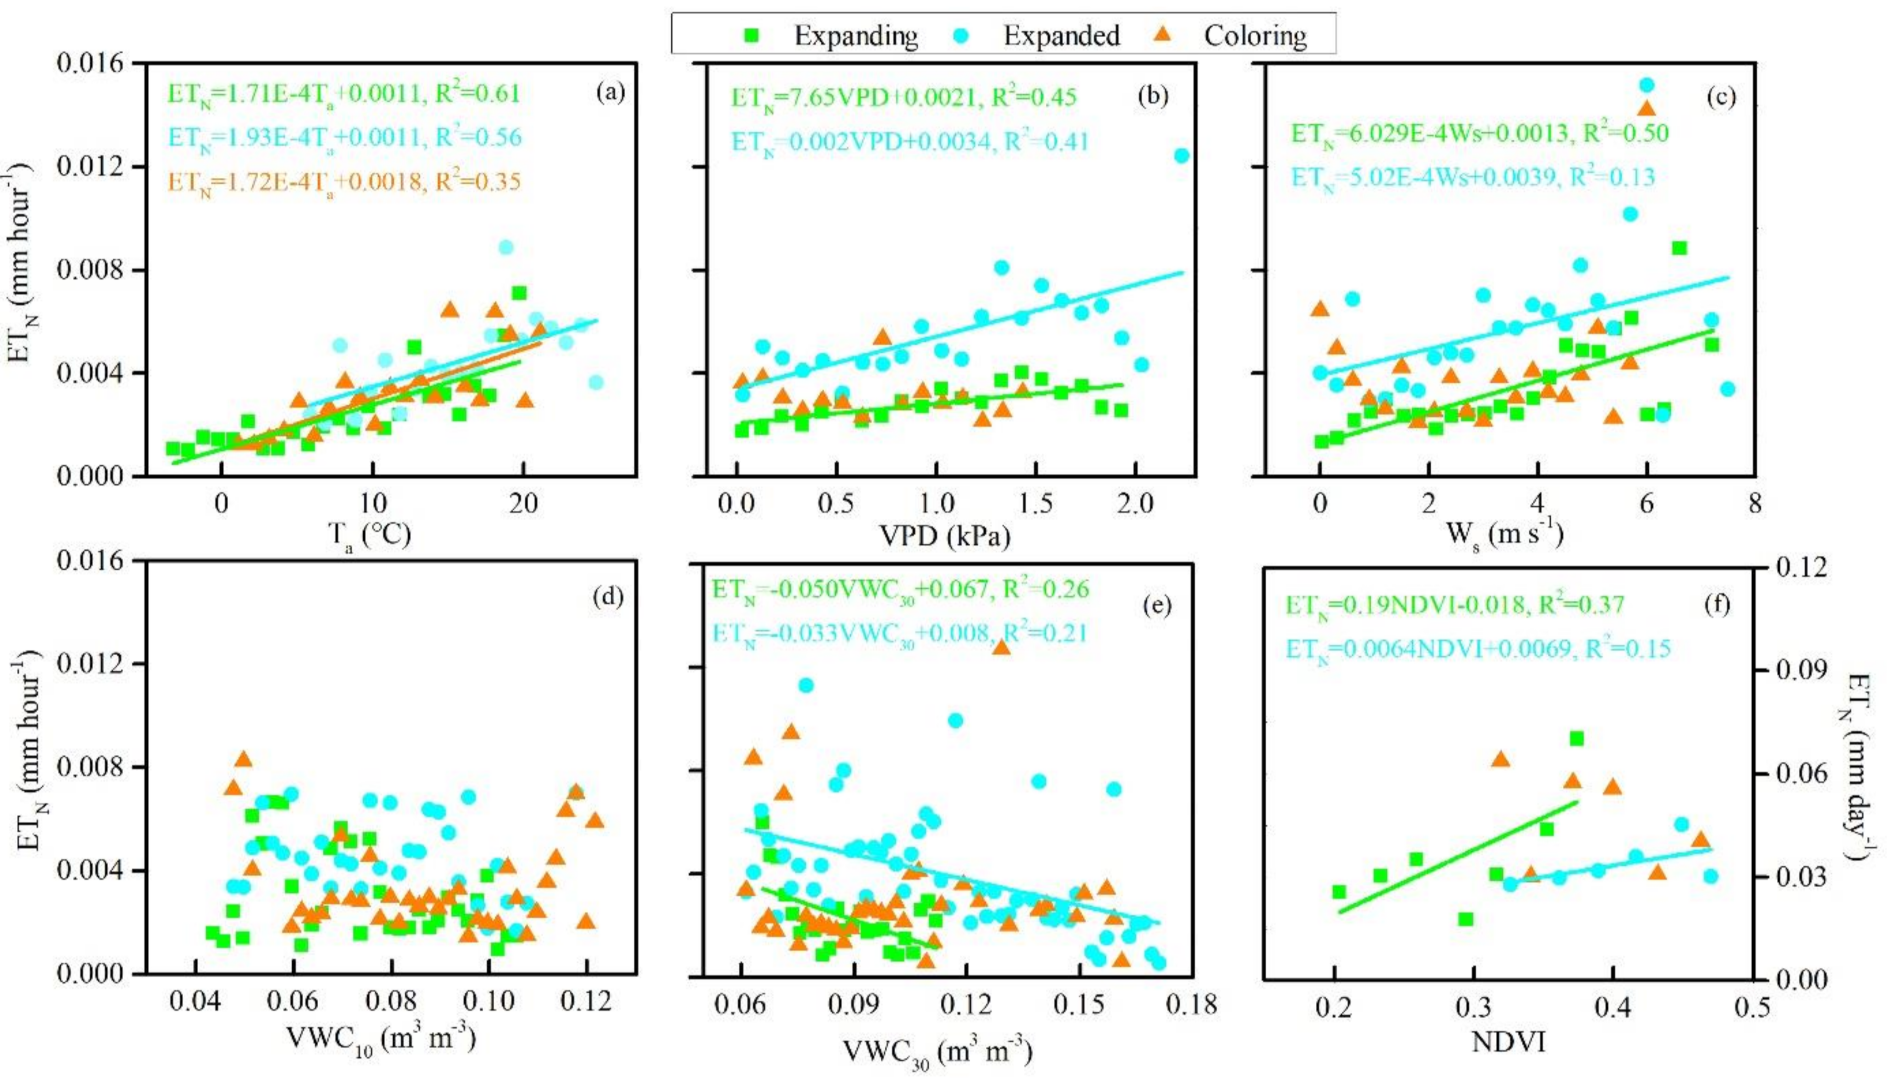
3.3. Biophysical Regulations on ETN

On a seasonal scale, daily ETN is positively linearly related with Ta, VPD, VWC10, and NDVI (p-values, all < 0.05; Figure 6a–c,f). The ETN showed a negative relationship with VWC30 (Figure 6d). ETN showed no significant relationship with Ws (Figure 6e). The result of stepwise regression between biophysical variables and ETN at a seasonal scale showed that ETN was mainly controlled by Ta, VPD, and VWC10 from 2012 to 2014 (R2 = 0.26, p < 0.01; Table 2). Among these factors, Ta played a dominant role in controlling ETN.
ETN showed different correlation with biophysical factors during different phenologies. In the expanding stage, ETN increased linearly with increasing Ta, VPD, Ws, and NDVI (p-values, all < 0.05; Figure 7a–c,f) and decreased with increasing VWC10 and VWC30. In the leaf expanded stage, ETN was positively related with Ta, VPD, Ws, and NDVI (Figure 7a–c,f) and negatively related with VWC30. The ETN showed no significant relationship with VWC10 during the expanded stage. In the leaf coloring stage, ETN only increased linearly with Ta and Ws. The results of the stepwise regression has shown that VWC10 and NDVI were responsive for most of the variations in ETN during the expanding stages, while VPD and VWC30 dominated the ETN at the expanded stage, and Ta and Ws became more important during the leaf coloring stage (Table 3). ETN was positively related to Ta under the condition of VWC30 < 0.1 m3 m−3 (R2 = 0.44, p < 0.05). However, ETN showed no significant correlation with Ta under VWC30 > 0.1 m3 m−3 (Figure 8).

4. Discussion

4.1. Measurement Uncertainties

Eddy covariance (EC) method can be used to observe latent heat flux for its advantage of continuous long-term and high frequency measurements. However, the EC method often underestimates the latent heat flux when there is a stable stratification of the air below the sensors, as the u* was below a certain level [17], which can lead to challenges in accurately calculating ETN using the EC method [21]. To compensate for these problems, we have excluded calm nights from the analysis using a friction velocity of 0.18, 0.22, and 0.25 m s−1, and thus leading to 45%, 42%, and 46% of nighttime data being gap-filled for the years 2012–2014, respectively, by the Penman–Monteith (P-M) equation in order to estimate the amount of ETN [23]. Guo et al. [46] compared the nighttime LE amount estimated by the P–M equation and observed by lysimeter, and the results proved that the P–M equation can accurately estimate the nighttime water flux. In addition, the moderate uncertainty in LE observed by EC did not affect the process relationships in this study, as shown in Figure 6 and Figure 7. The relationships are robust and are not affected by the uncertainties in the energy-closure balance. Besides, the higher placement of meteorological sensors did not invalidate the functional relationship, but it may influence the parameters.

4.2. Magnitude of ETN

The decreasing trend of ETN during nighttime (21:00–6:00) from May to August may be related to the decreasing air temperature and the increasing relative air humidity (RH) at night before dawn. In addition, the decreasing trend of ETN showed a positive correlation with Ta, thus the decreasing Ta may lead to the declining tendency of ETN. Besides, the decreasing trend of ETN from May to August may also be attributed to the relatively high values at the beginning of the night (21:00). The increasing trend of ETN in September was due to the relatively low evapotranspiration at the beginning of night. Nevertheless, Figure 3 did indicate the decreasing trend and variation in mean nocturnal ET in different months during the growing season.
The monthly mean night length was shortest in June and longest in September. It seems that the monthly amount of ETN showed opposite results with the monthly mean night length. The annual amount of ET was highest in 2012, followed by 2013, and was lowest in 2014. The maximum daily ETN (0.21, 0.17, and 0.14 mm night−1 over 2012–2014, respectively) was highest in 2012, followed by 2013, and was lowest in 2014, which was inconsistent with the annual total amount of ET. Sometimes a downward LE reflecting vapor condensation or random measurement error was observed. ETN was typically largest during both summer and autumn months, and exhibited high values from May to July, being similar to the trend in the daily ET [12]. ETN mostly occurred during the growing season, in which ETN occupied the most amount of the annual total. Annually, the amount of ETN was 3%, 4%, and 4% of ET in years 2012–2014, respectively, which were lower compared with the study using the EC method in a hardwood forest, pine plantation, and old field, with the average acceptable percentages of 8.0%, 9.1%, and 8.0% of ETN in ET during the study area in America, respectively [21]. It was also lower than the results studied in grass/savanna in America and in row crops in France, with 6% and 12~23%, respectively [2,18]. Moreover, it was also lower than that (10%) in Rollesbroich and Wüstebach in Germany [16]. However, it was higher than that (1%) in the Pinus ponderosa forest in America [1]. However, Hayat et al. [13] have reported that the nighttime sap flow contributed to the daily total sap flow by 8–14% and an interannual mean of 11%, which was much higher than the ratio of ETN/ET here in the same study area [13]. Three reasons may explain this large discrepancy: One reason is that the sap flow not only measured the transpiration, but also observed the nighttime capacity. The other reason is that sap flow only measured specific species (Salix psammophila in Hayat’s study), and we analyzed the ETN/ET in this desert shrub ecosystem instead. Nighttime sap flow in Salix psammophila is much more obvious than other species in this ecosystem. Another reason may be due to the system error in the EC method, as the EC method may underestimate the LE during low wind at night, and the P–M equation, which was used to fill gaps in LE, was reported to lead to underestimation in drylands.

4.3. Biophysical Controls on Seasonal and Phenological Variation in ETN

The mechanism in biophysical controls on seasonal ETN has seldom been reported in semiarid ecosystems [13,47]. Our results showed that ETN was mostly affected by Ta during the dry season of 2013, while it was significantly responsive to both Ta and VWC during the wet seasons of 2012 and 2014 (Figure 6c,d, Table 2). High VWC led to more transpiration and evapotranspiration. The low rainfall periods in autumn of 2013 and the spring of 2014 together have influenced the VWC10 and VWC30, thus decreasing NDVI and ETN in 2014. In addition, the better relationship of ETN with VWC10 than with VWC30 during the growing season, and the better relationship of ETN with VWC30 at different phenologies than with VWC10, indicates that VWC10 was influenced by a variety of factors and that soil water at 10 cm depth cannot reflect the water condition of a plant at different phenologies better than that it did at a 30 cm depth. Previous studies have found that roots of the dominant shrubs are mainly distributed in the 20–50 cm soil layer [28], thus resulting in VWC30 affecting night transpiration more. The ostensible contradiction between the better relevance of VWC10 during the growing season and the bad relevance between ETN and VWC10 at different phenologies may be explained by two reasons. One is that the VWC at 10 cm depth is influenced by a variety of factors and varies severely during the growing season, which may be more consistent with the variation of ETN seasonally. The other reason may be due to the different timescale of data with which the daily mean value was used during the growing season, although hourly data was conducted at different phenologies. The daily mean value may miss the diurnal variation information of variables. However, hourly value can not only supply diurnal information but can also supply a large volume of data. Stepwise regression during the growing seasons showed that ETN was related to Ta, VPD, and VWC10, and was more susceptible to Ta and VPD than VWC10. The VPD indicated the differences in water potential between the leaves and atmosphere. A higher value of VPD led to larger nighttime transpiration [13].
Stepwise regression showed that VWC30 and NDVI were the dominant factors during the leaf expanding stage (Table 3). Previous experiments have suggested that younger leaves had higher nighttime water loss than more mature and fully expanded leaves [48,49]. During the leaf expanding stage, shrubs were very sensible to soil water. Many studies across a range of ecosystems have reported that an increase in soil moisture leads to an increase in nocturnal sap flow [7,49]. However, ETN decreased as the VWC30 increased during the leaf expanding stage in our study. This inconsistence can be explained by the fact that ETN is affected by the interaction of soil moisture, air temperature, and other biophysical factors. During the leaf expanded stage, VPD and VWC30 were the main factors in controlling ETN, indicating that water is the key factor during this stage. As the photosynthesis became weak during the leaf coloring stage, nighttime transpiration was more vulnerable to air temperature and wind speed, therefore Ta and Ws were the main controlling factors during this stage. In addition, Ws was the main factor during all the three stages, since an appropriate Ws can bring more moisture in the atmosphere and thus exacerbate the formation of ETN.

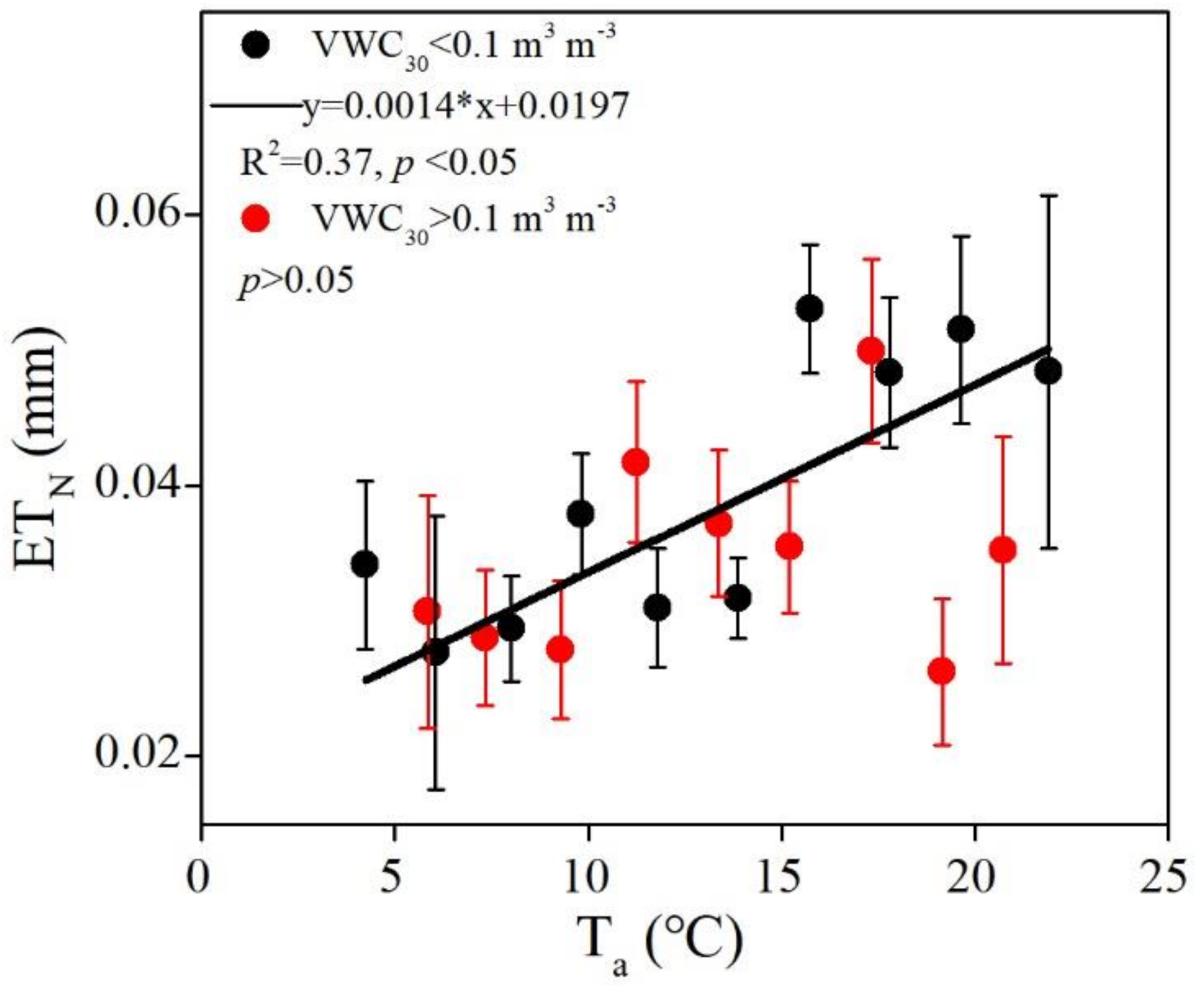
4.4. Effects of Drought on ET

The higher values in Ta, Ts_10, and VPD and the lower average of soil water volumetric content (VWC10, VWC30) in 2013 indicated that the year 2013 was the driest year over the study period, and that years 2012 and 2014 were relatively wet years. However, the imbalance in the distribution of rainfall over 2012–2014 led to a different value in soil water at the same time of the year. The VWC30 was relatively high during the autumn in 2012 and the spring in 2013, thus the plenitude of water in the soil contributed to the growth of vegetation and finally resulted in higher NDVI for 2013.
According to the REW, there was a typical summer drought in 2013 and a spring drought in 2014. The rainfall legacy effects (i.e., the effects of past rainfall on current ecosystem properties) may simply result from the carry-over of soil moisture between years [22]. In our site, little soil water recharge occurred from late autumn to early spring, therefore the early spring VWC30 had values similar to the preceding autumn (Figure 2). Therefore, the low VWC30 in the autumn of 2013 and the spring of 2014 led to a long-term drought at the leaf expanding stage, thus leading to lower NDVI in 2014. Extreme drought in spring seems to hinder canopy development, thus leading to low NDVI in 2014 [37,50]. Low NDVI can lead to low evapotranspiration (Figure 2f), as ETN showed a positive relationship with NDVI (Figure 6f and Figure 7f). The fact that the lowest NDVI and ET occurred in 2014, while the lowest ETN did not occur among the three years in our site, revealed that ETN may not be so pronounced to NDVI [39].
The ETN responded differently to the spring drought and summer drought [24,34,38]. The ETN showed an increasing trend during the spring drought, but showed no significant changes during the summer drought at our site (Figure 4a). However, daily evapotranspiration showed a slight decline during the summer drought (Figure 4b). The summer drought in 2013 caused the ET to decrease (21.5% lower than that in 2012). The summer drought, with low VWC30 and high Ta, caused the ETN to increase (Figure 8). Evapotranspiration was also influenced by drought duration [37]. However, the effects of the spring drought, such as dry soil during leaf expansion in 2014, led to lower NDVI and lower annual ET. The number of days in which droughts occurred during the growing season was largest in 2014 and smallest in 2012 [51]. The long-term drought (drought > one month) during summer led to a decline of ET in 2013. Long-term drought and less rainfall in 2013 had lagged effects on the spring drought and thus led to lower ET in 2014.

5. Conclusions

Eddy covariance measurements of ETN showed that ETN varied at diurnal, seasonal, and interannual scales. ETN began to increase from May and peaked in June and July, with higher values in summer than in spring and autumn. The maximum daily ETN was 0.21, 0.17, and 0.14 mm night−1 for the years 2012–2014, respectively. The response of ETN to biophysical factors varied with phenophase. Variations in ETN were mainly controlled by VWC30 and NDVI at the leaf expanding stage and by VPD and VWC30 at the leaf expanded stage, and by Ta and Ws at the leaf coloring stage. Seasonally, variations in ETN were mainly driven by Ta, VPD, and VWC10. The long-term summer drought in 2013 and the spring drought in 2014 led to a reduction of ET.
The significant variation of nocturnal evapotranspiration during the growing season among different years revealed that ETN is a non-neglectable factor in the water balance of desert shrub ecosystems [52]. The results here can potentially contribute to the validation of ET models and gap-filled eddy covariance ET estimates. They are also helpful for the sustainable management of desert ecosystems, particularly in light of changing climate conditions.

Author Contributions

X.J., G.S. and Y.T. conceived and designed the experiment; C.L., H.Y. and X.Z. collected data; X.G. analysed the data and wrote the initial draft of the manuscript; T.Z., provided conceptual and editorial advice and re-wrote significant parts of the manuscript. All authors have read and agreed to the published version of the manuscript.

Funding

This study was supported by the National Natural Science Foundation of China (NSFC, No. 31901366, 32071843, 32071842), the Natural Science Foundation of Hebei Province (Proj. No. C2019403114), Science and Technology Project of Hebei Education Department (Project No. QN2020164, No. BJ2019045), China Postdoctoral Science Foundation (Proj. No. 2020M670543), and the Youth Science and technology fund of Hebei GEO university (Proj. No. QN202123).

Institutional Review Board Statement

Not applicable.

Informed Consent Statement

Not applicable.

Data Availability Statement

Not applicable.

Acknowledgments

We thank Q.Y. and P.L. for their assistance with the field work. The U.S.-China Carbon Consortium (USCCC) supported this work via helpful discussions and exchange of ideas. We also would like to thank the editors and anonymous reviewers for providing valuable comments and suggestions on the manuscript.

Conflicts of Interest

The authors declare that they have no known competing financial interests or personal relationships that could have appeared to influence the work reported in this paper.

References

  1. Padron, R.S.; Gudmundsson, L.; Michel, D.; Seneviratne, S.I. Terrestrial water loss at night: Global relevance from observations and climate models. Hydrol. Earth Syst. Sci. 2020, 24, 793–807. [Google Scholar] [CrossRef] [Green Version]
  2. Fisher, J.B.; Melton, F.; Middleton, E.; Hain, C.; Anderson, M.; Allen, R.; McCabe, M.F.; Hook, S.; Baldocchi, D.; Townsend, P.A.; et al. The future of evapotranspiration: Global requirements for ecosystem functioning, carbon and climate feedbacks, agricultural management, and water resources. Water Resour. Res. 2017, 53, 2618–2626. [Google Scholar] [CrossRef]
  3. Lombardozzi, D.L.; Zeppel, M.J.B.; Fisher, R.A.; Tawfik, A. Representing nighttime and minimum conductance in CLM4.5: Global hydrology and carbon sensitivity analysis using observational constraints. Geosci. Model. Dev. 2017, 10, 321–331. [Google Scholar] [CrossRef] [Green Version]
  4. Caird, M.A.; Richards, J.H.; Donovan, L.A. Nighttime stomatal conductance and transpiration in C3 and C4 plants. Plant. Physiol. 2007, 143, 4–10. [Google Scholar] [CrossRef] [Green Version]
  5. Fricke, W. Night-time transpiration–favouring growth? Trends Plant Sci. 2019, 24, 311–317. [Google Scholar] [CrossRef] [PubMed]
  6. Dios, V.; Chowdhury, F.I.; Granda, E.; Yao, Y.; Tissue, D.T. Assessing the potential functions of nocturnal stomatal conductance in C3 and C4 plants. New Phytologist. 2019, 223. [Google Scholar]
  7. Chen, Z.; Zhang, Z.; Sun, G.; Chen, L.; Xu, H.; Chen, S. Biophysical controls on nocturnal sap flow in plantation forests in a semi-arid region of northern China. Agric. For. Meteorol. 2020, 284, 107904. [Google Scholar] [CrossRef]
  8. Matyssek, R.; Günthardt-Goerg, M.S.; Maurer, S.; Keller, T. Nighttime exposure to ozone reduces whole-plant production in Betula pendula. Tree Physiol. 1995, 15, 159–165. [Google Scholar] [CrossRef]
  9. Schoppach, R.; Sinclair, T.R.; Sadok, W. Sleep tight and wake-up early: Nocturnal transpiration traits to increase wheat drought tolerance in a Mediterranean environment. Funct. Plant Biol. 2020, 47, 1117–1127. [Google Scholar] [CrossRef]
  10. Chen, J.M.; Liu, J. Evolution of evapotranspiration models using thermal and shortwave remote sensing data. Remote Sens. Environ. 2020, 237, 111594. [Google Scholar] [CrossRef]
  11. Thomas, S.C. Photosynthetic capacity peaks at intermediate size in temperate deciduous trees. Tree Physiol. 2010, 30, 555–573. [Google Scholar] [CrossRef] [PubMed] [Green Version]
  12. Hayat, M.; Zha, T.; Jia, X.; Iqbal, S.; Qian, D.; Bourque, C.P.A.; Khan, A.; Tian, Y.; Bai, Y.; Liu, P.; et al. A multiple-temporal scale analysis of biophysical control of sap flow in Salix psammophila growing in a semiarid shrubland ecosystem of northwest China. Agric. For. Meteorol. 2020, 288–289, 107985. [Google Scholar] [CrossRef]
  13. Hayat, M.; Iqbal, S.; Zha, T.; Jia, X.; Yang, R. Biophysical control on nighttime sap flow in Salix psammophila in a semiarid shrubland ecosystem. Agric. For. Meteorol. 2021, 300, 108329. [Google Scholar] [CrossRef]
  14. Folland, C.K.; Karl, T.R.; Jim Salinger, M. Observed climate variability and change. Weather 2002, 57, 269–278. [Google Scholar] [CrossRef]
  15. Peng, S.; Piao, S.; Ciais, P.; Myneni, R.B.; Chen, A.; Chevallier, F.; Dolman, A.J.; Janssens, I.A.; Penuelas, J.; Zhang, G. Asymmetric effects of daytime and night-time warming on Northern Hemisphere vegetation. Nature 2013, 501, 88–92. [Google Scholar] [CrossRef] [PubMed]
  16. Groh, J.; Pütz, T.; Gerke, H.H.; Vanderborght, J.; Vereecken, H. Quantification and Prediction of Nighttime Evapotranspiration for Two Distinct Grassland Ecosystems. Water Resour. Res. 2019, 55, 2961–2975. [Google Scholar] [CrossRef]
  17. Fisher, J.B.; Baldocchi, D.; Misson, L.; Dawson, T.E.; Goldstein, A.H. What the towers don’t see at night: Nocturnal sap flow in trees and shrubs at two AmeriFlux sites in California. Tree Physiol. 2007, 27, 597–610. [Google Scholar] [CrossRef] [Green Version]
  18. Dios, V.D.; Roy, J.; Ferrio, J.P.; Alday, J.G.; Landais, D.; Milcu, A.; Gessler, A. Processes driving nocturnal transpiration and implications for estimating land evapotranspiration. Sci. Rep. 2015, 5, 10975. [Google Scholar] [CrossRef]
  19. Jia, X.; Zha, T.; Gong, J.; Zhang, Y.; Wu, B.; Qin, S.; Peltola, H. Multi-scale dynamics and environmental controls on net ecosystem CO2 exchange over a temperate semiarid shrubland. Agric. For. Meteorol. 2018, 259, 250–259. [Google Scholar] [CrossRef]
  20. Zhao, C.Y.; Si, J.H.; Qi, F.; Yu, T.F.; Li, P.D. Comparative study of daytime and nighttime sap flow of Populus euphratica. Plant Growth Regul. 2017, 82, 1–10. [Google Scholar] [CrossRef]
  21. Novick, K.A.; Oren, R.; Stoy, P.C.; Siqueira, M.B.S.; Katul, G.G. Nocturnal evapotranspiration in eddy-covariance records from three co-located ecosystems in the Southeastern U.S.: Implications for annual fluxes. Agric. For. Meteorol. 2009, 149, 1491–1504. [Google Scholar] [CrossRef] [Green Version]
  22. Jia, X.; Zha, T.; Gong, J.; Wang, B.; Zhang, Y.; Wu, B.; Qin, S.; Peltola, H. Carbon and water exchange over a temperate semi-arid shrubland during three years of contrasting precipitation and soil moisture patterns. Agric. For. Meteorol. 2016, 228–229, 120–129. [Google Scholar] [CrossRef]
  23. Guo, X.; Zha, T.; Jia, X.; Wu, B.; Feng, W.; Xie, J.; Gong, J.; Zhang, Y.; Peltola, H. Dynamics of Dew in a Cold Desert-Shrub Ecosystem and Its Abiotic Controls. Atmos 2016, 7, 32. [Google Scholar] [CrossRef] [Green Version]
  24. Jia, X.; Zha, T.S.; Wu, B.; Zhang, Y.Q.; Gong, J.N.; Qin, S.G.; Chen, G.P.; Qian, D.; Kellomäki, S.; Peltola, H. Biophysical controls on net ecosystem CO2 exchange over a semiarid shrubland in northwest China. Biogeosciences 2014, 11, 4679–4693. [Google Scholar] [CrossRef] [Green Version]
  25. Chen, W.; Jia, X.; Li, C.; Yu, H.; Xie, J.; Wang, B.; Wu, Y.; Wang, S.; Yang, X.M. Extreme rainfall impacts on soil CO2 efflux in an urban forest ecosystem in Beijing, China. Can. J. Soil Sci. 2016, 96, 504–514. [Google Scholar] [CrossRef] [Green Version]
  26. Liu, P.; Zha, T.; Jia, X.; Wang, B.; Guo, X.; Zhang, Y.; Wu, B.; Yang, Q.; Peltola, H. Diurnal Freeze-Thaw Cycles Modify Winter Soil Respiration in a Desert Shrub-Land Ecosystem. Forests 2016, 7, 161. [Google Scholar] [CrossRef] [Green Version]
  27. Wang, B.; Zha, T.S.; Jia, X.; Wu, B.; Zhang, Y.Q.; Qin, S.G. Soil moisture modifies the response of soil respiration to temperature in a desert shrub ecosystem. Biogeosciences 2014, 11, 259–268. [Google Scholar] [CrossRef] [Green Version]
  28. Jia, X.; Zha, T.S.; Gong, J.N.; Wu, B.; Zhang, Y.Q.; Qin, S.G.; Chen, G.P.; Feng, W.; Kellomäki, S.; Peltola, H. Energy partitioning over a semi-arid shrubland in northern China. Hydrol. Process. 2016, 30, 972–985. [Google Scholar] [CrossRef]
  29. She, W.; Bai, Y.; Zhang, Y.; Qin, S.; Feng, W.; Lai, Z.; Qiao, Y.; Liu, L.; Zhang, W.; Miao, C. Nitrogen-enhanced herbaceous competition threatens woody species persistence in a desert ecosystem. Plant Soil 2021, 460, 333–345. [Google Scholar] [CrossRef]
  30. Jia, X.; Mu, Y.; Zha, T.; Wang, B.; Tian, Y. Seasonal and interannual variations in ecosystem respiration in relation to temperature, moisture, and productivity in a temperate semi-arid shrubland. Sci. Total Environ. 2019, 709, 136210. [Google Scholar] [CrossRef]
  31. Schmid, H.P. Experimental design for flux measurements: Matching scales of observations and fluxes. Agric. For. Meteorol. 1997, 87, 179–200. [Google Scholar] [CrossRef]
  32. Zha, T.-S.; Wu, Y.J.; Jia, X.; Zhang, M.Y.; Bai, Y.J.; Liu, P.; Ma, J.Y.; Bourque, C.P.-A.; Peltola, H. Diurnal response of effective quantum yield of PSII photochemistry to irradiance as an indicator of photosynthetic acclimation to stressed environments revealed in a xerophytic species. Ecol. Indic. 2017, 74, 191–197. [Google Scholar] [CrossRef]
  33. Xie, J.; Zha, T.; Zhou, C.; Jia, X.; Yu, H.; Yang, B.; Chen, J.; Zhang, F.; Wang, B.; Bourque, C.P.A.; et al. Seasonal variation in ecosystem water use efficiency in an urban-forest reserve affected by periodic drought. Agric. For. Meteorol. 2016, 221, 142–151. [Google Scholar] [CrossRef]
  34. Misson, L.; Tang, J.; Ming, X.; Mckay, M.; Goldstein, A. Influences of recovery from clear-cut, climate variability, and thinning on the carbon balance of a young ponderosa pine plantation. Agric. For. Meteorol. 2005, 130, 207–222. [Google Scholar] [CrossRef]
  35. Foken, T.; Göockede, M.; Mauder, M.; Mahrt, L.; Amiro, B.; Munger, W. Post-field data quality control. In Handbook of Micrometeorology; Springer: Berlin/Heidelberg, Germany, 2004; pp. 181–208. [Google Scholar]
  36. Hollinger, D.Y.; Aber, J.; Dail, B.; Davidson, E.A.; Goltz, S.M.; Hughes, H.; Leclerc, M.Y.; Lee, J.T.; Richardson, A.D.; Rodrigues, C.; et al. Spatial and temporal variability in forest–atmosphere CO2 exchange. Glob. Chang. Biol. 2004, 10, 1689–1706. [Google Scholar] [CrossRef]
  37. Ma, J.; Jia, X.; Zha, T.; Bourque, C.P.A.; Tian, Y.; Bai, Y.; Liu, P.; Yang, R.; Li, C.; Li, C.; et al. Ecosystem water use efficiency in a young plantation in Northern China and its relationship to drought. Agric. For. Meteorol. 2019, 275, 1–10. [Google Scholar] [CrossRef]
  38. Papale, D.; Reichstein, M.; Aubinet, M.; Canfora, E.; Bernhofer, C.; Kutsch, W.; Longdoz, B.; Rambal, S.; Valentini, R.; Vesala, T. Towards a standardized processing of Net Ecosystem Exchange measured with eddy covariance technique: Algorithms and uncertainty estimation. Biogeosciences 2006, 3, 571–583. [Google Scholar] [CrossRef] [Green Version]
  39. Xu, H.; Zhang, Z.; Xiao, J.; Chen, J.; Zhu, M.; Cao, W.; Chen, Z. Environmental and canopy stomatal control on ecosystem water use efficiency in a riparian poplar plantation. Agric. For. Meteorol. 2020, 287, 107953. [Google Scholar] [CrossRef]
  40. Falge, E.; Baldocchi, D.; Olson, R.; Anthoni, P.; Aubinet, M.; Bernhofer, C.; Burba, G.; Ceulemans, R.; Clement, R.; Dolman, H. Gap filling strategies for long term energy flux data sets. Agric. For. Meteorol. 2001, 107, 71–77. [Google Scholar] [CrossRef] [Green Version]
  41. Wilson, K.; Goldstein, A.; Falge, E.; Aubinet, M.; Verma, S. Energy balance closure at FLUXNET sites. Agric. For. Meteorol. 2002, 113, 223–243. [Google Scholar] [CrossRef] [Green Version]
  42. Kang, S.; Gu, B.; Du, T.; Zhang, J. Crop coefficient and ratio of transpiration to evapotranspiration of winter wheat and maize in a semi-humid region. Agric. Water Manag. 2007, 59, 239–254. [Google Scholar] [CrossRef]
  43. Campbell, G.S.N.; Norman, J. An Introduction to Environmental Biophysics; Springer Science & Business Media: Dordrecht, The Netherlands, 1998. [Google Scholar]
  44. Zhou, J.; Zhang, Z.; Sun, G.; Fang, X.; Zha, T.; McNulty, S.; Chen, J.; Jin, Y.; Noormets, A. Response of ecosystem carbon fluxes to drought events in a poplar plantation in Northern China. For. Ecol. Manag. 2013, 300, 33–42. [Google Scholar] [CrossRef]
  45. Zha, T.; Barr, A.G.; Black, T.A.; McCaughey, J.H.; Bhatti, J.; Hawthorne, I.; Krishnan, P.; Kidston, J.; Saigusa, N.; Shashkov, A.; et al. Carbon sequestration in boreal jack pine stands following harvesting. Glob. Chang. Biol. 2009, 15, 1475–1487. [Google Scholar] [CrossRef]
  46. Guo, X.N.; Zha, T.S.; Jia, X.; Yang, Q.; Liu, P. Estimation of dewfall amount in a typical desert shrub ecosystem. J. Beijing For. Univ. 2016. [Google Scholar]
  47. Zhao, C.; Si, J.; Feng, Q.; Yu, T.; Li, P.; Forster, M.A. Nighttime transpiration of Populus euphratica during different phenophases. J. For. Res. 2019, 30, 435–444. [Google Scholar] [CrossRef]
  48. Phillips, N.G.; Lewis, J.D.; Logan, B.A.; Tissue, D.T. Inter- and intra-specific variation in nocturnal water transport in Eucalyptus. Tree Physiol. 2010, 30, 586–596. [Google Scholar] [CrossRef] [Green Version]
  49. Zeppel, M.; Logan, B.; Lewis, J.D.; Phillips, N.; Tissue, D. Why lose water at night? Disentangling the mystery of nocturnal sap flow, transpiration and stomatal conductance—When, where, who? Acta Hortic. 2013, 991, 307–312. [Google Scholar] [CrossRef]
  50. Reichstein, M.; Tenhunen, J.D.; Roupsard, O.; Ourcival, J.m.; Rambal, S.; Miglietta, F.; Peressotti, A.; Pecchiari, M.; Tirone, G.; Valentini, R. Severe drought effects on ecosystem CO2 and H2O fluxes at three Mediterranean evergreen sites: Revision of current hypotheses? Glob. Chang. Biol. 2002, 8, 999–1017. [Google Scholar] [CrossRef]
  51. Launiainen, S. Seasonal and inter-annual variability of energy exchange above a boreal Scots pine forest. Biogeosciences 2010, 7, 3921–3940. [Google Scholar] [CrossRef] [Green Version]
  52. Dawson, T.E.; Burgess, S.S.O.; Tu, K.P.; Oliveira, R.S.; Santiago, L.S.; Fisher, J.B.; Simonin, K.A.; Ambrose, A.R. Nighttime transpiration in woody plants from contrasting ecosystems. Tree Physiol. 2007, 27, 561–575. [Google Scholar] [CrossRef] [Green Version]
Figure 1. Research site in our study.
Forests 12 01296 g001
Figure 2. Temporal variation in (a) mean nightly air temperature (Ta) and soil temperature at 10 cm below the ground (Ts_10): (b) mean nightly vapor pressure deficit (VPD), (c) mean nightly soil volumetric water content at 10, 30, and 70 cm below the ground (VWC10, VWC30, and VWC70), (d) daily and cumulative precipitation (P), (e) mean nightly wind speed (Ws), and (f) tower-based NDVI from 2012–2014. Hatched bands in the figure indicate periods of drought (i.e., times when REW < 0.2). Green-shaded bands indicate leaf expanding stages, the light blue bands indicate leaf expanded stages, and orange bands indicate the leaf coloring stages.
Forests 12 01296 g002
Figure 3. Diurnal patterns of monthly mean nocturnal evapotranspiration (ETN): Data points represent the mean value at specific times during the night for each month from May to September over 2012–2014.
Forests 12 01296 g003
Figure 4. Daily nocturnal evapotranspiration (ETN, (a)) and diel evapotranspiration (ET, (b)) from 2012 to 2014 in the research area: The red points in subplot (a) represent the ETN during the drought period. Hatched bands in the figure indicate periods of drought.
Forests 12 01296 g004
Figure 5. Monthly daily mean nocturnal evapotranspiration (ETN) from 2012–2014. Rainy days were excluded, and the data were non-gap-filled values.
Forests 12 01296 g005
Figure 6. Relationship between annual daily nocturnal evapotranspiration (ETN) and biophysical factors including (a) daily air temperature (Ta), (b) vapor pressure deficit (VPD), (c,d) soil volumetric water content at 10 cm and 30 cm below the ground (VWC10, VWC30), (e) wind speed (Ws), and (f) tower-based normalized differential vegetation index (NDVI) in non-rainy days over 2012–2014. Data points are binned averages according to Ta, VPD, VWC, Ws, and NDVI, with an increment of 1 °C, 0.2 kPa, 0.02 m3 m−3, 0.5 m s−1, and 0.1, respectively, during growing seasons. Bars indicate standard error.
Forests 12 01296 g006
Figure 7. Relationship between hourly nocturnal evapotranspiration (ETN) vs. biophysical factors at different phenologies including expanding stage, expanded stage, and coloring stage: hourly values of (a) air temperature (Ta), (b) vapor pressure deficit (VPD), (c,d) soil volumetric water content at 10 cm (VWC10) and 30 cm (VWC30) below the ground, (e) wind speed (Ws), and (f) daily tower-based normalized differential vegetation index (NDVI) in non-rainy days over 2012–2014 were binned averaged with an increment of 1 °C, 0.2 kPa, 0.002 m3 m−3, 0.5 m s−1 and 0.1, respectively, during the growing season.
Forests 12 01296 g007
Figure 8. Nighttime evapotranspiration (ETN) as a function of air temperature (Ta) under different soil volumetric water content measured at 30 cm depth (VWC30) during the growing seasons from 2012–2014. Daily ETN was bin-averaged into 2 °C Ta intervals. Error bars indicate standard errors.
Forests 12 01296 g008
Table 1. Annual mean nightly air temperature (Ta), soil temperature at 10 cm below the ground (Ts_10), water vapor pressure deficit (VPD), soil volumetric water content at 10 cm and 30 cm below the ground (VWC10 and VWC30), wind speed (Ws), tower-based normalized difference vegetation index (NDVI) during the growing seasons, annual total precipitation (P), evapotranspiration (ET), nocturnal evapotranspiration (ETN), maximum daily ETN, and number of days during droughts.
VariableYear
201220132014
Ta (°C)8.119.509.34
Ts_10 (°C)11.3112.6212.60
VPD (kPa)0.670.780.73
VWC10 (m3 m−3)0.0700.0650.073
VWC30 (m3 m−3)0.0860.0770.082
Ws (m s−1)2.83.13.1
NDVI0.330.350.30
P (mm)335278342
ET (mm)331260230
ETN (mm)91110
Maximum daily ETN (mm)0.210.170.14
Number of days during droughts (mm)277890
Table 2. Stepwise regression analysis between nocturnal evapotranspiration (ETN) and air temperature (Ta), vapor pressure deficit (VPD), soil volumetric water content at 10 cm and 30 cm below the ground (VWC10 and VWC30), wind speed (Ws), and during the growing season from 2012 to 2014.
YearEquationR2p for the Modelp for the Individual Variables
2012ETN = 0.261Ta + 0.190VWC100.17<0.01<0.01(Ta)
<0.01(VWC10)
2013ETN = 0.473Ta0.23<0.01<0.01(Ta)
2014ETN = 0.573Ta + 0.163VWC300.50<0.01<0.01(Ta)
<0.01(VWC30)
2012–2014ETN = 0.275Ta + 0.150VPD + 0.135VWC100.26<0.01<0.01(Ta)
<0.05(VPD)
<0.05(VWC10)
Table 3. Stepwise regression analysis between nocturnal evapotranspiration (ETN) and air temperature (Ta), vapor pressure deficit (VPD), soil volumetric water content at 10 cm and 30 cm below the ground (VWC10 and VWC30), wind speed (Ws), and during the leaf expanding stage, expanded stage, and leaf coloring stage over 2012–2014.
PhenologiesEquationR2p For The Modelp for the Individual Variables
ExpandingETN = 0.496VWC30 + 0.316NDVI0.58<0.01<0.01(VWC30)
<0.01(NDVI)
ExpandedETN = 0.531VPD + 0.154VWC300.42<0.01<0.01(VPD)
<0.05(VWC30)
ColoringETN = 0.732Ta − 0.297Ws0.30<0.01<0.01(Ta)
<0.015(Ws)
Publisher’s Note: MDPI stays neutral with regard to jurisdictional claims in published maps and institutional affiliations.

