1. Introduction
Family forest owners control the plurality (36%) of forestland in the United States [
1]. Because of this and their contributions to abundant, clean water, wildlife habitat, wood fiber, recreation, and other ecosystem services, it is important to understand the land they own, what it looks like, and how it is managed. Importantly, state programs exist in order to incentivize family forest owners to manage their land for the consistent provision of these ecosystem services. We analyzed family forest owners that were enrolled in Michigan’s Qualified Forest Program, a statewide tax incentive program. Currently, much of the literature aimed at evaluating conservation incentive programs focuses on counting tangible outputs that are easy to quantify and measures, such as the number of management plans developed, or tons of phosphorus retained, for example [
2,
3]. No such studies that we have found assess the relationship between parcel characteristics and management practices through a taxation program enrollee case study.
By USFS definitions, family forests are lands that include at least one acre, are 10% stocked with trees, and that are owned by individuals, married couples, family estates and trusts, or other groups of individuals who are not associated as a legal entity. The average age of the family forest owner (primary decision maker) is 62 years old. Primary decision makers of family forests are predominately white (95%) and male (79%) [
1]. Five percent of family forest owners own between one and nine acres of woods (or forest). Family forest owners that own at least ten acres account for 95% of the acres of private woods (or forest) in the United States (USDA, Washington, DC, USA, 2015), but only 37% of the total number of owners [
1]. Given these characteristics of the United States’ family forest resource, one can conclude that the actions that are taken by family forest owners can have great and long-lasting impacts on the country’s forests and overall quality of life. In Michigan, nearly 45% of the state’s 20 million acres of forestland is owned and maintained by family forest owners [
4]. Michigan is estimated to have approximately 375,000 family forest owners and nearly half own less than ten wooded acres [
5]. Communicating with this group is difficult, because there is no complete record of forest ownership in the state. Property tax records do not indicate whether a parcel is forested.
Family forest owners are confronted with myriad challenges in owning and managing forestland. Property taxes, the cost of ownership, and market uncertainty all exist as challenges in maintaining ownership of a forested property. Increasing forest fragmentation, as well as an increasing number of family forest owners, creates challenges in managing forestland for specific objectives. Conway et al. (2003) show that many factors affect family forest owner management behavior. Bequest motives, debt, and non-market activities (hunting, hiking, wildlife observation, etc.), as well as the usual harvesting decisions, are interrelated and depend on landowner preferences, market, and land characteristics [
6]. Other factors, such as absenteeism, forest parcel size, and non-timber preferences, are also important in landowner decisions [
6].
Policymakers and stakeholders have long sought to incentivize family forest owners to actively manage their woodlands. Several incentive programs were established, such as forest management planning, financial assistance for implementing conservation practices, and technical assistance through The Agriculture Act of 2014 (Farm Bill), The Environmental Quality Incentives Program (EQIP), Conservation districts (CDs), and the Forest Stewardship Program, for example. The Qualified Forest Program (QFP) and Commercial Forest Reserve Program are Michigan’s two current forestland tax programs. Both of the programs offer unique tax reductions for following a written forest management plan that is developed by a private sector professional forester.
The developing paradigm for understanding family forest owner behaviors and motivations has suggested that non-monetary benefits are paramount in shaping how they view and manage their forests, even when there are financial benefits to be had for particular practices [
7]. Koontz (2001) found that financial incentives do not necessarily encourage management activities, but rather utilize public funding in order to subsidize those that are already managing. Potter-Witter (2005) sought to understand whether forest management activity that was reported by Michigan family forest owners who were enrolled in several types of incentive programs differed significantly by program and whether management activity was significantly explained by landowner demographics [
8]. Potter-Witter (2005) demonstrated that, within the groups studied, parcel size and whether the parcel was also the owner’s permanent residence were significant in explaining forest management activity [
8].
Saulnier et al. (2017) conducted a similar analysis to Potter-Witter (2005) and found similar results for family forest owners in Virginia [
9]. The variables income, age, forested acres owned, and forest management were all significantly and positively related to the willingness to harvest. The researchers suggest that, as demand for wood fiber in Virginia increases, the ability to predict and forecast availability becomes increasingly important. With most of Virginia’s forest in private ownership, as is the case in Michigan, family forest owners are a critical variable in the equation. Wolde et al. (2017) presented a survey to landowners in Virginia and Texas in order to identify factors that predict behavior, assess overlap in family forest owner motivations, and determine how the respondent’s forest management plans and sustainability concerns correspond with their decisions. They determined that family forest owners are willing to simultaneously consider multiple ways of supplying biomass [
10].
Evaluating the effectiveness and efficiency of conservation programs helps program managers, policymakers, and researchers craft programs that improve natural resources according to the desired future conditions and outcomes. Butler et al. (2014) examined the effectiveness of the USFS Forest Stewardship Program (FSP). The authors concluded that the FSP reaches a small fraction of eligible landowners and suggested that one-on-one forestry practice assistance may be more useful to family forest owners than other forms of assistance (e.g., the development of forest management plans) [
11]. The objective of this paper is to understand the relationships between parcel characteristics and family forest owner management decisions for participants that are enrolled in the QFP, one of Michigan’s two tax incentive programs for forest landowners. Forestry incentive program managers and forestry practitioners could use these results to help predict family forest owner management decisions, thereby providing justification for targeted conservation initiatives. It can also help to refine existing taxation programs or make the case for new ones. This study is not designed or intended to evaluate the effectiveness of the QFP, but rather to understand how enrollee land and forest characteristics might predict the forest practices among those who have self-selected to enroll in a tax incentive program.
Landowners in the QFP receive two direct benefits in exchange for enrolling. One benefit exempts enrollees from certain school operating taxes; usually, 16 mills. This benefit is called the Qualified Forest School Tax Affidavit. The millage rates are locally determined, and one mill represents a dollar paid in property taxes per $1000 of taxable value. The rates vary from less than 34 to more than 127 in Michigan, depending on the local government. A property’s taxable value is approximately equal to 50% of the assessed fair market value. The savings from this first benefit can sometimes represent as much as 40% of the annual property tax bill. The second benefit prevents the “uncapping” of the property’s taxable value to the current State Equalized Value in the event of a change in ownership. This benefit is called the Qualified Forest Taxable Value Affidavit. A new owner of QFP property will be taxed on the property value that is experienced by the previous landowner. This accounts for major property tax savings, especially if a long tenured owner originally enrolled the land.
Eligible land are parcels that are greater than 20 acres. Parcels that are greater than 20 acres and less than 40 acres must be at least 80% productive forests. Parcels that are 40 acres and greater must be at least 50% productive forest. Productive forest is defined as forests that are capable of producing 20 cubic feet of wood, per acre, per year.
The decision to enroll in a tax incentive program has been found to depend more on the knowledge that the program exists than other factors, like management intentions or ownership objectives [
12]. However, parcel size was also found to predict the use of federal tax provisions among family forest owners [
13]. Enrollment in woodland owners associations has been found to differ based on management intentions [
14,
15], but this enrollment decision may differ from the decision to enroll in a property tax incentive program. Therefore, we do not know whether QFP enrollees differ from non-enrollees in terms of management intentions. However, it is likely that owners differ from non-QFP enrollees in terms of parcel size and the knowledge of programs.
Given that this study only examines landowners that are enrolled in a property tax incentive program (which requires participants to manage their forests), we are already examining landowners that are predisposed to manage their woods. Therefore, we are interested in understanding what specific forest practices are occurring and why they might be occurring. We hypothesized that combinations of parcel characteristics can be indicative of landowner behavior for landowners that are enrolled in a forest property taxation program. Forest types, the size of holdings, and geographic location might all contribute to a family forest owner’s decision making more generally [
15,
16], and parcel size has been found to relate to the use of tax provisions [
13]. Larger forest stands might make different management options more likely, because of economies of scale. Large forest stands might also make the expression of certain family forest owner values possible, such as privacy or a sense of place. Owners of large forest tracts might also be wealthier, which impacts how financial motivations affect forest management decisions [
1]. Research suggests that landowners are not a homogenous group [
17,
18], and this study aims to understand these differences and how they relate to forest practices on the ground.
3. Results
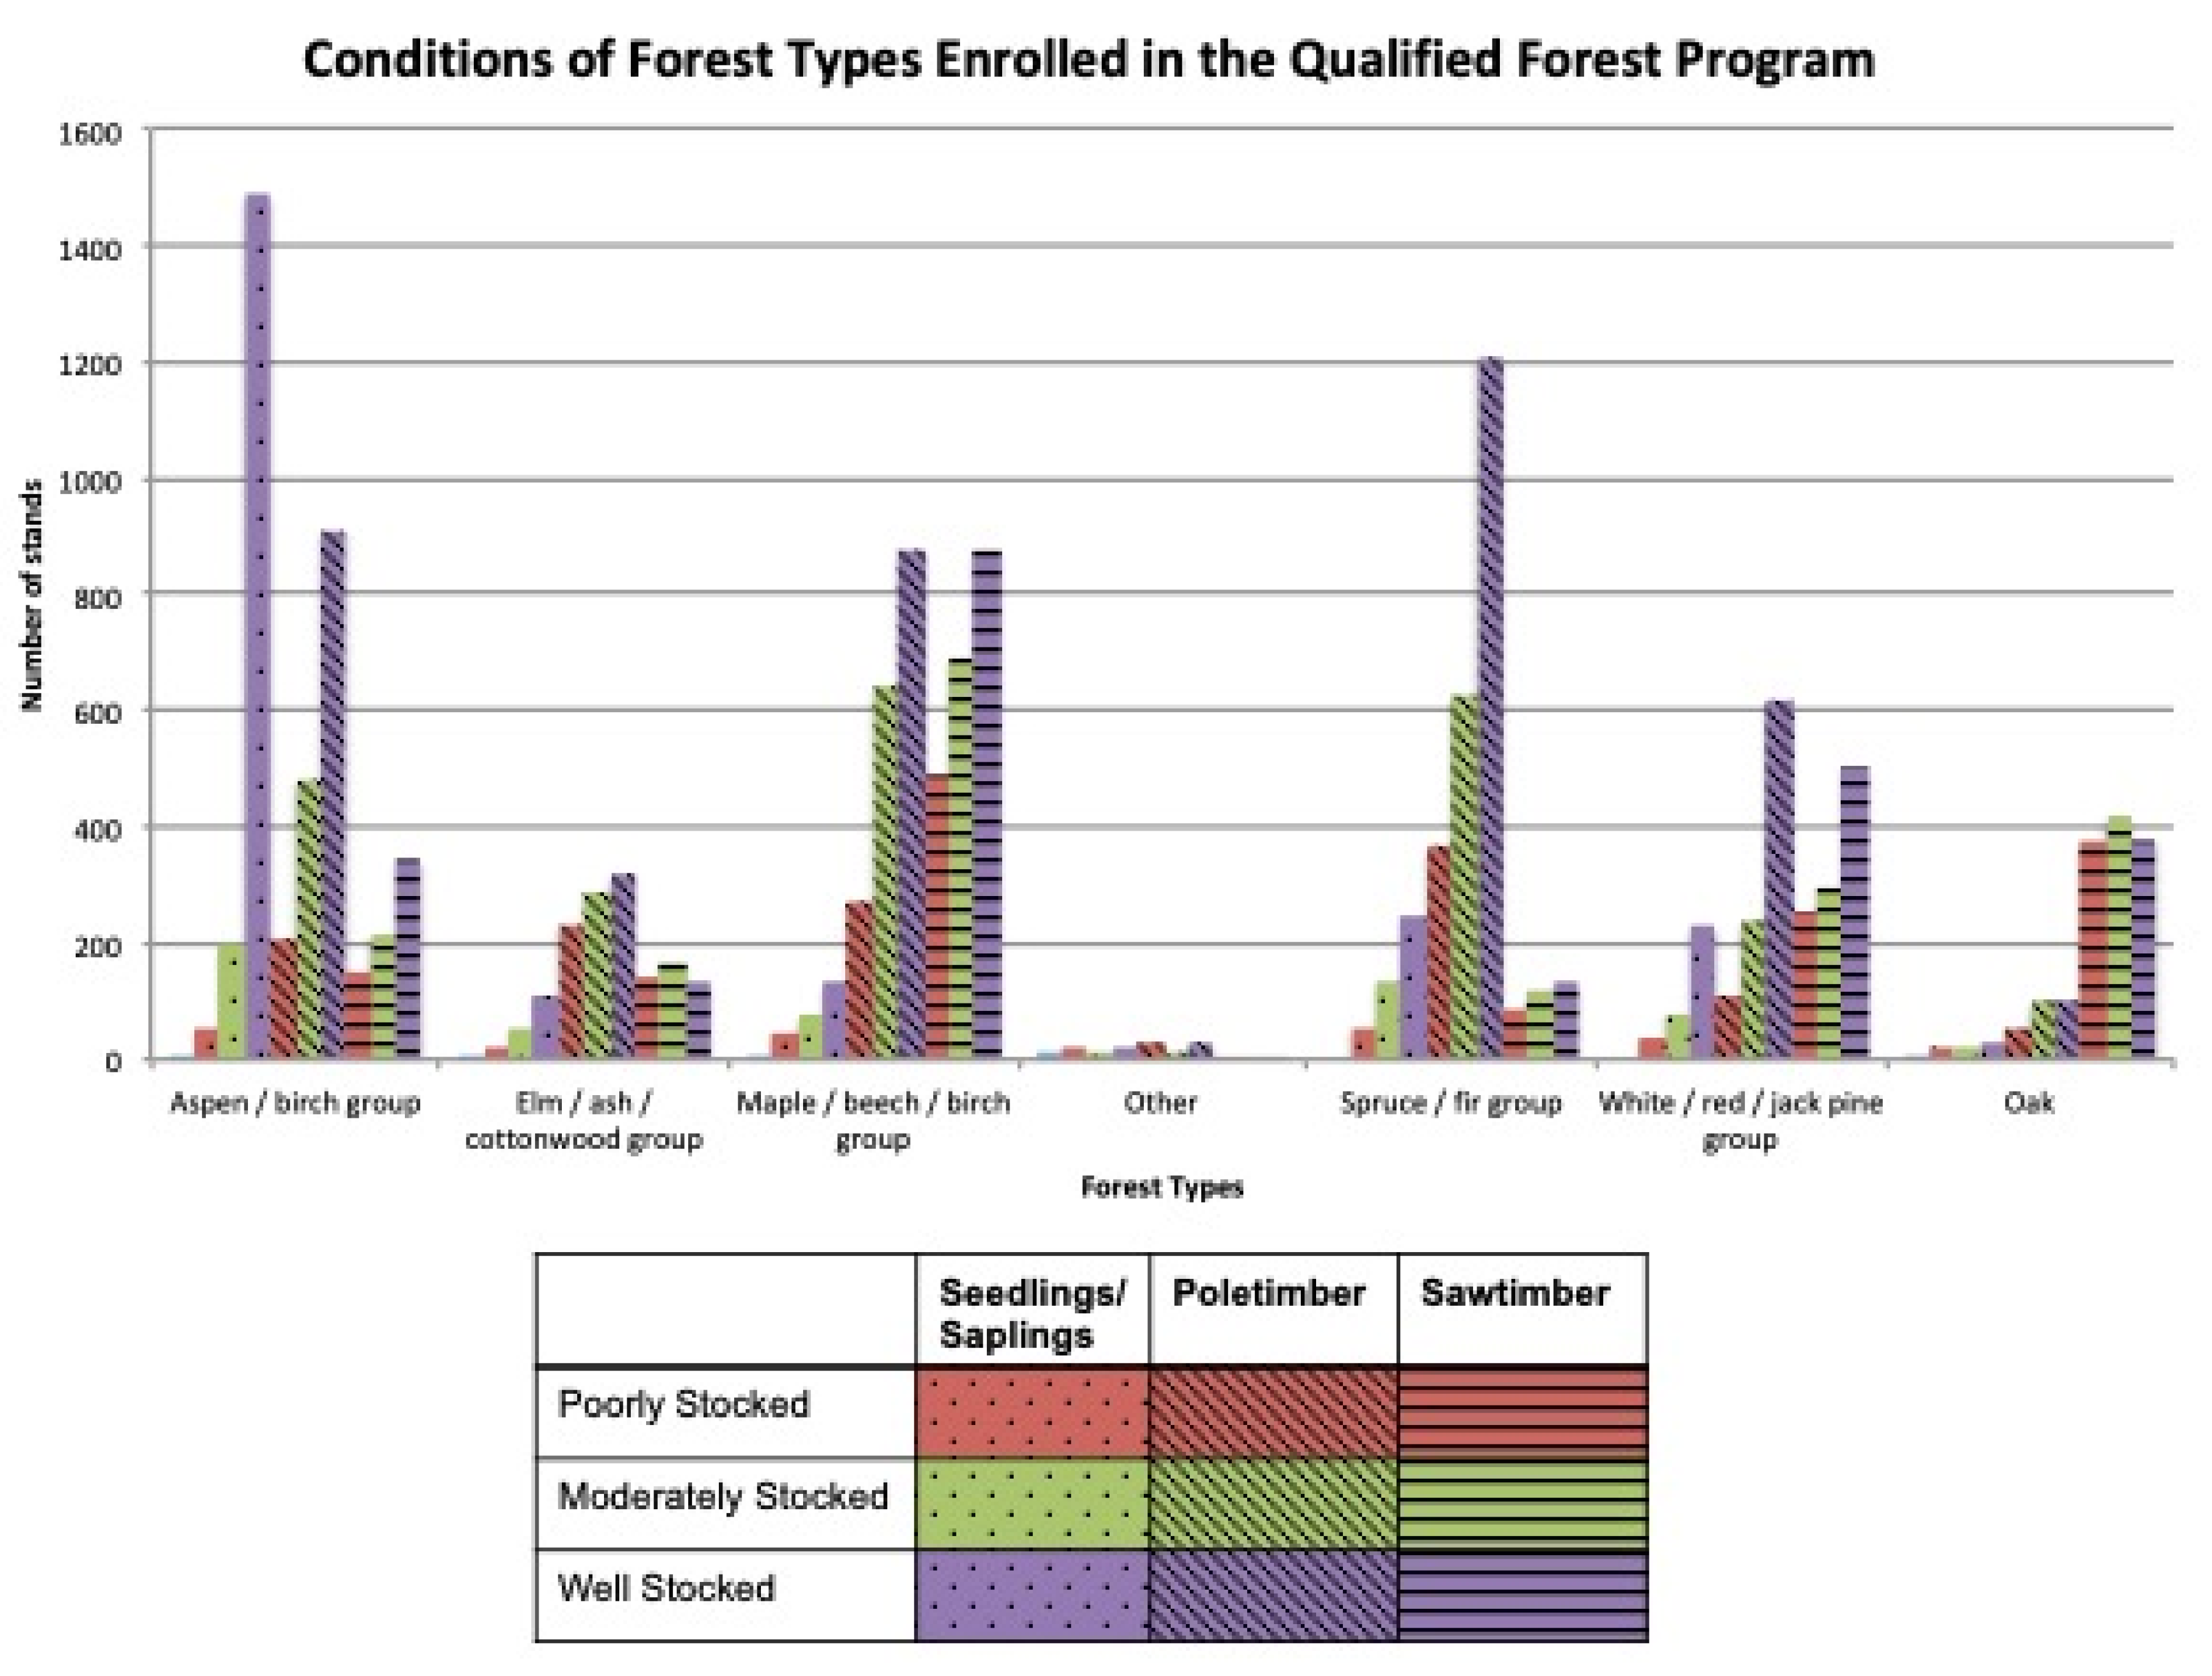
As of May 2017, the QFP had 450,555 acres enrolled and it represented forest types in seven broad groups: maple/beech/birch group (29%), aspen/birch group (23%), spruce/fir group (15%), oak group (10%), other forest types (9%), white/red/jack pine group (8%), and elm/ash/cottonwood group (7%). Forest types that are enrolled in the QFP are similar to forest type proportions on all private land in Michigan. Nearly one-third of the private land in Michigan (33.18%) and land enrolled in the QFP (29.17%) is the maple/beech/birch group (northern hardwoods). However, aspen/birch is nearly double in the QFP (23.35%) versus the proportion of private land in Michigan (12.11%). The proportion of forest types enrolled varies by the region of the state. Enrollment in the Southern Lower Peninsula (SLP), Northern Lower Peninsula (NLP), and Eastern Upper Peninsula (EUP) all exhibit similar proportions of the Northern hardwoods type (maple/beech/birch)—28%, 27%, and 29%, respectively. The plurality (46%) of forest stands that are enrolled in the program is middle-aged (poletimber). Nearly one-quarter (24%) of the enrolled stands are classified as poletimber—well stocked (
Figure 1). Sawtimber, in all densities, represents 34% of all the forest stands enrolled. The seedling/sapling class, across all densities, represents 19% of the forest stands enrolled.
Within the aspen/birch group, 37% of stands are seedling/saplings—well stocked; the most common condition in the group. Poletimber—well stocked (22%) is the second most common stand condition in the group. In the elm/ash/cottonwood group, the majority of stands are poletimber (58%). Only 6% of stands in the maple/beech/birch group are in the seedling/sapling condition. Forty-one percent (41%) of the spruce/fir group is in the poletimber-well stocked condition. Nearly half (45%) of the white/red/jack pine group is in the sawtimber condition. Oak is also quite “top heavy”, in that 79% of the group is in the sawtimber condition (
Table 1).
The aspen/birch forest type group is mostly concentrated in the northeastern Lower Peninsula and the central Upper Peninsula, with Alcona County having the highest number of acres (10,952.2). The elm/ash/cottonwood group has a similar pattern to the aspen/birch group, except that the county with the highest number of acres in the type is Delta (2168.4). Marquette County has the most acres of the maple/beech/birch group (8254.9). Alcona County contains the most acres in the oak forest type group (8465.1). Most of the spruce/fir forest type group in the central Upper Peninsula, Delta, and Menominee counties have the most acres with 9190.1 and 9458.8, respectively. The pine resource appears to be spread between two regions. The two counties with the most acres in the white/red/jack pine forest type are Osceola (1869.4) and Schoolcraft (1648.4).
Artificial regeneration is a practice that is most frequent in the eastern half of the NLP. Crawford (688.9) and Alpena (429.8) counties contain the most acres of artificial regeneration. Alcona County has the most acres of clearcut (6342.1) prescribed, with Delta County having the second most (5986.4). Most of the acres prescribed selection harvest are in the Western Upper Peninsula (WUP). Marquette (6347.3) and Menominee (5692.6) are the two counties with the most acres. Similarly, most of the acres prescribed selection harvest are in Marquette County. Marquette County also has a lot of acres that are enrolled in the program. An inappropriate interpretation would be to say that the SLP region does not have a high proportion of stands being prescribed a selection harvest, simply because they have fewer acres enrolled than the other three regions.
The multinomial logistic regression analysis determines the odds of a particular forest management practice occurring relative to some category of an independent variable. Region, stand condition, forest type, and stand acres were included as the independent variables. Stand acreage significantly increased the odds of a family forest owner selecting each forest practices. This analysis only evaluated the multinomial logistic odds with respect to one reference category: no practice. The odds of a family forest owner selecting artificial regeneration instead of no practice increases by 0.9% with each one-acre increase in stand size (
Table 2). Because the odds ratio describes a linear relationship, the odds of a family forest owner selecting artificial regeneration instead of no practice increases by 9% with each ten-acre increase in stand size.
The geographic region of Michigan can be significant in predicting forest practice. The odds of a family forest owner selecting artificial regeneration instead of no practice is 2.907 times higher when the stand is in the SLP and 2.093 times higher when the stand is in the NLP than for a stand in the WUP (
Table S1). The odds of a family forest owner selecting artificial regeneration (tree planting) instead of no practice is 1.634 times higher when the stand is white spruce/fir as compared to when the stand is aspen. In the NLP, the stand condition SS-P is significant in predicting artificial regeneration instead of no practice as compared to S-W (
Table S2). In the WUP, stand conditions SS-W and P-W are significant in predicting artificial regeneration instead of no practice when compared to stand condition S-W (
Table S3).
The odds of a selecting clearcut instead of no practice increases 0.8% with each one-acre increase in stand size (
Table 3). There is no instance where a region is significant in a family forest owner selecting clearcut instead of no practice (
Table S1). The odds of a family forest owner selecting clearcut instead of no practice is 1.714 times higher when the stand is aspen as compared to when the stand is white spruce/fir (
Table 3). The stand conditions SS-P, SS-M, SS-W, P-P, and S-P are significant in predicting the selection of clearcut instead of no practice in the EUP when compared to stand condition S-W (
Table S4). Stand conditions SS-P through S-M are significant, when compared to the stand condition S-W, in predicting clearcut instead of no practice in the NLP (
Table S2). Stand conditions SS-M, SS-W, and P-P significantly predict clearcut instead of no practice when compared to stand condition S-W in the SLP (
Table S5). Stand conditions P-M, P-W, and S-M are significant in selecting clearcut instead of no practice as compared to stand condition S-W in the WUP (
Table S3).
The odds of selecting a salvage treatment instead of no practice increases 1.3% with each one-acre increase in stand size (
Table 4). The odds of selecting a salvage treatment instead of no practice are 2.166 times higher if a stand is in the EUP and 3.413 times higher in the NLP than a stand in the WUP (
Table S1). The stand conditions SS-W and P-M are significant in predicting the selection of a salvage treatment instead of no practice in the EUP when compared to stand condition S-W (
Table S6). The odds of selecting a seed tree harvest instead of no practice increases 0.6% with each one-acre increase in stand size (
Table 5). The odds of selecting a seed tree harvest instead of no practice is 1.347 times higher for a stand in the WUP than a stand in the EUP, 1.367 times higher than a stand in the NLP, and 1.533 times higher than a stand in the SLP (
Table S7). The seed tree harvest practice had few significant results. The odds of a family forest owner selecting a seed tree harvest instead of no practice is 9.685 times higher in a lowland poplar stand than in a white spruce/fir stand, and 18.985 times higher when the stand is mixed lowland conifers as compared to a white spruce/fir stand (
Table 5).
The odds of selecting thinning instead of no practice increases by 0.8% with each one-acre increase in stand size (
Table 6). The odds of selecting thinning instead of no practice is 3.166 times higher when the stand is in the NLP and 2.610 times higher in the SLP than when the stand is in the WUP (
Table S8). Stand conditions SS-M, SS-W, P-P, P-M, P-W, and S-M are significant in predicting thinning instead of no practice as compared to stand condition S-W in the EUP (
Table S9). Stand conditions SS-P through P-W are significant, when compared to stand condition S-W, in predicting a thinning instead of no practice in the NLP (
Table S10). Stand conditions SS-P through P-M and S-P are significant, when compared to stand condition S-W, in predicting a thinning instead of no practice in the SLP (
Table S11). When compared to stand condition S-W, stand conditions SS-M through P-M significantly predict thinning instead of no practice in the WUP (
Table S12).
4. Discussion
The Federal government, states, and nongovernmental organizations (NGOs) attempt to incentivize family forest owners in order to actively manage their woodlands. These incentive programs can include property tax reductions, forest management planning, financial assistance for implementing conservation practices, and technical assistance. In this paper, we used the QFP in Michigan to understand the relationship between parcel characteristics and the enrolled landowners’ behaviors. While using forest types as one of the indicators, we found that the maple/beech/birch group characterizes the highest proportion of enrolled forest types (29%) and the highest proportion of forest types on all private land in Michigan (33%). This forest type often exists on productive sites and it can offer the highest and most frequent return on investment in the form of income from timber products, thus we expected family forest owners with this forest type to be more interested in active management. Family forest owners with productive, high-value forest types might be more inclined to participate because of the strict QFP requirement to conduct forest management activity according to the written plan. Potentially, these high-quality forest types have the lowest risk for non-compliance, due to a lower likelihood of having non-marketable timber.
The elm/ash/cottonwood group ranks the second most common forest type on private forestland in Michigan (13%), but seventh in the QFP (7%). The elm/ash/cottonwood group, which is commonly referred to as lowland hardwoods, is a forest type that is not known for high-value forest products. This low value is compounded by the mortality and stand degradation that are caused by the Emerald Ash Borer (
Agrilus planipennis) [
20], an exotic invasive pest of North American ash trees, and Dutch Elm Disease [
21], a vascular disease of elm (
Ulmus spp.), caused by a fungus (
Ceratocystis ulmi). Thus, these forest types might not meet the productivity standard that is defined in statute of being capable to produce 20 cubic feet of wood per acre per year.
The aspen/birch group (
Figure 1) makes up a proportion that is 11% less on QFP enrolled land than on private land statewide. The forest products market for the aspen/birch type throughout much of the state suggests that enrollment would not risk compliance issues. In 2016, aspen represented 20% of the state’s total cords that are processed by primary mills and 14% of the total board foot volume processed by primary mills [
22]. Michigan is home to pulp-producing mills (Packaging Corporation of America, Verso Corporation) and composite board-producing mills (Decorative Panels International, Louisiana-Pacific Corporation, and Weyerhaeuser) that specifically utilize large volumes of aspen.
The breakdown of stand condition within each species group shows that 37% of the aspen/birch group is well-stocked seedlings/saplings. Only 5% of the group is sawtimber —well stocked and only 22% is poletimber—well stocked. This could lead to a figurative “pig in the python” scenario, where production from QFP lands on this forest type is relatively low for a number of years and, then, as the type reaches maturity, a much greater amount is put up for sale in a small cluster of years. The condition of the oak resource on QFP land is another example. More than three-quarters (79%) of the type is in the sawtimber size class. As these stands are harvested, there may be societal demands for oak stands to regenerate for long-term financial, wildlife, and biodiversity concerns. The lack of stands in the two smaller size classes may cause similar short and medium-term issues. The majority (58%) of stands in the elm/ash/cottonwood group are in the poletimber size class. Forest health issues clouded the future of this type. Ash (Fraxinus) and elm (Ulmus) species are both troubled by non-native insects and diseases, such as emerald ash borer (Agrilus planipennis) and Dutch elm disease (Ascomycota), which puts future forest cover in jeopardy.
The size of a forest stand was significant in predicting all forest practices on QFP enrolled land. This is consistent with literature that finds the size of holding is related to a spectrum of management behaviors and decisions [
1,
5]. The largest odds ratio for stand acres is when selecting a salvage treatment (1.3% with each one-acre increase in stand size) (
Table 4). Salvage treatments are conducted in an effort to take advantage of available wood fiber directly after an event that causes the loss of wood volume and/or quality [
23]. For example, many salvage treatments in Michigan occur after a forest health issue, such as an insect infestation, kills many trees on a large landscape. The relatively elevated odds of selecting a salvage treatment with an increase in stand size on QFP enrolled land makes intuitive sense. The quality and volume of wood fiber per unit of area is generally lower for stands that qualify for salvage treatments, by definition. Because of this, one might argue that a greater amount of area is required in order to compensate for less volume per acre and make a timber sale attractive to a potential buyer. Professional forest management plan writers determine the forest stands. The program requires forest management to be conducted on any given parcel. Markets and access often drive forest management. It is reasonable, then, to posit that foresters delineate stands and prescribe forest management practices that are economically viable as well as ecologically justified.
The odds of a family forest owner choosing artificial regeneration instead of no practice is 2.907 times higher in the SLP than in the WUP (
Table S1). The WUP is almost entirely forested, while the SLP is a mosaic of forests, grasslands, farms, and urban environments. It is possible that there are simply more acres available for tree planting in the SLP, because it is not all already in forest cover. The nomenclature of the practice can cause confusion. Artificial regeneration suggests that the practice is an attempt at reforesting a stand after some other management activity. It is possible that some of the participants are using the term artificial regeneration as a means of afforestation.
The availability of financial assistance to conduct tree/shrub plantings through the USDA Natural Resources Conservation Service (NRCS) is a related justification. While this funding is available to all farmers, ranchers, and forestland owners, farmers commonly participate because of their familiarity with the involved federal agencies and programs [
24]. Forest (timber) stand improvement is another forest conservation practice funded through the NRCS. That might be why the odds of selecting that practice are 10.914 times higher in the SLP than the WUP.
The fragmented nature of forests in the SLP as compared to the WUP is another explanation. This might play a role in the ability to market the harvested material that is removed in a traditional timber stand improvement. The removal of the same material in the WUP might make its way into a normal commercial timber harvest, which might prompt the plan-writing forester to use another silvicultural term, such as selection harvest.
The multinomial logistic regression with a stand type as the independent variable was conducted at a statewide scope. As one considers the “normal” silviculture associated with each forest type, many of the results are intuitive. For example, aspen (Populus spp.) is a forest type that is not normally propagated by planting, rather by even-aged methods of overstory removal, which allows for the aspen root suckers to grow into new stems.
Some stand types yielded less intuitive results. The lowland poplar (mostly
Populus balsamifera) type had an odds ratio of 3.974 for selecting artificial regeneration instead of no practice (
Table 2). This is difficult to understand, because the lowland poplar type usually exists in wet areas that are not well suited for easy planting, and the trees are somewhat short-lived, and they grow quite fast. The wood is not particularly sought after by the forest products industry. The low number of observations for this stand type (n = 213) is one justification for this phenomenon.
Clearcutting is a common practice across the regions and in may forest types. We expected a higher likelihood of this type and practice than was reflected in the data and, after reviewing the proportion of aspen stands in the seedling/sapling size class, it is logical. Over the program’s maximum 20-year forest management-planning period many aspen stands may not be economically mature enough to warrant a timber harvest. The statewide county mapping for forest practice and forest type demonstrated that Alcona County has the highest number of acres in the aspen/birch type, as well as the highest number of acres that are prescribed clearcut. A northern hardwoods stand is 781.8% more likely to have a selection harvest than no practice (
Table 7). This is a common silvicultural practice in a northern hardwood type. The result is likely to be indicative of both forestry norms and the societal desire to see big trees and minimal site disturbance in forested ecosystems. The current challenges in northern hardwood regeneration might begin to skew this type to another, more uneven-aged management technique in an effort to successfully recruit shade intolerant species as well as combat the increased white-tailed deer (
Odocoileus virginianus) numbers in the state.
Stand conditions did not appear to be significant in a statewide analysis. However, when the data were regionally aggregated, certain stand conditions did become significant in selecting certain forest practices. Again, this might have to do with available markets for forest products within a region. Intuitively, stands with a higher overall volume relative to the size of trees within the stand (conditions SS-W, P-W, and S-W) might be more likely to be harvested, because the higher volume could be seen as attractive for timber producers. Additionally, stands with relatively smaller trees (conditions SS-P through P-W) can only be marketed when a use for products that use smaller-diameter roundwood exists within the region. For example, the SLP contains virtually no market for pulpwood and other small-diameter tree products. It can be difficult for family forest owners that are interested in forest management to find markets for their small diameter material, which can reduce their ability to conduct forest management in the absence of technical and financial assistance.
Other variables could be helpful in an analysis of family forest owner behavior. The year that enrolled stands have a planned harvest would provide some further insight to the management of forestland that is enrolled in the QFP. The planned harvest year could be categorized by the following conditions: “harvest shortly after plan development”, “harvest in near future”, and “harvest in distant future”. Dividing harvest years into these categories might tell us something about whether family forests are currently at harvestable volumes and values, or whether the enrolled lands are relatively “young” when compared to non-enrolled family forests or those in other ownerships. It might also indicate the level of management intensity that family forest owners are willing to engage in. These data are available for each forest stand enrolled in the QFP and are easily accessible from MDARD’s database. There were not included in this analysis because they are outside of the focus of evaluating parcel characteristics with respect to forest management practices.
Additionally, it is worthwhile to note the limitations of our study. This study could be extended to combine with forest management plan writer interviews in order to determine whether harvest year reflects forest age or some social reason instead. A more thorough examination of the significant relationships might yield stand and parcel characteristics that could be selectively utilized in unique regression equations. The forest management plan writer is another variable that could have substantial effects on forest practice; both at the time of plan development and implementation. Forest management plan writer data are collected in the program’s database and then assigned to each parcel at the time of application. Critics of the QFP often claim that the program only provides a tax incentive to those already managing forestland. It is unclear to them as to whether the program has enticed family forest owners that were not already practicing forest management. This is difficult to infer in the present study, and it might require a combination of analyses, including surveys to participants and non-participants.
5. Conclusions
This study informs the growing literature on family forest owner behavior and participation in conservation programs. The results have demonstrated that, in certain cases, stand and parcel characteristics can predict forest practice. Characteristics, such as size, condition, type, and region, each play a unique role in influencing the outcome of a forest management decision. We hypothesized that parcel size, forest type, and geographic location would predict forest practice, based on past findings, which was indeed the case. This indicates that forest practice is best understood by combining location, species type, and size of ownerships. These factors may also relate to the decision to manage forests more broadly, but this understanding is beyond the scope of the present study. We have intentionally not provided an evaluation of the effectiveness of the QFP in achieving its goals. Additional research should be implemented in order to support such an evaluation, by pairing management outcomes with intended program goals, and comparing these outcomes across enrolled and non-enrolled family forest owners.
Several implications can be drawn from this study. The results can be used in order to make observations regarding QFP participants; however, its application to non-enrolled family forest owners is still uncertain. As participation in QFP grows, one might argue that it either more closely represents all family forest owners, because the program will make up a greater proportion, or that the tax break and available technical assistance through Michigan’s conservation districts are changing behavior, such that similarities cannot be drawn. These hypotheses can be investigated in future research. A similar analysis of family forests that are outside the QFP might help to strengthen those claims in either direction, but the difficulty of acquiring data outside of a voluntary government program might be prohibitive. Cutting-edge forestry technologies might make acquiring these data for all private land more feasible in the future. The parcel characteristics outlined in this analysis can be determined through objective observation, and they do not necessarily require interaction with the landowner. Aerial photo interpretation and other remote sensing technologies might be used in order to acquire the data quickly and inexpensively, although these methods might bring up other concerns, such as privacy.
Near the end of developing this paper, the QFP experienced a change in law that will take effect on 3 March 2019. Among the changes, one was the removal of the maximum number of acres that a landowner can enroll per tax-collecting unit of government, which was previously 640 acres. This has the potential to rapidly increase enrollment, as large landowners are able to enroll the remaining portions of their ownerships that were previously excluded. Another major change was the increase of the statewide program maximum acreage to 2.5 million acres from 1.2 million acres. It will be critical to study these changes, and their effect on family forest owner behaviors, and the resulting ecosystem services provided by these private forests. It is important that academic institutions and government agencies continue to study taxation program enrollees, because of its large impact on forest conservation and natural resource management. Conservation programs that are similar to the QFP have the potential to conserve and protect forest landscapes that are economically important, for communities that rely on the forest products we use every day; environmentally, to preserve critical ecosystem functions and rare plant communities; and, socially, in order to maintain forests that positively affect humans and their networks. With this contribution to the literature, practitioners have a new tool to aid in evaluating the conservation programs that promote these values.


