Article

Soil Biodiversity as Affected by Different Thinning Intensities in a Pinus laricio Stand of Calabrian Apennine, South Italy

AGRARIA Department, Mediterranea University, Feo di Vito, 89124 Reggio Calabria, Italy
*
Author to whom correspondence should be addressed.
Forests 2021, 12(1), 108; https://doi.org/10.3390/f12010108
Submission received: 4 December 2020 / Revised: 2 January 2021 / Accepted: 15 January 2021 / Published: 19 January 2021

Abstract

:
Forest soil biodiversity, which drives natural ecosystem multifunctionality, can be altered by incorrect forestry management practices. Pinus laricio is the most representative and widespread conifer species in Calabria, South Italy, and appropriate management is needed to maintain Pinus laricio forest for its great economic and natural value. In Europe, thinning is considered the most effective silvicultural treatment to maintain/increase the ecological value of coniferous stands. In this study, moderate thinning (MT), intense thinning (HT), and clear cut (CC) treatments were used to manage Pinus laricio stands with the aim of identifying the thinning intensity that is less detrimental to soil biodiversity. The effects of the different thinning intensities were evaluated, in two contrasting seasons (summer and winter), on the abundance, and diversity of arthropods, fungi, and bacteria colonies as well as on selected soil properties (organic matter, humification index, bulk density, pH) related to soil habitability. Results evidenced that the abundance, species richness, and diversity of arthropods, as well as fungi, bacteria colonies, and soil properties, changed with the treatments and seasons. Under HT, the greatest biodiversity and the highest amounts of arthropods, fungi, and bacteria were found in both seasons. This study finds evidence for Connell’s intermediate disturbance hypothesis, highlighting that the greatest organic carbon content and humification index, as well as the lowest bulk density, found in HT reduced the likelihood of competitive exclusion between occurring species, thereby promoting high species richness and diversity. This study gives insights into ecological relationships between understory composition related to tree species abundance and soil community.

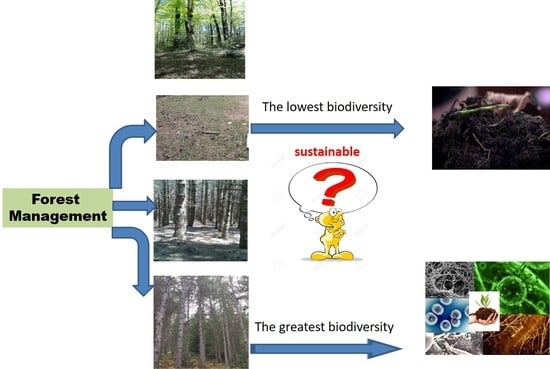
Graphical Abstract

1. Introduction

Among forest management techniques used to preserve forests, thinning is the practice that removes a small number of trees from a stand [1,2] in order to make sites more productive, thereby driving the abundance and composition of undergrowth vegetation and increasing the economic value of forests. Sometimes, when improperly used, silvicultural treatments can cause disturbances to the forest equilibrium, affecting species succession, understory vegetation distribution, and soil ecosystem functioning, with negative potential impacts on tree growth [3,4], forest community structure, species composition, habitat conditions, and soil fertility [5,6]. Thinning, which changes light penetration, air movement, and temperature [7,8], affects litter and organic matter amounts [9,10], soil nutrient cycles, soil microorganisms [11,12,13], and arthropod communities [14,15]. All of these factors taken together regulate soil fertility [16]. Soil microorganisms have an essential role in soil organic matter decomposition [17] and in nutrient cycling and are considered early warning indicators of changes in soil properties on account of their high sensitivity to external perturbation [9]. Arthropods, with their 1.2 million species, are litter transformers and pulverizers [18,19], contributing to improving soil physical and chemical properties [20,21,22]. Because of their high abundance, species richness, habitat fidelity [23], and high sensitivity to external perturbations, arthropods are considered important bio-indicators of environmental quality and can be used for monitoring short-term changes in soil ecosystems. For the above considerations, changes in forest vegetation related to thinning are expected to affect soil quality through changes in microbial and arthropod communities. Previous works evidenced that soil microorganisms were affected by gap creation in forest [24,25,26,27], highlighting that small gaps (185 m2) created the best environmental conditions for microorganism growth. Kwon et al. [28] showed that there were no differences in the total arthropod amount between thinned and unthinned areas because the differences were annulled by the increase or decrease in taxa abundance. Richards and Windsorf [29] showed that arthropod biodiversity was positively related to humidity, while arthropod abundance was negatively correlated with light intensity. At present, studies on the relationships between arthropod abundance and biodiversity, plant distribution, and soil abiotic factors are still scarce, even if this information is essential for understanding soil processes linked to site productivity. Pinus laricio is an endemic species in Calabria, South Italy, with great value for the local economy and deserves an appropriate management to avoid triggering forest degradation and accompanying soil fertility losses in areas already subjected to climatic changes. For the above consideration, a 60-year-old old Pinus laricio stand was managed with thinning treatments of different intensities (moderate thinning (MT) and intense thinning (HT)) and clear cut (CC) in order to identify the better silvicultural practice for preserving the quality of the soil and the multifunctionality of this forest. Based on the intermediate disturbance hypothesis, which suggests that at low levels of disturbance more competitive organisms will dominate the ecosystem and push subordinate species to extinction [30], our starting hypothesis was that different thinning intensities would differently affect soil biodiversity and fertility. Our specific aims were to (1) assess if and how different thinning intensities can be the cause of changes in microorganisms, arthropods, and soil properties, and (2) explore the relationships among microorganisms, arthropods, and soil properties in differently thinned plantations.

2. Materials and Methods

2.1. Study Area

This study was conducted in Aspromonte Mountain (Zervò, Calabria, South Italy) (38°14′37″ N; 16°01′11″ E), 1100 m above sea level in a 60-year-old Pinus laricio forest. The study area was approximately 45 ha. Four study areas were established: no thinning (15 ha) (CTR: with 1935 tree ha−1); moderate thinning (10 ha) (MT: 25% basal area (BA) removed, 1354 tree ha−1); intense thinning (10 ha) (HT: 45% BA removed, 780 tree ha−1); and clear cut (10 ha) (CC: 100% thinning, 0 tree ha−1). Five plots in each of the four study areas were designed. Each plot in the CTR was 3 ha, while in the MT, HT, and CC each plot was 2 ha. Thinnings were designed to reduce stand density, removing all the trees present in the stand. To preserve the soil during logging operations and to minimize the crossing of the tractor on soil, the “full-tree harvesting method” was used with the aid of tractor and cable winch. Homogeneous features regarding the slope, exposure, elevation, and climate conditions characterize the study area. The area’s climate is typically Mediterranean, with mean annual precipitation of 1838 mm, and total precipitation occurring from October to June. Mean annual temperature is about 10 °C, and the lowest and highest monthly mean temperatures are 3 °C in January and 17 °C in July, respectively (climate data from Santa Cristina d’Aspromonte Meteorological Station). The areas appertain to the Castanetum zone, according to Pavari’s phytoclimatic classification [31]. The soil, with a xeric soil regime moisture, generated from schist and biotitic gneisses, was classified as Humic Cambisols, according to the IUSS (International Union of Soil Science) WRB (World Reference Base for Soil Resources) [32]. The forest management operations of this study area started in 2010.

2.2. Measurement of Microclimatic Variables

The microclimate in the gaps was assessed by measuring air temperature, soil temperature and moisture, and photosynthetically active radiation (PAR, measured at 400–700 nm). PAR was detected on clear days, at 12:00 p.m. in each plot for all treatments. PAR was measured by using a Ceptometer (AccuPAR, Degagon Devices Inc., Pullman, WA, USA), at 1.00 m above the ground, with the instrument held horizontally [33]. Corresponding PAR values were used to calculate PAR transmittance using the following formula: PAR transmittance = (PAR subplot/PAR full open) × 100. Soil temperature was measured using a soil thermometer (Elite Greenhouses Ltd., Lancashire, UK). In addition, litter thickness was measured using a millimeter scale.
Understory vegetation information was collected in the study area by using standardized photographs of the forest understory. A sample dataset of photographs was taken in each plot (within 20 × 20 m quadrat) in each study area. The photographic images were taken at a resolution of 5184 × 3456 pixels in JPG format. We used a Canon EOS Rebel T5RM camera (Melville, New York, NY, USA). The distance between the camera and the ground was 3 m. The understory vegetation was visually identified.

2.3. Experimental Design

In each plot, three soil samples were taken randomly. Soil samples were collected at 0–10 cm depth (within a 20 × 20 m quadrat) after removing the litter layers for two consecutive years and in two different seasons (Spring, June 2014–2015 and Autumn, November 2014–2015). Each year, 120 samples were collected. The samples were brought to the laboratory on the same day, and soil water content (WC), soil fauna, fungi, and bacteria were detected in fresh soil within 24 h of sample collection. A part of the soil samples was air-dried and sieved through a 2-mm diameter mesh; visible roots were removed. The results of the two years did not show significant differences and for this reason the data were not included in this paper.

2.4. Soil Chemical and Physical Analysis

Soil texture was detected by using the hydrometer method with sodium hexametaphosphate as a dispersant [34]. The final classification was done using the USDA triangle method. Soil water content (WC) was determined by oven-drying soil samples at 105 °C until they reached a constant weight. The moisture content (%) was calculated from the sample weight before and after drying. pH was tested using a soil:water suspensions ratio of 1:2.5 (w/v). Immediately after the addition of the water, the suspensions were thoroughly mixed on an orbital shaker for 2 h, and pH readings were taken after sedimentation. Organic carbon (OC) was determined by dichromate oxidation method, according to Springer and Klee [35]. Organic carbon was quantified by titration with iron-sulfate (FeSO4, 0.2 N).
The determination of humic acid, fulvic acid (HC, FC), and humification rate (HR) was performed according to Ciavatta and Govi [36]. Bulk density (BD) was measured by taking samples of soil using a corer with a 250 cm3 volume. The samples were weighted and dried (105 °C) until they reached a constant mass; to obtain the BD value, the total dry mass was divided by the sampled volume was by.

2.5. Soil Microbial Analysis

Bacteria, fungi, and actinomycetes were extracted by adding 95 mL of 0.1% (w/v) sodium pyrophosphate solution to 10 g of each soil sample. This solution was decimally diluted (10−1 to 10−7), and aliquots were plated on specific agarized culture media [37]. Bacteria and fungi colony forming units (CFU) were counted, according to Picci and Nannipieri [38] and Eaton et al. [39].

2.6. Soil Fauna Determination

The Berlese–Tullgren funnels method for the extraction of soil arthropods was performed as previously reported in Berlese [40] and Bano and Roy [41]: soil samples were placed on a sieve mesh at the top of each funnel selector for 7 days and collected in a beaker with preservative liquid with 70% ethanol and glycerol 2:1 v/v) under the funnel. Soil arthropods have a great impact on organic debris, microbial decomposers, nematodes, roots, and pathogenic fungi. Soil arthropods respond in a sensitive way to soil changes and are correlated with healthy soil functions [22]. Due to the limits of the method, morpho-species, not true species, of arthropods were identified, classified, and counted using a stereomicroscope [42]. Larvae and imago belonging to the same taxonomic group were grouped together [43,44,45]. Specie richness was estimated and discussed in terms of parataxonomic units.

2.7. Data Analysis

The analyses were repeated five times. All datasets were tested for normality using Shapiro–Wilk and Jarque–Bera tests. Soil micro-arthropod biodiversity was calculated by using Shannon and Pielou’s evenness indices [46,47], and species richness was calculated by counting the number of species present in each soil sample, as reported in Whittaker [48]. All statistical analyses were performed using Systat v. 8.0 software package (SPSS Inc., Evanston, IL, USA). Tukey’s test [49] was used to compare treatment means and to determine which means differed significantly at p ≤ 0.05. Analysis of variance (one-way ANOVA) was utilized to test the differences among the treatments, while two-way ANOVA was used to detect the relationships between treatments and seasons. Significant differences and effects were determined as p ≤ 0.05.
The results are summarized in an ordination diagram. PCA was carried out using the environmental variables, arthropods, and soil parameters under different silvicultural treatments and seasons, using the software PAST [50]. Because the data are expressed in different units, the results are standardized with the following formula:
z = x i x ¯ S D
where xi is the individual value of each parameter, x ¯ is the mean, and SD the standard deviation.

3. Results and Discussion

3.1. Microclimate Variables

Microclimate parameters were significantly different between the silvicultural treatments (Table 1). PAR was representative of light levels at solar noon, and it was the highest in summer. PAR transmittance significantly increased with increasing tree cutting. Air and soil temperatures were greater in summer than in winter. Soil temperature was the highest in the CC plots in summer followed by HT, MT, and CTR plots. In winter, the highest soil temperature was detected in HT plots. Litter thickness was always greater in the HT plots in both seasons compared to the other treatments (Table 1), suggesting that the microclimate changed in respect to the canopy closure and influenced the understory vegetation, both in terms of the amount and typology (Table 1).
In HT plots, we found the greatest understory biodiversity expressed by Brachypodium sylvaticum (Huds.) Erica arborea L., Dactylis glomerata L. subsp. Glomerata, Oxalis acetosella L., Pteridium aquilinum L., Kuhn subsp. Aquilinum, and Rubus hirtus. In CC and MT plots, we found Erica arborea L., Genista sagittalis L., Rubus hirtus, and Fragaria vesca L. subsp. Vesca. Conversely, in CTR plots, understory vegetation was absent.

3.2. Soil Chemical and Physical Features

Soil texture was sandy-loam, with 10% silt, 8% clay, and 82% sand (data not shown). Water content was significantly higher in winter than summer in CC, CTR, MT, and HT plots. CC plots had the highest WC value in winter and the lowest value in summer (Table 2). This depended on the reductions in trees, which caused excessive infiltration of rainwater in winter and excessive water evaporation in summer. Conversely, in plots of the other silvicultural treatments, canopy shade reduced the amount of total soil water evaporation, as previously observed by Stormont [51]. pH was moderately acidic and did not differ significantly among the treatments and seasons (Table 2), confirming the typical acidic nature of the soil under conifers [52]. OC was the highest in summer in all the treatments, evidencing that seasonality has great influence on OC accumulation (Table 2). The greatest amount of OC was detected in HT plots in both seasons (Table 2). Regarding humic and fulvic acids (HC, FC) the highest values were found in summer for all the treatments. In the managed soils and in CTR plots, the HC was significantly higher than FC, indicating that in all the experimental areas the humification process prevailed in respect to the mineralization process. HT plots showed the greatest HC values in both seasons. No significant differences were observed between the two seasons for the humification rate (Table 2); the greatest HR values were detected in HT plots in both seasons. The components of soil organic matter are sensitive to climatic changes and to site-specific factors such as stand productivity, vegetation management, and land use history. Our results evidenced that treatments, more than seasons and their interaction, influenced the humification process (Table 2). In HT plots, we found the greatest carbon storage and the best humification process in both seasons, as shown by the highest values of humification rate and HC [53,54,55]. Carbon storage increased in HT plots due to the low tree density, which determined a different regime of light, temperature, and humidity at soil level. All of the above factors contributed to increases in understory herbaceous vegetation growth, which in turn produced more easily degradable litter with a consequent increase in OC. Bulk density was significantly different among the treatments, both in summer and in winter, with the lowest values (<1 g cm3) in HT plots (Figure 1). In MT, CC, and CTR plots, bulk density was always >1 g cm−3. Bulk density was more influenced by treatments than season and their interaction. It is well known that bulk density is directly correlated to soil compaction and consolidation, and it is highly and inversely correlated to soil organic carbon content [56,57]. Our data, in agreement with findings of other authors [56,58], evidenced the strongest negative correlation between bulk density and organic matter in HT plots, with the lowest BD and the highest OC in both seasons. Additionally, species richness, fungi and bacteria colonies, and soil bulk density were significantly negatively correlated. In both seasons, populations of soil aerobic bacteria, fungi, and arthropods decreased when bulk density increased.

3.3. Soil Microbiological Features

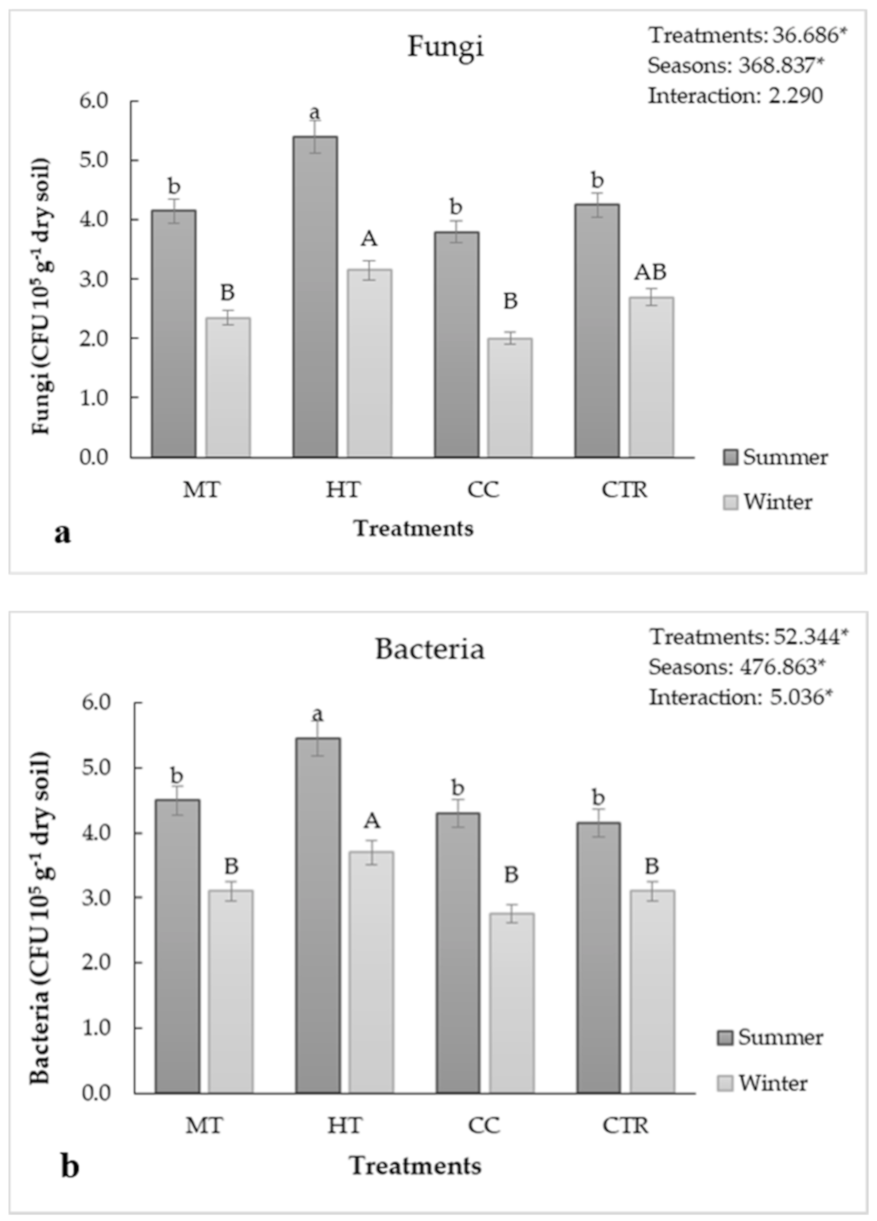
Soil bulk density and organic matter influenced fungi and bacteria colonies, which in each plot, were mainly present in summer (Figure 2), the season with the highest light and temperature at ground level. The highest number of colonies was detected in HT plots, where the lowest value of BD and the highest values of OC and HC were detected. The lesser amounts of microbial life in the other treatments was due to the negative impact of soil compaction on soil water/air ratio, which consequently affected the aerobic soil bacteria and fungi, as previously reported by Li et al. [59].
Biotic factors, in terms of resource quality and availability, have been always considered the main drivers of fungal and bacterial fluctuations in soil [60]. In this work, we consider light (via seasonality) (Table 1) and abiotic factors, which differed in the study area under different management intensities, to be equally important in steering the variations in soil communities. The greater intensity of light, temperature, and humidity detected in HT plots compared to the plots of the other treatments were the cause of the major increase in understory vegetation diversity, which in turn promoted the proliferation of soil fungi and bacteria colonies, as previously reported by Swenson et al. [61].

3.4. Soil Biodiversity

Results indicated that soil biodiversity was not affected by logging residue removal; no negative effects on biodiversity (i.e., species richness or viability of populations) occurred in soils of thinned plots and in particular in soils of HT plots compared to control plots. Our data are in agreement with numerous studies reporting that tree removal operations do not affect soil population. Victorsson and Jonsell [62] and Taylor and Victorsson [63] evidenced that, at stand level, wood residue extraction reduced only the number of dead wood-dependent beetle species and soil invertebrates.
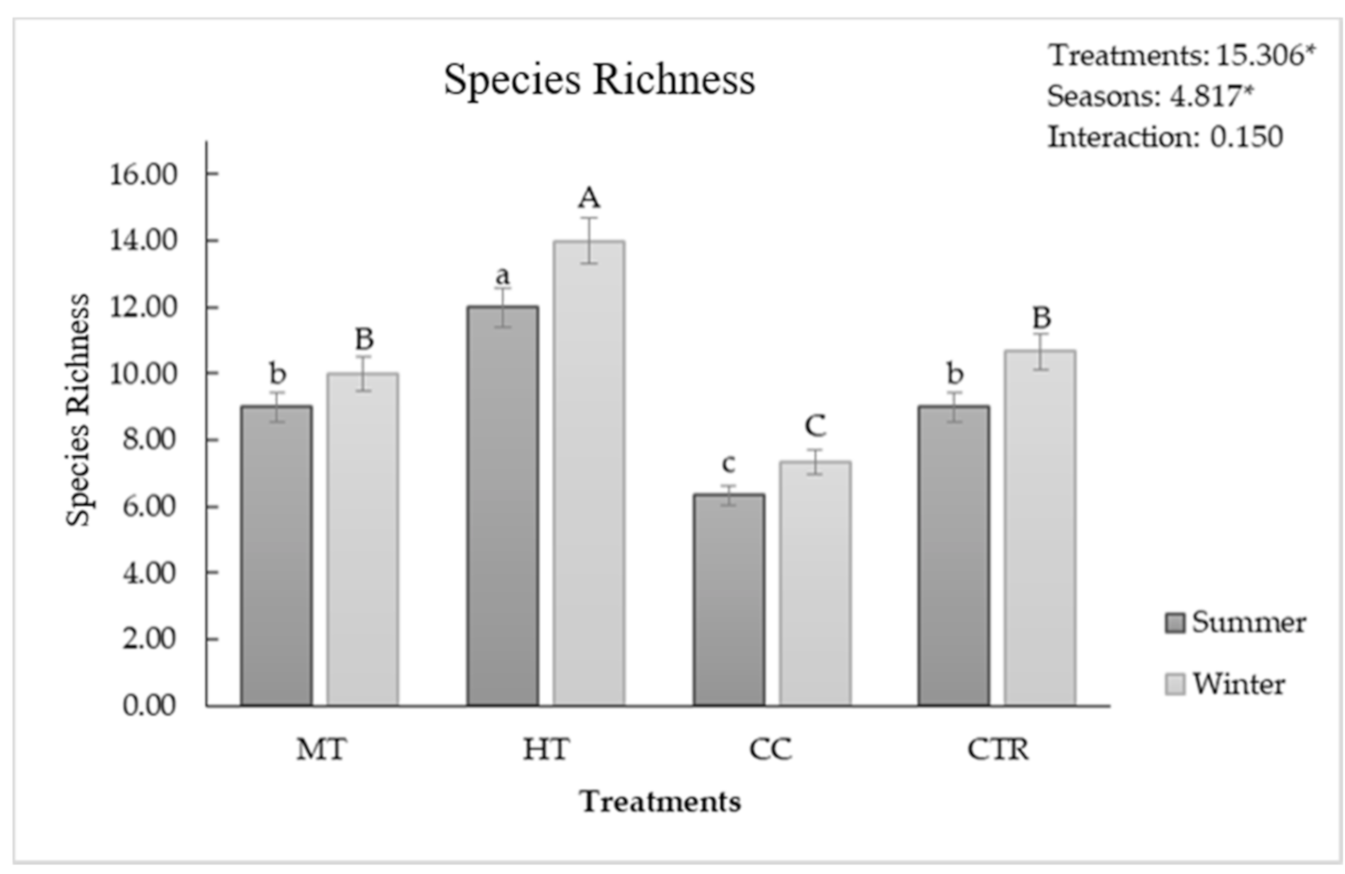
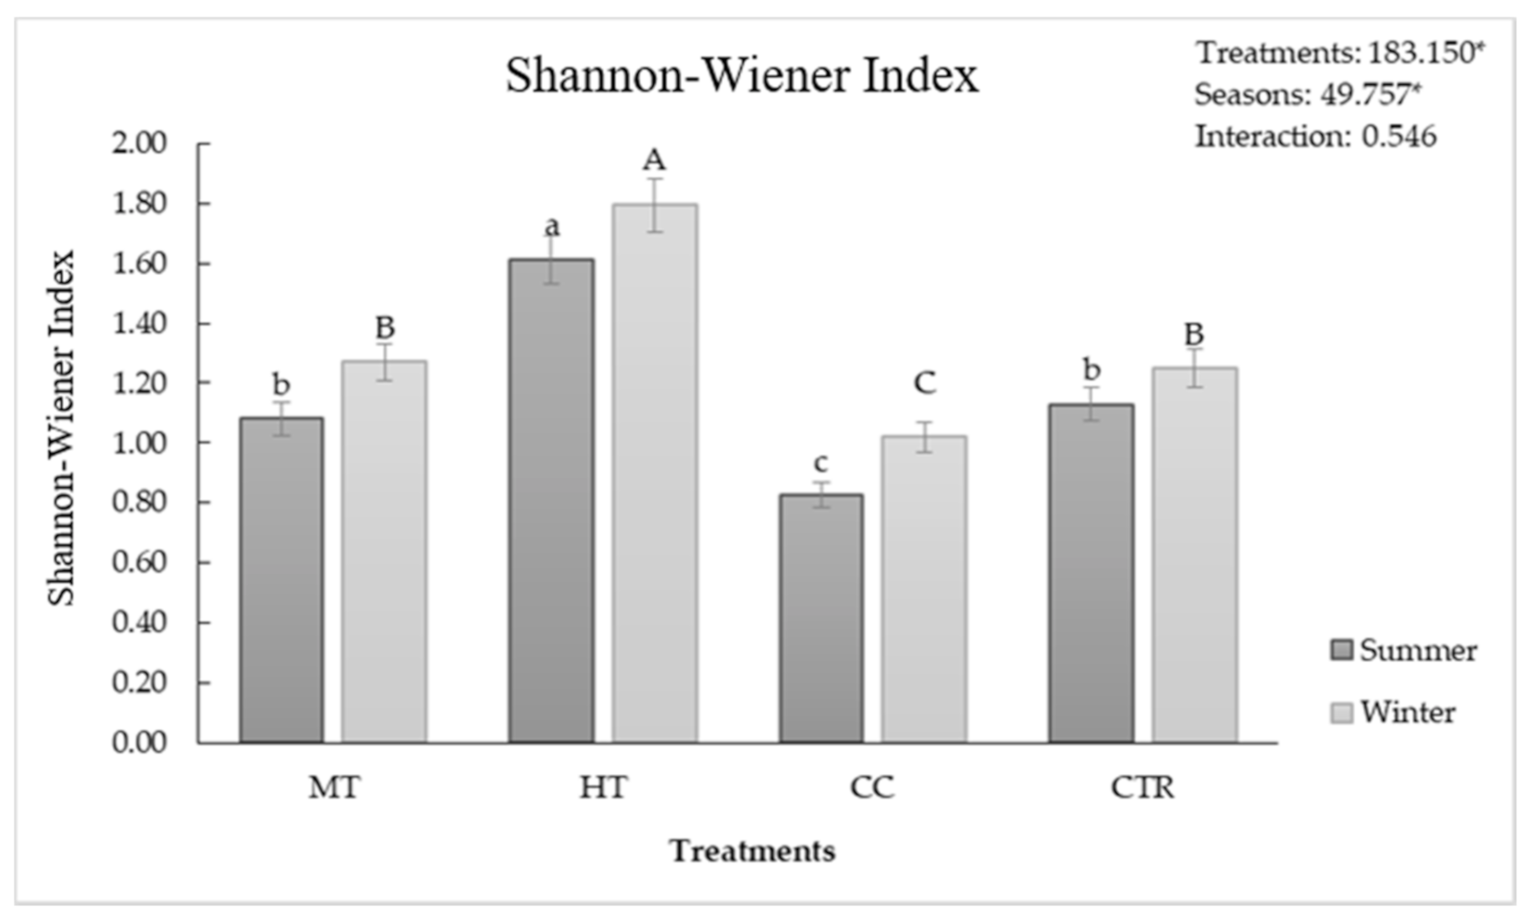
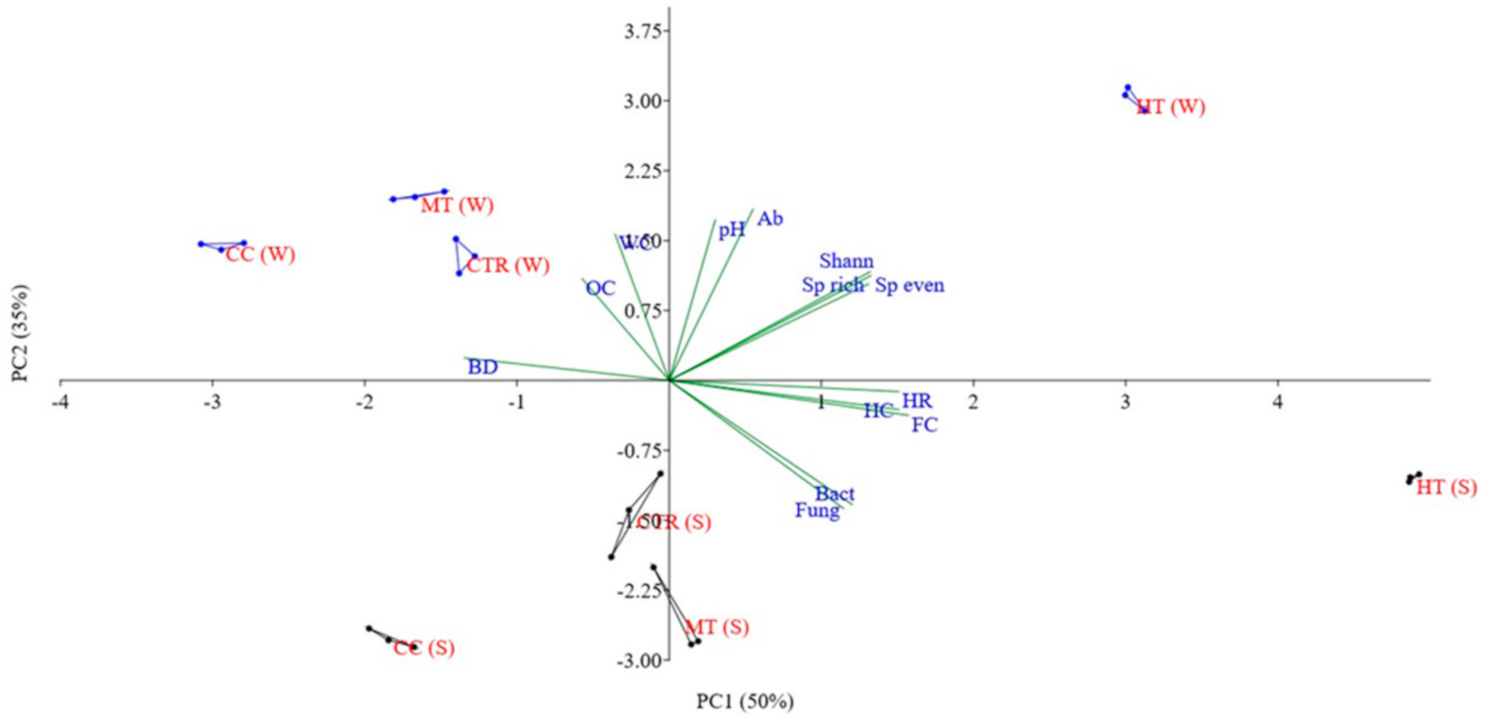
Significant differences were observed in arthropod communities and in particular in the number of individuals among the treatments in both seasons. The highest number of individuals and the greatest species richness, both in winter and in summer, were recorded in HT plots (Table 3 and Table 4), while the lowest were observed in in CC plots (Figure 3, Figure 4 and Figure 5). In all treatments, the individuals, as well the richness of species, were more abundant in winter than in summer. These differences were due to the variations in temperature and rainfall between summer and winter in a strongly Mediterranean climate, which caused asynchrony between resource availability and plant growth [64,65]. The lower biodiversity found in summer, in all the sites (managed, and unmanaged), was due to the limited amount of rain and to the consequent scarce litter humidity, which strongly influenced the invertebrate diversity, as previously reported by other authors [66,67]. Shannon diversity and evenness showed significant differences among treatments but did not show any difference between seasons. This trend in species richness can be simply due to an increase in resources correlated with the increasing thinning intensity. The great amount of undergrowth vegetation and the consequent mixed litter at different decomposition stages present in HT plots strongly influenced the amount and the diversity of arthropod communities, as previously reported by Santonja et al. [67] and Jiménez-Chacón et al. [68]. These results evidenced that thinning intensities affected pedoclimatic conditions, drove understory richness, and, in turn, modified the relationships between arthropod richness, evenness, and proportional diversity, with consequent effects on soil microorganism amounts. Seasonal changes did not affect the thinning trend. Specifically, in summer, we found a greater amount of Collembola, Acarina, Diptera, Hymenoptera, and Pseudoscorpionida in in HT plots in respect to plots of all the other treatments (Table 3). All these arthropods, as previously reported by Menta and Renelli [22] and Tsurho and Ao [69], have a key role in maintaining the sustainability of an ecosystem through the decomposition and mineralization of litter. Additionally, all these arthropods are important bio-indicators of soil ecosystem functioning because they include numerous groups that respond quickly to external disturbance, varying their distribution and amount in space and time [70]. In winter, we found the greatest abundance of the above mentioned arthropods in HT plots (Table 4), and, surprisingly, we also observed the appearance of other groups that were completely absent in plots of the other treatments (Chilopoda, Psocoptera, Symphyla, and Thysanoptera) in HT plots in summer (Table 3 and Table 4). These findings highlighted an increase in species in soil under high thinning intensity treatments, suggesting that HT created, independently of seasons, better habitat conditions allowing for the development of trophic interactions that played a key role in ecological soil processes, as previously demonstrated by Wardle [71] and Dyer et al. [72]. Analysis of variance of the effects of treatments, seasons, and their interactions on arthropod taxa confirmed the above statement, evidencing that the majority of taxa were mainly influenced by treatments rather than seasons and their interaction (Table 5), except for Acarina, Diptera, Hymenoptera, and Protura, which were mainly influenced by seasonality (Table 5). For PCA analysis, the first two components (Eigenvalues > 1) were extracted. The variance was high (85.1%), component 1 explained about 50%, while component 2 explained about 35% of the variability in all parameters (Figure 6). The PCA diagram showed that HT, in both seasons, influenced especially and positively the number of individuals (Ab), Shannon–Wiener index of diversity, species richness and evenness, HR, HC, FC, bacteria, and fungi. The highest amount of arthropods in HT plots in both seasons could explain the observed increase in microflora. The great ingestion and excretion of dead plant material by arthropods could have increased the interfacial contact, facilitating the colonization of plant residues by fungi and bacteria and justifying their increase in number. In short, our results evidenced a strict correlation between soil community, seasonality, stand density, understory abundance, and litter diversity.

4. Conclusions

Despite the complex nature of soil dweller interactions, we found that the soil community responses to forest management in coniferous forest depended on the provided higher resources (light, below-ground resources) and better habitat conditions for shade-intolerant species that thinning treatments established along with resident vegetation. The highest thinning intensity (which removed a greater amount of basal area) favored the highest understory species richness, with positive effects on soil organic matter, humification process, as well as on soil community in terms of arthropod and soil microorganisms. The relationship found between thinning intensity and soil quality allowed us to individuate the high intensity thinning as a sustainable forest management practice not only from a forestry point of view but mainly for its eco-compatibility with soil ecosystems. Our results are consistent with the intermediate disturbance hypothesis, which suggests maximum levels of biodiversity are observed under some intermediate disturbance frequency because few species are able to tolerate very intense disturbance regimes, and few are able to compete successfully in habitats that experience minimal disturbance regimes. The outcomes of this study evidence HT as a form of intermediate disturbance, and help to formulate forestry policy recommendations to benefit biodiversity.

Author Contributions

A.M. conceived and designed the experiments, analyzed the data, and wrote the manuscript. G.S. and F.R. analyzed the data, performed statistical analyses, and critically reviewed and edited the manuscript. G.S. and F.R. performed the laboratory experiments and collected the data. C.M. conducted fieldwork. All authors have read and agreed to the published version of the manuscript.

Funding

This research received no external funding.

Acknowledgments

This research was supported by Mediterranea University of Reggio Calabria “Programmi di Ricerca Scientifica”, no outside funding was received.

Conflicts of Interest

The authors declare no conflict of interest.

References

  1. Bianchi, L.; Paci, M.; Bresciani, A. Effetti del diradamento in parcelle sperimentali di pino nero in Casentino (AR): Risultati a otto anni dall’intervento. Forest 2010, 7, 73–83. [Google Scholar] [CrossRef] [Green Version]
  2. Cantiani, P.; Chiavetta, U. Estimating the mechanical stability of Pinus nigra Arn. using an alternative approach across several plantations in central Italy. iForest 2015, 8, 846–852. [Google Scholar] [CrossRef] [Green Version]
  3. Thom, D.; Rammer, W.; Dirnböck, T.; Müller, J.; Kobler, J.; Katzensteiner, K.; Helm, N.; Seidl, R. The impacts of climate change and disturbance on spatio-temporal trajectories of biodiversity in a temperate forest landscape. J. Appl. Ecol. 2017, 54, 28–38. [Google Scholar] [CrossRef]
  4. Kutnar, L.; Nagel, T.A.; Kermavnar, J. Effects of Disturbance on Understory Vegetation across Slovenian Forest Ecosystems. Forests 2019, 10, 1048. [Google Scholar] [CrossRef] [Green Version]
  5. Zhang, D.H.; Ye, Z.E.; Fan, B.Y.; Wei, T.L. Influence of thinning on soil fertility in artificial forests. Chin. J. App. Ecol. 2001, 12, 672–676. [Google Scholar]
  6. Goldmann, K.; Schöning, I.; Buscot, F.; Wubet, T. Forest Management Type Influences Diversity and Community Composition of Soil Fungi across Temperate Forest Ecosystems. Front. Microbiol. 2015, 6, 1300. [Google Scholar] [CrossRef] [Green Version]
  7. Ma, S.; Concilio, A.; Oakley, B.; North, M.; Chen, J. Spatial variability in microclimate in a mixed-conifer forest before and after thinning and burning treatments. Forest Ecol. Manag. 2010, 259, 904–915. [Google Scholar] [CrossRef]
  8. Wubet, T.; Christ, S.; Schöning, I.; Boch, S.; Gawlich, M.; Schnabel, B.; Fischer, M.; Buscot, F. Differences in soil fungal communities between European beech (Fagus sylvatica L.) dominated forests are related to soil and understory vegetation. PLoS ONE 2012, 7, e47500. [Google Scholar] [CrossRef]
  9. Muscolo, A.; Settineri, G.; Attinà, E. Early warning indicators of changes in soil ecosystem functioning. Ecol. Indic. 2015, 48, 542–549. [Google Scholar] [CrossRef]
  10. Muscolo, A.; Settineri, G.; Bagnato, S.; Mercurio, R.; Sidari, M. Use of canopy gap openings to restore coniferous stands in Mediterranean environment. iForest 2017, 10, 322–327. [Google Scholar] [CrossRef] [Green Version]
  11. Yang, Y.; Geng, Y.; Zhou, H.; Zhao, G.; Wang, L. Effects of gaps in the forest canopy on soil microbial communities and enzyme activity in a Chinese pine forest. Pedobiologia 2017, 61, 51–60. [Google Scholar] [CrossRef]
  12. Liu, Y.; Zhang, J.; Yang, W.; Wu, F.; Xu, Z.; Tan, B.; Zhang, L.; He, X.; Guo, L. Canopy gaps accelerate soil organic carbon retention by soil microbial biomass in the organic horizon in a subalpine fir forest. Appl. Soil Ecol. 2018, 125, 169–176. [Google Scholar] [CrossRef]
  13. Huang, Y.; Yang, X.; Zhang, D.; Zhang, J. The effects of gap size and litter species on colonization of soil fauna during litter decomposition in Pinus massoniana plantations. Appl. Soil Ecol. 2020, 155, 103611. [Google Scholar] [CrossRef]
  14. Lassau, S.A.; Hochuli, D.F.; Cassis, G.; Reid, C. Effects of habitat complexity on forest beetle diversity: Do functional groups respond consistently? Divers. Distrib. 2005, 11, 73–82. [Google Scholar] [CrossRef]
  15. Perry, K.I.; Wallin, K.F.; Wenzel, J.W.; Herms, D.A. Forest disturbance and arthropods: Small-scale canopy gaps drive invertebrate community structure and composition. Ecosphere 2018, 9, e02463. [Google Scholar] [CrossRef] [Green Version]
  16. Romeo, F.; Settineri, G.; Sidari, M.; Mallamaci, C.; Muscolo, A. Responses of soil quality indicators to innovative and traditional thinning in a beech (Fagus sylvatica L.) forest. For. Ecol. Manag. 2020, 465, 118106. [Google Scholar] [CrossRef]
  17. Khatoon, H.; Solanki, P.; Narayan, M.; Tewari, L.; Rai, J. Role of microbes in organic carbon decomposition and maintenance of soil ecosystem. Int. J. Chem. Stud. 2017, 5, 1648–1656. [Google Scholar]
  18. David, J.F. The role of litter-feeding macroarthropods in decomposition processes: A reappraisal of common views. Soil Biol. Biochem. 2014, 76, 109–118. [Google Scholar] [CrossRef] [Green Version]
  19. Saha, S.; Sarkar, M.; Raychaudhuri, D. Assessing diversity and abundance of soil microarthropods in three discrete plots of Ramakrishna Mission Vivekananda Ashrama, Narendrapur, South 24 Parganas, West Bengal, India. World News Nat. Sci. 2020, 31, 58–69. [Google Scholar]
  20. Bagyaraj, D.; Nethravathi, C.; Nitin, K. Soil biodiversity and arthropods: Role in soil fertility. In Economic and Ecological Significance of Arthropods in Diversified Ecosystems; Springer: Berlin/Heidelberg, Germany, 2016; pp. 17–51. [Google Scholar]
  21. Chakravarthy, A.K.; Jayasimha, G.T.; Rachana, R.R.; Rohini, G. Insects as Human Food. In Economic and Ecological Significance of Arthropods in Diversified Ecosystems; Springer: Berlin/Heidelberg, Germany, 2016; pp. 133–146. [Google Scholar]
  22. Menta, C.; Renelli, S. Soil Health and Arthropods: From Complex System to Worthwhile Investigation. Insects 2020, 11, 54. [Google Scholar] [CrossRef] [Green Version]
  23. Andersen, A.N.; Majer, J.D. Ants show the way Down Under: Invertebrates as bioindicators in land management. Front. Ecol. Environ. 2004, 2, 291–298. [Google Scholar] [CrossRef]
  24. Muscolo, A.; Sidari, M.; Mercurio, R. Variations in soil chemical properties and microbial biomass in artificial gaps in Silver fir stands. Eur. J. For. Res. 2007, 126, 59–65. [Google Scholar] [CrossRef]
  25. Muscolo, A.; Bagnato, S.; Sidari, M.; Mercurio, R. A review of the roles of forest canopy gaps. J. For. Res. 2014, 25, 725–736. [Google Scholar] [CrossRef]
  26. Chen, X.L.; Wang, D.; Chen, X.; Wang, J.; Diao, J.J.; Zhang, J.Y.; Guan, Q.W. Soil microbial functional diversity and biomass as affected by different thinning intensities in a Chinese fir plantation. Appl. Soil Ecol. 2015, 92, 35–44. [Google Scholar] [CrossRef]
  27. Lewandowski, T.E.; Forrester, J.A.; Mladenoff, D.J.; Stoffel, J.L.; Gower, S.T.; D’Amato, A.W.; Balser, T.C. Soil microbial community response and recovery following group selection harvest: Temporal patterns from an experimental harvest in a US northern hardwood forest. For. Ecol. Manag. 2015, 340, 82–94. [Google Scholar] [CrossRef]
  28. Kwon, T.S.; Yang, H.M.; Shin, J.H.; Kim, S.K.; Yi, H.B. Effects of Thinning on Abundance and Community Structure of Arthropods in a Pinus koraiensis Plantation. Korean J. Appl. Entomol. 2010, 49, 187–198. [Google Scholar] [CrossRef] [Green Version]
  29. Richards, L.A.; Windsorf, D.M. Seasonal variation of arthropod abundance in gaps and the understorey of a lowland moist forest in Panama. J. Trop. Ecol. 2007, 23, 169–176. [Google Scholar] [CrossRef] [Green Version]
  30. Connell, J.H. Diversity in tropical rain forests and coral reefs. Science 1978, 199, 1302–1310. [Google Scholar] [CrossRef] [Green Version]
  31. Pavari, A. Le classificazioni fitoclimatiche ed i caratteri della stazione [Phytoclimatic classifications and station characteristics]. Scr. Ecol. Selvic. Bot. For. 1959, 45–116. [Google Scholar]
  32. IUSS Working Group. World Reference Base for Soil Resources 2014; World Soil Resources Reports No. 106; FAO: Rome, Italy, 2014. [Google Scholar]
  33. Gendron, F.; Messier, C.; Comeau, P.G. Comparison of various methods for estimating the mean growing season percent photosynthetic photon flux density in forests. Agric. For. Meteorol. 1998, 92, 55–70. [Google Scholar] [CrossRef] [Green Version]
  34. Bouyoucos, G.J. Hydrometer method improved for making particle-size analyses of soils. Agron. J. 1962, 54, 464–465. [Google Scholar] [CrossRef]
  35. Springer, U.; Klee, J. Prüfung der leistungsfähigkeit von einigen wichtigen verfahren zur bestimmung des kohlenstoffs mittels chromschwefelsaure sowie vorschlag einer neuen schnellmethode. J. Plant. Nutr. Soil Sci. 1954, 64, 1–26. [Google Scholar]
  36. Ciavatta, C.; Govi, M. Use of insoluble polyvinylpyrrolidone and isoelectric focusing in the study of humic substances in soils and organic wastes: A review. J. Chromatogr. 1993, 643, 261–270. [Google Scholar] [CrossRef]
  37. Elliott, M.L.; Des Jardin, E.A. Comparison of media and diluents for enumeration of aerobic bacteria from bermuda grass golf course putting greens. J. Microbiol. Methods 1999, 34, 193–202. [Google Scholar] [CrossRef]
  38. Picci, G.; Nannipieri, P. Metodi di Analisi Microbiologica del Suolo; Franco Angeli: Roma, Italy, 2003; p. 224. [Google Scholar]
  39. Eaton, A.; Clesceri, L.; Rice, E.; Greenberg, A.; Franson, M.A. Standard Methods for Examination of Water and Wastewater, 21st ed.; American Public Health Association: Washington, DC, USA, 2005. [Google Scholar]
  40. Berlese, A. Apparecchio per raccogliere presto ed in gran numero piccoli Artropodi. Redia 1905, 2, 85–90. [Google Scholar]
  41. Bano, R.; Roy, S. Extraction of Soil Microarthropods: A low cost Berlese-Tullgren funnels extractor. Int. J. Fauna Biol. 2016, 3, 14–17. [Google Scholar]
  42. Obrist, M.K.; Duelli, P. Rapid biodiversity assessment of arthropods for monitoring average local species richness and related ecosystem services. Biodivers. Conserv. 2010, 19, 2201–2220. [Google Scholar] [CrossRef] [Green Version]
  43. Angelini, P.; Fenoglio, S.; Isaia, M.; Jacomini, C.; Migliorini, M.; Morisi, A. Tecniche di Biomonitoraggio Della Qualità Del Suolo; ARPA Piemonte: Torino, Italy, 2002; p. 106. [Google Scholar]
  44. Ruiz, N.; Lavelle, P. Soil Macrofauna Field Manual, Technical Level; Food and Agriculture Organization of the United Nations (FAO): Rome, Italy, 2008; p. 100. [Google Scholar]
  45. Duyar, A. Seasonal Variatıon of Soil Arthropods (Arthropoda) in Fir (Abies bornmulleriana Mattf.) Ecosystems in Bolu-Aladag. Ph.D. Thesis, Science Institute, Istanbul University, Fatih, Turkey, 2014; p. 165. (In Turkish). [Google Scholar]
  46. Shannon, C.E.; Weaver, W. The Mathematical Theory of Communication; University of Illinois Press: Champaign, IL, USA, 1949; pp. 1–117. [Google Scholar]
  47. Heip, C.H.R.; Herman, P.M.J.; Soetaert, K. Indices of diversity and evenness. Océanis 1998, 24, 61–87. [Google Scholar]
  48. Whittaker, R.H. Evolution and Measurement of Species Diversity. Taxon 1972, 21, 213–251. [Google Scholar] [CrossRef] [Green Version]
  49. Sokal, R.R.; Rohlf, F.J. Biometry: The Principles and Practice of Statistics in Biological Research, 2nd ed.; W. H. Freeman: San Francisco, CA, USA, 1981; p. 859. [Google Scholar]
  50. Hammer, Ø.; Harper, D.A.T.; Ryan, P.D. PAST: Paleontological statistics software package for education and data analysis. Palaeontol. Electron. 2001, 4, 9. [Google Scholar]
  51. Stormont, J.C.; Farfan, E.; Coonrod, J.E.A. Total Soil Water Evaporation in a Riparian Environment: Model Development and Application. J. Hydrol. Eng. 2009, 14, 904–912. [Google Scholar] [CrossRef]
  52. Hornumg, M. Acidification of soils by trees and forests. Soil Use Manag. 2007, 1, 24–27. [Google Scholar] [CrossRef]
  53. Schindlbacher, A.; De Gonzalo, C.; Díaz-Pinés, E.; Pilar, G.; Matthews, B.; Inclán, R.; Zechmeister-Boltenstern, S.; Rubio, A.; Jandl, R. Temperature sensitivity of forest soil organic matter decomposition along two elevation gradients. J. Geophys. Res. 2010, 115, 1–10. [Google Scholar] [CrossRef]
  54. Muscolo, A.; Sidari, M.; Bagnato, S.; Mallamaci, C.; Mercurio, R. Gap size effects on above and below-ground processes in a silver fir stand. Eur. J. For. Res. 2010, 129, 355–365. [Google Scholar] [CrossRef]
  55. Settineri, G.; Mallamaci, C.; Mitrović, M.; Sidari, M.; Muscolo, A. Effects of different thinning intensities on soil carbon storage in Pinus laricio forest of Apennine South Italy. Eur. J. For. Res. 2018, 137, 131–141. [Google Scholar] [CrossRef] [Green Version]
  56. Chaudhari, P.R.; Ahire, D.V.; Ahire, V.D.; Chkravarty, M.; Maity, S. Soil bulk density as related to soil texture, organic matter content and available total nutrients of Coimbatore soil. Int. J. Sci. Res. Publ. 2013, 3, 1–8. [Google Scholar]
  57. Pizzeghello, D.; Francioso, O.; Concheri, G.; Muscolo, A.; Nardi, S. Land use affects the soil C sequestration in alpine environment, NE Italy. Forests 2017, 8, 197. [Google Scholar] [CrossRef] [Green Version]
  58. Ahad, T.; Kanth, T.A.; Nabi, S. Soil bulk density as related to texture, organic matter content and porosity in kandi soils of district Kupwara (Kashmir Valley). India Int. J. Sci. Res. 2015, 4, 198–200. [Google Scholar]
  59. Li, Y.; Tullberg, J.N.; Freebairn, D.M. Traffic and residue cover effects on infiltration. Aust. J. Soil Res. 2001, 39, 239–247. [Google Scholar] [CrossRef]
  60. Pollierer, M.M.; Scheu, S. Driving factors and temporal fluctuation of Collembola communities and reproductive mode across forest types and regions. Ecol. Evol. 2017, 7, 4390–4403. [Google Scholar] [CrossRef]
  61. Swenson, N.G.; Enquist, B.; Pither, J.; Kerkhoff, A.; Boyle, B.; Weiser, M.; Elser, J.J.; Fagan, F.W.; Forero, J.; Fyllas, N.; et al. The biogeography and filtering of woody plant functional diversity in North and South America. Global Ecol. Biogeogr. 2012, 21, 798–808. [Google Scholar] [CrossRef]
  62. Victorsson, J.; Jonsell, M. Ecological traps and habitat loss, stump extraction and its effects on saproxylic beetles. For. Ecol. Manag. 2013, 290, 22–29. [Google Scholar] [CrossRef]
  63. Taylor, A.R.; Victorsson, J. Short-term effects of stump harvesting on millipedes and centipedes on coniferous tree stumps. For. Ecol. Manag. 2016, 371, 67–74. [Google Scholar] [CrossRef]
  64. Legakis, A. Community structure and species richness in the Mediterranean-type soil fauna. In Plant-Animal Interactions in Mediterranean-Type Ecosystems; Arianoursou, M., Groves, R.H., Eds.; Kluwer Academic: Amsterdam, The Netherlands, 1994; pp. 37–45. [Google Scholar]
  65. Lionello, P.; Malanotte-Rizzoli, P.; Boscolo, R. Mediterranean Climate Variability; Elsevier: Amsterdam, The Netherlands, 2006; pp. 1–421. [Google Scholar]
  66. Mueller, K.E.; Eisenhauer, N.; Reich, P.B.; Hobbie, S.E.; Chadwick, O.A.; Chorover, J.; Dobies, T.; Hale, C.M.; Jagodzi´nski, A.M.; Kałucka, I. Light, earthworms, and soil resources as predictors of diversity of 10 soil invertebrate groups across monocultures of 14 tree species. Soil Biol. Biochem. 2016, 92, 184–198. [Google Scholar] [CrossRef]
  67. Santonja, M.; Fernandez, C.; Proffit, M.; Gers, C.; Gauquelin, T.; Reiter, I.M.; Cramer, W.; Baldy, V. Plant litter mixture partly mitigates the negative effects of extended drought on soil biota and litter decomposition in a mediterranean oak forest. J. Ecol. 2017, 105, 801–815. [Google Scholar] [CrossRef] [Green Version]
  68. Jiménez-Chacón, A.; Homet, P.; Matías, L.; Gómez-Aparicio, L.; Godoy, O. Fine Scale Determinants of Soil Litter Fauna on a Mediterranean Mixed Oak Forest Invaded by the Exotic Soil-Borne Pathogen Phytophthora cinnamomi. Forests 2018, 9, 218. [Google Scholar] [CrossRef] [Green Version]
  69. Tsurho, K.; Ao, B. Community analysis of soil Acarina in a Natural Forest and Jhum land ecosystem of Mokokchung, Nagaland. JOSR J. Appl. Phys. 2014, 6, 50–54. [Google Scholar] [CrossRef]
  70. Nsengimana, V.; Kaplin, B.A.; Francis, F.; Nsabimana, D. Use of soil and litter arthropods as biological indicators of soil quality in forest plantations and agricultural lands: A Review. Faun. Entomol. 2018, 7, 1–12. [Google Scholar]
  71. Wardle, D.A. The influence of biotic interactions on soil biodiversity. Ecol. Lett. 2006, 9, 870–886. [Google Scholar] [CrossRef]
  72. Dyer, L.A.; Walla, T.R.; Greeney, H.F.; Stireman, J.O.; Hazen, R.F. Diversity of interactions: A metric for studies of biodiversity. Biotropica 2010, 42, 281–289. [Google Scholar] [CrossRef] [Green Version]
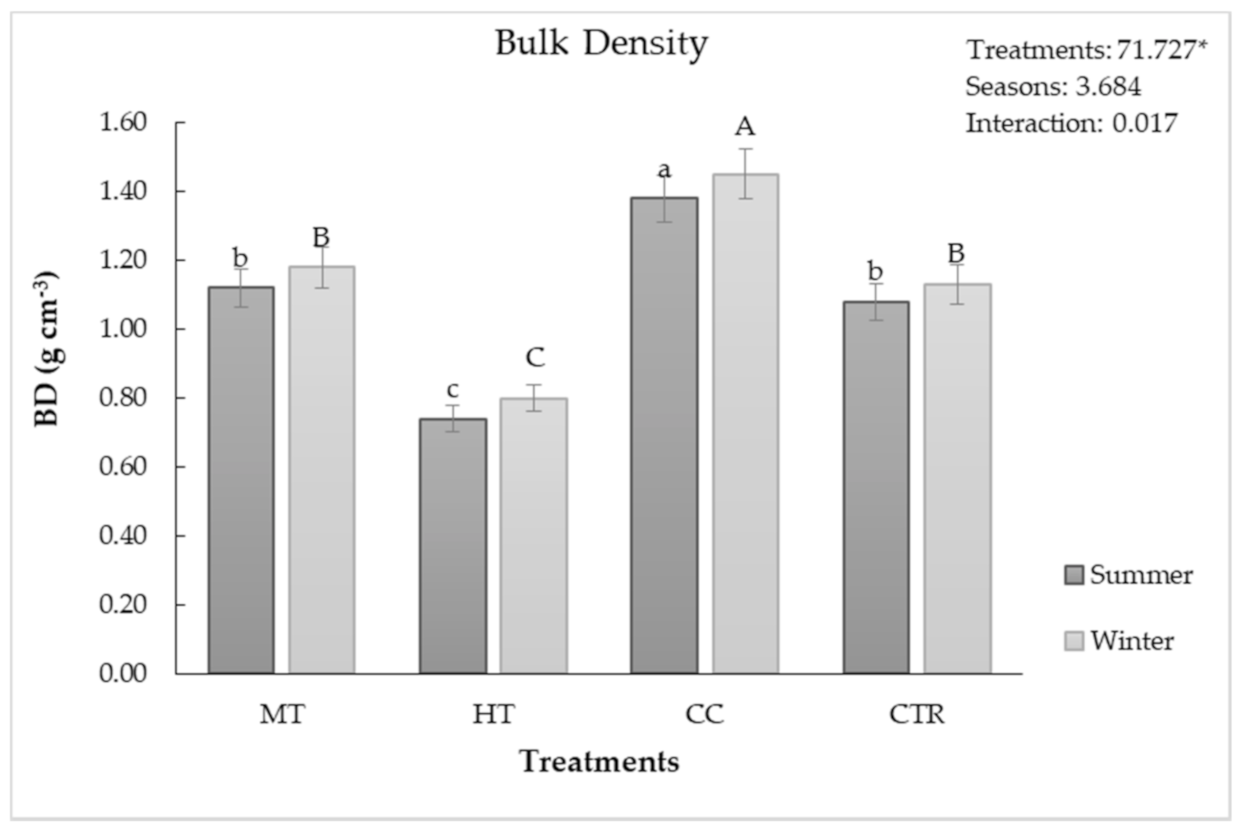
Figure 1. Bulk density (BD, g cm−3) in soil under differently managed plots of a Pinus laricio plantation in summer and winter. HT: intensive thinning; MT: moderate thinning; CC: clear cut; and CTR: control. Two-way ANOVA shows the effects of treatments, seasons and their interactions. The data are the means of two consecutive years (2014 and 2015). * p < 0.05. Different letters show significant differences at p ≤ 0.05.
Forests 12 00108 g001
Figure 2. (a) Fungi (CFU 104 g−1 dry soil) and (b) bacteria (CFU 105 g1 dry soil) in soil under differently managed plots of a Pinus laricio plantation in summer and winter. HT: intensive thinning; MT: moderate thinning; CC: clear cut; and CTR: control. Two-way ANOVA shows the effects of treatments, seasons, and their interactions. Lowercase letters and capital letters show significant differences among the management intensities (Tukey’s test, p-level ≤ 0.05) in summer and winter, respectively. The data are the means of two consecutive years (2014 and 2015). CFU: colony forming units. * p < 0.05. Different letters show significant differences at p ≤ 0.05.
Forests 12 00108 g002
Figure 3. Species richness in soil under differently managed plots of a Pinus laricio plantation. HT: intensive thinning; MT: moderate thinning; CC: clear cut; and CTR: control. Two-way ANOVA shows the effects of treatments, seasons, and their interactions. Lowercase letters and capital letters show significant differences among the management intensities (Tukey’s test, p-level ≤ 0.05) in summer and winter, respectively. * p < 0.05. The data are the means of two consecutive years (2014 and 2015).
Forests 12 00108 g003
Figure 4. Shannon–Wiener Index of diversity in soil under differently managed plots in a Pinus laricio plantation. HT: intensive thinning; MT: moderate thinning; CC: clear cut; and CTR: control. Two-way ANOVA shows the effects of treatments, seasons, and their interactions. Lowercase letters and capital letters show significant differences among the management intensities (Tukey’s test, p-level ≤ 0.05) in summer and winter, respectively. * p < 0.05. The data are the means of two consecutive years (2014 and 2015).
Forests 12 00108 g004
Figure 5. Species Evenness in soil under differently managed plots of Pinus laricio plantation. HT: intensive thinning; MT: moderate thinning; CC: clear cut; and CTR: control. Two-way ANOVA shows the effects of treatments, seasons, and their interactions. Lowercase letters and capital letters show significant differences among the management intensities (Tukey’s test, p-level ≤ 0.05) in summer and winter, respectively. * p < 0.05. The data are the means of two consecutive years (2014 and 2015).
Forests 12 00108 g005
Figure 6. Principal component analysis (PCA) diagram of differently managed plots in a Pinus laricio plantation in two different seasons: summer (S) and winter (W). HT: intensive thinning; MT: moderate thinning; CC: clear cut; CTR: control; WC: water content, OC: organic carbon; HC: humic acid; FC: fulvic acid; HR: humification rate; Ab: total number of individuals; BD: bulk density; Fung: fungi; Bact: bacteria; Sp rich: species richness; Sp even: species evenness; Shann: Shannon–Wiener index of diversity. The triangles denote the groups (convex hulls) relating to the different silvicultural treatments, each consisting of n = 5 replicates.
Forests 12 00108 g006
Table 1. Micro-environmental variables in high intensity thinning (HT), medium intensity thinning (MT), clear cut (CC), and control (CTR) plots in summer and winter. Different letters in the same row indicate, within each season, significant differences (Tukey’s test, p ≤ 0.05). The data are the means of two consecutive years (2014 and 2015). PAR: photosynthetically active radiation. Different letters in the same row show significant differences at p ≤ 0.05.
SeasonsParametersHTMTCCCTR
PAR transmittance (%)12.60 a (±2.72)2.3 b (±0.50)16.45 a (±3.43)1.42 b (±0.82)
Air temperature (°C)12.48 b (±0.74)9.72 c (±0.50)16.74 a (±0.61)7.82 d (±0.73)
SummerSoil temperature (°C)11.52 b (±0.72)7.20 c (±0.94)15.78 a (±0.53)5.89 d (±0.75)
Litter thickness (cm)3.5 a (±0.11)1.11 b (±0.45)0.2 c (±0.05)1.5 b (±0.25)
PAR transmittance (%)9.52 a (±1.25)1.21 b (±0.92)11.27 a (±1.48)0.81 b (±0.32)
Air temperature (°C)7.58 a (±1.42)5.12 b (±0.53)5.24 b (±0.92)4.64 b (±0.71)
WinterSoil temperature (°C)6.32 a (±1.01)4.21 b (±0.94)3.54 b (±0.63)3.87 b (±1.02)
Litter thickness (cm)3.21 a (±0.62)1.05 b (±0.26)0.2 c (±0.07)1.27 b (±0.98)
Table 2. Water content (WC), pH, organic carbon (OC), humic acid (HC), fulvic acid (FC), and humification rate (HR) in soil under differently managed plots (intensive thinning (HT), moderate thinning (MT), clear cut, (CC), and control (CTR)) of a Pinus laricio plantation in summer and winter. The data are the means of two consecutive years (2014 and 2015). Analysis of variance shows the effects of treatments, seasons, and their interactions. Different letters in the same column indicate, within each season, significant differences (Tukey’s test, p ≤ 0.05). * p < 0.05. Different letters in the same row show significant differences at p ≤ 0.05.
SeasonsManagementWC (%)pHOC (%)HC (%)FC (%)HR (%)
SummerMT48 a ± 1.804.96 a ± 0.4910.52 b ± 0.433.87 b ± 0.262.80 b ± 0.1663.40 b ± 5.15
HT51 a ± 1.405.39 a ± 0.3912.81 a ± 0.615.56 a ± 0.244.28 a ± 0.3276.81 a ± 4.88
CC38 b ± 1.255.10 a ± 0.367.59 c ± 0.583.11 c ± 0.131.82 c ± 0.2864.95 b ± 5.70
CTR48 a ± 1.955.20 a ± 0.509.71 b ± 0.233.55 b,c ± 0.122.60 b ± 0.1063.33 b ± 5.36
WinterMT60 b ± 1.805.59 a ± 0.358.31 b ± 0.263.17 b ± 0.101.85 b ± 0.4260.40 b ± 4.72
HT65 b ± 1.205.64 a ± 0.319.40 a ± 0.433.98 a ± 0.163.14 a ± 0.1275.74 a ± 5.31
CC82 a ± 1.005.37 a ± 0.298.08 b ± 0.222.91 b ± 0.331.62 b ± 0.1356.06 b ± 5.23
CTR61 b ± 2.025.53 a ± 0.307.80 b ± 0.203.04 b ± 0.171.53 b ± 0.1458.58 b ± 5.11
F-ratioTreatments11.478 *0.62570.611 *86.976 *82.725 *12.843 *
Seasons609.151 *5.565 *114.852 *80.687 *76.661 *4.360
Interaction87.075 *0.32824.674 *12.653 *5.112 *0.617
Table 3. Total number of individuals (Ab) and percentage abundance (% Ab) of arthropods captured in summer in soil under differently managed plots of a Pinus laricio plantation. HT: intensive thinning; MT: moderate thinning; CC: clear cut; and CTR: control. The data are the means of two consecutive years (2014 and 2015). Different letters in the same column indicate, within each season, significant differences (Tukey’s test, p ≤ 0.05).
Summer
MTHTCCCTR
AbAb (%)AbAb (%)AbAb (%)AbAb (%)
Acarina10,667 c ± 55852.5215,833 a ± 72144.499417 d ± 6571.5613,417 b ± 17262.46
Araneidae333 b ± 181.64833 a ± 792.3400.00250 b ± 91.16
Coleoptera250 b ± 321.23833 a ± 292.34250 b ± 111.9050 c ± 860.22
Collembola7833 b ± 38838.5710,583 a ± 39929.752500 d ± 8418.995167 c ± 18424.04
Diplopoda250 b ± 161.23500 a ± 371.4030 d ± 510.22116 c,d ± 870.53
Diplura116 b ± 1010.55667 a ± 901.8700.00115 b ± 990.52
Diptera171 d ± 1180.812083 a ± 1115.85333 c ± 982.531167 b ± 1055.43
Hemiptera51 c ± 380.23583 a ± 1211.63167 b,c ± 1191.25117 c ± 820.53
Hymenoptera250 d ± 841.231000 a ± 1482.81417 c ± 873.17667 b ± 1243.10
Isopoda79 a ± 350.3653 a ± 190.1500.0051 a ± 200.23
Protura333 b ± 1021.64750 a ± 1452.1153 c ± 260.3952 c ± 330.23
Pseudoscorpionida00.001833 a ± 1245.1600.00333 b ± 971.55
Symphyla00.0030 ± 170.0900.0000.00
Total20,333100.0035,581100.0013,167100.0021,502100.00
Table 4. Total number of individuals (Ab) and percentage abundance (% Ab) of arthropods captured in winter in soil under differently managed plots of a Pinus laricio stand. HT: intensive thinning; MT: moderate thinning; CC: clear cut; and CTR: control. The data are the means of two consecutive years (2014 and 2015). Different letters, in the same row, show significant differences at p ≤ 0.05.
Winter
MTHTCCCTR
AbAb (%)AbAb (%)AbAb (%)AbAb (%)
Acarina25,417 a ± 25959.7619,250 b ± 27236.6224,333 a ± 29470.7925,083 a ± 24863.98
Araneidae667 b ± 1421.572083 a ± 2143.96208 c ± 1240.6083 c ± 430.21
Chilopoda00.0082 ± 320.1500.0000.00
Coleoptera1167 b ± 1742.592000 a ± 2073.8028 d ± 120.08750 c ± 1421.91
Collembola9333 b ± 114222.0716,167 a ± 153730.754667 d ± 94213.586250 c ± 102115.94
Diplopoda833 b ± 3141.97168 c ± 480.321333 a ± 5233.88167 c ± 510.43
Diplura1417 a ± 2313.351500 a ± 2272.8528 c ± 100.08167 b ± 460.43
Diptera2417 b ± 7455.544583 a ± 9748.721833 c ± 4285.332417 b ± 6816.16
Hemiptera28 b ± 70.07417 a ± 740.7900.0000.00
Hymenoptera1083 c ± 1792.542167 a ± 2114.12674 d ± 1071.971417 b ± 1833.61
Isopoda167 b ± 620.39417 a ± 1830.79119 c ± 540.35124 c ± 530.32
Protura28 d ± 120.071667 b ± 613.171159 c ± 3243.351917 a ± 4214.89
Pseudoscorpionida30 c ± 170.081583 a ± 3743.0100.00833 b ± 2112.12
Psocoptera00.00115 ± 550.2200.0000.00
Symphyla00.00152 ± 420.0900.0000.00
Thysanoptera00.00333 ± 890.6300.0000.00
Total42,586100.0052,583100.0034,381100.0039,208100.00
Table 5. Analysis of variance of the effects of treatments, seasons, and their interactions on arthropod parataxonomic units. * p < 0.05.
F-Ratio
TreatmentsSeasonsInteraction
Acarina2.967871.066 *57.942 *
Araneidae418.725 *193.862 *83.547 *
Chilopoda0.9210.8820.921
Coleoptera1.6131.6770.988
Collembola3.3450.0291.696
Diplopoda3.638 *4.735 *3.139
Diplura8.040 *6.664 *6.868 *
Diptera2.16717.107 *2.057
Hemiptera6.525 *2.4723.589 *
Hymenoptera1.2035.387 *2.599
Isopoda5.792 *8.116 *5.611 *
Protura5.135 *25.827 *11.417 *
Pseudoscorpionida5519.388 *61.935 *587.760 *
Psocoptera5.270 *5.049 *5.270 *
Raphidioptera0.9210.8820.921
Symphyla1.7290.1090.113
Thysanoptera531.951 *509.600 *531.951 *
Publisher’s Note: MDPI stays neutral with regard to jurisdictional claims in published maps and institutional affiliations.