Article

The Nutrient Status of Plant Roots Reveals Competition Intensities in Rubber Agroforestry Systems

1
Faculty of Geography, Yunnan Normal University, Kunming 650050, China
2
CAS Key Laboratory of Tropical Forest Ecology, Xishuangbanna Tropical Botanical Garden, Chinese Academy of Sciences, Menglun 666303, China
3
Center of Plant Ecology, Core Botanical Gardens, Chinese Academy of Sciences, Menglun 666303, China
4
University of Chinese Academy of Sciences, Beijing 100049, China
5
Rubber Research Institute, Chinese Academy of Tropical Agricultural Sciences, Danzhou 571737, China
*
Authors to whom correspondence should be addressed.
Forests 2020, 11(11), 1163; https://doi.org/10.3390/f11111163
Submission received: 10 October 2020 / Revised: 23 October 2020 / Accepted: 30 October 2020 / Published: 31 October 2020

Abstract

:
Controversial competition theories may confuse the current understanding of belowground plant competition and thus result in incorrect diagnoses and mitigation strategies for nutrient competition. As such, the management of nutrient competition is a major challenge in the application and development of rubber agroforestry systems (AFSs). To explore the effects of plant competition on the nutrient status of rubber AFSs, this study measured the carbon, nitrogen, and phosphorus concentrations of the litter and soil and in plant leaves, stems, and roots from five rubber plantations (i.e., rubber monocultures and rubber mixed with cocoa, coffee, tea, and Flemingia macrophylla (Willd.) Merr., 1910)). The relative competition intensity indexes were calculated to evaluate the competition intensity of each mixed-species system, and Bayesian networks were established to investigate the linkage effects of interspecific competition for nutrients. This study demonstrated that rubber trees had weak competition with cocoa trees, moderate competition with F. macrophylla and tea trees, and intense competition with coffee trees. With the increase in competition intensity, the negative effects of interspecific competition on soil gradually offset the improvement in soil nutrients achieved with intercropping. Nitrogen and phosphorous translocation from the stems to the roots was enhanced by competition. However, enhanced nutrient allocation to roots may have led to insufficient nitrogen and phosphorous supplies in plant leaves. The quality of the litter therefore decreased because the nutrient status of fallen leaves determines the initial litter conditions. Such consequences may reduce the release of nutrients from the litter to the soil and thus increase soil nutrient depletion. This study revealed that competition effects were most obvious for the root nutrient status, followed by the stem and leaf nutrient statuses. Moreover, this study further demonstrated that the nutrient concentration of plant roots can better indicate the intensity of nutrient competition than the nutrient concentration of other plant organs.

1. Introduction

Understanding plant competition can reveal how various plant species maintain their coexistence in natural ecosystems [1] and help guide the design and management of artificial ecosystems [2,3]. The latter advantage has more practical significance—for example, in the construction of rubber-based agroforestry systems (AFSs; Figure 1a). Such artificial forests could solve the disadvantages of rubber monocultures and provide a series of benefits to rubber cultivation areas [4]; therefore, rubber AFSs have been labeled as having a high economic potential and a high biodiversity and being environmentally friendly and useful in sustainable development in many studies [2,4]. However, the practical benefits of many rubber AFSs rarely meet the expectations of farmers. One of the most important reasons is belowground competition, which is caused by improper combinations of species and results in the poor growth of both the trees and the intercrops [2]. Therefore, this issue affects the harvests of rubber AFSs and impedes their promotion.
Although many researchers have recognized that competition is an important consideration in the design of AFSs, “how plants compete with other plants below the ground” is still a controversial topic in agroforestry and ecological studies [5,6,7,8,9,10]. This is mainly because belowground competition is covert [1], the heterogeneities of environmental resources are complex [11], and conventional experimental approaches, such as time-point biomass-based methods, reveal only competitive outcomes rather than competitive processes [10]. Therefore, controlling competition among plants is difficult in most AFSs [2], even though relevant studies have been conducted over multiple decades [3,10]. For example, increasing the application of fertilizer is regarded as a useful means of weakening plant competition for soil nutrients [3,12]. However, an increasing number of competition experiments suggest that the general intensity of interspecific competition in plant communities is not weakened by the addition of nutrients [13,14,15]. Other methods, such as root pruning or root segregation, may be effective. However, such methods are impractical because they require long-term human interference and may also affect plant growth. Thus, to understand plant competition for nutrients and test the related means of controlling competition in AFSs, the intensity of this competition must first be recognized.
Nutrient diagnosis would seem to be an ideal approach for recognizing the intensities of plant nutrient competition because it is generally applied in the management of fertilization on plantations [16]. However, only leaf nutrient diagnosis is widely applied to determine if nutrient resources on rubber plantations are maintained at an optimum level for plant growth; thus, information on the nutrient status of other parts of mixed-species AFSs, which could be used to estimate the intensities of plant competition in the AFSs [4,12], is scarce [3,16]. Therefore, if only leaf nutrients are considered in nutrient competition experiments, the functions of nutrient storage, nutrient translocation, and nutrient homeostasis in plants and the linkage effects of plant interactions on nutrient cycling (Figure 1b) would be totally neglected [17,18].
To explore suitable indicators to estimate the intensity of competition for nutrients in rubber AFSs and the effects of competition on nutrient cycling, five kinds of rubber plantations were selected for observation in this study: a rubber monoculture plantation (Hevea brasiliensis Müll.Arg.; abbreviated as RM), a rubber and cocoa (Theobroma cacao L.) AFS, a rubber and tea (Camellia sinensis (L.) Kuntze var. assamica) AFS, a rubber and coffee (Coffea Arabica L.) AFS, and a rubber and Flemingia macrophylla (abbreviated to rubber and flemingia) AFS. The carbon (C), nitrogen (N), and phosphorus (P) concentrations in the litter, soil and main plant organs (i.e., leaves, stems, and roots) were measured in these rubber plantations from 2015 to 2016. This study addressed two scientific questions: (1) how does interspecific competition affect the nutrient status of each part of a rubber AFS; (2) which link of nutrient cycling best reflects the intensity of interspecific competition in rubber AFSs? To address these questions, the nutrient competition intensity of each AFS was determined through a nutrient diagnosis of the entire system. Then, a nutrient correlation network for each AFS was created to help build a Bayesian network to test the linkage effects of competition under different competition intensities. Thus, the objectives of this study were to explore the effects of competition on nutrient cycling (linking environmental resources and plants) in rubber AFSs and to screen reliable indicators of plant competition intensities in these AFSs. The results of this study can be used to guide the selection of intercrops in rubber AFSs and to test the related means of controlling plant competition.

2. Materials and Methods

2.1. Description of Study Areas

The study sites were located in the Xishuangbanna Tropical Botanical Garden (XTBG; 21°55′39″ N, 101°15′55″ E) in Yunnan, Southwestern China. This region has three distinct seasons: a rainy season, a foggy-cool season, and a hot-dry season (Supplementary Figure S1a). Seasonal variations in precipitation, air temperature, and other climatic indexes are obvious (Supplementary Figure S2).
The rubber trees (PB86) at all sites were planted in 1990 and are arranged in double rows spaced 2 m apart. Within the rows, the trees were spaced 4.5 m apart, and each set of double rows was separated by an 18-m-wide gap. The intercropped species in the AFSs were planted in the 18-m-wide gap in 2005. In the rubber and cocoa AFS, the cocoa trees reached heights of approximately 2.4 m and were planted in four rows, each of which was located 4 m apart and contained plants spaced 3 m apart. In the rubber and flemingia AFS, F. macrophylla reached heights of approximately 2.3 m and was planted in seven rows, each spaced 2 m apart, and a spacing of 0.7 m was maintained between the plants in each row. In the rubber and tea AFS, the tea trees reached heights of approximately 1.8 m and were planted in seven rows; each of these rows was spaced 2 m apart, and a distance of 0.5 m was maintained between the plants in each row. In the rubber and coffee AFS, the coffee trees reached heights of approximately 2 m and were planted in five rows, and the spacing between the rows and between the plants in each row was 2.5 m. Such designs optimize rubber yields, decrease chilling damage to the bases of the rubber tree stems, and decrease interspecific competition for light [12]. All study sites had a common east-facing slope; the distances among the sites were small (<300 m), and the altitudes of the sites were similar (approximately 620 m). Moreover, N and P compound fertilizers (31% organic material, 14% urea, 15% ammonium sulfate, 5% ammonium bicarbonate, 12% monoammonium phosphate, and 20% potassium sulfate) were applied in small and shallow ditches in the middle of each pair of rubber trees in each row in early September 2015, and the amount applied each year was approximately 200 kg ha−1. Herbicide was applied for weed control, and no pruning was performed on any plant at any of the study sites.

2.2. Sampling and Measurement Methods

Samples (including litter, soil, and plant leaves, shoots, and roots) were collected separately during six phenological periods of the rubber trees (Supplementary Figure S1a). These periods included the fruit ripening period (20 October 2015), the early dormant stage (5 December 2015), the late dormant stage (24 January 2016), the leaf senescence period (20 February 2016), the leaf expansion period (22 March 2016), and fruit setting period (10 May 2016). Three blocks (15 × 10 m) that covered the planting zones of both the rubber trees and the intercrops in each AFS were selected for sampling (Supplementary Figure S1b). A similar position was selected for sampling in the RM. On each sampling date, three to five shoots with leaves were cut from the tree canopy top using tree pruners in each block at each site. The shoots were divided into two parts: leaves and stems. These sample groups were placed in separate envelopes. Three ditches, which were approximately 100 cm long, 20 cm wide, and 30 cm deep, were dug at the boundary of the intercrop planting zones (because the lateral roots of the intercropped species were short and this position was the main area of root overlap) in three blocks at each site. The lateral roots (approximately 5 mm in diameter) of each plant species were collected from these ditches, transported to the laboratory in a timely manner, and washed with purified water. There were several main reasons for the collection of lateral roots instead of fine roots: (1) fine roots are white, thin (≤2 mm), short-lived, and frequently replaced, and the indistinguishable interspecific differences between the morphology, spatial distribution, functional classification, and living status may result in large sampling errors; therefore, quantification of the living fine roots of different plant species in mixed-species systems is extremely challenging [19,20,21,22]. However, the lateral roots of different species can be distinguished relatively easily through their specific morphological characteristics, and thus nutrient diagnosis of the lateral roots was most convenient. (2) The nutrient concentrations of fine roots are generally higher than those of other plant tissues, and nutrient translocation from fine roots is minimal [22,23]. (3) As a highly ordered organ, lateral roots can transport and store nutrients that are acquired by fine roots because most fine roots and even root hairs branch off from lateral roots [24]. Variations in the nutrient concentrations of lateral roots can therefore reflect the dynamic variations in root growth and the interactions belowground [25].
Moreover, three packs of litter samples were collected from the decomposing litter layer from these blocks at each site. Almost all samples consisted of the fallen leaves of the rubber trees because they were quite abundant, and the evergreen intercropped species provided little residue. Soil samples were also collected from the ditches dug at each site, and all roots were removed. Root and soil samples were collected from this depth because the roots of the rubber trees and the intercropped species clearly overlapped in this soil layer [26,27].
All the samples were immediately dried in drying ovens at 65 °C for at least 48 h to a constant weight, smashed with a pulverizer and homogenized to a fine powder with an 80-mesh sieve. The total C and N concentrations of all the samples were measured using a Vario MAX cube (Elementar; Hanau, Germnay) at the Central Laboratory, XTBG. The total P concentrations of the plant organs were determined by inductively coupled plasma atomic-emission spectrometry (Thermo Fisher; Waltham, MA, USA) after digestion in HNO3–HClO4, and the soil P concentrations were also determined using the spectrometer after digestion in HClO4–HF.

2.3. Calculations and Statistical Analysis

To determine the intensity of interspecific competition among these AFSs and to explore the possible increase in nutrients through intercropping, the negative relative competition intensity (NRCI) index, which was transformed from the relative competition intensity (RCI) index [28,29], was calculated using the following formula:
NRCI   =   RCI   =   ( P mix     P mono )   /   P mono   ×   100 %
where Pmono represents the monoculture performance, and Pmix represents the mixed system performance (e.g., the leaf N concentrations of the monoculture rubber trees and the mixed planting rubber trees, respectively). In general, a higher NRCI index indicates a lower competition intensity and more intercropping improvement, while a lower NRCI index indicates a higher competition intensity and less intercropping improvement. In this study, only the C, N, and P concentrations of the litter, soil, rubber leaves, rubber stems, and rubber roots were selected to calculate the NRCI because these are commonly available parameters for the AFSs. Therefore, a total of 15 competition indexes were established for each AFS.
Factor analysis was performed to reduce the dimensions of the NRCI indexes to explain the key competition characteristics of each AFS through the related latent factors. The factor analyses were performed using R version 3.5.2 [30] with the package “psych” [31]. The maximum likelihood method was selected for factor extraction, and the factor numbers were determined through parallel analysis. Varimax was executed for the rotation of the factor matrix. The R package “corrplot” [32] was installed for plotting the correlation and factor matrix. The composite scores were generated through the accumulation of each factor item, which had been weighted according to their factor loading [33]. The composite score was tested through reliability analysis using the “alpha()” function (α) in the “psych” package. If Cronbach’s α value was more than 0.7, a two-way ANOVA was conducted to examine the effects of “time” and “site” on the composite score, and the differences among groups were compared using Tukey’s post hoc test.
In addition, the differences in the C, N, and P concentrations of the litter, soil, and plant organs (leaves, stems, and roots) at each site were analyzed using general linear models. The independent variables were “time” and “category”, and “category” involved the organs of the rubber trees and intercrops as well as the litter and soil. Similarly, the differences in the C, N, and P concentrations of the litter, soil, and plant organs among sites were also analyzed by general linear models, with “time” and “site” as the independent variables. The same was true for the litter C:N and C:P ratios. If significant results were found, the differences among groups were compared using Tukey’s post hoc test.
Pearson correlation analysis was applied to reveal the correlations among the C, N, and P concentrations of the litter, soil, and plant leaves, stems, and roots at each site. Additionally, Pearson correlation similarity analysis was applied to reveal the similarity of the nutrient concentrations of the litter, soil, and rubber leaves, stems, and roots among the sites. Statistical analyses of the nutrient networks were performed using the R package “qgraph” [34].
After summarizing the nutrient relationships among the plant organs, litter, and soil and their nutrient characteristics in the AFSs, a Bayesian network was built using GeNIe [35]. The network structure was created based on both expert knowledge (Figure 1b) and data. The continuous nutrient concentration and NRCI index data in this study were transformed into discrete data. In detail, the competition intensities were set as “weak”, “moderate”, or “intense” if the composite scores of the NRCI indexes were distributed in the ranges of “≤−0.25”, “>−0.25 and <0.25”, or “≥0.25” along the Y-axis, respectively. The nutrient status was set as “increase”, “normal”, or “decrease” if one parameter (e.g., the leaf N concentration) of an AFS was significantly higher than that of the RM (p < 0.05), did not significantly differ from that of the RM (p ≥ 0.05), or was significantly lower than that of the RM (p < 0.05). The sensitivity and reliability of the Bayesian network were tested through cross-validation.

3. Results

3.1. Competition Intensity of Each AFS

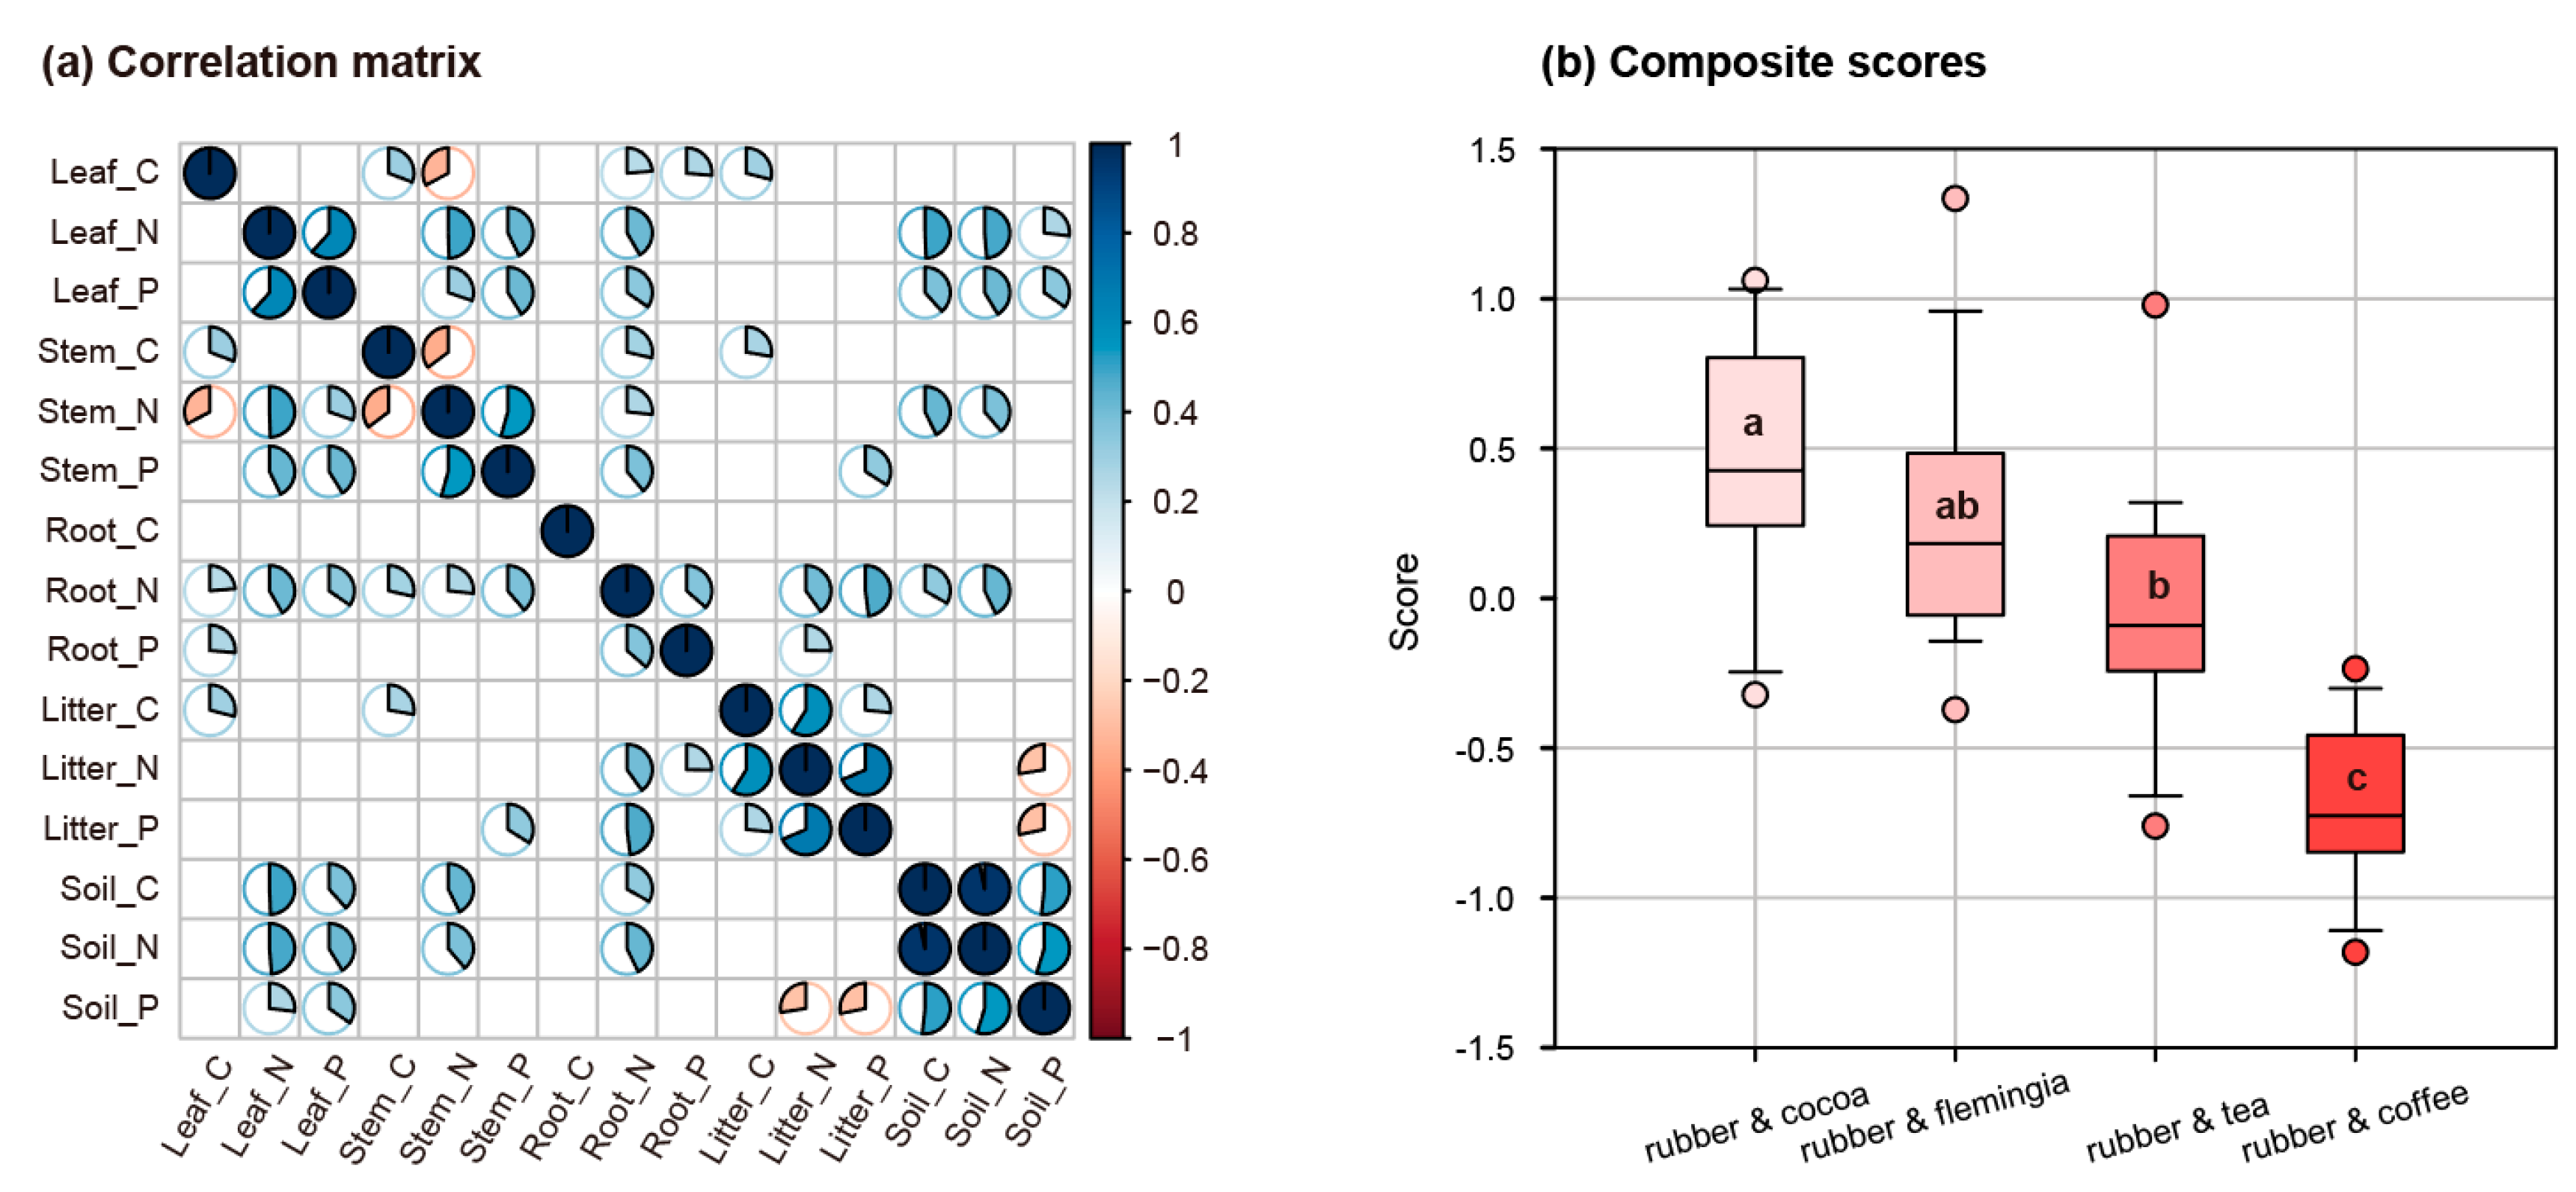
Commonly, the NRCI indexes were lower in the rubber and coffee AFS (Figure 2), which means that the interspecific competition was more intense in this AFS. Except for the soil, it seemed difficult to distinguish the competition intensities of the other AFSs based on the NRCI indexes. As the correlation matrix revealed, many variables were highly correlated (Figure 3a); therefore, a factor analysis was conducted. Through parallel analysis, four factors were extracted because their eigenvalues were distributed above the inflection point of the simulated data. After the rotation, the interpretation and analysis of the extracted factors seemed more reasonable. Because Cronbach’s alpha was 0.95, a two-way ANOVA for the composite score was conducted, with “time” and “site” as the independent variables. Through multiple comparisons, the competition intensity rankings for these AFSs were obtained (Figure 3b). The results indicated that the competition intensity in the rubber and cocoa AFS was the weakest; it intensified slightly in the rubber and flemingia AFS; it was moderate in the rubber and tea AFS because the composite scores of the rubber and tea AFS were distributed around zero (i.e., similar to the performance of RM); the most intense competition was observed in the rubber and coffee AFS.

3.2. C, N and P Concentrations of Plant Organs, Litter and Soil

The C and N concentrations of the soil in the rubber and cocoa, rubber and tea, and rubber and flemingia AFSs were significantly higher than those of the RM (Figure 2e; Supplementary Figure S3a,b,d; Supplementary Table S1). However, with increases in the competition intensity, the soil C and N concentrations gradually decreased (Figure 2e). Similar tendencies were observed for the soil P concentration. The N concentrations of the rubber roots in the rubber and cocoa, rubber and tea, and rubber and flemingia AFSs were significantly higher (p < 0.01; Figure 2c) than those in the RM. However, the N concentrations of the leaves, stems, and roots of the rubber trees and the litter in the rubber and coffee AFS were significantly lower (p < 0.01) than those in the RM (Figure 2a–d; Supplementary Figure S4c). The N concentrations of the leaves of all plants were always higher than those of the stems and roots (Supplementary Figure S4). The rubber roots and the litter in the rubber and cocoa AFS (Figure 2c,d), the rubber roots in the rubber and tea AFS (Figure 2c), and the litter in the rubber and flemingia AFS (Figure 2d) showed significantly higher P concentrations than those in the RM (Supplementary Figure S5; p < 0.01), but the P concentrations in the leaves and stems of the rubber trees and litter in the rubber and coffee AFS were always lower than those in the RM (Supplementary Figure S5c; p < 0.01). In addition, the litter C:N and C:P ratios in the rubber and coffee AFS were significantly higher than those in the RM (Supplementary Figure S6).

3.3. Correlations among Plant Organs, Litter and Soil

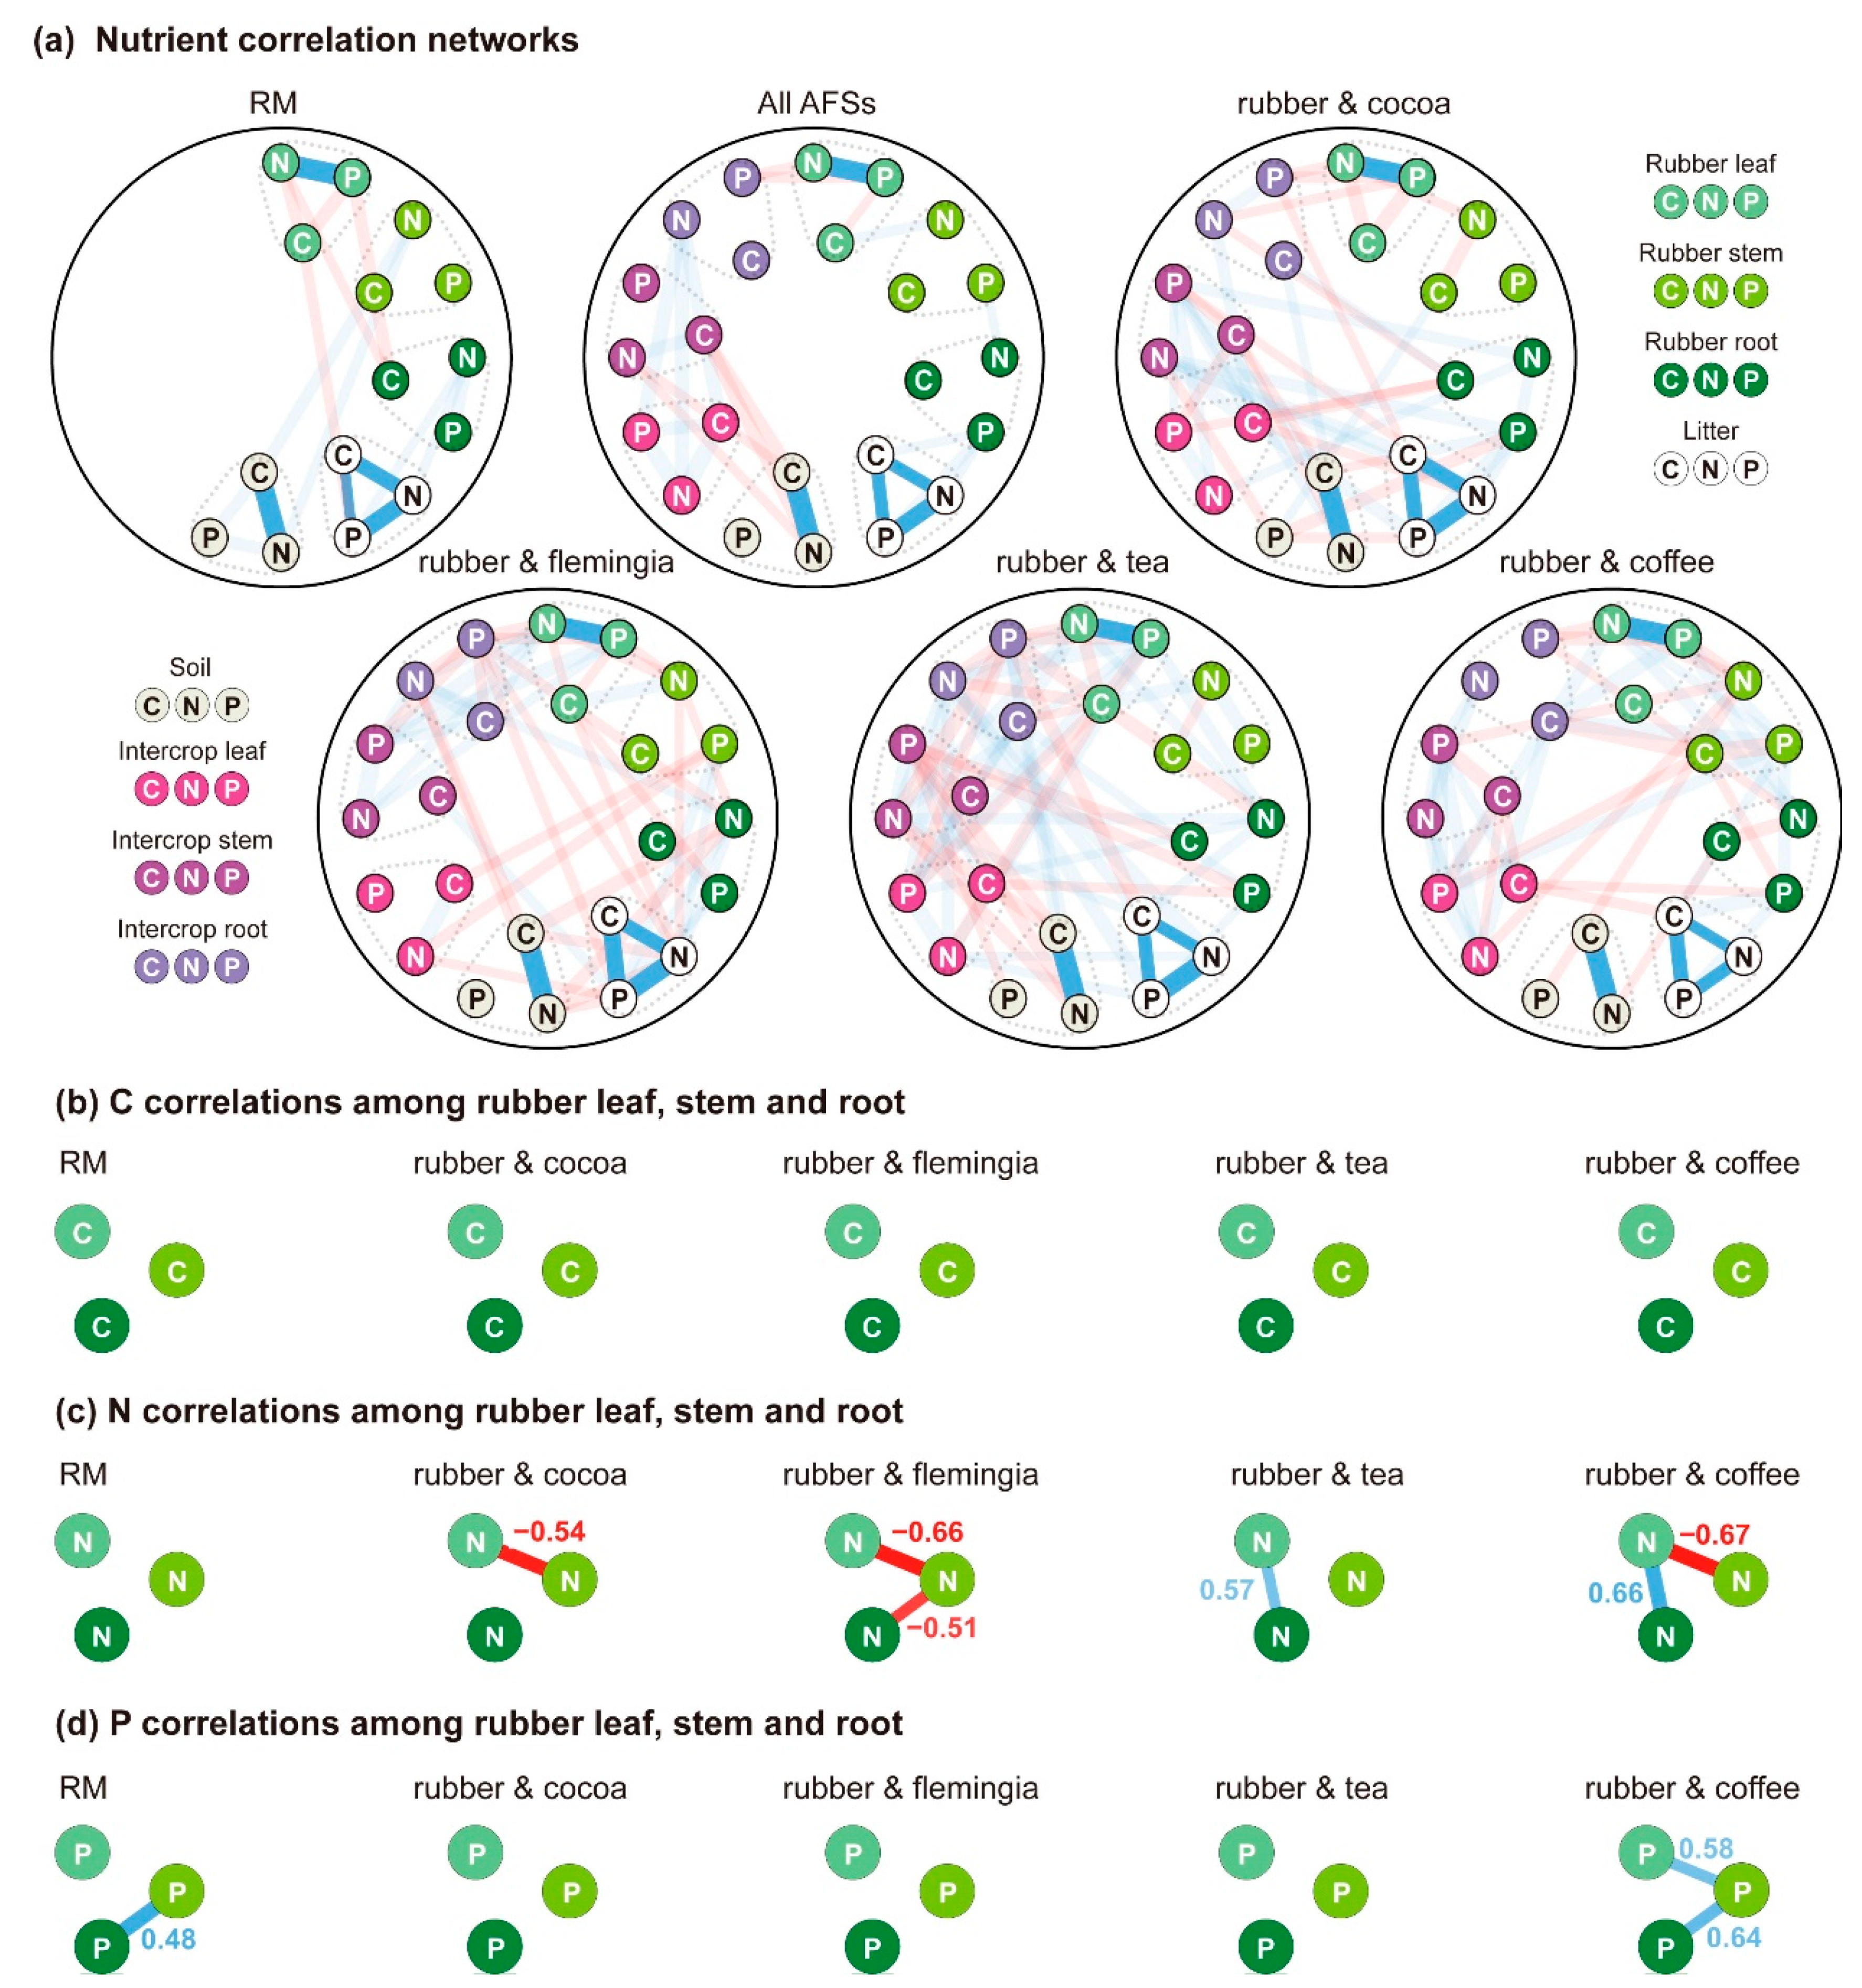
The nutrient correlations among the plant organs, litter, and soil were very complex, and the correlation network of each site was different (Figure 4a). If the effects of climate factors were considered, the correlation networks were even more complex (Supplementary Figure S7). However, consistent relationships included the positive correlations among the litter C, N, and P concentrations, the positive correlations between the leaf N and P concentrations, and the positive correlations between the C and N concentrations in the soil (Figure 3). These findings were applied to construct the Bayesian network.
Through separate analyses of the C, N, and P correlations (Figure 4b−d) among the rubber organs, the N correlations among the leaves, stems, and roots of the rubber trees were found to be different among the sites (Figure 4c). In the RM, no significant correlations existed among the N concentrations of the rubber leaves, stems, and roots. However, a negative correlation was found between the N concentrations of the rubber leaves and stems in the rubber and cocoa AFS. In the rubber and flemingia AFS, there were negative correlations between the N concentrations of the rubber leaves and stems and between the N concentrations of the rubber stems and roots. In the rubber and tea AFS, only a positive correlation was found between the N concentrations of the rubber leaves and roots. In the rubber and coffee AFS, a positive correlation was found between the N concentrations of the rubber leaves and roots, and a significant and negative correlation was found between the N concentrations of the rubber leaves and stems. Moreover, as the Pearson correlation-based similarity revealed, the nutrient characteristics of the rubber leaves were very similar between the RM and each AFS (Supplementary Figure S8a). The same was true for the litter among all sites except the rubber and coffee AFS (Supplementary Figure S8d). However, the nutrient characteristics of the rubber stems, rubber roots, and soil between the RM and each AFS exhibited few similarities (Supplementary Figure S8b,c,e).

3.4. The Bayesian Network of the Competition Effects

Because each pair of connected nodes was highly and significantly correlated (r ≥ 0.5; p < 0.05) in the nutrient correlation networks (Figure 4a), multivariate regression models were well fitted through various selections of these variables. However, such models cannot determine nonlinear correlations between independent variables and response variables through goodness of fit tests. Therefore, the Bayesian network was applied to explore the linkage effects of competition on the nutrient status of the plant organs, litter, and soil.
The basic structure of the Bayesian network included six nodes (Figure 5a). The orange arrows between the “competition” node and the other nodes indicate the effects of nutrient competition. The black arrows indicate the effects of the nutrient status of one node on the nutrient status of the next node (Figure 1b). Based on the consistent correlations in the nutrient correlation networks (Figure 4a), blue arrows are used to connect the nodes of the leaf N and P concentrations, the nodes of the litter C, N, and P concentrations, and the nodes of the soil C and N concentrations (Figure 5b). Because the variation in the P concentration of the rubber roots was small and statistically insignificant, soil P is not considered in the Bayesian network (Figure 5b). Because C is first fixed in a plant’s leaves, the directions of the arrows that connect the nodes of the C concentrations of the rubber leaves, stems, and roots are opposite to the directions of the nodes of the N and P concentration. Because the leaf N concentration determines the photosynthetic intensity and thus affects C fixation, the arrow points from the leaf N concentration to the leaf C concentration (Figure 5b). The direction of the blue arrows was determined by the functional effects of the nutrients of each node (Figure 5b). In brief, soil C determines the stability of a soil and thus affects the soil N status [36]; the arrow therefore points from the soil C concentration to the soil N concentration (Figure 5b). The litter C concentration determines the decomposition rate of the litter N and P concentrations, so the arrows therefore point from the litter C concentration to the litter N and P concentrations. The N and P concentrations have equal importance in the litter and the leaves, but the effects of competition for N on the nutrient allocations of the rubber trees were more obvious than those of the competition for P. Therefore, the concentrations of these elements were set at the same tier, but the arrows point from the litter N concentration to the litter P concentration and from the leaf N concentration to the leaf P concentration.
The posterior probability under different competition intensities suggested that the nutrient status of the rubber roots was more sensitive to competition intensities than the other parameters studied (Figure 5c). Through the sensitivity analysis, the probability of the “increase” status of the soil C and N concentrations gradually decreased with the increase in competition intensity. The nutrient statuses of the rubber leaves and stems and the litter were not sensitive to weak and moderate competition (Figure 5c) but changed greatly under intense competition (Figure 5c). Therefore, different competition intensities can be identified accurately by observing the different nutrient concentrations in the roots (Figure 6). For the organs of the rubber tree, the increase in the probability of the “decrease” status of the rubber stem N concentration resulted in an increase in the probability of the “increase” status of the rubber root N concentration under weak and moderate competition (Supplementary Figure S9). However, the increase in the probability of the “decrease” status of the rubber stem N concentration resulted in an increase in the probability of the “decrease” status of the N concentration of the rubber roots and leaves under intense competition (Supplementary Figure S9). Other test results from the Bayesian network also agreed with the actual situations.

4. Discussion

4.1. Competition Reduced the Nutrient Concentrations in the Soil and Litter

Because more than 90% of soil N is bound to soil organic C [37], a significant and positive correlation can be found between the C and N concentrations of soil (Figure 4a); therefore, these two parameters tend to be very similar (Figure 2e).
The positive effects of interspecific root interactions on the soil’s physical and chemical properties could help reduce soil nutrient losses and thus improve the soil’s nutrient status [2,3]. For example, intercropping could help improve the stability of soil aggregates and thus prevent the leaching of soil N [36]. However, the low soil N concentration in the rubber and coffee AFS (Figure 2e) suggested that intense interspecific competition may result in less N input or more N output within the soil. Generally, N consumption through plant uptake or leaching could decrease the soil N concentration in an AFS. The former method is easy to understand because plant competition results in the consumption of soil N. The latter outcome is most likely caused by the enhanced preferential flows in the soil under competition [38]. Commonly, competition for nutrients is accompanied by an increase in root length and density [39,40]. Therefore, the significant increase in the N concentration of rubber roots in the AFSs (Figure 2c; except the rubber and coffee AFS) suggested that the growth of rubber roots was promoted under competition. Because root growth generates many root channels within the soil, the infiltration of rainfall would be enhanced through preferential flows in the AFSs [38]. Due to the high mobility of most N compounds within the soil, soil N would be leached easily through preferential flows during rain events [41]. Similarly, the competition effects may be weakly reflected in the soil P concentration because soil P is less mobile [39].
The poor litter quality in the rubber and coffee AFS was mainly caused by the lower N and P concentrations of the rubber leaves in this AFS (Figure 2d) because plant residues determine the initial quality of litter. It is worth mentioning that the initial quality of litter plays an important role in the litter decomposition rate and thus affects the subsequent concentrations of the litter N and P. As the most important indexes for litter quality, the litter C:N and C:P ratios are negatively correlated with the litter decomposition rate [18]. Therefore, with the increase in the competition intensity, the increased C:N and C:P ratios of litter (Supplementary Figure S6) indicated fewer litter nutrients and a slower release. Such consequences would directly reduce the nutrient release rate from the litter to the soil and thus result in a soil nutrient deficit [17], as indicated by the lower concentrations of soil N in the rubber and coffee AFS (Figure 2e).

4.2. Competition Changed the Nutrient Allocations of Rubber Trees

Commonly, N and P are concentrated in plant leaves and jointly participate in metabolic processes [18]. Therefore, the leaf N and P concentrations of the rubber trees were always positively correlated (Figure 4a), and they were always higher than those of other rubber tree organs (Supplementary Figures S4 and S5). In contrast, the rubber stems and roots had low N and P concentrations (Supplementary Figures S4 and S5) because they consist of a large proportion of dead cells [18]. Nevertheless, plant stems and roots still play important roles in nutrient storage and transport.
Competition can reduce the availability of nutrient resources and thus affect the absorption of nutrients by plants [1,42]. Such effects were obvious in the rubber and coffee AFS (Figure 2a‒c). However, the competition effects on the leaf N and P concentrations of the rubber trees in the other AFSs were not obvious (Figure 2a; Supplementary Figure S8a), even though the soil N and P concentrations of these AFSs differed significantly (Figure 2e; Supplementary Figure S8e). Perhaps this was because the nutrient concentrations of the soil and litter in these AFSs were not less than those in the RM (Figure 2d,e) and because of the nutrient support of the rubber stems and roots, as suggested by their dissimilarity among sites (Supplementary Figure S8b,c).
When a nutrient resource is insufficient, plants can use various physiological functions, such as nutrient translocation and retranslocation, to prompt the transport of this nutrient among plant organs to improve the efficiency of use [11,43]. Such functions could help maintain the nutrient homeostasis of plant leaves and their associated metabolism to ensure the normal growth of the whole plant or to maintain its basic physiological activity [18,44]. However, the nutrient allocations in the stems and roots of the rubber trees were quite different under different competition intensities (Figure 2b,c; Supplementary Figure S8b,c), especially for the allocation of N (Figure 4c). Under weak and moderate competition, the decreased N concentration of the rubber stems (Figure 2b) and the increased N concentration of the rubber roots (Figure 2c) indicated that the N was translocated from the rubber stems to the rubber roots. The predicted probability distributions of the N status of the rubber leaves, stems, and roots in the Bayesian network also verified this (Supplementary Figure S9). With the increase in the competition intensity, the top-down nutrient translocation of the rubber trees was enhanced, and the N retranslocation from the rubber leaves to the rubber stems might prompt N retranslocation from the rubber leaves to the rubber roots (Figure 4c).
In contrast, the effects of competition for P resources on the allocation of nutrients in the rubber trees were relatively mild (Figure 2a‒c). This may be because plants acquire less mobile soil P depending on their root distribution and root functional performance [18]. The rubber trees had a large advantage in competing for soil P because their roots were more developed than those of the other crops. For example, the lateral roots of the rubber plants extended over 9 m, and the exposed feeder roots above the ground (Supplementary Figure S10) could even acquire nutrients from the litter [45].

4.3. The Linkage Effects of Nutrient Competition

It is very difficult to outline a common structure from these nutrient correlation networks because of their complex and variable structures (Figure 4a; Supplementary Figure S7). However, such complex networks indicate that changes in one node will result in changes in other nodes. Moreover, the different structures of these networks indicate that interspecific competition could alter the nutrient networks. This is because all of the links in nutrient cycling are dynamic and interlocking [11,17,41]. Dynamic variations in the absorption of nutrients by plants, nutrient translocation, and retranslocation among plant organs and nutrient movement within the soil may generate many uncertainties that complicate any understanding of competition effects [1,9]. Therefore, it is difficult to apply traditional tools for regression and classification to model these epistemic uncertainties. However, a Bayesian network, as a probabilistic graphical model for assessing and predicting uncertain consequences and drivers, is an appropriate tool to solve these problems [9,46].
By comparing the posterior probability (Figure 5c), the variations in the root nutrient statuses were found to be more sensitive to interspecific competition than the other parameters studied. This is mainly because plant roots can detect the roots of neighboring species with great sensitivity and respond rapidly [47,48]. As the main organ that directly participates in nutrient competition, plant roots always adjust their growth in the process of competition, and the variations in the root nutrient status were obvious with the increase in the competition intensities (Figure 5c). In contrast, the nutrient statuses of the rubber leaves, rubber stems, litter, and soil could indicate only whether or not the competition was intense (Figure 6).
Through the Bayesian network, this study also found that the variations in the nutrient status of the rubber roots affected the probability distribution of the nutrient statuses of the other nodes under different competition intensities. This phenomenon verified the strong linkage effects of the competition for nutrients and the close interrelationship of aboveground growth, belowground growth, and environmental resources. In other words, belowground competition affects aboveground plant growth and may thus alter the outcome of aboveground competition because the complex relationships between aboveground and belowground competition are closely related to the availability of soil resources [49,50].
Therefore, diagnosis of the root nutrient status is important and cannot be neglected in nutrient competition studies, and an integrated analysis of the nutrient status of each nutrient cycling node best explains the effects of competition for nutrients.

4.4. The Mechanism of Nutrient Competition

The concentration reduction hypothesis essentially suggests that one plant species competes with others based on its ability to reduce the availability of resources in its surroundings [42]. However, the supply preemption hypothesis [9,51] suggests that plants compete with their neighbors by preempting the resources because the partitioning of nutrient supplies is proportional to their root length and density. Based on the above competition theories, this study verified that belowground competition could result in a reduction in nutrient concentrations within the soil. This is not only because the growth of plant roots could be stimulated by competition and thus help plants preemptively gather nutrient resources but also because plant–root interactions change the soil physicochemical properties and may thus accelerate the leaching of soil nutrients to deep soil layers. Moreover, plant nutrient storage organs also play a vital role in the process of competition because their nutrient support could help plants endure poor nutrient environments. Therefore, a combination of these two competition hypotheses may better explain the mechanisms of belowground competition.
In brief, roots directly participate in belowground competition because they intercept nutrients and expand their area of contact with the soil and enhance the movement of nutrients to roots by diffusion and mass flow [18]. Of course, diffusion and mass flow are also determined by the soil water availability and the mobility of nutrients within the soil [52], such as the different mobilities of soil N and P. Therefore, competition for soil nutrients by plant roots becomes very complex because each nutrient exhibits special dynamic variations within the soil [1,50]. In fact, interspecific competition may be more complex because belowground competition can affect the growth of aboveground tissues, which could in turn affect belowground competition. This is because the processes of competition for soil water, soil nutrients, and light (i.e., belowground and aboveground competition) are tightly coupled, as demonstrated by the fact that any variations in water availability, stomatal closure, atmospheric CO2 movement into plant leaves, and light availability may alter the competition outcome [53]. For example, plant competition for light could result in a loss of plant biodiversity in species-rich European grasslands even when the environment is enriched with nutrients [54]. Therefore, a better understanding of the nutrient statuses of belowground and aboveground organs will enable an understanding of plant competition mechanisms.

5. Conclusions

Intercropping could help increase the soil C and N concentrations in rubber plantations, but the negative effects of interspecific competition gradually offset such increases in soil nutrients with the increase in competition intensity. This was mainly caused by the competitive absorption of soil nutrients by plant roots and the effects of interspecific root interactions on the soil physicochemical properties. Plants can detect the roots of their neighbors and rapidly improve their root nutrient status to enhance their root growth and competitive ability. However, such processes alter nutrient allocation among plant organs. With increases in the competition intensity, nutrient translocation from the leaves and stems to the roots is enhanced. Such processes result in an insufficient nutrient supply from the stems to the leaves if the competition is intense, and thus, the nutrient concentrations of the stems and leaves decrease. Therefore, the initial quality of the litter also decreases, and the release of nutrients from the litter to the soil decreases. Therefore, with increases in the competition intensity, the decreases in the soil nutrient concentrations caused by interspecific competition are aggravated and thus profoundly affect the nutrient status and nutrient cycling of the entire mixed-species system.
In general, this study showed for the first time how belowground competition alters the allocation of nutrients in woody plants in rubber AFSs and revealed the linkage effects on the nutrient statuses of plant organs, litter, and soil as the competition intensity increases. This study also demonstrated for the first time that diagnosis of the root nutrient status of rubber trees could indicate the intensity of nutrient competition in rubber AFSs. Therefore, the findings of this study could help researchers determine the effects of various competition control measures (e.g., neighboring species selection, planting patterns, fertilization) on the intensity of plant interspecific competition in rubber AFSs and thus identify effective control methods.

Supplementary Materials

Supplementary materials can be found at www.mdpi.com/xxx/s1.Table S1: Results of a general linear model testing the effects on the C, N, and P concentrations (i.e., C, N, and P) of the litter, soil, and all plant organs of rubber trees and their intercrops. Figure S1: (a) Rubber tapping period, the season, the phenophase of the rubber tree, and the sampling date, (b) sketch maps of the sampling in the AFSs. FS, fruit setting; FR, fruit ripening; DS, dormant stage; LS, leaf shedding; LF, leaf flushing; LE, leaf expansion; FP, flowering phase. Figure S2: (a) Rubber tapping period, the season, the phenophase of the rubber tree, and the sampling date, (b) sketch maps of the sampling in the AFSs. FS, fruit setting; FR, fruit ripening; DS, dormant stage; LS, leaf shedding; LF, leaf flushing; LE, leaf expansion; FP, flowering phase. Figure S3: C concentration in different plant organs, litter, and soil in (a) rubber and cocoa, (b) rubber and flemingia, (c) rubber and tea, and (d) rubber and coffee AFSs. RM indicates rubber monoculture, which is shown as the red box area in the histograms. R_Leaf, R_Stem, and R_Root represent the leaves, stems, and roots of rubber trees, respectively, while I_Leaf, I_Stem, and I_Root represent the leaves, stems, and roots of the intercrops in each AFS, respectively. Different lowercase letters in the blue bars of the histograms indicate significant differences among season after post hoc Tukey’s tests (α = 0.01). The data are expressed as the means ± SDs. Figure S4: N concentrations of different plant organs, litter, and soil in (a) rubber and cocoa, (b) rubber and flemingia, (c) rubber and tea, and (d) rubber and coffee AFSs. See Figure S3 for abbreviations and related descriptions. The data are expressed as the means ± SDs. Figure S5: P concentration of different plant organs, litter, and soil in (a) rubber and cocoa, (b) rubber and flemingia, (c) rubber and tea, and (d) rubber and coffee AFSs. See Figure S3 for abbreviations and related descriptions. The data are expressed as the means ± SDs. Figure S6: Litter C:N and C:P ratios in each AFS. The red box indicates the RM. The bold asterisk marks a significant difference in the C:N and C:P ratios of the litter between the RM and each AFS (P ≤ 0.01). Figure S7: The correlation network in (a) RM (rubber monoculture), (b) all AFSs, and the (c) rubber and cocoa, (d) rubber and flemingia, (e) rubber and tea, and (f) rubber and coffee AFSs. The color of a connecting line indicates the sign of the correlation (blue indicates a positive correlation, and red indicates a negative correlation), and the width indicates the strength of the correlation. All the correlation coefficients reach an extremely significant level (P < 0.01) and are not less than 0.5. Figure S8: Pearson correlation-based similarity in (a) rubber leaf, (b) rubber stem, (c) rubber root, (d) litter, and (e) soil among the RM (rubber monoculture), COC (rubber and cocoa AFS), FLE (rubber and flemingia AFS), TEA (rubber and tea AFS), and COF (rubber and coffee AFS). All the similarities reach a significant level (P < 0.05). Figure S9: The probability distribution of the N status of the rubber leaves and roots for a decreasing N concentration in the rubber stems. The black frame indicates the observed condition. Figure S10: Exposed fine roots of rubber trees above the ground.

Author Contributions

Conceptualization, J.W., H.Z. and W.L.; methodology, J.W. and H.Z.; software, J.W. and F.Z.; validation, J.W., H.Z. and C.C.; formal analysis, J.W.; investigation, J.W., H.Z., F.Z., P.W. and X.Z.; resources, X.J.; data curation, J.W. and H.Z.; writing—original draft preparation, J.W., H.Z., F.Z. and C.C.; writing—review and editing, X.J., Z.W. and W.L.; visualization, J.W.; supervision, W.L.; project administration, J.W., X.J., and W.L.; funding acquisition, J.W., X.J. and W.L. All authors have read and agreed to the published version of the manuscript.

Funding

This research was funded by the National Natural Science Foundation of China (31800356, 31570622 and 41701029), the National Postdoctoral Program for Innovative Talents (BX201700278), the Postdoctoral Science Foundation of China (2018M633437), the Fourth-Oriented Training Foundation for Postdoctors of Yunnan Province, the Scientific Research Foundation for Postdoctors of Yunnan Province, the Natural Science Foundation of Yunnan Province (2014HB042), the “PhD Plus” Talents Training Programme Foundation of XTBG, and the CAS 135 Program (2017XTBG-F01).

Acknowledgments

We thank Deng Y, LI WX, Liu MN, and the Central Laboratory of XTBG for the help provided. We also appreciate the data support from the Xishuangbanna Station for Tropical Rainforest Ecosystem Studies.

Conflicts of Interest

The authors declare no conflict of interest.

References

  1. Craine, J.M.; Dybzinski, R. Mechanisms of plant competition for nutrients, water and light. Funct. Ecol. 2013, 27, 833–840. [Google Scholar] [CrossRef]
  2. FAO; IAEA. Management of agroforestry systems for enhancing resource use efficiency and crop productivity. Joint FAO/IAEA Division of Nuclear Techniques in Food and Agriculture, Vienna. 2008. Available online: https://www-pub.iaea.org/MTCD/Publications/PDF/te_1606_web.pdf (accessed on 7 October 2020).
  3. van Noordwijk, M.V.; Cadisch, G.; Ong, C.K. Below-Ground Interactions in Tropical Agroecosystems: Concepts and Models with Multiple Plant Components; Centre for Agriculture and Biosciences International: Wallingford, UK, 2004. [Google Scholar]
  4. Langenberger, G.; Cadisch, G.; Martin, K.; Min, S.; Waibel, H. Rubber intercropping: A viable concept for the 21st century? Agrofor. Syst. 2017, 91, 577–596. [Google Scholar] [CrossRef]
  5. Grace, J.B. A Clarification of the Debate Between Grime and Tilman. Funct. Ecol. 1991, 5, 583. [Google Scholar] [CrossRef]
  6. Craine, J.M. Reconciling plant strategy theories of Grime and Tilman. J. Ecol. 2005, 93, 1041–1052. [Google Scholar] [CrossRef]
  7. Grime, J.P. Plant strategy theories: A comment on Craine (2005). J. Ecol. 2007, 95, 227–230. [Google Scholar] [CrossRef]
  8. Tilman, D. Resource competition and plant traits: A response to Craine et al. 2005. J. Ecol. 2007, 95, 231–234. [Google Scholar] [CrossRef]
  9. Craine, J.M. Plant strategy theories: Replies to Grime and Tilman. J. Ecol. 2007, 95, 235–240. [Google Scholar] [CrossRef]
  10. Trinder, C.J.; Brooker, R.W.; Robinson, D. Plant ecology’s guilty little secret: Understanding the dynamics of plant competition. Funct. Ecol. 2013, 27, 918–929. [Google Scholar] [CrossRef]
  11. Zechmeister-Boltenstern, S.; Keiblinger, K.M.; Mooshammer, M.; Peñuelas, J.; Richter, A.; Sardans, J.; Wanek, W. The application of ecological stoichiometry to plant–microbial–soil organic matter transformations. Ecol. Monogr. 2015, 85, 133–155. [Google Scholar] [CrossRef] [Green Version]
  12. Feng, Y.Z. Man-Made Community; Yunnan Science and Technology Press: Kunming, China, 2007. [Google Scholar]
  13. DiTommaso, A.; Aarssen, L.W. Effect of nutrient level on competition intensity in the field for three coexisting grass species. J. Veg. Sci. 1991, 2, 513–522. [Google Scholar] [CrossRef]
  14. Mamolos, A.P.; Veresoglou, D.S. Patterns of root activity and responses of species to nutrients in vegetation of fertile alluvial soil. Plant Ecol. 2000, 148, 245–253. [Google Scholar] [CrossRef]
  15. Güsewell, S.; Koerselman, W.; Verhoeven, J.T.A. Biomass N:P ratios as indicators of nutrient limitation for plant populations in wetlands. Ecol. Appl. 2003, 13, 372–384. [Google Scholar] [CrossRef]
  16. Vrignon-Brenas, S.; Gay, F.; Ricard, S.; Snoeck, D.; Perron, T.; Mareschal, L.; Malagoli, P. Nutrient management of immature rubber plantations. A review. Agron. Sustain. Dev. 2019, 39, 11. [Google Scholar] [CrossRef] [Green Version]
  17. Hobbie, S.E. Effects of plant species on nutrient cycling. Trends Ecol. Evol. 1992, 7, 336–339. [Google Scholar] [CrossRef]
  18. Chapin, F.S., III; Matson, P.A.; Mooney, H.A. Principles of Terrestrial Ecosystem Ecology; Springer: New York, NY, USA, 2011. [Google Scholar]
  19. Berhongaray, G.; King, J.S.; Janssens, I.A.; Ceulemans, R. An optimized fine root sampling methodology balancing accuracy and time investment. Plant Soil 2013, 366, 351–361. [Google Scholar] [CrossRef]
  20. Lukac, M. Fine Root Turnover. In Measuring Roots; Mancuso, S., Ed.; Springer: New York, NY, USA, 2012; pp. 363–373. [Google Scholar]
  21. Rewald, B.; Meinen, C.; Trockenbrodt, M.; Ephrath, J.E.; Rachmilevitch, S. Root taxa identification in plant mixtures-current techniques and future challenges. Plant Soil 2012, 359, 165–182. [Google Scholar] [CrossRef] [Green Version]
  22. McCormack, M.L.; Dickie, I.A.; Eissenstat, D.M.; Fahey, T.J.; Fernandez, C.W.; Guo, D.; Helmisaari, H.; Hobbie, E.A.; Jackson, R.B.; Leppälammi-Kujansuu, J.; et al. Redefining fine roots improves understanding of below-ground contributions to terrestrial biosphere processes. New Phytol. 2015, 207, 505–518. [Google Scholar] [CrossRef]
  23. Gordon, W.S.; Jackson, R.B. Nutrient Concentrations in Fine Roots. Ecology 2000, 81, 275–280. [Google Scholar] [CrossRef]
  24. Pregitzer, K.S.; DeForest, J.L.; Burton, A.J.; Allen, M.F.; Ruess, R.W.; Hendrick, R.L. Fine Root Architecture of Nine North American Trees. Ecol. Monogr. 2002, 72, 293–309. [Google Scholar] [CrossRef]
  25. Van Noordwijk, M.; Lawson, G.; Hairiah, K.; Wilson, J. Root distribution of trees and crops: Competition and/or complementarity. In Tree-Crop Interactions: Agroforestry in a Changing Climate; Ong, C.K., Black, C., Wilson, J., Eds.; Centre for Agriculture and Biosciences International: Wallingford, UK, 2015; pp. 221–257. [Google Scholar]
  26. Wu, J.; Liu, W.; Chen, C. Below-ground interspecific competition for water in a rubber agroforestry system may enhance water utilization in plants. Sci. Rep. 2016, 6, 19502. [Google Scholar] [CrossRef]
  27. Wu, J.; Liu, W.; Chen, C. Can intercropping with the world’s three major beverage plants help improve the water use of rubber trees? J. Appl. Ecol. 2016, 53, 1787–1799. [Google Scholar] [CrossRef]
  28. Grace, J.B. On the measurement of plant competition intensity. Ecology 1995, 76, 305–308. [Google Scholar] [CrossRef]
  29. Weigelt, A.; Jolliffe, P. Indices of plant competition. J. Ecol. 2003, 91, 707–720. [Google Scholar] [CrossRef] [Green Version]
  30. R Core Team. R: A language and environment for statistical computing. 2019. Available online: https://www.r-project.org/ (accessed on 7 November 2019).
  31. Revelle, W. Psych: Procedures for Personality and Psychological Research. 2020. Available online: https://cran.r-project.org/web/packages/psych/ (accessed on 8 January 2020).
  32. Wei, T.; Simko, V. R package "corrplot": Visualization of a Correlation Matrix (Version 0.84). 2017. Available online: https://cran.r-project.org/web/packages/corrplot/index.html (accessed on 16 October 2017).
  33. Hair, J.F.; Black, W.C.; Babin, B.J.; Anderson, R.E. Multivariate Data Analysis, 7th ed.; Prentice Hall: Upper Saddle River, NJ, USA, 2010. [Google Scholar]
  34. Epskamp, S.; Cramer, A.O.; Waldorp, L.J.; Schmittmann, V.D.; Borsboom, D. Qgraph: Network visualizations of relationships in psychometric data. J. Stat. Softw. 2012, 48, 1–18. [Google Scholar] [CrossRef] [Green Version]
  35. Druzdzel, M.J. SMILE: Structural Modeling, Inference, and Learning Engine and GeNIe: A development environment for graphical decision-theoretic models. In Proceedings of the 16th National Conference on Artificial Intelligence, Orlando, FL, USA, 18–22 July 1999; pp. 902–903. [Google Scholar]
  36. Chen, C.; Liu, W.; Jiang, X.; Wu, J. Effects of rubber-based agroforestry systems on soil aggregation and associated soil organic carbon: Implications for land use. Geoderma 2017, 299, 13–24. [Google Scholar] [CrossRef]
  37. Schulten, H.R.; Schnitzer, M. The chemistry of soil organic nitrogen: A review. Biol. Fertil. Soils 1997, 26, 1–15. [Google Scholar] [CrossRef]
  38. Jiang, X.; Liu, W.; Wu, J.; Wang, P.; Liu, C.; Yuan, Z. Land degradation controlled and mitigated by rubber-based agroforestry systems through optimizing soil physical conditions and water supply mechanisms: A case study in Xishuangbanna, China. Land Degrad. Dev. 2017, 28, 2277–2289. [Google Scholar] [CrossRef]
  39. Huston, M.A.; Deangelis, D.L. Competition and coexistence: The effects of resource transport and supply rates. Am. Nat. 1994, 144, 954–977. [Google Scholar] [CrossRef]
  40. Hodge, A.; Robinson, D.; Griffiths, B.S.; Fitter, A.H. Why plants bother: Root proliferation results in increased nitrogen capture from an organic patch when two grasses compete. Plant Cell Environ. 2010, 22, 811–820. [Google Scholar] [CrossRef]
  41. Mengel, K.; Kirkby, E.A.; Kosegarten, H.; Appel, T. Principles of Plant Nutrition; Springer: New York, NY, USA, 2001. [Google Scholar]
  42. Tilman, D.; Wedin, D. Plant traits and resource reduction for five grasses growing on a nitrogen gradient. Ecology 1991, 72, 685–700. [Google Scholar] [CrossRef]
  43. Killingbeck, K.T. Nutrients in Senesced Leaves: Keys to the Search for Potential Resorption and Resorption Proficiency. Ecology 1996, 77, 1716–1727. [Google Scholar] [CrossRef]
  44. Bennett, E.; Roberts, J.A.; Wagstaff, C. Manipulating resource allocation in plants. J. Exp. Bot. 2012, 63, 3391–3400. [Google Scholar] [CrossRef] [PubMed] [Green Version]
  45. Priyadarshan, P.M. Biology of Hevea Rubber; Centre for Agriculture and Biosciences International: Wallingford, UK, 2011. [Google Scholar]
  46. Gal, Y.; Ghahramani, Z. Dropout as a bayesian approximation: Representing model uncertainty in deep learning. Available online: http://proceedings.mlr.press/v48/gal16.pdf (accessed on 14 August 2020).
  47. Callaway, R.M. The detection of neighbors by plants. Trends Ecol. Evol. 2002, 17, 104–105. [Google Scholar] [CrossRef]
  48. Kong, C.H.; Zhang, S.Z.; Li, Y.H.; Xia, Z.C.; Yang, X.F.; Meiners, S.J.; Wang, P. Plant neighbor detection and allelochemical response are driven by root-secreted signaling chemicals. Nat. Commun. 2018, 9, 1–9. [Google Scholar] [CrossRef] [PubMed] [Green Version]
  49. Cahill, J.F. Fertilization effects on interactions between above-and belowground competition in an old field. Ecology 1999, 80, 466–480. [Google Scholar] [CrossRef]
  50. Aschehoug, E.T.; Brooker, R.; Atwater, D.Z.; Maron, J.L.; Callaway, R.M. The mechanisms and consequences of interspecific competition among plants. Annu. Rev. Ecol. Evol. Syst. 2016, 47, 263–281. [Google Scholar] [CrossRef] [Green Version]
  51. Craine, J.M.; Fargione, J.; Sugita, S. Supply pre-emption, not concentration reduction, is the mechanism of competition for nutrients. New Phytol. 2005, 166, 933–940. [Google Scholar] [CrossRef]
  52. Tinker, P.B.; Nye, P.H. Solute Movement in the Rhizosphere; Oxford University Press: Oxford, UK, 2000. [Google Scholar]
  53. Schwinning, S.; Kelly, C.K. Plant competition, temporal niches and implications for productivity and adaptability to climate change in water-limited environments. Funct. Ecol. 2013, 27, 886–897. [Google Scholar] [CrossRef]
  54. Hautier, Y.; Niklaus, P.A.; Hector, A. Competition for light causes plant biodiversity loss after eutrophication. Science 2009, 324, 636–638. [Google Scholar] [CrossRef] [Green Version]
Figure 1. (a) Schematic diagram of an agroforestry system; (b) the common nutrient cycling processes in an agroforestry system.
Forests 11 01163 g001
Figure 2. The negative relative competition intensity (NRCI) indexes of each agroforestry system (AFS), which were calculated through the carbon (C), nitrogen (N), and phosphorous (P) concentrations of (a) rubber leaves, (b) rubber stems, (c) rubber roots, (d) litter, and (e) soil. The shaded area indicates the 95% confidence interval.
Forests 11 01163 g002
Figure 3. The results of factor analysis including (a) the correlations among all NRCI indexes, which were calculated through the C, N, and P concentrations of the rubber leaves (Leaf_C, Leaf_N, Leaf_P), rubber stems (Stem_C, Stem_N, Stem_P), rubber roots (Root_C, Root_N, Root_P), litter (Litter_C, Litter_N, Litter_P), and soil (Soil_C, Soil_N, Soil_P), respectively; (b) the composite scores of each site. “FA” is short for “factor analysis”. Different lowercase letters indicate significant differences among the AFSs (p < 0.01).
Forests 11 01163 g003
Figure 4. (a) The nutrient correlation networks (r ≥ 0.5; p < 0.05) in the rubber monoculture (RM), rubber and cocoa, rubber and flemingia, rubber and tea, and rubber and coffee AFSs; (b) the C correlations, (c) N correlations, and (d) P correlations among the rubber leaves, stems, and roots from each site. The blue and red connecting lines indicate positive and negative correlations, respectively. Their width indicates the strength of the correlation. The connecting correlation lines that were not discussed specifically are indicated by the faint colors.
Forests 11 01163 g004
Figure 5. (a) The basic structure of the Bayesian network; (b) the custom fitted Bayesian network based on nutrient data and expert knowledge; (c) the posterior probability distributions of the variations in the nutrient status of the plant organs, litter, and soil under different competition intensities; the difference in the probability of nutrient status between (d) the weak competition and moderate competition and between (e) the moderate competition and intense competition.
Forests 11 01163 g005
Figure 6. The predicted probabilities of the competition intensity under the combination of different observed nutrient statuses of the rubber leaves, stems, roots, litter, and soil. Red, yellow, and green pies indicated the possible nutrient status (i.e., increase, normal, and decrease status, respectively) of leaf, stem, root, litter, or soil. The baby-blue, royal-blue, and dark-blue bars indicate the probabilities of weak competition, moderate competition and intense competition, respectively.
Forests 11 01163 g006
Publisher’s Note: MDPI stays neutral with regard to jurisdictional claims in published maps and institutional affiliations.