Post-Wildfire Regeneration in a Sky-Island Mixed- Conifer Ecosystem of the North American Great Basin


Abstract
1. Introduction
2. Materials and Methods
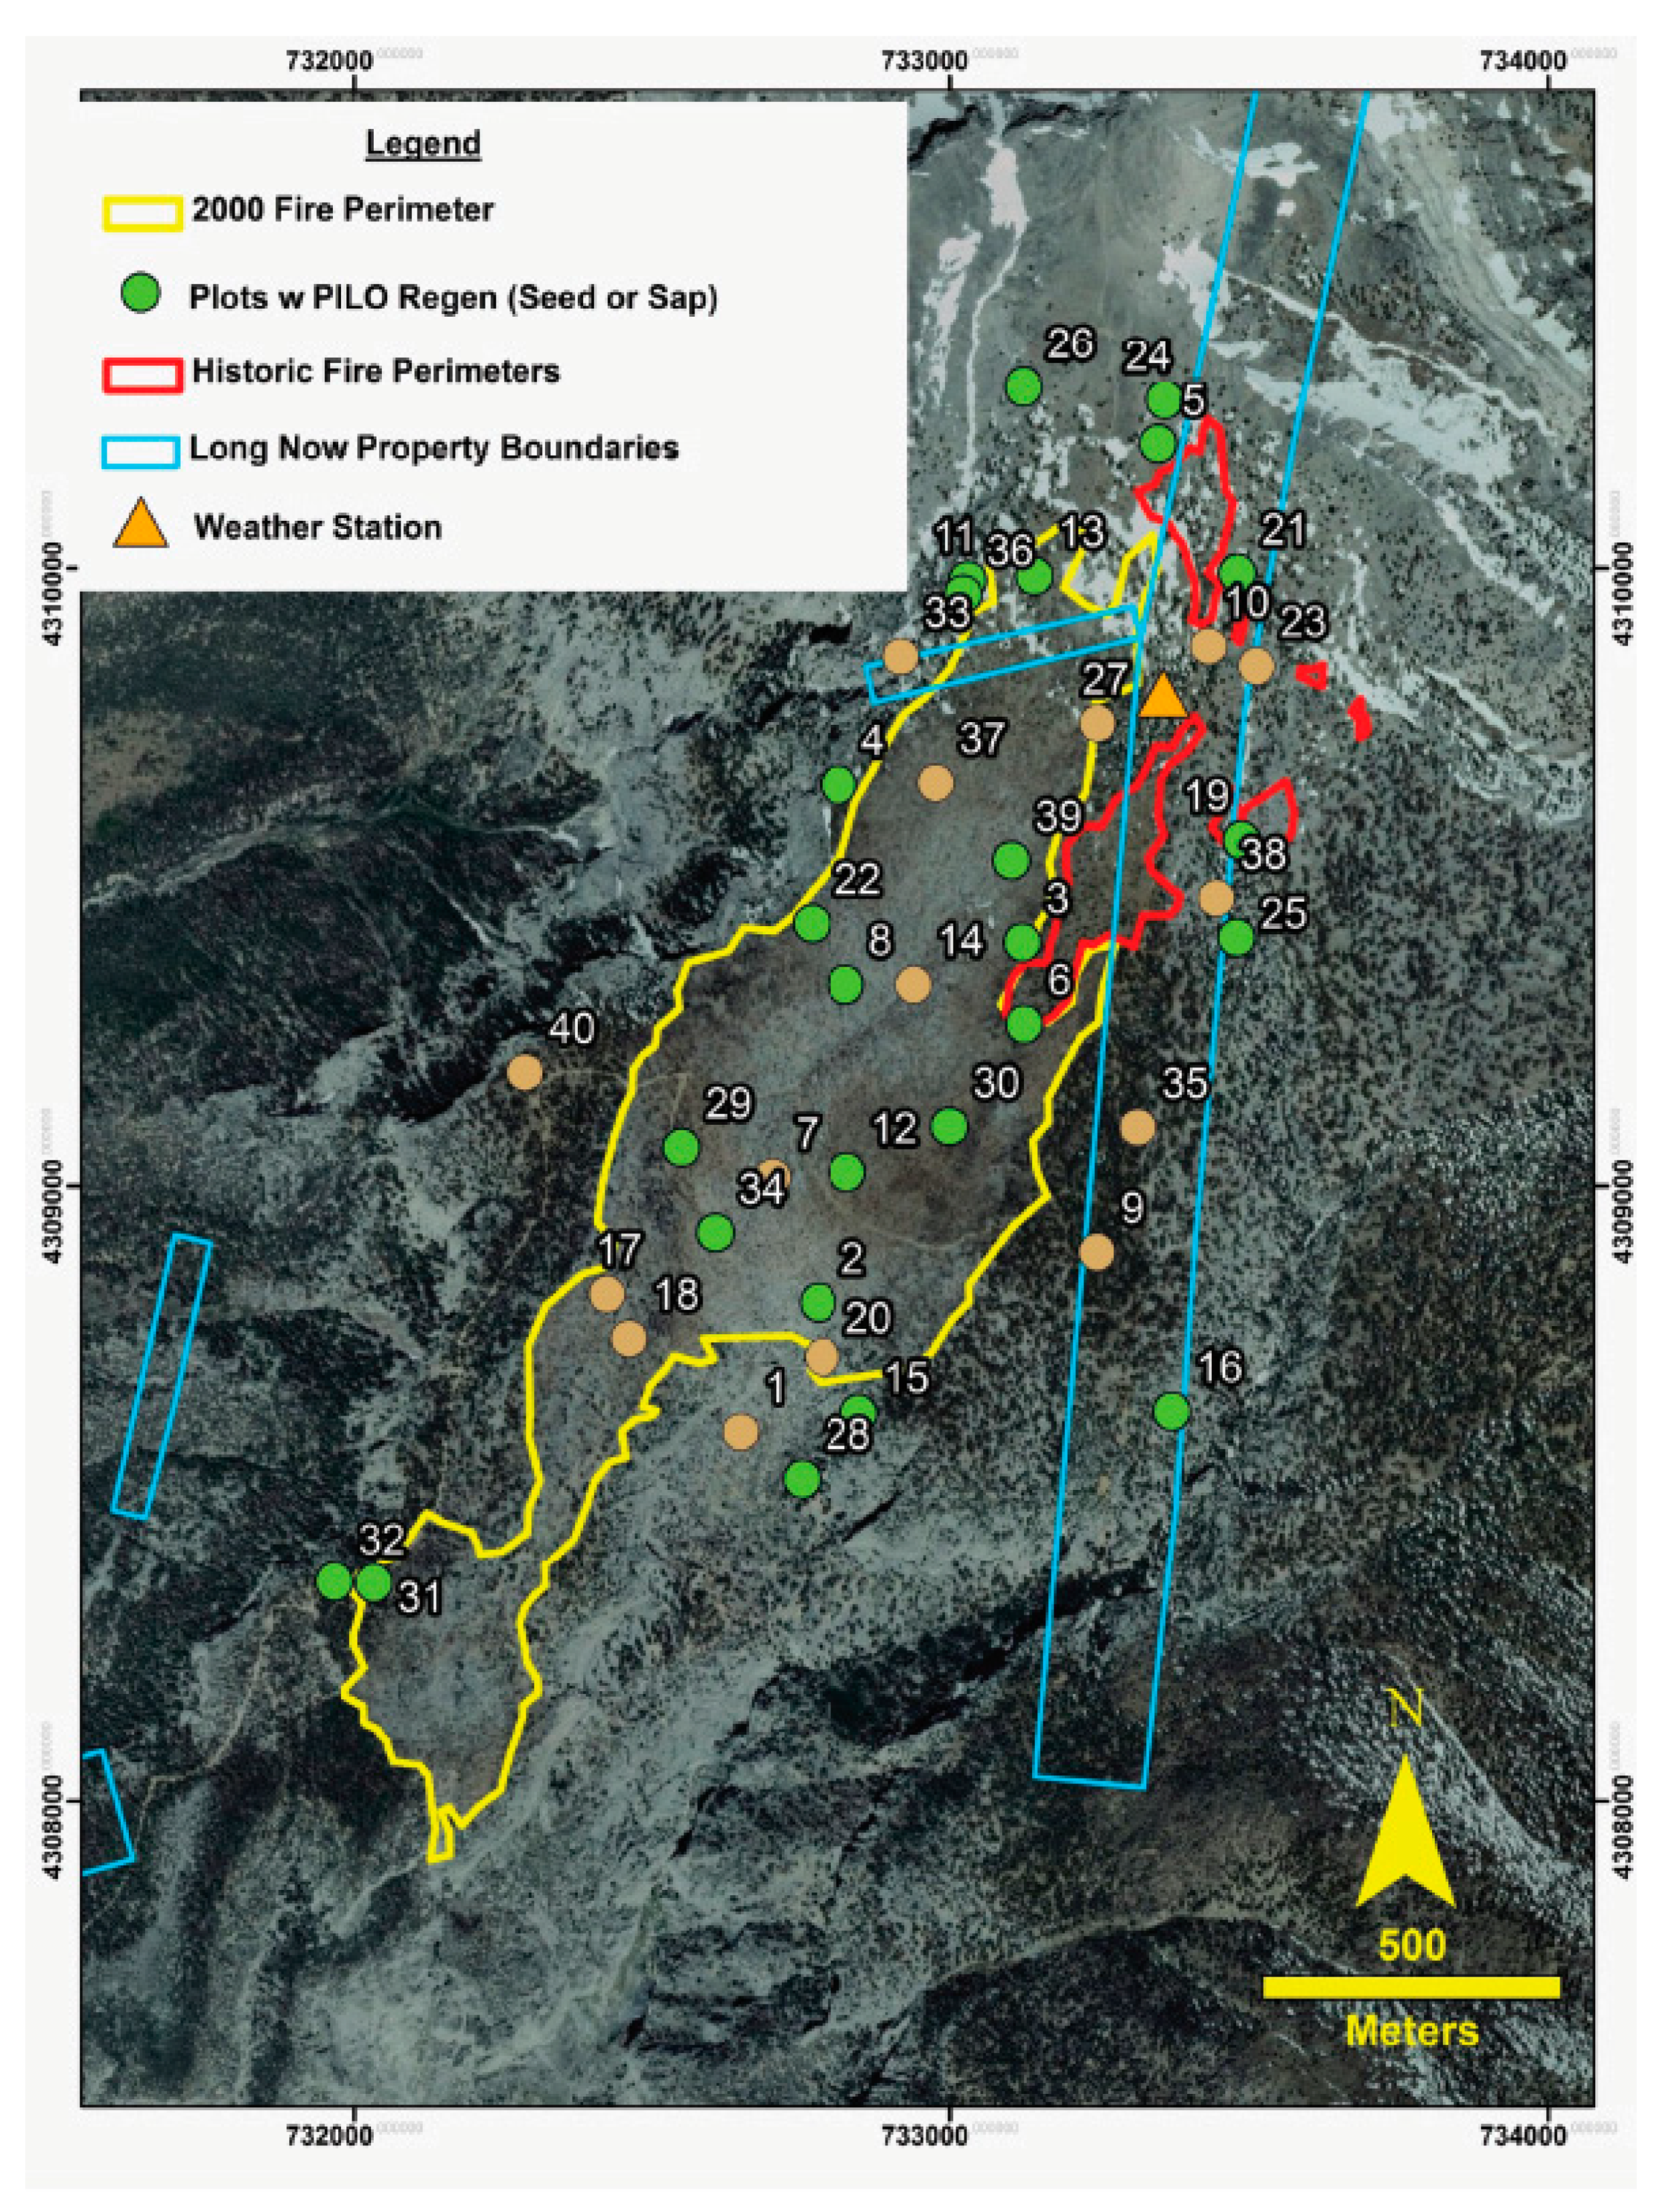
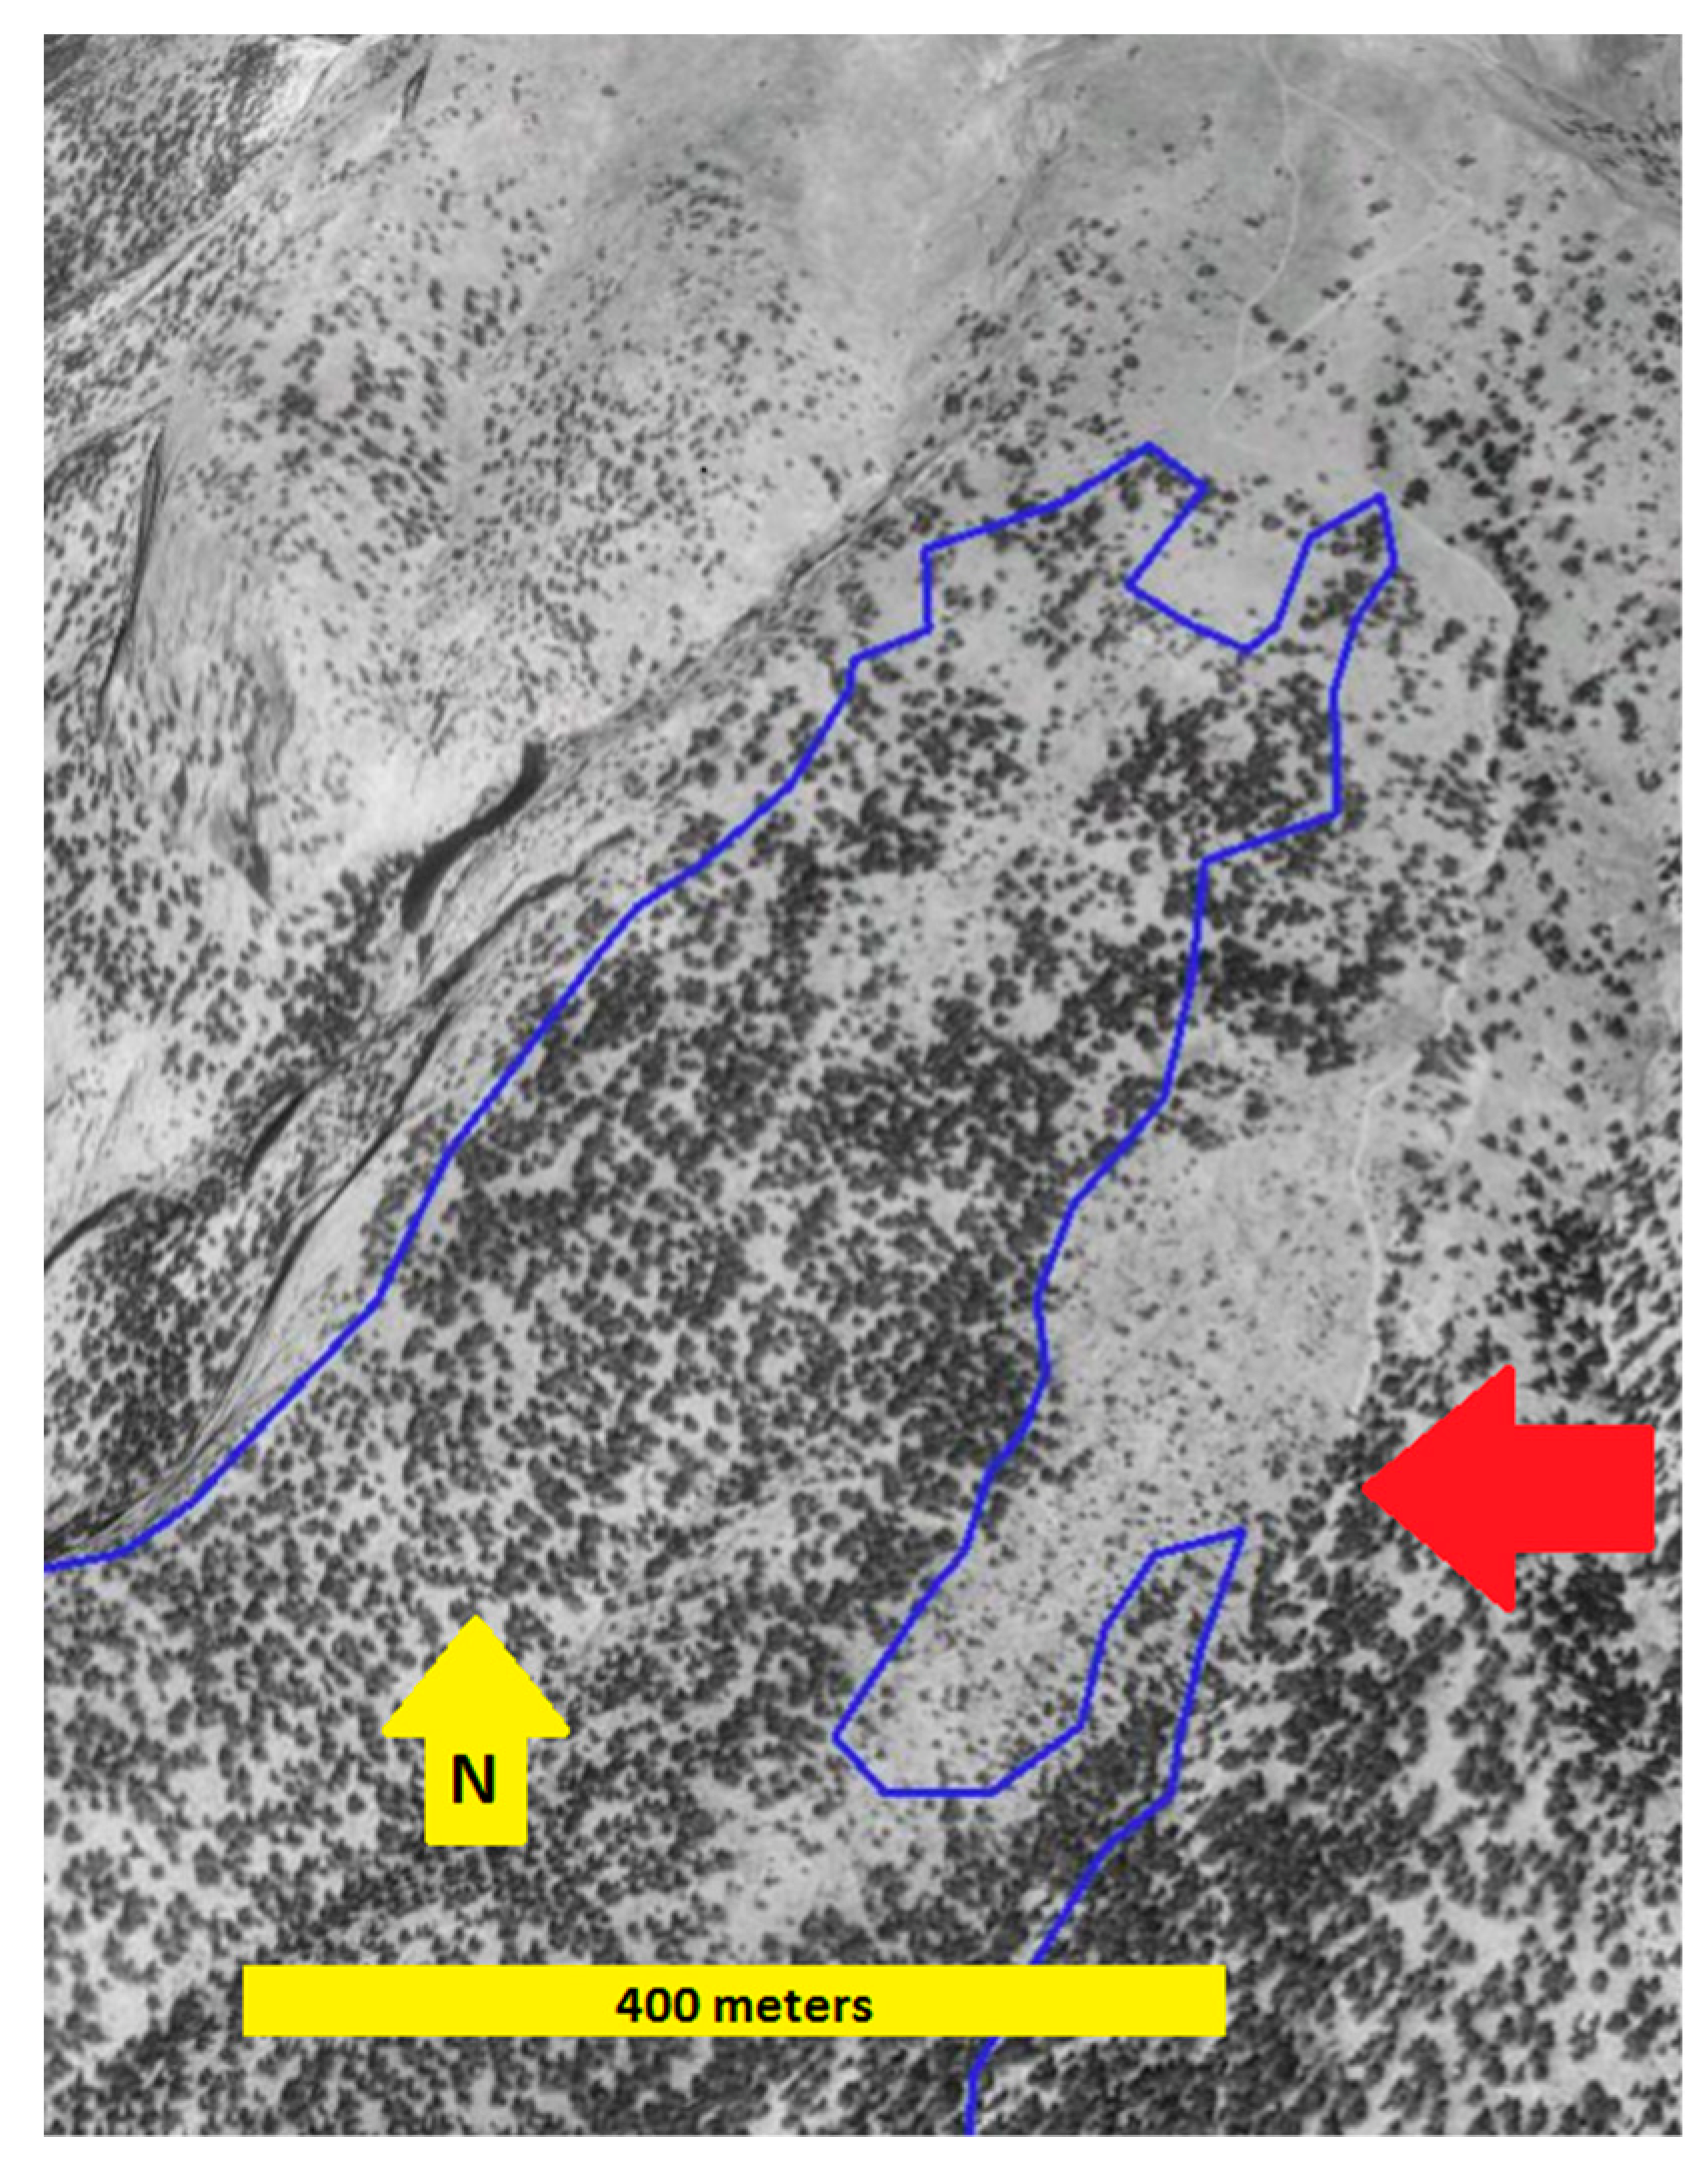
2.1. Study Area
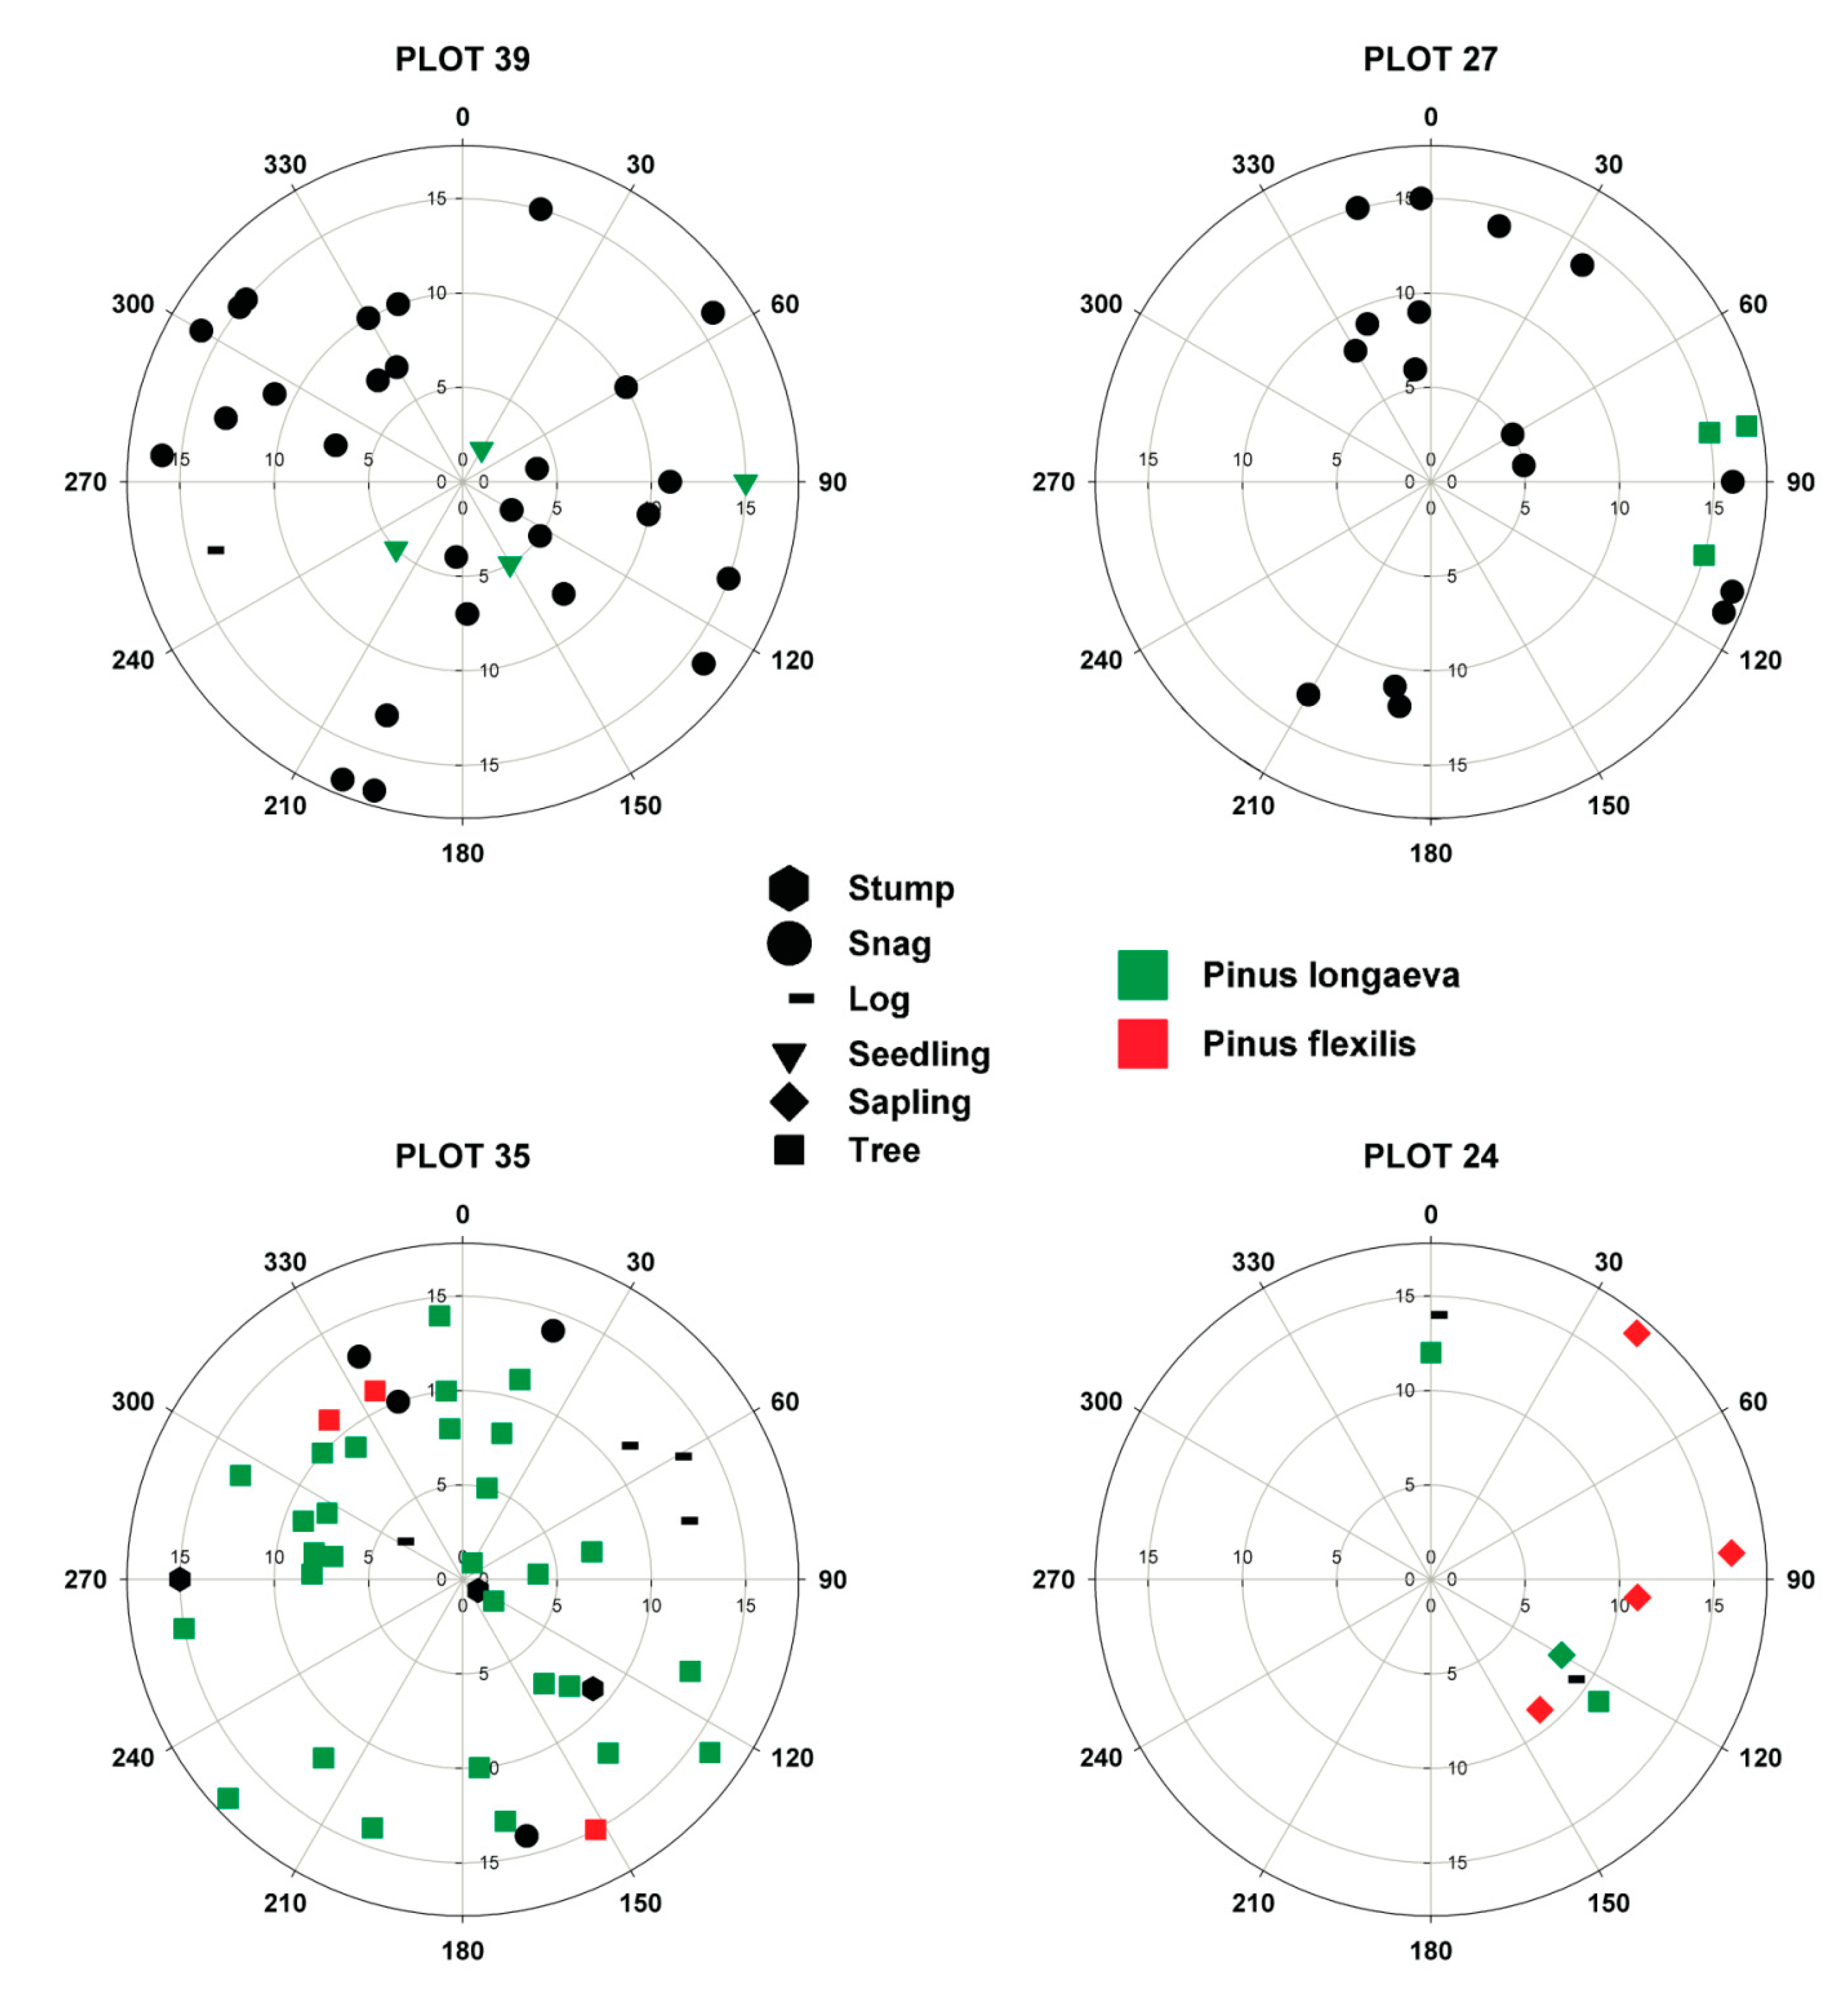
2.2. Field Sampling
2.3. Data Analysis
3. Results
3.1. Fire Mapping
3.2. Vegetation Analysis
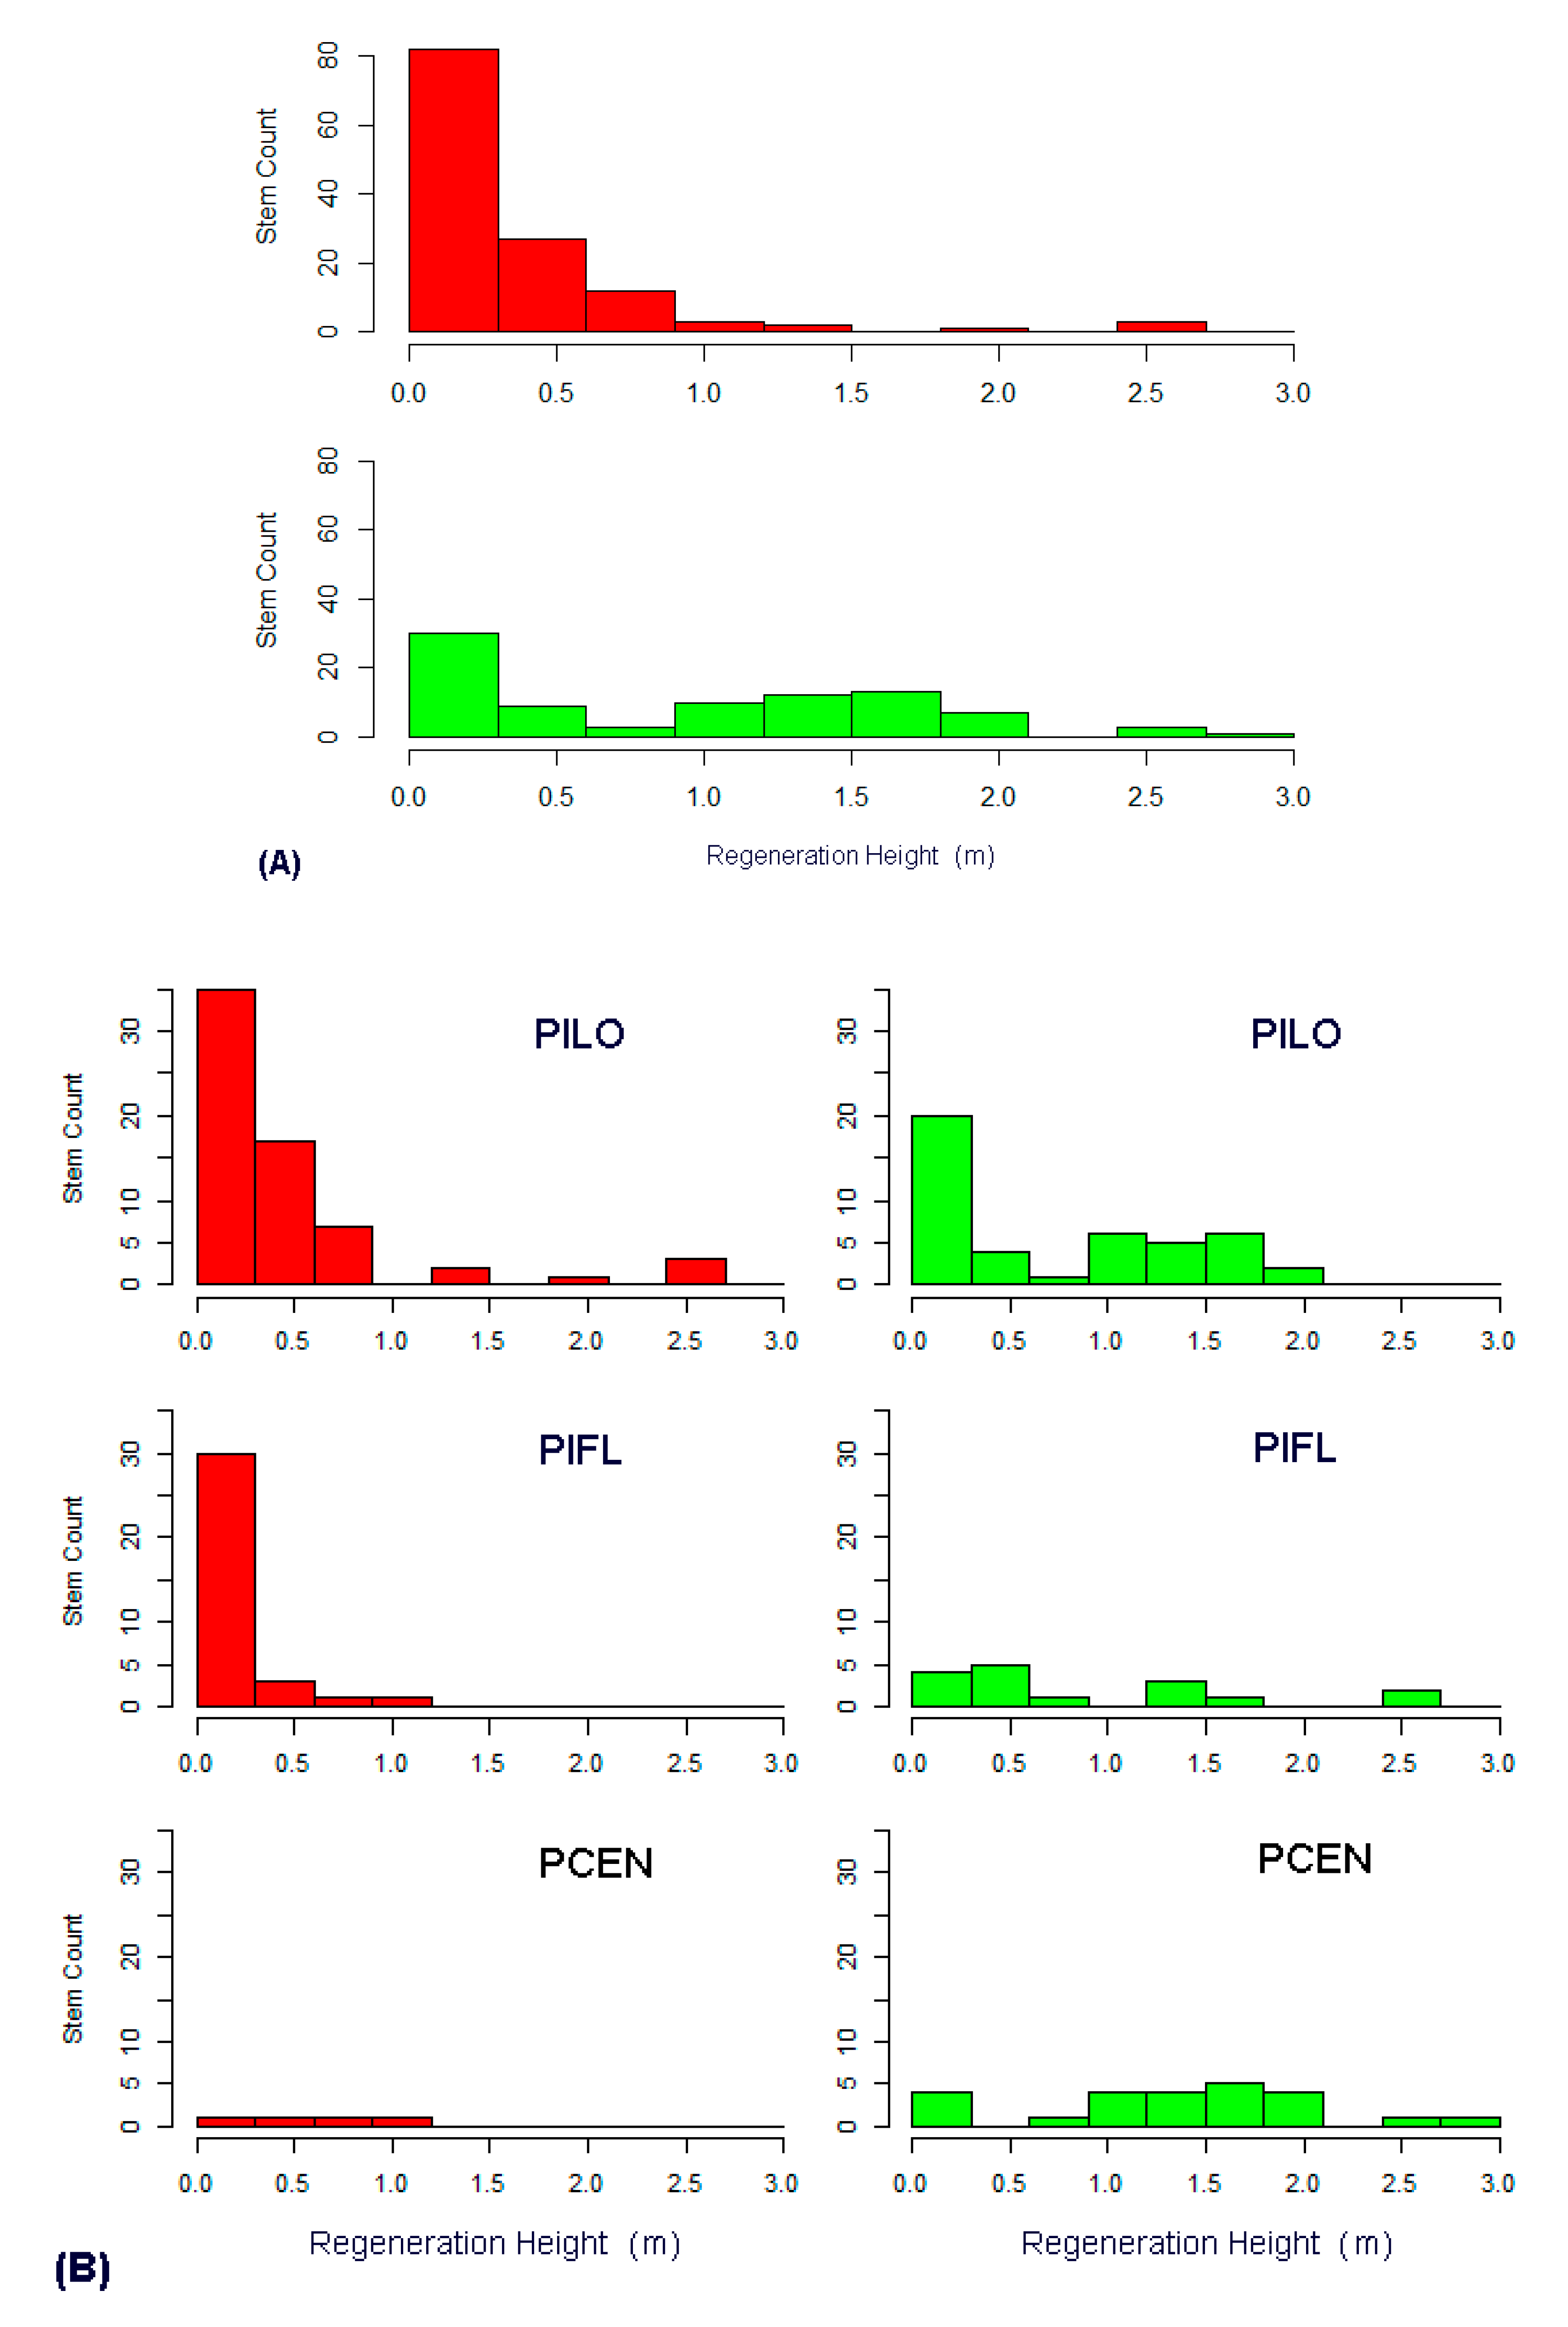
3.3. Regeneration Analysis
4. Discussion
5. Conclusions
Supplementary Materials
Author Contributions
Funding
Acknowledgments
Conflicts of Interest
References
- Bond, W.J.; Keeley, J.E. Fire as a global ‘herbivore’: The ecology and evolution of flammable ecosystems. Trends Ecol. Evol. 2005, 20, 387–394. [Google Scholar] [CrossRef] [PubMed]
- Keeley, J.E.; Pausas, J.G.; Rundel, P.W.; Bond, W.J.; Bradstock, R.A. Fire as an evolutionary pressure shaping plant traits. Trends Plant Sci. 2011, 16, 406–411. [Google Scholar] [CrossRef] [PubMed]
- Scott, A.C. The pre-quaternary history of fire. Palaeogeogr. Palaeoclimatol. Palaeoecol. 2000, 164, 281–329. [Google Scholar] [CrossRef]
- Bowman, D.M.J.S.; Balch, J.K.; Artaxo, P.; Bond, W.J.; Carlson, J.M.; Cochrane, M.A.; D’Antonio, C.M.; DeFries, R.S.; Doyle, J.C.; Harrison, S.P.; et al. Fire in the earth system. Science 2009, 324, 481–484. [Google Scholar] [CrossRef]
- Foster, D.R.; Knight, D.H.; Franklin, J.F. Landscape patterns and legacies resulting from large, infrequent forest disturbances. Ecosystems 1998, 1, 497–510. [Google Scholar] [CrossRef]
- Veblen, T.T.; Baker, W.L.; Montenegro, G.; Swetnam, T.W. Fire and Climatic Change in Temperate Ecosystems of the Western Americas; Springer: New York, NY, USA, 2003; Volume 160, p. 444. [Google Scholar]
- Swetnam, T.W.; Baisan, C. Historical fire regime patterns in the southwestern united states since ad 1700. In Fire Effects in Southwestern Forest, Proceedings of the 2nd La Mesa Fire Symposium, General Technical Report RM-GTR-286, Los Alamos, NM, USA, 29–31 March 1994; Allen, C.D., Ed.; USDA Forest Service, Rocky Mountain Research Station: Fort Collins, CO, USA, 1996; pp. 11–32. [Google Scholar]
- Schoennagel, T.; Veblen, T.T.; Romme, W.H. The interaction of fire, fuels, and climate across rocky mountain forests. BioScience 2004, 54, 661–676. [Google Scholar] [CrossRef]
- Grayson, D.K. The Great Basin: A Natural Prehistory, Revised and Expanded ed.; University of California Press: Berkeley, CA, USA, 2011. [Google Scholar]
- Charlet, D.A. Distribution patterns of great basin conifers: Implications of extinction and immigration. Aliso 2007, 24, 31–61. [Google Scholar] [CrossRef]
- Bauer, J.M.; Weisberg, P.J. Fire history of a central nevada pinyon–juniper woodland. Can. J. For. Res. 2009, 39, 1589–1599. [Google Scholar] [CrossRef]
- Brown, P.M.; Heyerdahl, E.K.; Kitchen, S.G.; Weber, M.H. Climate effects on historical fires (1630–1900) in utah. Int. J. Wildland Fire 2008, 17, 28–39. [Google Scholar] [CrossRef]
- Kilpatrick, M.; Biondi, F.; Strachan, S.; Sibold, J.S. Fire history of mixed conifer ecosystems in the great basin/mojave deserts transition zone, nevada, USA. Trees 2013, 27, 1789–1803. [Google Scholar] [CrossRef]
- Biondi, F.; Jamieson, L.P.; Strachan, S.; Sibold, J. Dendroecological testing of the pyroclimatic hypothesis in the central great basin, nevada, USA. Ecosphere 2011, 2, 1–20. [Google Scholar] [CrossRef]
- Kitchen, S.G. Climate and human influences on historical fire regimes (ad 1400–1900) in the eastern great basin (USA). Holocene 2016, 26, 397–407. [Google Scholar] [CrossRef]
- Dennison, P.E.; Brewer, S.C.; Arnold, J.D.; Moritz, M.A. Large wildfire trends in the western united states, 1984–2011. Geophys. Res. Let. 2014, 41, 2928–2933. [Google Scholar] [CrossRef]
- Krawchuk, M.A.; Moritz, M.A. Constraints on global fire activity vary across a resource gradient. Ecology 2011, 92, 121–132. [Google Scholar] [CrossRef] [PubMed]
- Flannigan, M.D.; Krawchuk, M.A.; de Groot, W.J.; Wotton, B.M.; Gowman, L.M. Implications of changing climate for global wildland fire. Int. J. Wildland Fire 2009, 18, 483–507. [Google Scholar] [CrossRef]
- Barbero, R.; Abatzoglou, J.T.; Larkin, N.K.; Kolden, C.A.; Stocks, B. Climate change presents increased potential for very large fires in the contiguous united states. Int. J. Wildland Fire 2015, 24, 892–899. [Google Scholar] [CrossRef]
- Wright, R.D.; Mooney, H.A. Substrate-oriented distribution of bristlecone pine in the white mountains of california. Am. Midl. Nat. 1965, 73, 257–284. [Google Scholar] [CrossRef]
- Wells, P.V. Paleobiogeography of montane islands in the great basin since the last glaciopluvial. Ecol. Monogr. 1983, 53, 341–382. [Google Scholar] [CrossRef]
- Becklin, K.M.; Medeiros, J.S.; Sale, K.R.; Ward, J.K. Evolutionary history underlies plant physiological responses to global change since the last glacial maximum. Ecol. Lett. 2014, 17, 691–699. [Google Scholar] [CrossRef]
- Ewers, F.W.; Schmid, R. Longevity of needle fascicles of Pinus longaeva (Bristlecone pine) and other north american pines. Oecologia 1981, 51, 107–115. [Google Scholar] [CrossRef]
- Billings, W.D.; Thompson, J.H. Composition of a stand of old bristlecone pines in the white mountains of california. Ecology 1957, 38, 158–160. [Google Scholar] [CrossRef]
- LaMarche, V.C., Jr. Environment in relation to age of bristlecone pines. Ecology 1969, 50, 54–59. [Google Scholar] [CrossRef]
- Hiebert, R.D.; Hamrick, J.L. Patterns and levels of genetic variation in great basin bristlecone pine, pinus longaeva. Evolution 1983, 37, 302–310. [Google Scholar] [CrossRef] [PubMed]
- Currey, D.R. An ancient bristlecone pine stand in eastern nevada. Ecology 1965, 46, 564–566. [Google Scholar] [CrossRef]
- Schulman, E. Bristlecone pine, oldest known living thing. Natl. Geogr. Mag. 1958, 113, 354–372. [Google Scholar]
- LaMarche, V.C., Jr. Tree-ring evidence of past climatic variability. Nature 1978, 276, 334–338. [Google Scholar] [CrossRef]
- Hughes, M.K.; Funkhouser, G.S. Frequency-dependent climate signal in upper and lower forest border tree rings in the mountains of the great basin. Clim. Chang. 2003, 59, 233–244. [Google Scholar] [CrossRef]
- Salzer, M.W.; Hughes, M.K. Bristlecone pine tree rings and volcanic eruptions over the last 5000 yr. Quat. Res. 2007, 67, 57–68. [Google Scholar] [CrossRef]
- LaMarche, V.C., Jr.; Hirschboeck, K.K. Frost rings in trees as records of major volcanic eruptions. Nature 1984, 307, 121–126. [Google Scholar] [CrossRef]
- LaMarche, V.C., Jr. Holocene climatic variations inferred from treeline fluctuations in the white mountains, california. J. Quat. Res. 1973, 3, 632–660. [Google Scholar] [CrossRef]
- Bruening, J.M.; Tran, T.J.; Bunn, A.G.; Weiss, S.B.; Salzer, M.W. Fine-scale modeling of bristlecone pine treeline position in the great basin, USA. Environ. Res. Lett. 2017, 12, 014008. [Google Scholar] [CrossRef]
- LaMarche, V.C., Jr.; Harlan, T.P. Accuracy of tree-ring dating of bristlecone pine for calibration of the radiocarbon time scale. J. Geophys. Res. 1973, 78, 8849–8858. [Google Scholar] [CrossRef]
- Leavitt, S.W.; Bannister, B. Dendrochronology and radiocarbon dating: The laboratory of tree-ring research connection. Radiocarbon 2009, 51, 373–384. [Google Scholar] [CrossRef]
- Feng, X.; Epstein, S. Climatic implications of an 8000-year hydrogen isotope time series from bristlecone pine trees. Science 1994, 265, 1079–1081. [Google Scholar] [CrossRef]
- Bale, R.J.; Robertson, I.; Salzer, M.W.; Loader, N.J.; Leavitt, S.W.; Gagen, M.H.; Harlan, T.P.; McCarroll, D. An annually resolved bristlecone pine carbon isotope chronology for the last millennium. Quat. Res. 2011, 76, 22–29. [Google Scholar] [CrossRef]
- Ababneh, L. Bristlecone pine paleoclimatic model for archeological patterns in the white mountain of california. Quat. Int. 2008, 188, 59–78. [Google Scholar] [CrossRef]
- Beasley, R.S.; Klemmedson, J.O. Recognizing site adversity and drought-sensitive trees in stands of bristlecone pine (Pinus longaeva). Econ. Bot. 1973, 27, 141–146. [Google Scholar] [CrossRef]
- Salzer, M.W.; Larson, E.R.; Bunn, A.G.; Hughes, M.K. Changing climate response in near-treeline bristlecone pine with elevation and aspect. Environ. Res. Lett. 2014, 9, 114007. [Google Scholar] [CrossRef]
- Schulman, E. Longevity under adversity in conifers. Science 1954, 119, 396–399. [Google Scholar] [CrossRef]
- North, M.P.; Van de Water, K.M.; Stephens, S.L.; Collins, B.M. Climate, rain shadow, and human-use influences on fire regimes in the eastern sierra nevada, california, USA. Fire Ecol. 2009, 5, 20–34. [Google Scholar] [CrossRef]
- Kitchen, S.G. Historical fire regime and forest variability on two eastern great basin fire-sheds (USA). For. Ecol. Manag. 2012, 285, 53–66. [Google Scholar] [CrossRef]
- Baker, W.L. Structure, disturbance, and change in the bristlecone pine forests of colorado, USA. Arct. Alp. Res. 1992, 24, 17–26. [Google Scholar] [CrossRef]
- Coop, J.D.; Schoettle, A.W. Regeneration of rocky mountain bristlecone pine (Pinus aristata) and limber pine (Pinus flexilis) three decades after stand-replacing fires. For. Ecol. Manag. 2009, 257, 893–903. [Google Scholar] [CrossRef]
- Donnegan, J.A.; Veblen, T.T.; Sibold, J.S. Climatic and human influences on fire history in pike national forest, central colorado. Can. J. For. Res. 2001, 31, 1526–1539. [Google Scholar] [CrossRef]
- Brown, P.M.; Schoettle, A.W. Fire and stand history in two limber pine (Pinus flexilis) and rocky mountain bristlecone pine (Pinus aristata) stands in colorado. Int. J. Wildland Fire 2008, 17, 339–347. [Google Scholar] [CrossRef]
- Cocke, A.E.; Fulé, P.Z.; Crouse, J.E. Forest change on a steep mountain gradient after extended fire exclusion: San francisco peaks, arizona, USA. J. Appl. Ecol. 2005, 42, 814–823. [Google Scholar] [CrossRef]
- Maher, C.T.; Barber, A.L.; Affleck, D.L.R. Shelter provided by wood, facilitation, and density-dependent herbivory influence great basin bristlecone pine seedling survival. For. Ecol. Manag. 2015, 342, 76–83. [Google Scholar] [CrossRef]
- Millar, C.I.; Westfall, R.D.; Delany, D.L.; Flint, A.L.; Flint, L.E. Recruitment patterns and growth of high-elevation pines in response to climatic variability (1883–2013), in the western great basin, USA. Can. J. For. Res. 2015, 45, 1299–1312. [Google Scholar] [CrossRef]
- Burton, P.J.; Simons, J.; Brittingham, S.; Thompson, D.B.; Brooks, D.W.; Walker, L.R. Regeneration dynamics of great basin bristlecone pine in southern nevada. Can. J. For. Res. 2020, 50, 589–594. [Google Scholar] [CrossRef]
- Stewart, J.H.; Carlson, J.E. Geologic Map of Nevada; U.S. Geological Survey and Nevada Bureau of Mines and Geology: Reno, NV, USA, 1978.
- Johnson, B.G.; Verburg, P.S.J.; Arnone, J.A., III. Effects of climate and vegetation on soil nutrients and chemistry in the great basin studied along a latitudinal-elevational climate gradient. Plant Soil 2014, 382, 151–163. [Google Scholar] [CrossRef]
- Tingley, J.V.; Horton, R.C.; Lincoln, F.C. Outline of Nevada Mining History; Nevada Bureau of Mines and Geology: Reno, NV, USA, 1993; Special Publication 15. [Google Scholar]
- Unrau, H.D. Basin and Range: A history of Great Basin National Park, Nevada; U.S. Department of the Interior, National Park Service: Denver, CO, USA, 1990; p. 690.
- Mensing, S.; Strachan, S.; Arnone, J.A., III; Fenstermaker, L.; Biondi, F.; Devitt, D.; Johnson, B.; Bird, B.; Fritzinger, E. A network for observing great basin climate change. Eos Trans. Am. Geophys. Union 2013, 94, 105–106. [Google Scholar] [CrossRef]
- Eidenshink, J.; Schwind, B.; Brewer, K.; Zhu, Z.-L.; Quayle, B.; Howard, S. A project for monitoring trends in burn severity. Fire Ecol. 2007, 3, 3–21. [Google Scholar] [CrossRef]
- R Core Team. R: A Language and Environment for Statistical Computing; 3.0.2; R Foundation for Statistical Computing: Vienna, Austria, 2015. [Google Scholar]
- Sappington, J.M.; Longshore, K.M.; Thompson, D.B. Quantifying landscape ruggedness for animal habitat analysis: A case study using bighorn sheep in the mojave desert. J. Wildl. Manag. 2007, 71, 1419–1426. [Google Scholar] [CrossRef]
- Rouse, J.W.; Haas, R.H.; Schell, J.A.; Deering, D.W. Monitoring vegetation systems in the great plains with erts. In Third Earth Resources Technology Satellite-1 Symposium; NASA SP-351; National Aeronautics and Space Administration: Washington, DC, USA, 1973; Volume 1, pp. 309–317. [Google Scholar]
- Tucker, C.J. Red and photographic infrared linear combinations for monitoring vegetation. Remote Sens. Environ. 1979, 8, 127–150. [Google Scholar] [CrossRef]
- Key, C.H.; Benson, N.C. Landscape assessment (la): Sampling and analysis methods. In Firemon: Fire Effects Monitoring and Inventory System; Gen. Tech. Rep. RMRS-GTR-164-CD; Lutes, D.C., Keane, R.E., Caratti, J.F., Key, C.H., Benson, N.C., Sutherland, S., Gangi, L.J., Eds.; USDA Forest Service, Rocky Mountain Research Station: Ogden, UT, USA, 2006; p. LA-1-55. [Google Scholar]
- Jin, S.; Sader, S.A. Comparison of time series tasseled cap wetness and the normalized difference moisture index in detecting forest disturbances. Remote Sens. Environ. 2005, 94, 364–372. [Google Scholar] [CrossRef]
- Masek, J.G.; Vermote, E.F.; Saleous, N.E.; Wolfe, R.; Hall, F.G.; Huemmrich, K.F.; Feng, G.; Kutler, J.; Teng-Kui, L. A landsat surface reflectance dataset for north america, 1990–2000. IEEE Geosci. Remote Sens. Lett. 2006, 3, 68–72. [Google Scholar] [CrossRef]
- Schwarz, G. Estimating the dimension of a model. Ann. Statist. 1978, 6, 461–464. [Google Scholar] [CrossRef]
- Chen, J.; Chen, Z. Extended bayesian information criteria for model selection with large model spaces. Biometrika 2008, 95, 759–771. [Google Scholar] [CrossRef]
- McHugh, M.L. The odds ratio: Calculation, usage, and interpretation. Biochem. Med. 2009, 19, 120–126. [Google Scholar] [CrossRef]
- Lydersen, S.; Fagerland, M.W.; Laake, P. Recommended tests for association in 2 × 2 tables. Stat. Med. 2009, 28, 1159–1175. [Google Scholar] [CrossRef]
- Aragon, T.J. Epitools: Epidemiology Tools 0.5–10; R Foundation for Statistical Computing: Vienna, Austria, 2017. [Google Scholar]
- Fisher, N.I. Statistical Analysis of Circular Data; Cambridge University Press: Cambridge, UK, 1995; p. 296. [Google Scholar]
- Lanner, R.M. Dependence of great basin bristlecone pine on clark’s nutcracker for regeneration at high elevations. Arct. Alp. Res. 1988, 20, 358–362. [Google Scholar] [CrossRef]
- Lanner, R.M.; Connor, K.F. Does bristlecone pine senesce? Exp. Gerontol. 2001, 36, 675–685. [Google Scholar] [CrossRef]
- Connor, K.F.; Lanner, R.M. Effects of tree age on secondary xylem and phloem anatomy in stems of great basin bristlecone pine (Pinus longaeva). Am. J. Bot. 1990, 77, 1070–1077. [Google Scholar] [CrossRef]
- Connor, K.F.; Lanner, R.M. Effects of tree age on pollen, seed, and seedling characteristics in great basin bristlecone pine. Bot. Gaz. 1991, 152, 107–113. [Google Scholar] [CrossRef]
- Connor, K.F.; Lanner, R.M. Cuticle thickness and chlorphyll content in bristlecone pine needles of various ages. Bull. Torrey Bot. Club 1991, 118, 184–187. [Google Scholar] [CrossRef]
- Pröll, G.; Hietz, P.; Delaney, C.M.; Katzensteiner, K. Substrate influences ecophysiological performance of tree seedlings. Tree Physiol. 2015, 36, 39–53. [Google Scholar] [CrossRef]
- Ziaco, E.; Biondi, F.; Rossi, S.; Deslauriers, A. Climatic influences on wood anatomy and tree-ring features of great basin conifers at a new mountain observatory. Appl. Plant Sci. 2014, 2, 1400054. [Google Scholar] [CrossRef]
- Germino, M.J.; Resor, C.A.C.; Smith, W.K. Conifer seedling distribution and survival in an alpine-treeline ecotone. Plant Ecol. 2002, 162, 157–168. [Google Scholar] [CrossRef]
- Germino, M.J.; Smith, W.K. Differences in microsite, plant form, and low-temperature photoinhibition in alpine plants. Arct. Antarct. Alp. Res. 2000, 32, 388–396. [Google Scholar] [CrossRef]
- Germino, M.J.; Smith, W.K. Sky exposure, crown architecture, and low-temperature photoinhibition in conifer seedlings at alpine treeline. Plant Cell Environ. 1999, 22, 407–415. [Google Scholar] [CrossRef]
- Maher, E.L.; Germino, M.J. Microsite differentiation among conifer species during seedling establishment at alpine treeline. Ecoscience 2006, 13, 334–341. [Google Scholar] [CrossRef]
- Callaway, R.M.; Brooker, R.W.; Choler, P.; Kikvidze, Z.; Lortie, C.J.; Michalet, R.; Paolini, L.; Pugnaire, F.I.; Newingham, B.; Aschehoug, E.T.; et al. Positive interactions among alpine plants increase with stress. Nature 2002, 417, 844–848. [Google Scholar] [CrossRef] [PubMed]
- Elliott, G.P.; Kipfmueller, K.F. Multi-scale influences of slope aspect and spatial pattern on ecotonal dynamics at upper treeline in the southern rocky mountains, USA. Arct. Antarct. Alp. Res. 2010, 42, 45–56. [Google Scholar] [CrossRef]
- Smithers, B.V.; North, M.P.; Millar, C.I.; Latimer, A.M. Leap frog in slow motion: Divergent responses of tree species and life stages to climatic warming in great basin subalpine forests. Glob. Chang. Biol. 2018, 24, e442–e457. [Google Scholar] [CrossRef] [PubMed]
- Lanner, R.M.; Vander Wall, S.B. Dispersal of limber pine seed by clark’s nutcracker. J. For. 1980, 78, 637–639. [Google Scholar]
- Lee, S.-W.; Ledig, F.T.; Johnson, D.R. Genetic variation at allozyme and rapd markers in pinus longaeva (pinaceae) of the white mountains, california. Am. J. Bot. 2002, 89, 566–577. [Google Scholar] [CrossRef]
- Marzano, R.; Garbarino, M.; Marcolin, E.; Pividori, M.; Lingua, E. Deadwood anisotropic facilitation on seedling establishment after a stand-replacing wildfire in aosta valley (NW Italy). Ecol. Eng. 2013, 51, 117–122. [Google Scholar] [CrossRef]
- Marcolin, E.; Marzano, R.; Vitali, A.; Garbarino, M.; Lingua, E. Post-fire management impact on natural forest regeneration through altered microsite conditions. Forests 2019, 10, 1014. [Google Scholar] [CrossRef]
- Gómez-Aparicio, L.; Zamora, R.; Gómez, J.M.; Hódar, J.A.; Castro, J.; Baraza, E. Applying plant facilitation to forest restoration: A meta-analysis of the use of shrubs as nurse plants. Ecol. Appl. 2004, 14, 1128–1138. [Google Scholar] [CrossRef]
- LaMarche, V.C., Jr.; Mooney, H.A. Recent climatic change and development of the bristlecone pine (P. longaeva Bailey) krummholz zone, mt. Washington nevada. Arct. Alp. Res. 1972, 4, 61–72. [Google Scholar] [CrossRef]
- Turner, M.G.; Romme, W.H.; Tinker, D.B. Surprises and lessons from the 1988 yellowstone fires. Front. Ecol. Environ. 2003, 1, 351–358. [Google Scholar] [CrossRef]
- Reinemann, S.A.; Porinchu, D.F.; Mark, B.G. Regional climate change evidenced by recent shifts in chironomid community composition in subalpine and alpine lakes in the great basin of the united states. Arct. Antarct. Alp. Res. 2014, 46, 600–615. [Google Scholar] [CrossRef]
- Salzer, M.W.; Hughes, M.K.; Bunn, A.G.; Kipfmueller, K.F. Recent unprecedented tree-ring growth in bristlecone pine at the highest elevations and possible causes. Proc. Nat. Acad. Sci. USA 2009, 106, 20348–20353. [Google Scholar] [CrossRef] [PubMed]
- Jackson, S.T.; Betancourt, J.L.; Booth, R.K.; Gray, S.T. Ecology and the ratchet of events: Climate variability, niche dimensions, and species distributions. Proc. Nat. Acad. Sci. USA 2009, 106, 19685–19692. [Google Scholar] [CrossRef] [PubMed]
- Zhu, K.; Woodall, C.W.; Clark, J.S. Failure to migrate: Lack of tree range expansion in response to climate change. Glob. Chang. Biol. 2012, 18, 1042–1052. [Google Scholar] [CrossRef]


| Vegetation Feature | Unburned Plots | Burned Plots | % Change 1 | p-Value 2 |
|---|---|---|---|---|
| Total Tree Stems (n ha−1) | 215 ± 23 | 202 ± 16 | −6 | 0.75 |
| Live Trees (n ha−1) | 197 ± 33 | 27 ± 10 | −86 | <0.001 |
| Snags (n ha−1) | 18 ± 4 | 175 ± 20 | 872 | <0.001 |
| Total Tree Basal Area (m2 ha−1) | 25 ± 5 | 25 ± 2 | 0 | 0.94 |
| Live Tree Basal Area (m2 ha−1) | 23 ± 5 | 3 ± 2 | −87 | <0.001 |
| Snag Basal Area (m2 ha−1) | 2 ± 0.4 | 22 ± 2 | 1000 | <0.001 |
| Live Tree Height (m) | 7 ± 1 | 8 ± 2 | 14 | 0.74 |
| Snag Height (m) | 6 ± 1 | 10 ± 1 | 67 | 0.01 |
| Live Tree Diameter (cm) | 36 ± 4 | 38 ± 15 | 6 | 0.95 |
| Snag Diameter (cm) | 28 ± 6 | 41 ± 2 | 46 | 0.03 |
| Variable | ALL 1 | Pinus longaeva | Pinus flexilis | Picea engelmannii | ||||
|---|---|---|---|---|---|---|---|---|
| Burned | Unburned | Burned | Unburned | Burned | Unburned | Burned | Unburned | |
| Mean | 5.9 | 5.1 | 3.0 | 2.5 | 1.6 | 0.7 | 0.2 | 1.7 |
| Stand. Dev. | 11.8 | 5.1 | 5.1 | 3.9 | 2.7 | 1.5 | 0.4 | 2.7 |
| Median | 2.0 | 3.5 | 1.0 | 1.0 | 0.0 | 0.0 | 0.0 | 0.5 |
| Minimum | 0 | 0 | 0 | 0 | 0 | 0 | 0 | 0 |
| Maximum | 55 | 17 | 22 | 16 | 8 | 6 | 1 | 10 |
| No regeneration (% plots) | 18 | 17 | 36 | 33 | 64 | 72 | 82 | 50 |
| Total Seedlings | 63 | 33 | 32 | 23 | 28 | 6 | 3 | 4 |
| Total Saplings | 41 | 51 | 33 | 21 | 7 | 10 | 1 | 20 |
© 2020 by the authors. Licensee MDPI, Basel, Switzerland. This article is an open access article distributed under the terms and conditions of the Creative Commons Attribution (CC BY) license (http://creativecommons.org/licenses/by/4.0/).
Share and Cite
Kilpatrick, M.; Biondi, F. Post-Wildfire Regeneration in a Sky-Island Mixed- Conifer Ecosystem of the North American Great Basin. Forests 2020, 11, 900. https://doi.org/10.3390/f11090900
Kilpatrick M, Biondi F. Post-Wildfire Regeneration in a Sky-Island Mixed- Conifer Ecosystem of the North American Great Basin. Forests. 2020; 11(9):900. https://doi.org/10.3390/f11090900
Chicago/Turabian StyleKilpatrick, Mackenzie, and Franco Biondi. 2020. "Post-Wildfire Regeneration in a Sky-Island Mixed- Conifer Ecosystem of the North American Great Basin" Forests 11, no. 9: 900. https://doi.org/10.3390/f11090900
APA StyleKilpatrick, M., & Biondi, F. (2020). Post-Wildfire Regeneration in a Sky-Island Mixed- Conifer Ecosystem of the North American Great Basin. Forests, 11(9), 900. https://doi.org/10.3390/f11090900