Article

Stand-Level Transpiration Increases after Eastern Redcedar (Juniperus virginiana L.) Encroachment into the Midstory of Oak Forests

1
Department of Natural Resource Ecology and Management, Oklahoma State University, Stillwater, OK 74078, USA
2
School of Ecosystem and Forest Science, the University of Melbourne, Burnley, VIC 3121, Australia
*
Author to whom correspondence should be addressed.
Forests 2020, 11(9), 901; https://doi.org/10.3390/f11090901
Submission received: 15 July 2020 / Revised: 10 August 2020 / Accepted: 15 August 2020 / Published: 19 August 2020
(This article belongs to the Section Forest Ecophysiology and Biology)

Abstract

:
Eastern redcedar (Juniperus virginiana L., redcedar) encroachment is transitioning the oak-dominated Cross-Timbers of the southern Great Plain of the USA into mixed-species forests. However, it remains unknown how the re-assemblage of tree species in a semiarid to sub-humid climate affects species-specific water use and competition, and ultimately the ecosystem-level water budget. We selected three sites representative of oak, redcedar, and oak and redcedar mixed stands with a similar total basal area (BA) in a Cross-Timbers forest near Stillwater, Oklahoma. Sap flow sensors were installed in a subset of trees in each stand representing the distribution of diameter at breast height (DBH). Sap flow of each selected tree was continuously monitored over a period of 20 months, encompassing two growing seasons between May 2017 and December 2018. Results showed that the mean sap flow density (Sd) of redcedar was usually higher than post oaks (Quercus stellata Wangenh.). A structural equation model showed a significant correlation between Sd and shallow soil moisture for redcedar but not for post oak. At the stand level, the annual water use of the mixed species stand was greater than the redcedar or oak stand of similar total BA. The transition of oak-dominated Cross-Timbers to redcedar and oak mixed forest will increase stand-level transpiration, potentially reducing the water available for runoff or recharge to groundwater.

1. Introduction

Woody plant encroachment is transforming the southern Great Plains of the USA, which has significant implications for ecosystem carbon and water dynamics (e.g., [1,2]). The Cross-Timbers is an ecoregion historically composed of a mosaic of open prairie, oak savannas, and oak-dominated forests extending from Kansas to Texas [3,4]. The oak savanna and forests mostly occurred on coarser-textured soils and were dominated by post oak (Quercus stellata Wangenh.) and blackjack oak (Q. marilandica Münchh.). However, fire exclusion has increased woody species density and richness and allowed eastern redcedar (Juniperus virginiana L., redcedar), a native, evergreen conifer, to encroach the prairie and infill the oak-dominated areas [5,6,7], which affects a large number of ecosystem services [8,9,10]. Encroachment of redcedar into grasslands increases ecosystem-level water use, resulting in a reduction of runoff and groundwater recharge potential [1,11,12,13]. However, the effect of redcedar encroachment and infilling into the oak forest on water use and ecosystem-level water budgets remains unknown.
Transpiration is usually the dominant component of the water budget in forested ecosystems, especially in semiarid and sub-humid regions [14]. In the Cross-Timbers, oaks are deciduous and are typically leafless from mid-November to April. In contrast, redcedar is an evergreen conifer and can transpire as long as the air temperature is above −3 °C [15]. Physiologically, redcedar has a strong tolerance for water stress and can extract water from soil with very low water potential [16,17]. As a result, redcedar encroachment into the mid-story Cross-Timbers oak forest and the formation of novel communities of tree species with different phenologies and physiological responses to atmospheric and soil moisture conditions may lead to changes in stand-level transpiration and ecosystem water budgets.
The water use of an even-aged redcedar plantation in the Sandhills of Nebraska, USA [18] and encroached redcedar stands in north-central Oklahoma [15,19] were estimated using sap flow techniques and redcedar transpired throughout much of the year, including winter. The daily average water use was approximately 24 L per tree for a redcedar woodland in north-central Oklahoma but varied between 1.7 and 46.6 L day−1, increasing with tree size and decreasing with stand density [15]. When scaled to the stand level, redcedar stands used 431 mm during a hot and below-average precipitation year [15]. Similar stand-level transpiration of a redcedar woodland was measured (413 mm year−1) in Nebraska for a year with above-average precipitation [18]. There is no documented information on the stand-level transpiration of post oak in the Cross-Timbers forest. A recent study found that a stand of post oaks in the Lost Pines ecoregion of Texas could transpire up to 0.44 mm day−1 during the growing season [20].
Trees conduct water transport through the soil–plant–atmospheric continuum (SPAC). Conceptually, adding redcedar to a post oak stand, even as a mid-story component, will increase the total sapwood area and the transport efficiency of water. However, stand-level transpiration is not necessarily correlated to woody plant cover (or the transport efficiency) in semiarid regions where the availability of soil moisture is the limiting factor [21]. In addition, the availability of soil moisture is defined by species-specific attributes such as rooting structure, active rooting depth, physiological responses to water stress and phenology [22,23]. As a result, it remains unknown how the assemblage of an evergreen juniper species with deciduous oak species in a semiarid to sub-humid climate will shift the coupling between the atmospheric demand and soil moisture supplies and affect species-specific water use and competition, and ultimately ecosystem-level water budget.
Soil moisture supply and atmospheric demand for water independently limit vegetation water use [24]. The relative importance of soil moisture availability and atmospheric demand in relation to transpiration is not well understood, especially for the Cross-Timbers, which are located in a climate transition from energy limited, mesic systems to the east and water-limited systems to the west [25]. When soil moisture is not a limiting factor, transpiration is governed by biogeochemical controls on canopy photosynthesis, as well as atmospheric demand (i.e., reference evapotranspiration (ETo)), which is a collective effect of solar radiation (Rs), vapor pressure deficit (VPD), temperature (T), wind speed (WS), and relative humidity (RH) [26,27,28]. However, the Cross-Timbers region is characterized by great annual and interannual variability of precipitation and frequent water stress [29], and actual evapotranspiration is also constrained by the availability of soil water for root extraction [30,31], as well by the transport efficiency and stomatal conductance, such that responses to soil drying are species-specific [32]. The relative control (coupling) between atmospheric demand and soil moisture in the sub-humid ecosystem will provide insights on stand-level transpiration and potentially assist weather and climate models by improving the representation of vegetation in land surface processes [33].
Sap flow density measures the water transport efficiency of sapwood and reflects species-specific responses to both atmospheric demand and soil moisture availability. Multistep regressions were widely used to explore the responses of sap flow to multiple environmental variables [34,35]. However, the ability of structural equation modeling (SEM) to test surrogate correlations is considered more statistically powerful than traditional multistep regression methods [36], and has the capability of modelling water use among multiple independent and dependent factors simultaneously [37]. The result is a visual diagram of the direct and indirect influence of multiple environmental factors which facilitates our understanding of the complex web of relationships among variables [38,39,40].
Our overall aim was to understand the change in ecosystem-level transpiration and the underlying mechanisms after redcedar encroachment into a post oak-dominated forest in the Cross-Timbers. Our specific objectives were to: (1) compare sap flow density and water use of individual trees under intra- and inter-specific competition; (2) estimate and compare stand-level transpiration for post oak only, redcedar only, and post oak and redcedar mixed stands; and (3) understand how environmental variables differently affect the sap flow density of post oak and redcedar. We quantified the sap flow of individual post oak and redcedar trees of different sizes growing in single-species or mixed-species stands using the thermal dissipation method. We used SEM to evaluate the effects of environmental variables on the sap flow density in oak and redcedar. We hypothesized that: (1) there would be greater sap flow density in post oak, but more consistent sap flow density in redcedar due to differences in hydraulic conductivity and an/isohydric behavior; (2) there would be greater water use in redcedar and mixed stands than the oak stand due to year-round water use in the redcedar stand and niche differentiation leading to greater water uptake in the mixed stand; and (3) the primary control of sap flow density is soil moisture availability. These efforts are essential to project the impact of the ongoing transition of the oak-dominated forest to an oak–redcedar mixed forest on water budget and future water resources in the Cross-Timbers.

2. Materials and Methods

2.1. Study Site

The research site was located at the Cross-Timbers Experimental Range Station (a research and outreach facility owned by Oklahoma State University), 15 km southwest of Stillwater in Payne County, Oklahoma, USA (36°04′05.1′′ N, 97°11′25.7′′ W) (Figure 1). The average annual precipitation is 888 mm, with 66% falling during the growing season (April–October). The annual mean temperature is 15 °C, with a monthly average temperature reaching a minimum of 2.2 °C in January and a monthly average reaching a maximum of 27.5 °C in August. The elevation is 331 m above sea level, and the soil type is Stephenville series (fine–loamy, siliceous, active, thermic Ultic Haplustalfs) with the upper 20 cm mostly sandy loam with loam and clay loam textures in deeper layers [41]. The vegetation at the site is characterized by a mosaic of tallgrass prairie, oak savanna, and oak-dominated forests. Portions of the site are heavily encroached by redcedar.

2.2. Experimental Design

Three stands representative of different woody species compositions were selected (Figure 1). The first stand (OAK) had 85% of the basal area composed of post oak, with a mean canopy height of 11.4 m and a basal area of 20.4 m2 ha−1. The second stand (MIX) was a mixed stand with 44% of the basal area composed of redcedar and 46% of the basal area of post oak. The mean canopy height was 7.6 m for redcedar and 8.4 m for post oak, and the basal area was 20.1 m2 ha−1. The third stand (ERC) had 81% of the basal area composed of redcedar trees, with a mean canopy height of 8.6 m and a basal area of 19.5 m2 ha−1 (Table 1). These basal areas are representative of current conditions in much of the Cross-Timbers [5,7]. Seven post oaks in the OAK stand, seven redcedar trees in the ERC stand, and five of each species in the MIX stand were selected for the installation of sap flow sensors. The distribution of diameters at breast height (DBH) of selected trees (Table 1) was intended to cover the range of tree sizes in the Cross-Timbers. In this study, trees with a DBH of less than 5 cm were not selected due to their limited contribution to the stand-level water use. The post oak used in the study averaged 95-years-old (17 standard deviation; SD) and redcedar averaged 45-years-old (13 SD) (Table 1).

2.3. Environmental Variables

Daily data for precipitation (P), Rs, VPD, T, WS, and RH were retrieved from Oklahoma Mesonet Marena Station [42], located 2.1 km from the study site. ETo was calculated using these meteorological variables based on the Food and Agriculture Organization of the United Nations Penman–Monteith equation [26]. Volumetric soil water content (θ) (cm3 cm−3) in the top 60 cm were quantified in three soil layers (0–10, 10–30, and 30–60 cm) by three sensors installed at three depths (5, 20, and 45 cm) from the soil surface using a soil moisture array (EC-5; Meter Environment, Pullman, WA). The soil water storage in the top 60 cm soil profile was calculated as SWS60 (mm) = θ5 × 100 + θ20 × 200 + θ45 × 300. There were three soil moisture arrays installed within a 100 m distance from the selected stands. Soil water content was continuously measured at 15 min intervals, and daily averages of each sensor were calculated. The θ for a given depth used in this study was the daily mean value of probes at the same depth from the three stations.

2.4. Thermal Dissipation Probes and Sapwood Estimation

Sap flow was measured from 1 May 2017 to 31 December 2018 using one sap flow system (FLGS-TDP XM1000; Dynamax Inc., Houston, TX, USA) in each of the three stands. Each system was outfitted with a combination of thermal dissipation probes (TDPs) of 10 mm (TDP-10B) and 30 mm (TDP-30B) length connected with various cable lengths. The TDP-10s were installed for trees with a DBH of less than 10 cm, and TDP-30Bs were used for trees with a DBH larger than 10 cm. Two holes, 5 cm from each other in vertical distance approximately 1 m above the ground, were drilled on the north side of the tree trunk to insert the TDPs following the instructions recommended by the manufacturer. Putty was used to seal around the base of each probe, and then the entire TDP was covered with an aluminized thermal bubble foil to insulate the trunk from excessive thermal fluctuation. Two sets of TDP-30B were used for trees larger than 15 cm DBH, and three sets of TDP-30B were used for trees larger than 30 cm DBH. When multiple sets of probes were used on a given tree, the calculated sap flow densities (see Section 2.5 below) were averaged. The temperature differential from each probe was recorded at 30 s intervals, averaged every 60 min, and then stored (Dynamax Inc., Houston, TX, USA). Sapwood area (SA, cmsw2) was estimated based on the tree radius and sapwood width at the height of probe installation during July 2018. For post oaks that had symmetrical sapwood width, sapwood width and bark thickness were determined using increment cores taken from each tree. For redcedar with relatively asymmetrical sapwood, the sapwood width and bark thickness were estimated based on color differentiation between the red/brown bark, light-colored sapwood, and the red heartwood by drilling into the trunk and analyzing residuals produced from different depths. One to four points along the circumference were drilled depending on the tree size and shape, and the widths were averaged to estimate the sapwood area (Table 1). SA was estimated by subtracting the heartwood area and the bark thickness from the area based on total stem diameter.
The relationship between SA and DBH was established for post oaks with TDPs, which was used to estimate the SA of the post oaks without TDPs and other deciduous trees present in each stand. The relationship between SA and DBH was established for redcedar with TDPs, which was used to estimate the SA of the redcedar trees without TDPs inside the stand area. Total SA per stand was calculated by summing the SA of all trees with and without a TDP (Table 2).

2.5. Sap Flow Density to Whole-Tree and Whole-Stand Water Use

Sap flow densities (Sd Granier, cm3 cmsw−2 hr−1) for both species were calculated from measured temperature differentials using the original equation developed by Granier [43] (Sd Granier = 0.0119 × ((ΔTmax − ΔT)/ΔT)1.231 (cm3 cmsw h−1)), where ΔT is the temperature differential between the upper probe (which is heated) and the non-heated lower probe, and ΔTmax is the temperature difference at zero flow. Sd Granier was reported to underestimate sap flow densities, particularly in ring-porous oaks [44]. In this study, Sd Granier was converted to actual sap flow density (Sd, cm3 cmsw−2 hr−1) based on species-specific calibration equations. For redcedars, Sd Granier was re-calculated based on the calibration equation reported by Caterina et al. [15], (Sd = 2.3 × Sd Granier), developed near our study site. For post oaks, Sd Granier was re-calculated based on the calibration equation for the closely related Q. alba L. developed by [45] (Sd = Sd Granier/0.892).
Daily sap flow density (Sd day, cm3 cmsw−2 day−1) was calculated by summing the hourly Sd of each day. Daily values were then averaged for longer segments for comparison, i.e., seasonal, entire growing season, and drought periods. Hourly water use (WUhr, L hr−1) for each tree was calculated from Sd and sapwood area (WUhr = SA × Sd). Daily water use (WU, L day−1) for each tree was calculated by summing the hourly water use for each day. Seasonal water use was the average daily value across the appropriate time period.
Stand-level water use was calculated for the 2018 calendar year. The daily water use for trees without probes was estimated using the measured DBH of that particular species and the adjusted daily WU of redcedar and of post oak. Therefore, the post oak regression equation was used to estimate the daily WU of the remaining deciduous species, and the redcedar regression equation was applied to other redcedars. For each stand, the individual trees’ daily WU was summed and divided by the total stand area to calculate water use per hectare.

2.6. Data Analysis

Analyses, except for SEM, were performed using SAS (Version 9.4; SAS Institute, Carey, NC, USA). We tested the following comparisons for sap flow density and water use: (1) post oak growing in the oak only stand (OAK) vs. post oak growing in the mixed stand (MIX) to determine the effects of intra- vs. interspecific competition on post oak; (2) redcedar growing in the redcedar stand (ERC) vs. redcedar growing in the MIX stand to determine the effects of intra- vs. interspecific competition on redcedar; and (3) post oak vs. redcedar in the MIX stand to determine how the two species compete when growing together.
Sap flow in oak started between late April and early May and ceased in early November, so the oak growing season was defined as being from May to October in this study. For comparison and testing, we considered spring to be April through June, summer to be July through September, fall to be October through December, and winter to be January to March. As our data collection started in May 2017, the spring of 2017 included May and June. Comparisons involving post oak ((1) and (3) above) were only for the growing season (spring, summer, fall), while the comparison among redcedar included winter data. Missing data accounted for 0.3%, 3.3%, and 2.1% of the total data for the OAK, MIX, and ERC stand, respectively. No gap filling was attempted since the missing data gaps for individual trees occurred in less than 15 consecutive days. We tested for differences in seasonal Sd and WU using the MIXED procedure (PROC MIXED) with a general linear model and repeated measurements with autoregressive covariance structure. Seasons, species, and stand were considered fixed effects, and individual trees were considered a random effect.
Analysis of covariance (ANCOVA) was performed for the relationships between sapwood area and DBH, Sd and DBH, WU and sapwood area, and WU and DBH to determine if the slopes or intercepts of these relationships varied between post oaks and redcedars across all stands. Analyses were performed for growing season values only, so redcedar means were not influenced by winter values.
The SEM analyses were conducted using AMOS 21.0 (IBM SPSS Inc., Chicago, IL, USA) to test mediating correlations between Sd and environmental variables. The selection of environmental variables was initially based on Fick’s law, so we included variables related to stomatal conductance and VPD, i.e., average daily VPD, total daily Rs, average daily temperature (T), daily ETo, average daily θ at three depths (θ5, θ20, θ45 cm), and soil water storage in the upper 60 cm (SWS0–60) to explain the diffusion gradient that drives the conductance of water from canopy to the atmosphere [46]. All tests were conducted using p < 0.05.
For clarity, the post oaks in the OAK stand were abbreviated as “OAKO” and the post oaks in the MIX stand were abbreviated as “OAKM”. Redcedar trees in the ERC stand were abbreviated as “ERCE” and redcedar trees in the MIX stand were abbreviated as “ERCM”.

3. Results

3.1. Environmental Conditions

The total precipitation from May 2017 to December 2018 (20 months) was 1541 mm, with 919 mm from January to December 2018 (Figure 2a). There were 147 days with rain events. Of them, 52% of the days with precipitation had less than 5 mm and 9% of the days with precipitation had greater than 25 mm, with the largest daily precipitation of 125 mm on 29 April 2017. The longest period with no precipitation was from 11 January to 15 February 2018. From 4 July to 25 September 2017, the study area experienced an abnormally dry period [47]. Generally, soil moisture content peaked in the spring and gradually decreased, reaching a minimum in the fall with large inter-seasonal fluctuation (Figure 2b).
The daily Rs, average air T, average VPD, RH, and ETo varied seasonally (Figure 2c–g). Mean daily Rs (± SD) was 21.2 ± 6.8 and 19.6 ± 7.7 MJ m−2 during the growing season of 2017 and 2018, respectively, and 10.3 ± 5.3 MJ m−2 during the winter of 2017 (Figure 2c). Mean daily T (± SD) was 22.5 ± 5.1 and 23.1 ± 5.0 °C during the growing seasons of 2017 and 2018, respectively, and 6.2 ± 6.4 °C during the winter of 2017 (Figure 2d). Mean RH was 69.5 ± 13.8 %, with the minimum monthly average of 31.5 ± 11.5 % in January 2018 (Figure 2f). Mean daily VPD (± SD) was 1.0 ± 0.4 and 0.8 ± 0.5 kPa during the growing seasons of 2017 and 2018, respectively, and 0.4 ± 0.3 kPa during the winter of 2017 (Figure 2e). The mean daily ETo (± SD) was 4.8 ± 1.8 and 4.4 ± 2.1 mm day−1 during the growing seasons of 2017 and 2018, and 2.3 ± 1.6 mm day−1 during the winter of 2017 (Figure 2g).

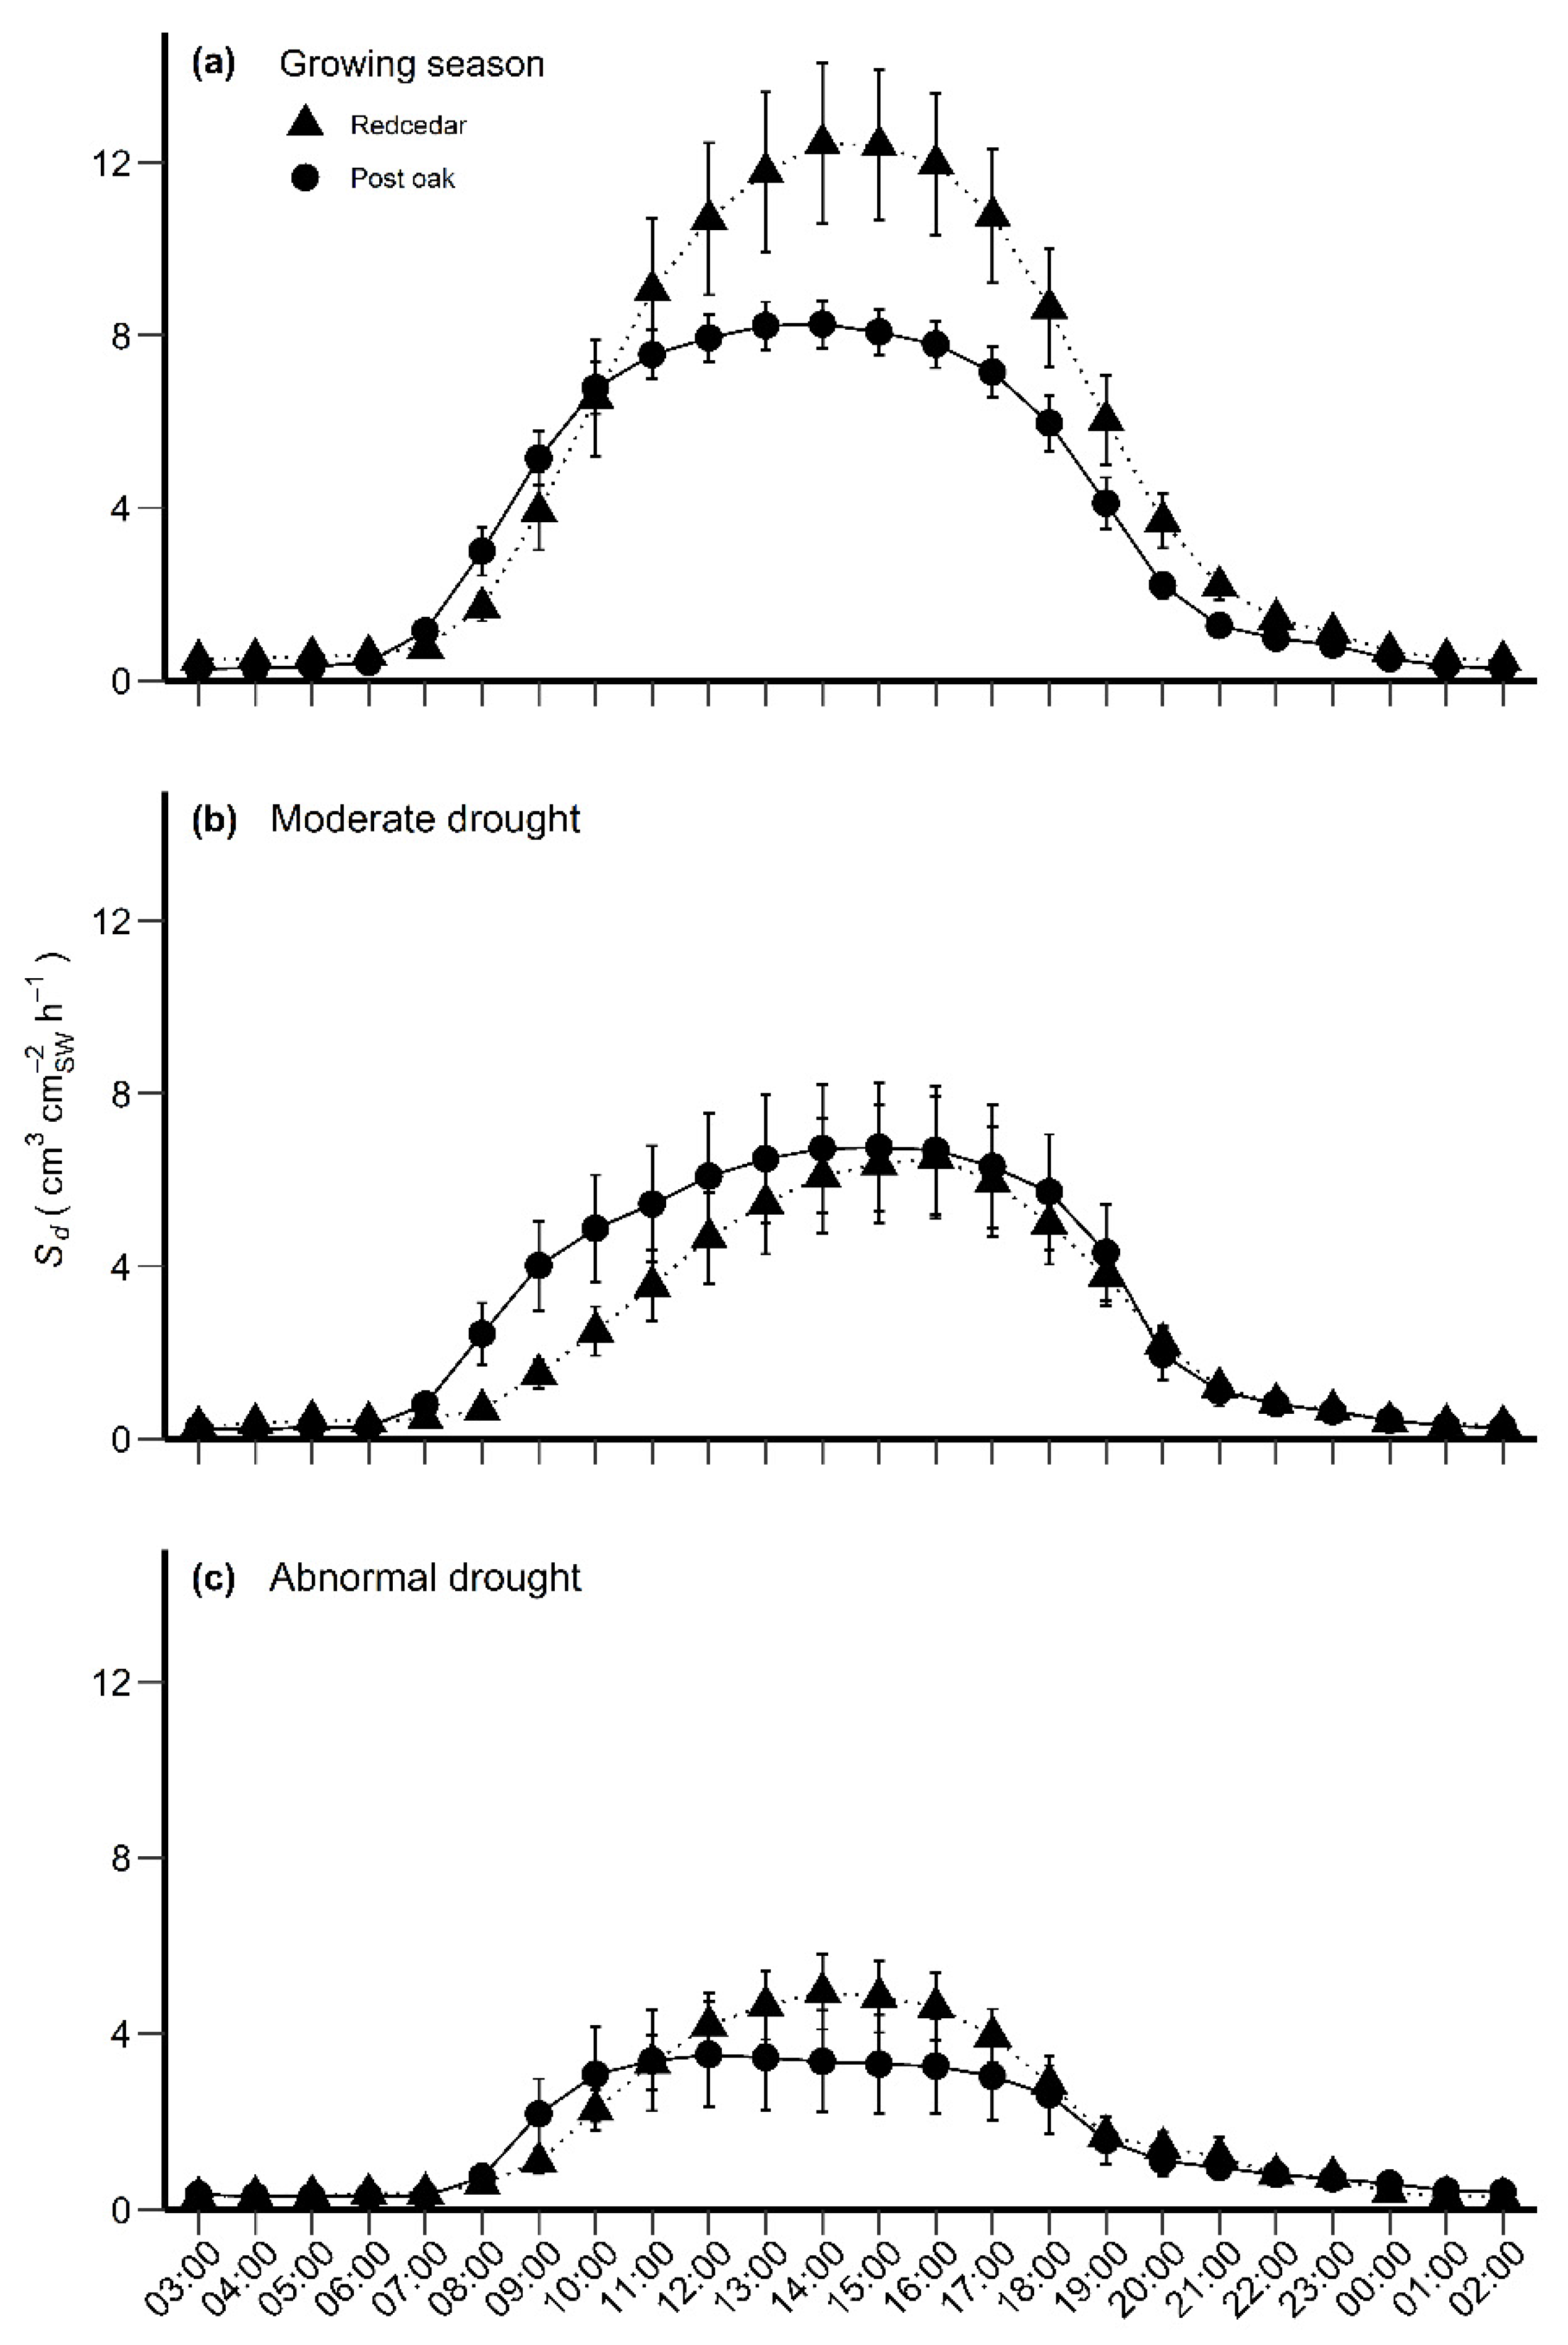
3.2. Sap Flow Densities

The sap flow of most post oaks started on around 15 May and ended around 3 November in 2017, then started again around 30 April and ended around 8 November in 2018. There was measurable sap flow from redcedar year-round, but the sap flow density was relatively low from 16 December 2017 to 10 March 2018 and from 3 December to 31 December 2018 when measurements ceased.
The highest seasonal mean values of Sd occurred during the spring, independent of the species or stand (Figure 3). The high values for spring 2017 could be influenced by its shortened period of data collection; spring 2018 also had the highest values for that year, and comparisons within and among species are similar for both springs. Comparison of seasonal Sd among oaks growing in different stands (OAKO vs. OAKM) varied between seasons (p < 0.0001) and stand type (p < 0.0001) with a significant interaction between season and stand (p = 0.0006). The average spring and summer Sd of OAKM was 4.4 ±3.7 cm3 cmsw−2 h−1 and of OAKO was 2.8 ±2.8 cm3 cmsw−2 h−1. The average Sd of OAKM was 56% and 83% greater than that of OAKO for the spring and the summer seasons (p < 0.05), respectively (Figure 3). The Sd of redcedar growing in different stands varied with seasons (p < 0.0001) and stand type (p < 0.0001), but the interaction was not significant (p > 0.05). Overall, Sd of redcedar in the MIX stand (ERCM) was 5.7 ± 3.9 cm3 cmsw−2 h−1, and Sd of redcedar in the ERC stand (ERCE) was 4.8 ± 3.2 cm3 cmsw−2 h−1 (a 19% difference). Sd of the two species growing in the MIX stand was also affected by season (p < 0.0001) and by species (p < 0.0001), with significant season and species interactions (p < 0.0001). Sd of ERCM was significantly greater than OAKM (p < 0.05), except for summer 2018. Overall, in the mixed stand, Sd of redcedar was 74% higher than that of post oak (Figure 3).
The diurnal pattern of Sd differed between post oak and redcedar under soil moisture stress. During the growing season, the sap flow of post oak and redcedar started at approximately 7:00, and Sd increased throughout the first part of the day, reaching a peak at approximately 14:00 for both species. Sd of redcedar was greater than that of post oak between 10:00 and 21:00 (Figure 4a). However, during a moderate drought in 2018 (14–28 July), the diurnal pattern of post oak was not greatly affected, even though Sd was 17% lower than the growing season average. In comparison, the diurnal pattern of Sd of redcedar skewed towards the afternoon, peaking at about 50% below its growing season average at 16:00 (Figure 4b). During the abnormal drought of 2017, the reduction in Sd was similar for post oak (58% lower) and redcedar (63% lower) compared with the mean value for that growing season (Figure 4c). The Sd of post oak reached a plateau at around 10:00, while redcedar peaked at around 14:00.
Although species differed in diurnal sap flow patterns, the relationship between daily Sd and daily VPD of both post oak and redcedar was similar. Both species were characterized by a bell-shaped response with peaks of Sd around 1.0–1.2 kPa and substantially decreased Sd (~25% of maximum) when VPD was below 0.2 kPa or over 2.4 kPa (Figure 5).

3.3. Water Use and Its Relationship with DBH, Sapwood Area and Sd

Mean sapwood area (± SD) was 113.8 ± 82.9 and 78.1 ± 40.4 cm2 tree−1 for post oak and redcedar, respectively (Table 1). Although the growing season daily average water use (WU ± SD) per tree was 32% higher for post oak compared to redcedar (13.9 ± 20.2 and 9.4 ± 10.8 L day−1, respectively), the maximum daily water use per tree was similar between species, with 27.9 ± 33.0 and 28.0 ± 25.9 L day−1 for post oak and redcedar, respectively (Table 3). The water use of post oak trees in the MIX stand had its highest seasonal average (28.1 ± 32.7 L day−1) for the spring of 2017, while the highest seasonal average for post oak trees in the OAK stand was 13.2 ± 17.0 L day−1 for the spring of 2018 (Figure 6a). The highest seasonal water use of redcedar trees was 18.5 ± 11.19 and 23.5 ± 22.2 L day−1 for ERCE and ERCM, respectively, in the spring of 2017 when soil moisture at multiple depths was generally high (Figure 2 and Figure 6b,c).
The seasonal average WU for the post oaks growing in different stands depended on the season (p < 0.0001) and stand type (p < 0.0001), and exhibited a significant interaction between stand and season (p < 0.0001), with OAKM exhibiting between 43% and 64% greater WU than OAKO during spring, summer, and fall for both 2017 and 2018 (Figure 6a). Overall, redcedar trees in ERCM exhibited 26% higher WU than redcedar trees in ERCE for the entire study period, and the interaction between stand type and season was not significant (Figure 6c). When the WU of post oak and redcedar in MIX was compared (OAKM vs. ERCM), seasonal WU was affected by species (p < 0.0001), and season (p < 0.0001), with a significant season and species interaction (p < 0.0001). Seasonal average water use of OAKM was 48%, 40%, and 58% higher than that of ERCM (p < 0.05) for the summer of 2017 and the spring and summer of 2018, respectively (Figure 6b).
Sapwood area (SA) was correlated to stem diameter (DBH) for both species. The slope of the relationship between SA and DBH for post oak was significantly greater than that of redcedar (p = 0.009), but the species had similar intercepts (p = 0.26) (Figure 7a). The Sd increased significantly with DBH for oak (p < 0.05), but it decreased for redcedar, although the relationship was not significant (Figure 7b). Even though the daily WU of both post oak and redcedar increased linearly with their SA (Figure 7c), the relationship between daily WU and DBH was significant only for post oak (Figure 7d), with the daily WU of post oaks increasing linearly with an increase in DBH.

3.4. Stand-Level Water Use

Stand-level cumulative water use in 2018 was the highest for the ERC stand until June, when it was overtaken by the MIX and OAK stands (Figure 8). In 2018, the total stand-level water use was 635 mm, 557 mm, and 498 mm for MIX, OAK, and ERC, respectively.

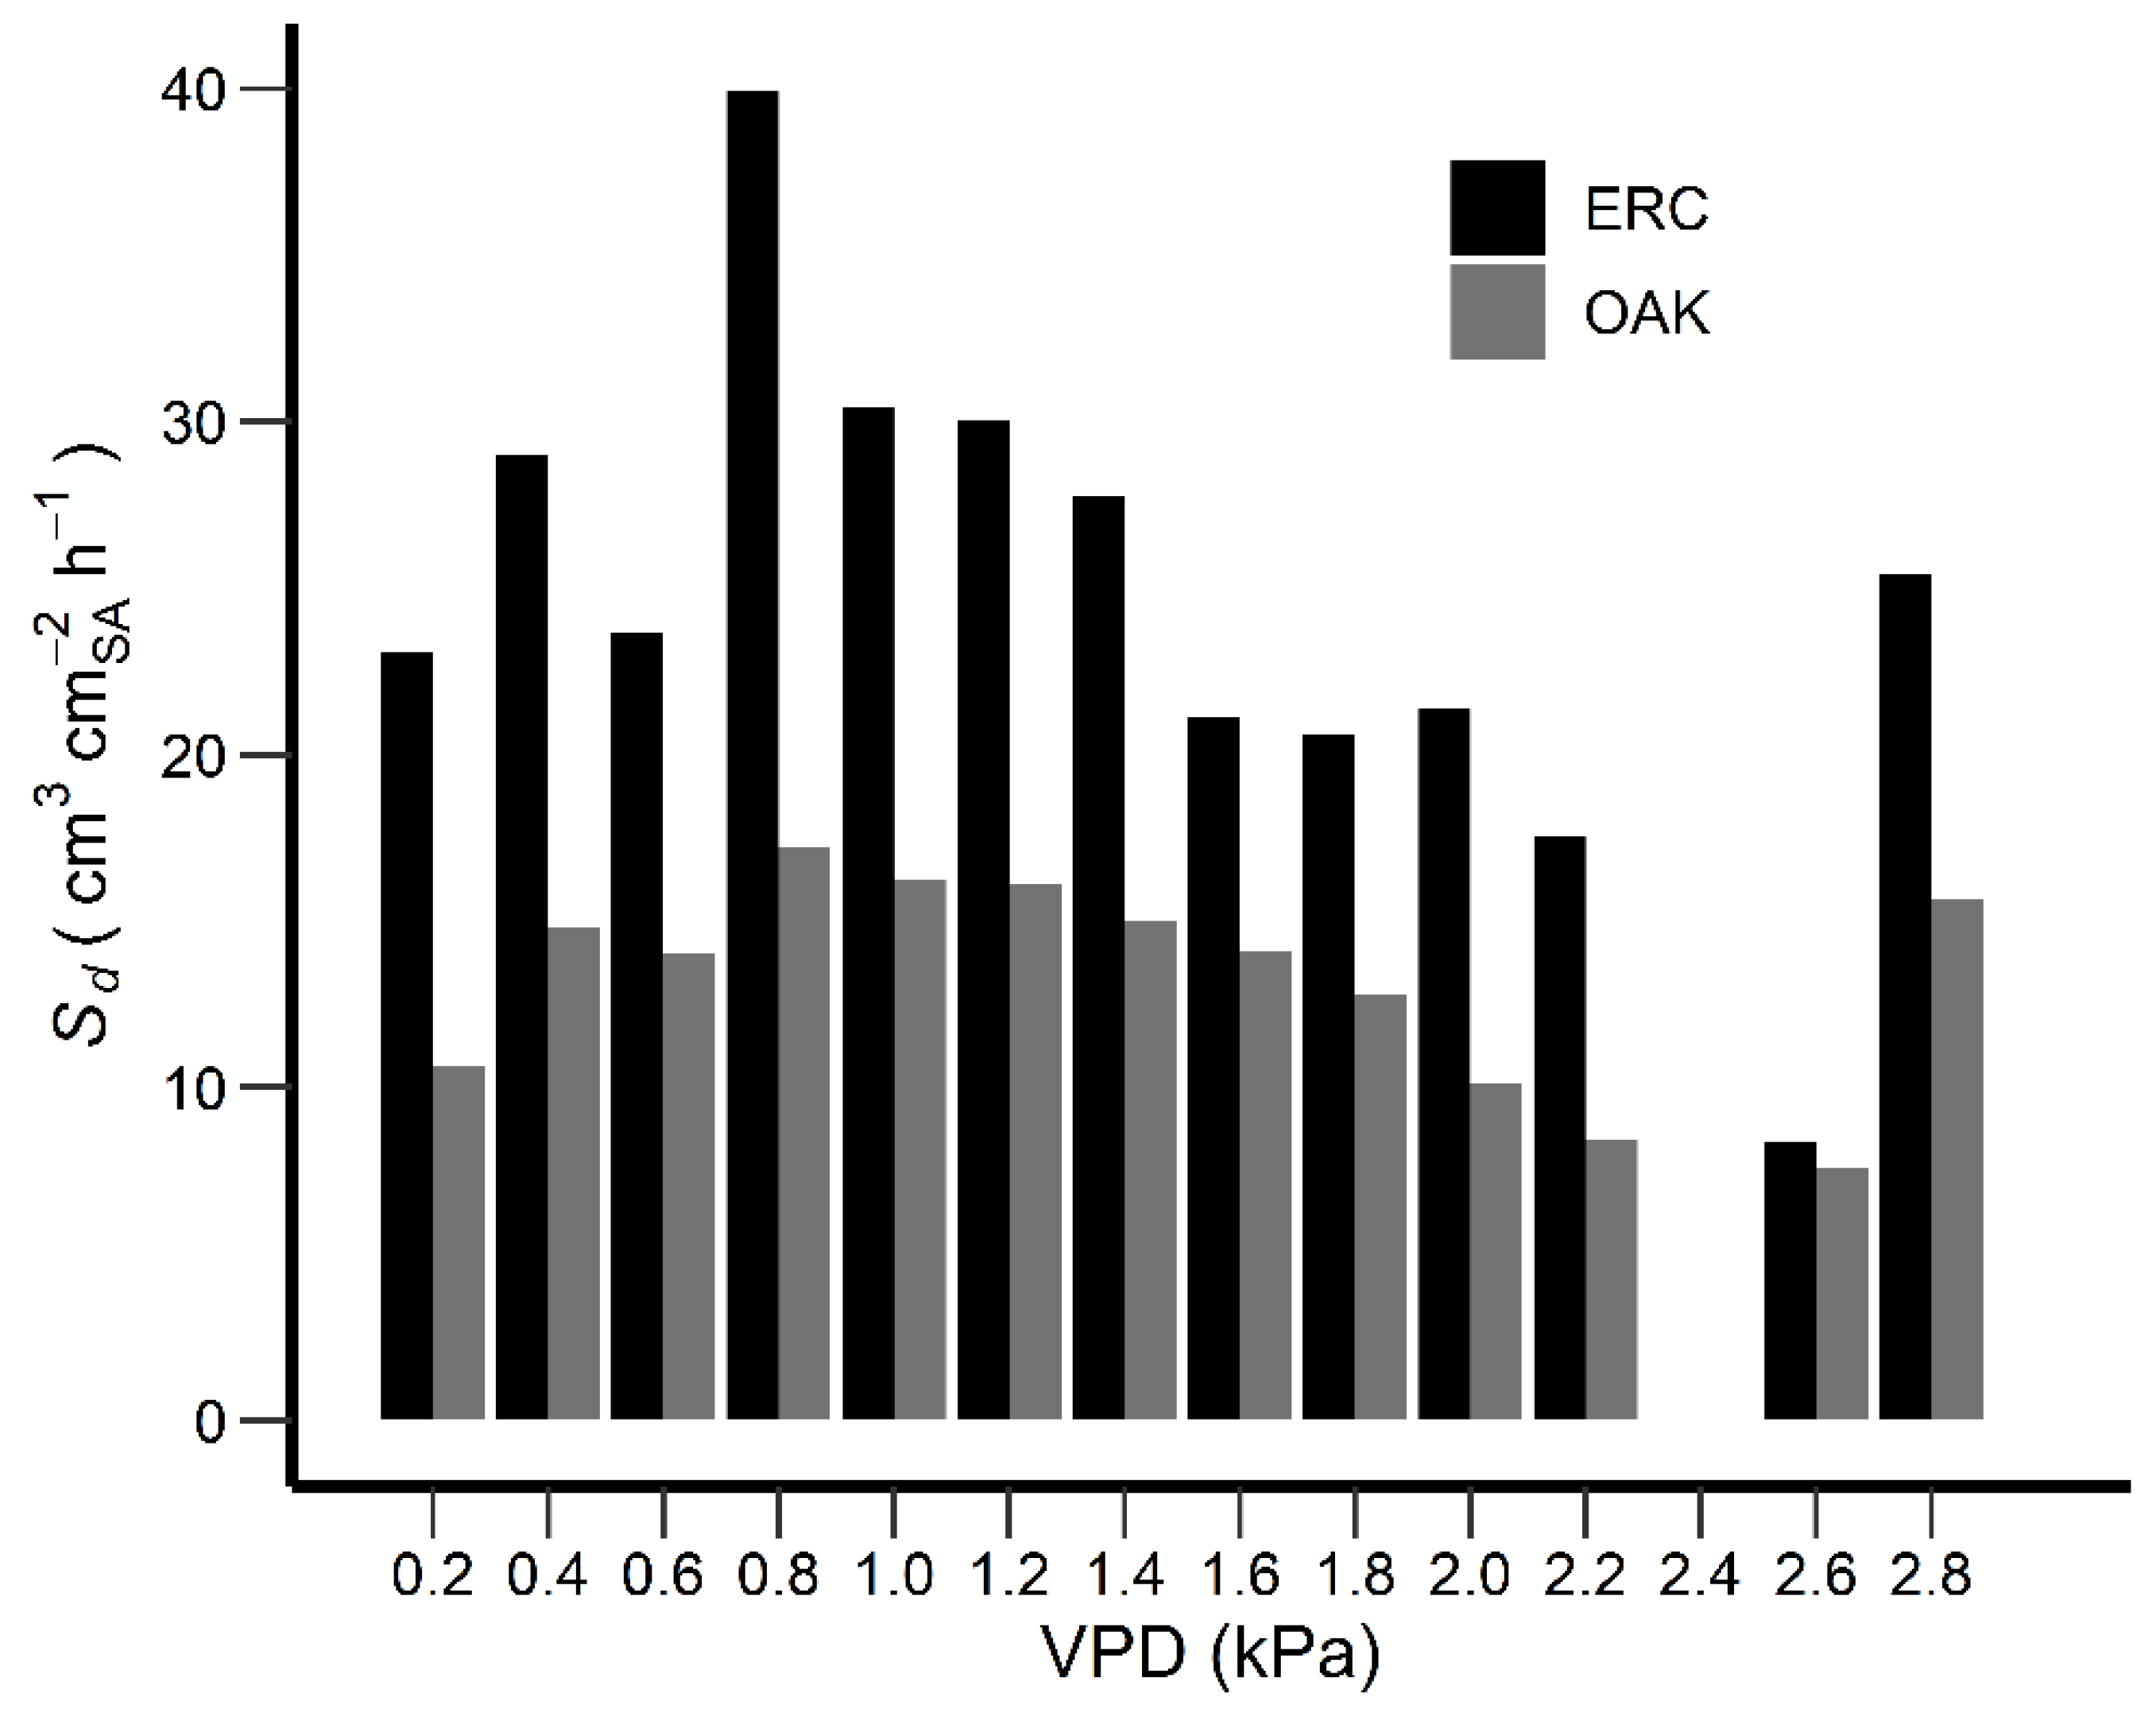
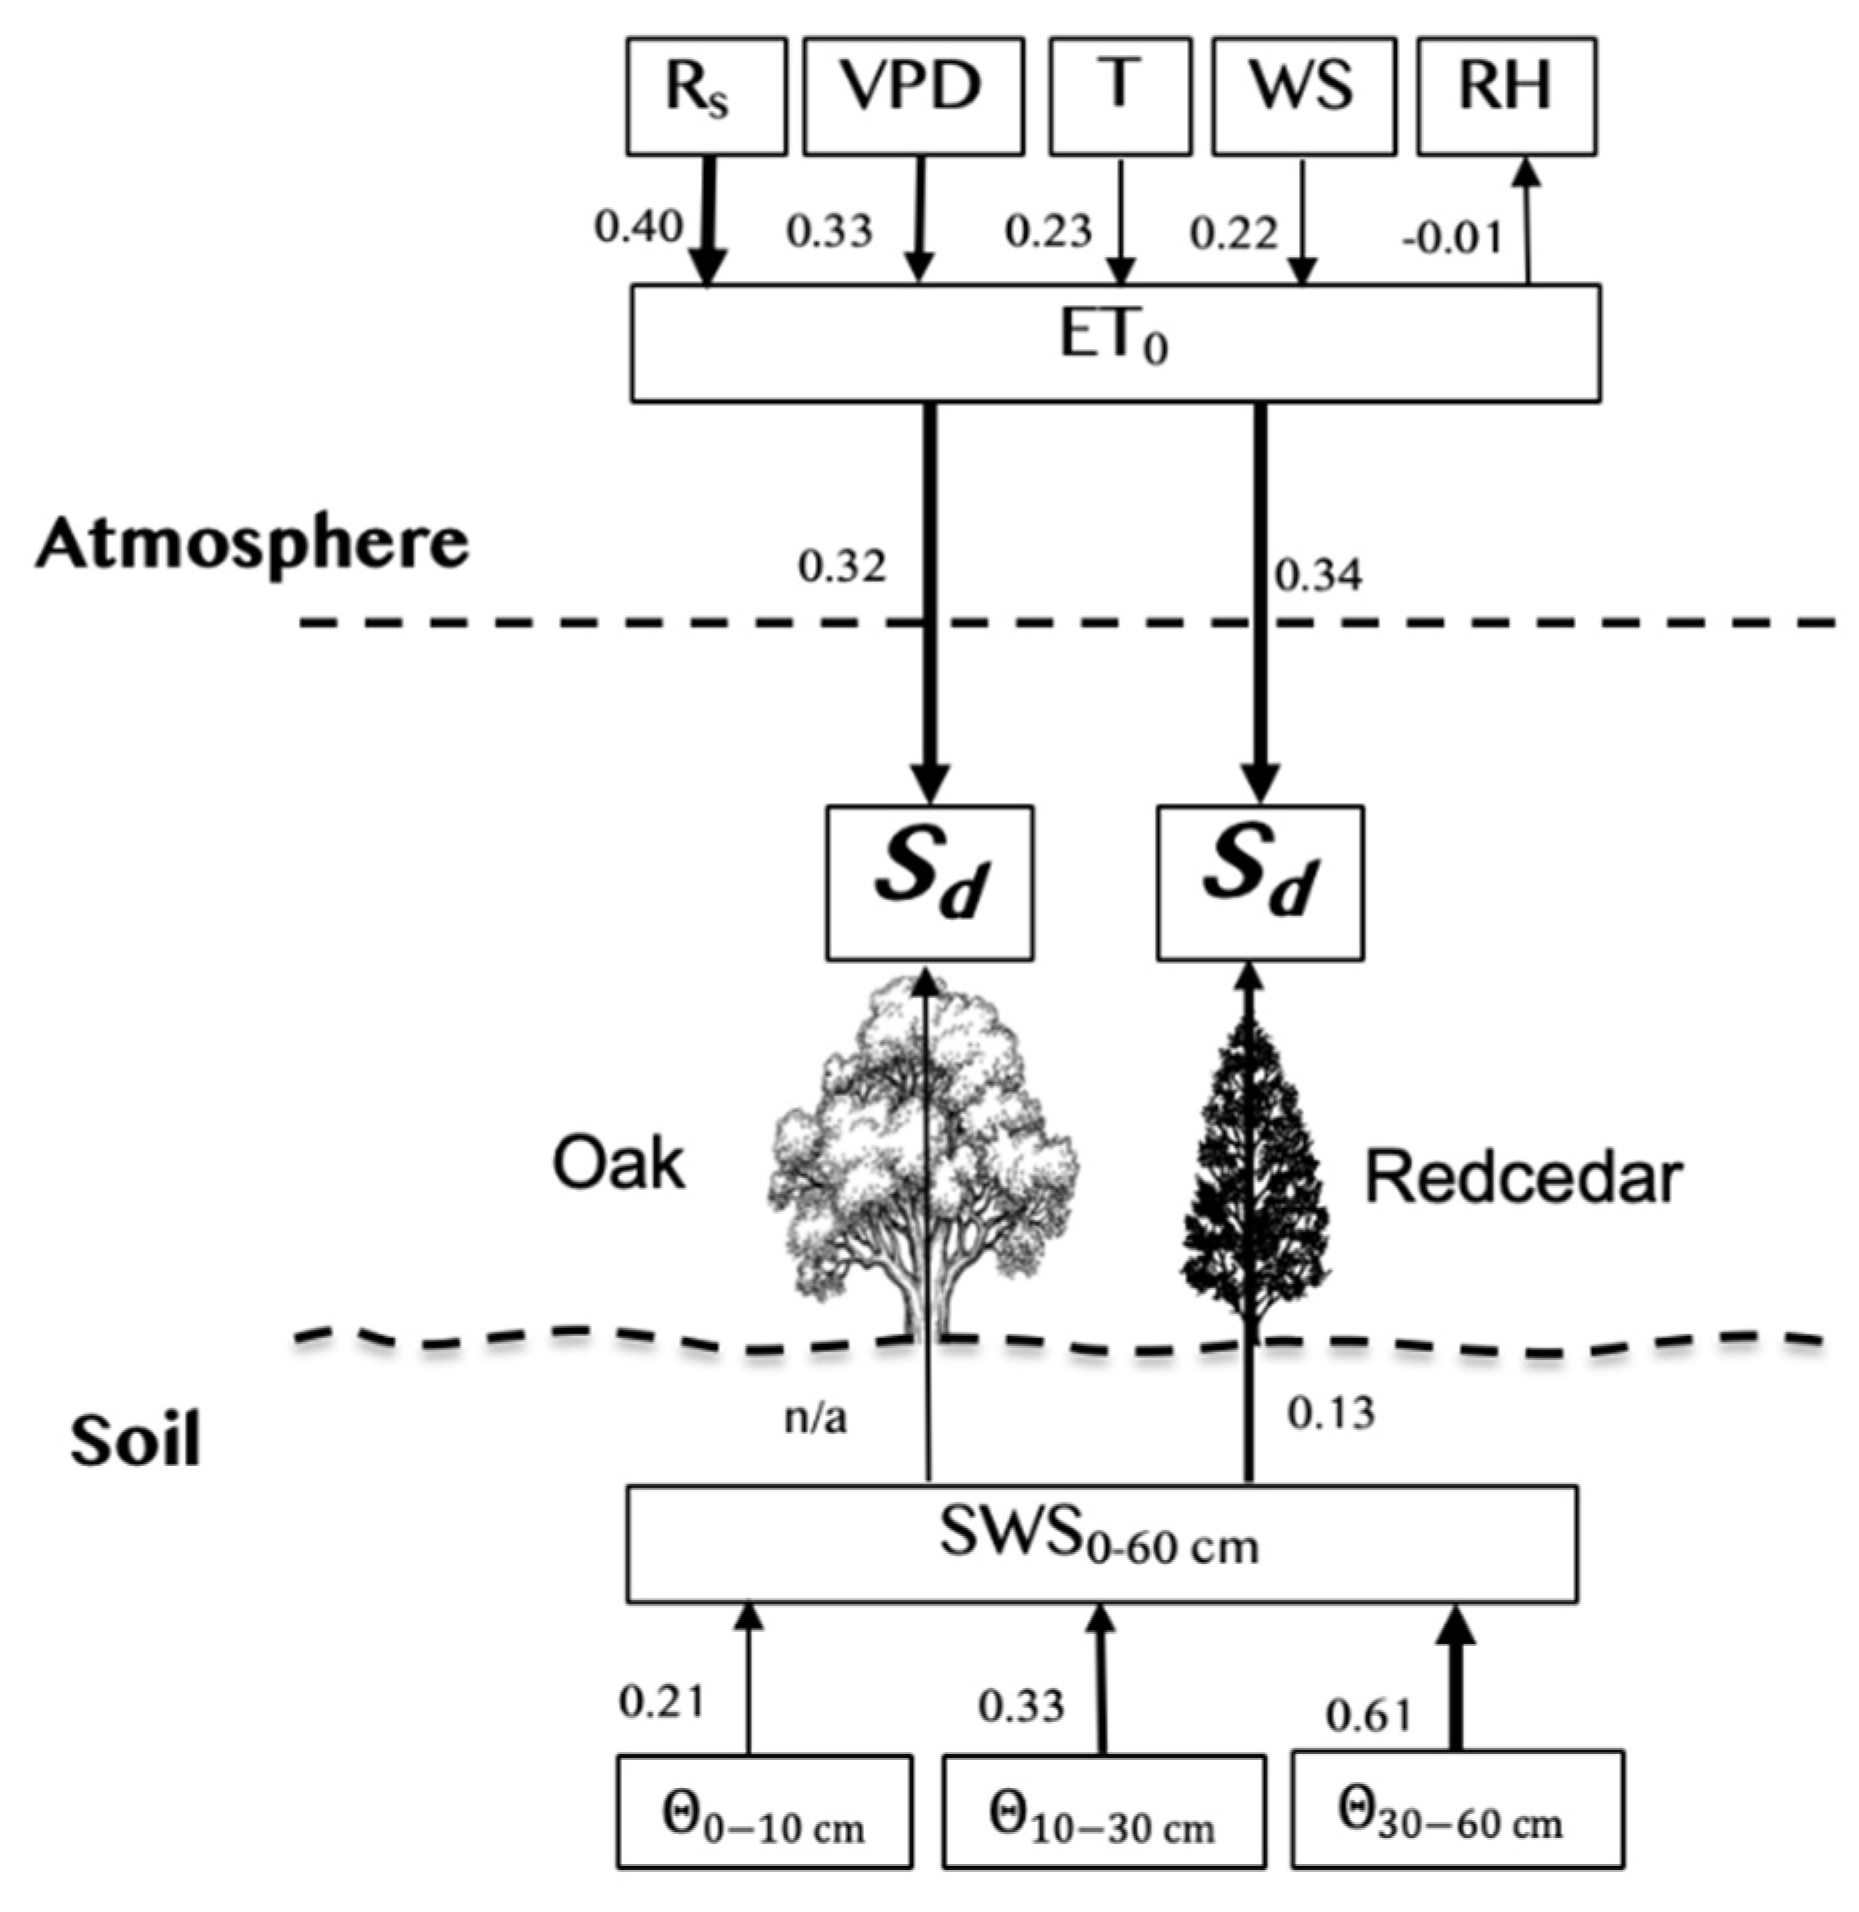
3.5. Sd day and Environmental Variables

The structural equation model explained 10.9% of the variation in the Sd of post oak (χ2 = 4231.6, df = 36, p < 0.01) and 23.2% in the Sd of redcedar (χ2 = 3928.2, df = 36, p < 0.01). Sd in both species was strongly affected by daily ETo, which was positively correlated with average daily VPD, total daily Rs, and average daily temperature (T), but negatively correlated with daily RH (Figure 9). Importantly, there was a significant correlation between the daily soil water storage in the top 60 cm (SWS0–60) and Sd for redcedar but not for post oak, indicating that the Sd of redcedar was more affected by θ than post oak.

4. Discussion

4.1. Sap Flow Density, Sd

Overall, we found that post oaks exhibited 74% lower Sd than redcedar in the mixed stand, which does not support our first hypothesis where we expected redcedar, with its relatively low hydraulic conductance and narrow tracheids, to have lower sap flow density than the ring-porous post oak. Similar to our finding, Cooper et al. [20] reported that the Sd of mature post oak was 31% lower than mature coniferous loblolly pine (Pinus taeda L.) when grown together in east Texas, USA. The greater Sd in redcedar may be related to redcedar having a lower leaf water potential than post oaks when grown together [48], which may increase water uptake from the soil and movement through the soil–plant–atmosphere continuum. However, leaf-level gas exchange measured on the same trees used in the current study was up to five times greater in post oak than eastern redcedar [48]. Therefore, the greater Sd in redcedar could have been due to greater leaf area/sapwood area. While we did not measure leaf area, SA was 31% less in eastern redcedar.
We also found that the Sd of redcedar decreased to a greater extent than post oak in response to drought. The differences in Sd behavior to drought might reflect the species-specific stomatal limitation of gas exchange in response to decreased soil moisture [49]. However, we found both species had similar relative reductions in stomatal conductance during drought [48]. The different Sd responses observed under moderate drought, whereby redcedar showed greater midday reduction, might have resulted from shallower rooting in redcedar as compared to post oak. In an Aleppo pine (P. halepensis Mill.) and holm oak (Q. ilex L.) mixed forest, isotope composition in the water uptake revealed that oaks and pines rely heavily on shallow soil water in single species stands. However, when in mixed stands, oak shift water extraction to deeper soil layers as shallow soil moisture is mostly taken up by the pines [23]. Redcedar is typically rooted in the upper 1 m, which is shallower than the co-occurring oak species [50]. Under moderate drought, the Sd of oak might be maintained by water extraction from deeper soil water. This would explain our observations that the Sd of redcedar was more affected by θ than the post oaks in the SEM analysis. The similar reduction of Sd for both redcedar and oak under protracted drought likely occurs because soil moisture is low throughout the soil profile.

4.2. Sd day and Environmental Variables

Water use by a tree is regulated by environmental factors [15,18,51]. Most studies indicate that sap flow in a tree is strongly affected by VPD [35,52,53]. The rate of transpiration of redcedar increased with increasing VPD and the availability of soil water [15,18]. In a Mediterranean oak stand, daily transpiration was highly correlated with solar radiation and VPD [54]. In our study, both redcedar and post oak exhibited increased water use as daily mean VPD increased up to approximately 1.2 kPa.
Redcedar water use declines at high VPD [15]. Post oaks also present similar behavior, with decreasing transpiration when VPD is higher than 2.5 kPa [55,56]. However, water use by post oaks and blackjack oaks stabilized when VPD values were above 1 kPa in stands in Texas [20]. In our study, Sd day were substantially lower when daily VPD exceeded 1.8 kPa (Figure 5).
In 2018, the total precipitation was 919 mm, which was 69% of the total ETo of 1326 mm, which indicates likely soil moisture limitations to transpiration. High ETo in both summers were associated with reduced soil moisture availability due to drought episodes. In our study, ETo was a better explanatory variable than SWS0–60 for Sd day for both species (Figure 9); however, SWS0–60 had a weak influence for redcedar, but no significant relationship for post oak. This does not support our hypothesis that the main driver of water use was soil moisture. These results suggest that redcedar is likely relying on water from the top 60 cm more than post oaks do. Also, in this study, the soil moisture arrays were randomly distributed to capture the overall soil moisture conditions for the site, not specifically for each type of stand, which may partially explain the weak correlation between Sd day and soil moisture. A better design to track soil moisture dynamics along the entire depth of the rooting zone both for redcedar and oak and a meteorological station to capture the microclimate differences between stands would have improved our ability to model species-specific Sd day from meteorological and soil moisture variables.

4.3. Water Use

Species had higher water use when growing in the mixed stand than in single species stands (stands had similar basal areas and SA), which supports our second hypothesis. This was likely achieved through species-specific stratification in soil water extraction [22,23]. When coexisting with conifers, beech (Fagus sylvatica L.) trees were able to extract water from progressively deeper soil layers in a temperate mixed-species plantation [22]. Redcedar exhibits plasticity in sourcing soil water among different seasons, and it mostly uses water from the upper 0.5 m when soil moisture is high during the spring [57]. Post oak has deeper root systems that help to sustain water extraction from deeper soil layers when shallow soil is abnormally dry [58,59]. The water use of post oak and blackjack oak was not affected by the decline of soil moisture in the upper 150 cm during summer in a study conducted in Texas, USA [20]. These results suggest that the two oak species in the Cross-Timbers can reach deep soil water to sustain water use, which is critical for a generally dry and highly variable climate. Assuming niche differentiation in rooting depth, post oaks and redcedar, when they co-exist, should be able to explore soil moisture from a greater soil profile and maximize overall water extraction from the entire soil profile. Quercus spp. can exhibit hydraulic lift [60], which may facilitate water acquisition by co-occurring but shallowly rooted redcedar. Consequently, the stand-level water use of the mixed stand can be higher than either an oak or redcedar stand alone on an annual scale (Figure 7).
Our study showed that replacement of post oak by redcedar of a similar basal area increases total transpiration on an annual scale which will alter the hydrological cycle. Normally, the encroachment and infilling of redcedar into an oak savanna or woodland entails a net increase in basal area and leaf area index, which will produce a stronger impact on the hydrological cycle than we measured in our study. In addition to increasing potential transpiration, the increase of total leaf area through the addition of an evergreen mid-story canopy will increase water loss to canopy interception [61], which decreases the net precipitation to replenish the soil. Also, the stratification rooting depth by post oak and redcedar in a mixed forest will likely better facilitate soil moisture extraction, especially under the projected increases in temperature and precipitation variability for the Great Plains [30]. From a water budget perspective, the increase in evapotranspiration has to be balanced by the reduction of either runoff or deep drainage, or likely both. Hydrologically, a drier soil profile lowers the potential to produce surface runoff, subsurface lateral flow, and groundwater recharge, leading to the reduction of total streamflow in general.

5. Conclusions

Fire exclusion and suppression have resulted in a rapid increase of redcedar into the oak savanna, woodlands, and forests of the Cross-Timbers in the south-central Great Plains. Changes in species composition and re-assemblage after redcedar establishment into the mid-story affect species-specific water use and increase the stand-level water use on an annual scale. The overall increase in canopy water use likely results from the stratification in soil water uptake depth under interspecific competition.
From a water balance perspective, the increase in annual transpiration due to redcedar encroachment into the oak savanna will be balanced by a reduction of either runoff or groundwater recharge, assuming other components remain unchanged for a given water year. The Cross-Timbers are important water conservation forests for many water supply reservoirs in the south-central Great Plains. Reduction in streamflow accounts for the loss of a major ecosystem service. Information on water use of post oaks and redcedar under intra- or interspecific competition can assist in assessing stand-level water use and guiding effective practices for sustainable management of the Cross-Timbers for optimizing water resources.
Further studies should quantify the ecosystem level evapotranspiration or direct measurement of runoff using a paired watershed to further improve our understanding of the alterations in the water budget and its potential impact on water resources in the Cross-Timbers in the south-central Great Plains.

Author Contributions

P.R.T. developed the study idea, developed the study design, collected and processed the data, performed the analyses, and wrote the paper. C.B.Z. and R.E.W. conceived the study idea, developed the study design, helped in the analyses and discussion of the results, and co-wrote the paper. B.Z. helped with the analyses and discussion of the results and co-wrote the paper. All authors have read and agreed to the published version of the manuscript.

Funding

This work was supported by funding from the National Science Foundation (NSF) under Grant No. OIA-1301789 and Grant No. OIA1946093, and by the Oklahoma Agricultural Experiment Station and McIntire-Stennis project OKL0 2931 and OKL0 2929.

Acknowledgments

The authors thank numerous graduate students and undergraduates who have helped in data collection and thank the OSU Cross-Timbers Experimental Range crew for all their support.

Conflicts of Interest

The authors declare no conflict of interest.

References

  1. Zou, C.; Twidwell, D.; Bielski, C.; Fogarty, D.; Mittelstet, A.; Starks, P.; Will, R.; Zhong, Y.; Acharya, B. Impact of eastern redcedar proliferation on water resources in the Great Plains USA—Current state of knowledge. Water 2018, 10, 1768. [Google Scholar] [CrossRef] [Green Version]
  2. Barger, N.N.; Archer, S.R.; Campbell, J.L.; Huang, C.y.; Morton, J.A.; Knapp, A.K. Woody plant proliferation in North American drylands: A synthesis of impacts on ecosystem carbon balance. J. Geophys. Res. Biogeosci. 2011, 116. [Google Scholar] [CrossRef]
  3. Therrell, M.; Stahle, D. A predictive model to locate ancient forests in the Cross Timbers of Osage County, Oklahoma. J. Biogeogr. 1998, 25, 847–854. [Google Scholar] [CrossRef]
  4. Anderson, R.C.; Fralish, J.S.; Baskin, J.M. Savannas, Barrens, and Rock Outcrop Plant Communities of North America; Cambridge University Press: Cambridge, UK, 1999. [Google Scholar]
  5. DeSantis, R.D.; Hallgren, S.W.; Lynch, T.B.; Burton, J.A.; Palmer, M.W. Long-term directional changes in upland Quercus forests throughout Oklahoma, USA. J. Veg. Sci. 2010, 21, 606–615. [Google Scholar] [CrossRef]
  6. DeSantis, R.D.; Hallgren, S.W.; Stahle, D.W. Drought and fire suppression lead to rapid forest composition change in a forest-prairie ecotone. For. Ecol. Manag. 2011, 261, 1833–1840. [Google Scholar] [CrossRef]
  7. Hoff, D.L.; Will, R.E.; Zou, C.B.; Lillie, N.D. Encroachment dynamics of Juniperus virginiana L. and mesic hardwood species into Cross Timbers forests of North-Central Oklahoma, USA. Forests 2018, 9, 75. [Google Scholar] [CrossRef] [Green Version]
  8. Hoff, D.L.; Will, R.E.; Zou, C.B.; Weir, J.R.; Gregory, M.S.; Lillie, N.D. Estimating increased fuel loading within the Cross Timbers forest matrix of Oklahoma, USA due to an encroaching conifer, Juniperus virginiana, using leaf-off satellite imagery. For. Ecol. Manag. 2018, 409, 215–224. [Google Scholar] [CrossRef]
  9. Nunes Biral, V.C.; Will, R.E.; Zou, C.B. Establishment of Quercus marilandica Muenchh. and Juniperus virginiana L. in the tallgrass prairie of Oklahoma, USA increases litter inputs and soil organic carbon. Forests 2019, 10, 329. [Google Scholar] [CrossRef] [Green Version]
  10. Joshi, O.; Will, R.E.; Zou, C.B.; Kharel, G.J.S. Sustaining Cross-Timbers forest resources: Current knowledge and future research needs. Sustainability 2019, 11, 4703. [Google Scholar] [CrossRef] [Green Version]
  11. Zou, C.B.; Turton, D.J.; Will, R.E.; Engle, D.M.; Fuhlendorf, S.D. Alteration of hydrological processes and streamflow with juniper (Juniperus virginiana) encroachment in a mesic grassland catchment. Hydrol. Process. 2014, 28, 6173–6182. [Google Scholar] [CrossRef]
  12. Qiao, L.; Zou, C.B.; Stebler, E.; Will, R.E. Woody plant encroachment reduces annual runoff and shifts runoff mechanisms in the tallgrass prairie, USA. Water Resour. Res. 2017, 53, 4838–4849. [Google Scholar] [CrossRef]
  13. Acharya, B.S.; Halihan, T.; Zou, C.B.; Will, R.E. Vegetation controls on the spatio-temporal heterogeneity of deep moisture in the unsaturated zone: A hydrogeophysical evaluation. Sci. Rep. 2017, 7, 1499. [Google Scholar] [CrossRef] [PubMed] [Green Version]
  14. Huxman, T.E.; Wilcox, B.P.; Breshears, D.D.; Scott, R.L.; Snyder, K.A.; Small, E.E.; Hultine, K.; Pockman, W.T.; Jackson, R.B. Ecohydrological implications of woody plant encroachment. Ecology 2005, 86, 308–319. [Google Scholar] [CrossRef]
  15. Caterina, G.L.; Will, R.E.; Turton, D.J.; Wilson, D.S.; Zou, C.B. Water use of Juniperus virginiana trees encroached into mesic prairies in Oklahoma, USA. Ecohydrology 2014, 7, 1124–1134. [Google Scholar] [CrossRef]
  16. Bahari, Z.A.; Pallardy, S.G.; Parker, W.C. Photosynthesis, water relations, and drought adaptation in six woody species of oak-hickory forests in central Missouri. For. Sci. (USA) 1985. [Google Scholar] [CrossRef]
  17. Maherali, H.; Moura, C.F.; Caldeira, M.C.; Willson, C.J.; Jackson, R.B. Functional coordination between leaf gas exchange and vulnerability to xylem cavitation in temperate forest trees. Plant Cell Environ. 2006, 29, 571–583. [Google Scholar] [CrossRef] [PubMed]
  18. Awada, T.; El-Hage, R.; Geha, M.; Wedin, D.A.; Huddle, J.A.; Zhou, X.; Msanne, J.; Sudmeyer, R.A.; Martin, D.L.; Brandle, J.R. Intra-annual variability and environmental controls over transpiration in a 58-year-old even-aged stand of invasive woody Juniperus virginiana L. in the Nebraska Sandhills, USA. Ecohydrology 2013, 6, 731–740. [Google Scholar] [CrossRef]
  19. Starks, P.J.; Venuto, B.C.; Dugas, W.A.; Kiniry, J. Measurements of canopy interception and transpiration of eastern redcedar grown in open environments. Environ. Nat. Resour. Res. 2014, 4, 103. [Google Scholar] [CrossRef]
  20. Cooper, C.E.; Aparecido, L.M.T.; Muir, J.P.; Morgan, C.L.S.; Heilman, J.L.; Moore, G.W. Transpiration in recovering mixed loblolly pine and oak stands following wildfire in the Lost Pines region of Texas. Ecohydrology 2018, 12, e2052. [Google Scholar] [CrossRef] [Green Version]
  21. Heilman, J.L.; Litvak, M.E.; McInnes, K.J.; Kjelgaard, J.F.; Kamps, R.H.; Schwinning, S. Water-storage capacity controls energy partitioning and water use in karst ecosystems on the Edwards Plateau, Texas. Ecohydrology 2014, 7, 127–138. [Google Scholar] [CrossRef]
  22. Grossiord, C.; Gessler, A.; Granier, A.; Berger, S.; Bréchet, C.; Hentschel, R.; Hommel, R.; Scherer-Lorenzen, M.; Bonal, D. Impact of interspecific interactions on the soil water uptake depth in a young temperate mixed species plantation. J. Hydrol. 2014, 519, 3511–3519. [Google Scholar] [CrossRef]
  23. del Castillo, J.; Comas, C.; Voltas, J.; Ferrio, J.P. Dynamics of competition over water in a mixed oak-pine Mediterranean forest: Spatio-temporal and physiological components. For. Ecol. Manag. 2016, 382, 214–224. [Google Scholar] [CrossRef] [Green Version]
  24. Novick, K.A.; Ficklin, D.L.; Stoy, P.C.; Williams, C.A.; Bohrer, G.; Oishi, A.C.; Papuga, S.A.; Blanken, P.D.; Noormets, A.; Sulman, B.N.; et al. The increasing importance of atmospheric demand for ecosystem water and carbon fluxes. Nat. Clim. Chang. 2016, 6, 1023–1027. [Google Scholar] [CrossRef] [Green Version]
  25. Asbjornsen, H.; Mora, G.; Helmers, M.J. Variation in water uptake dynamics among contrasting agricultural and native plant communities in the Midwestern US. Agric. Ecosyst. Environ. 2007, 121, 343–356. [Google Scholar] [CrossRef]
  26. Allen, R.G.; Pereira, L.S.; Raes, D.; Smith, M. Crop evapotranspiration—Guidelines for computing crop water requirements - FAO Irrigation and drainage paper 56. FAO Rome 1998, 300, D05109. [Google Scholar]
  27. Sellers, P.; Randall, D.; Collatz, G.; Berry, J.; Field, C.; Dazlich, D.; Zhang, C.; Collelo, G.; Bounoua, L. A revised land surface parameterization (SiB2) for atmospheric GCMs. Part I: Model formulation. J. Clim. 1996, 9, 676–705. [Google Scholar] [CrossRef]
  28. Williams, I.N.; Lu, Y.; Kueppers, L.M.; Riley, W.J.; Biraud, S.C.; Bagley, J.E.; Torn, M.S. Land-atmosphere coupling and climate prediction over the US Southern Great Plains. J. Geophys. Res. Atmos. 2016, 121, 12125–12144. [Google Scholar] [CrossRef]
  29. Knapp, A.K.; Beier, C.; Briske, D.D.; Classen, A.T.; Luo, Y.; Reichstein, M.; Smith, M.D.; Smith, S.D.; Bell, J.E.; Fay, P.A.; et al. Consequences of more extreme precipitation regimes for terrestrial ecosystems. Bioscience 2008, 58, 811–821. [Google Scholar] [CrossRef]
  30. Karl, T.R.; Melillo, J.M.; Peterson, T.C.; Hassol, S.J. Global Climate Change Impacts in the United States; Cambridge University Press: Cambridge, UK, 2009. [Google Scholar]
  31. Collins, M.; Knutti, R.; Arblaster, J.; Dufresne, J.L.; Fichefet, T.; Friedlingstein, P.; Gao, X.; Gutowski, W.J.; Johns, T.; Krinner, G.; et al. Long-term climate change: Projections, commitments and irreversibility. In Climate Change 2013-The Physical Science Basis: Contribution of Working Group I to the Fifth Assessment Report of the Intergovernmental Panel on Climate Change; Cambridge University Press: Cambridge, UK, 2013; pp. 1029–1136. [Google Scholar]
  32. Siqueira, M.; Katul, G.; Porporato, A. Onset of water stress, hysteresis in plant conductance, and hydraulic lift: Scaling soil water dynamics from millimeters to meters. Water Resour. Res. 2008, 44. [Google Scholar] [CrossRef]
  33. Ferguson, C.R.; Wood, E.F.; Vinukollu, R.K. A global intercomparison of modeled and observed land–atmosphere coupling. J. Hydrometeorol. 2012, 13, 749–784. [Google Scholar] [CrossRef]
  34. Wullschleger, S.D.; Hanson, P.J.; Todd, D.E. Transpiration from a multi-species deciduous forest as estimated by xylem sap flow techniques. For. Ecol. Manag. 2001, 143, 205–213. [Google Scholar] [CrossRef]
  35. Liu, X.; Zhang, B.; Zhuang, J.Y.; Han, C.; Zhai, L.; Zhao, W.R.; Zhang, J.C. The relationship between sap flow density and environmental factors in the Yangtze River delta region of China. Forests 2017, 8, 74. [Google Scholar] [CrossRef]
  36. Kyung, M. A computational Bayesian method for estimating the number of knots in regression splines. Bayesian Anal. 2011, 6, 793–828. [Google Scholar] [CrossRef]
  37. Sahari, J.; Sapuan, S.; Zainudin, E.; Maleque, M. Thermo-mechanical behaviors of thermoplastic starch derived from sugar palm tree (Arenga pinnata). Carbohydr. Polym. 2013, 92, 1711–1716. [Google Scholar] [CrossRef] [PubMed]
  38. Bowles, T.M.; Jackson, L.E.; Cavagnaro, T.R. Mycorrhizal fungi enhance plant nutrient acquisition and modulate nitrogen loss with variable water regimes. Glob. Chang. Boil. 2018, 24, e171–e182. [Google Scholar] [CrossRef]
  39. Daou, L.; Shipley, B. The measurement and quantification of generalized gradients of soil fertility relevant to plant community ecology. Ecology 2019, 100, e02549. [Google Scholar] [CrossRef] [Green Version]
  40. Li, Z.; Tian, D.; Wang, B.; Wang, J.; Wang, S.; Chen, H.Y.; Xu, X.; Wang, C.; He, N.; Niu, S. Microbes drive global soil nitrogen mineralization and availability. Glob. Chang. Boil. 2019, 25, 1078–1088. [Google Scholar] [CrossRef]
  41. Web Soil Survey. Available online: https://websoilsurvey.sc.egov.usda.gov/ (accessed on 10 March 2020).
  42. Oklahoma Climatological Survey. Available online: http://climate.mesonet.org/county_climate/Products/County_Climatologies/county_climate_payne.pdf (accessed on 5 March 2020).
  43. Granier, A. Une nouvelle méthode pour la mesure du flux de sève brute dans le tronc des arbres. In Annales des Sciences Forestières; No. 2; EDP Sciences: Les Ulis, France, 1985; Volume 42, pp. 193–200. [Google Scholar]
  44. Renninger, H.J.; Schafer, K.V.R. Comparison of tissue heat balance-and thermal dissipation-derived sap flow measurements in ring-porous oaks and a pine. Front. Plant Sci. 2012, 3, 103. [Google Scholar] [CrossRef] [Green Version]
  45. Sun, H.; Aubrey, D.P.; Teskey, R.O. A simple calibration improved the accuracy of the thermal dissipation technique for sap flow measurements in juvenile trees of six species. Trees 2012, 26, 631–640. [Google Scholar] [CrossRef]
  46. Lloyd, J.; Grace, J.; Miranda, A.C.; Meir, P.; Wong, S.C.; Miranda, H.S.; Wright, I.R.; Gash, J.H.C.; McIntyre, J. A simple calibrated model of Amazon rainforest productivity based on leaf biochemical properties. Plant Cell Environ. 1995, 18, 1129–1145. [Google Scholar] [CrossRef]
  47. United States Drought Monitor—U.S. Department of Agriculture (USDA) and the National Oceanic and Atmospheric Association (NOAA). Available online: https://droughtmonitor.unl.edu/CurrentMap/StateDroughtMonitor.aspx (accessed on 15 July 2020).
  48. Torquato, P.R.; Zou, C.B.; Adhikari, A.; Adams, H.D.; Will, R.E. Drought tolerance and competition in eastern redcedar (Juniperus virginiana) encroachment of the oak-dominated Cross Timbers. Front. Plant Sci. 2020, 11. [Google Scholar] [CrossRef] [PubMed] [Green Version]
  49. Fisher, R.A.; Williams, M.; Do Vale, R.L.; Da Costa, A.L.; Meir, P. Evidence from Amazonian forests is consistent with isohydric control of leaf water potential. Plant Cell Environ. 2006, 29, 151–165. [Google Scholar] [CrossRef] [PubMed]
  50. Hinckley, T.; Teskey, R.; Duhme, F.; Richter, H. Temperate hardwood forests. Water Deficits Plant Growth 1981, 6, 153–208. [Google Scholar]
  51. Thorburn, P.J.; Hatton, T.J.; Walker, G.R. Combining measurements of transpiration and stable isotopes of water to determine groundwater discharge from forests. J. Hydrol. 1993, 150, 563–587. [Google Scholar] [CrossRef]
  52. Granier, A.; Loustau, D. Measuring and modelling the transpiration of a maritime pine canopy from sap-flow data. Agric. For. Meteorol. 1994, 71, 61–81. [Google Scholar] [CrossRef]
  53. Phillips, N.; Oren, R. Intra- and inter-annual variation in transpiration of a pine forest. Ecol. Appl. 2001, 11, 385–396. [Google Scholar] [CrossRef]
  54. Hernández-Santana, V.; David, T.S.; Martínez-Fernández, J. Environmental and plant-based controls of water use in a Mediterranean oak stand. For. Ecol. Manag. 2008, 255, 3707–3715. [Google Scholar] [CrossRef]
  55. Hull, J.C.; Wood, S.G. Water relations of oak species on and adjacent to a Maryland serpentine soil. Am. Midl. Nat. 1984, 224–234. [Google Scholar] [CrossRef]
  56. Will, R.E.; Wilson, S.M.; Zou, C.B.; Hennessey, T.C. Increased vapor pressure deficit due to higher temperature leads to greater transpiration and faster mortality during drought for tree seedlings common to the forest–grassland ecotone. New Phytol. 2013, 200, 366–374. [Google Scholar] [CrossRef]
  57. Eggemeyer, K.D.; Awada, T.; Harvey, F.E.; Wedin, D.A.; Zhou, X.; Zanner, C.W. Seasonal changes in depth of water uptake for encroaching trees Juniperus virginiana and Pinus ponderosa and two dominant C4 grasses in a semiarid grassland. Tree Physiol. 2009, 29, 157–169. [Google Scholar] [CrossRef]
  58. Abrams, M.D. Adaptations and responses to drought in Quercus species of North America. Tree Physiol. 1990, 7, 227–238. [Google Scholar] [CrossRef] [PubMed]
  59. Abrams, M.D. Distribution, historical development and ecophysiological attributes of oak species in the eastern United States. Ann. Sci. For. 1996, 53, 487–512. [Google Scholar] [CrossRef] [Green Version]
  60. Zapater, M.; Hossann, C.; Bréda, N.; Bréchet, C.; Bonal, D.; Granier, A. Evidence of hydraulic lift in a young beech and oak mixed forest using 18O soil water labelling. Trees 2011, 25, 885. [Google Scholar] [CrossRef]
  61. Zou, C.B.; Caterina, G.L.; Will, R.E.; Stebler, E.; Turton, D. Canopy interception for a tallgrass prairie under Juniper Encroachment. PLoS ONE 2015, 10. [Google Scholar] [CrossRef] [PubMed]
Figure 1. Map showing study location (a), aerial photograph of the study site with a picture of individual stands (inset) (b). The blue circle is the OAK stand, the yellow circle is the MIX stand, and the red circle is the ERC stand. Aerial photo credit: Nicole Pauley and Bryan Murray. Stand photo credit: Patricia Torquato.
Forests 11 00901 g001
Figure 2. Daily precipitation (P) (a), soil water content (θ) from 0–10, 10–30, 30–60 cm (b), solar radiation (Rs) (c), temperature (T) (d), vapor pressure deficit (VPD) (e), relative humidity (RH) (f), and reference evapotranspiration (ETo) (g), from May 2017 to December 2018. The blue line is the locally weighted regression.
Forests 11 00901 g002
Figure 3. Seasonal averages of sap flow density (Sd) for eastern redcedar in the pure stand (ERCE), eastern redcedar in the mixed stand (ERCM), post oak in the mixed stand (OAKM), and post oak in the pure stand (OAKO). The Sd data for the spring of 2017 cover from 15 May to 31 May. The later growing season for oak covers from 1 September to 5 November for both years. An asterisk (*) indicates significant differences (p < 0.05) within a season when there was a season × stand interaction. The dashed half circle indicates the comparison among treatments referenced by the asterisk. Vertical bars denote standard errors.
Forests 11 00901 g003
Figure 4. Typical diurnal changes of Sd for the post oaks (OAK) and redcedars (ERC). Data are hourly values averaged over the growing season (from May to October) (a), during the moderate drought in 2018 (14–28 July) (b), and during the abnormal drought (dry conditions that could turn into drought or are recovering from drought but are not yet back to normal) in 2017 (1–24 September) (c).
Forests 11 00901 g004
Figure 5. Relationship between daily mean sap flow density (Sd) and daily mean VPD (kPa).
Forests 11 00901 g005
Figure 6. Calibrated daily water use for individual post oaks and redcedars from the OAK stand (a), MIX stand (b) and ERC stand (c). Lines are locally weighted regressions for OAKO, OAKM, ERCM, and ERCE, respectively.
Forests 11 00901 g006
Figure 7. The relationships between sapwood area and DBH (a), sap flow density (Sd) and DBH (b), water use and sapwood area (c), and water use and DBH (d) for post oak (circles) and redcedar (triangles). The linear regression equations (post oak dashed, redcedar solid) are shown when slopes are statistically significant. Asterisks denote level of significance with * at p < 0.05, ** at p < 0.001, and *** at p < 0.0001.
Forests 11 00901 g007
Figure 8. Cumulative daily water use of a redcedar stand (498 mm, ERC), post oak stand (557 mm, OAK), and redcedar and post oak mixed stand (635 mm, MIX).
Forests 11 00901 g008
Figure 9. Structural equation model illustrating the differentiated control of environmental factors on daily mean sap flow density (Sd) for post oak and redcedar. VPD: daily mean vapor pressure deficit, Rs: daily total solar radiation, T: daily mean temperature, RH: relative humidity, WS: daily average wind speed at 2 m height, SWS0–60 cm: total soil water storage in the upper 60 cm soil profile; θ0–10 cm, θ10–30 cm, and θ30–60 cm: daily mean soil volumetric water contents at depths of 5 cm, 25 cm, and 45 cm, respectively. The arrow shows a positive control, and the thickness of each shaft is approximately proportionate to the strength of the power. Numbers represent the correlation coefficient.
Forests 11 00901 g009
Table 1. Diameter at breast height (DBH), height, bark thickness, average sapwood width, and sapwood area (SA) of all trees instrumented with TDP. The sapwood area was calculated individually for each tree based on sapwood width. The sapwood width of each tree was estimated using one core for each oak tree (symmetric sapwood), and a different number of cores for each redcedar tree (somewhat asymmetric sapwood) depending on its size and shape.
Tree IDStandSpeciesDBH (cm)Height (m)Bark Thickness (cm)Sapwood Width (cm)SA (cm2)Age
1OAKPost oak31162.22.821594
2OAKPost oak22141.92.813785
3OAKPost oak12101.11.950102
4OAKPost oak1990.82.6123
5OAKPost oak1290.81.94896
6OAKPost oak21121.21.480112
7OAKPost oak1590.71.764115
8MIXPost oak1171.12.55198
9MIXRedcedar1790.53.013250
10MIXPost oak25121.14.325390
11MIXPost oak750.72.51956
12MIXRedcedar1480.41.96839
13MIXRedcedar850.31.12137
14MIXRedcedar1780.52.09247
15MIXPost oak1450.91.75685
16MIXRedcedar2280.51.37969
17MIXPost oak33132.03.2269120
18ERCRedcedar1870.71.88564
19ERCRedcedar33120.61.816861
20ERCRedcedar1080.22.15536
21ERCRedcedar980.21.33135
22ERCRedcedar1990.72.010036
23ERCRedcedar1580.71.97136
24ERCRedcedar890.21.93637
† Tree decayed at 3.1 cm depth. DBH: diameter at breast height.
Table 2. Sapwood area (SA) by species, SA of the trees with TPD, total SA, and SA per hectare of each stand.
StandSpeciesSA
(cm2)
SA Trees with TDP
(cm2)
Total SA
(cm2)
SA per ha
(m2 ha−1)
OAKOak †187871820667.87
Redcedar1880.00
MIXOak †127264820727.89
Redcedar800392
ERCOak †3920.0018517.05
Redcedar1459377
† Includes other deciduous trees.
Table 3. Daily average (± standard deviation; SD), maximum and minimum water use (L day−1) of all trees equipped with thermal dissipation probes (TDPs) during the study period. The minimum value reported was selected from the days when there was active transpiration.
Tree IDStandSpeciesAverage
(± SD, L day−1)
Maximum
(L day−1)
Minimum
(L day−1)
1OAKPost oak26.4 (±13.6)66.61.0
2OAKPost oak18.3 (±7.8)39.50.8
3OAKPost oak0.6 (±0.5)2.20.1
4OAKPost oak7.4 (±3.0)16.20.3
5OAKPost oak1.0 (±0.7)3.80.1
6OAKPost oak4.6 (±1.4)6.70.2
7OAKPost oak1.4 (±0.7)2.80.1
8MIXPost oak2.3 (±0.8)5.30.1
9MIXRedcedar29.8 (±20.3)96.11.8
10MIXPost oak37.4 (±13.8)73.13.8
11MIXPost oak1.8 (±0.6)2.80.1
12MIXRedcedar5.3 (±4.2)20.40.2
13MIXRedcedar4.4 (±2.9)14.10.1
14MIXRedcedar5.9 (±5.6)27.50.2
15MIXPost oak2.1 (±0.6)4.40.2
16MIXRedcedar2.2 (±1.4)7.20.2
17MIXPost oak56.5 (±19.1)99.31.8
18ERCRedcedar4.2 (±3.6)17.90.3
19ERCRedcedar14 (±11.0)49.11.5
20ERCRedcedar4.4 (±2.8)11.90.4
21ERCRedcedar6.9 (±4.9)29.90.6
22ERCRedcedar9.0 (±8.5)38.41.0
23ERCRedcedar3.6 (±2.8)13.90.2
24ERCRedcedar6.1 (±4.4)22.50.5

