Abstract
Along with progress in sequencing technology and accumulating knowledge of genome and gene sequences, molecular breeding techniques have been developed for predicting the genetic potential of individual genotypes and for selecting superior individuals. For Japanese cedar (Cryptomeria japonica (L.f.) D.Don), which is the most common coniferous species in Japanese forestry, we constructed a custom primer panel for target amplicon sequencing in order to simultaneously determine 3034 informative single nucleotide polymorphisms (SNPs). We performed primary evaluation of the custom primer panel with actual sequencing and in silico PCR. Genotyped SNPs had a distribution over almost the entire region of the C. japonica linkage map and verified the high reproducibility of genotype calls compared to SNPs obtained by genotyping arrays. Genotyping was performed for 576 individuals of the F1 population, and genomic prediction models were constructed for growth and wood property-related traits using the genotypes. Amplicon sequencing with the custom primer panel enables efficient obtaining genotype data in order to perform genomic prediction, manage clones, and advance forest tree breeding.
1. Introduction
Molecular breeding techniques for plants that predict phenotypes from individual genotypes have been developed to shorten the breeding period compared to conventional methods [1,2]. With advances using a large number of genome-wide DNA markers to predict genomic estimated breeding values [3], genomic selection (GS) has been performed in many plant species (reviewed by Lin et al. [4] and Desta and Ortiz [5]) since it has become possible to construct genomic and transcriptomic information with next-generation DNA sequencing (NGS) and to prepare genome-wide DNA markers with various genotyping techniques [6].
Forest trees are a plant group for which breeding can be accelerated by using molecular breeding techniques [7,8,9]. The timespan required for genetic improvement is generally longer in forest trees than in agricultural cultivars because forest trees require a longer period for evaluating their economically important traits and reaching reproductive maturity. For forest trees with large genomic sequences that are rich in repetitive segments, it is not easy to obtain the genomic information that is necessary for molecular breeding. In particular, conifers have large genome sizes [10,11] and low linkage disequilibrium (LD) due to being undomesticated [11,12,13,14], which hinders genome-wide studies. Both the identification of genome-wide DNA markers and using these markers in trials of genomic predictions are essential for implementing GS in conifers.
Despite these disadvantages, various genotyping platforms and genetic mapping methods have been developed and applied to conifers, as summarized by Ritland et al. [15]. For example, the most widespread electrophoresis-based methods, simple sequence repeat (SSR) markers, which are also called microsatellites, have been developed for many species such as pine (Pinus strobus L., [16]; P. sylvestris L., [17]; P. teada L., [18]; P. pinaster Aiton, [19]) and spruce Picea abies (L.) H. Karst., [20,21]). Kompetitive allele specific PCR (KASP) assays utilizing fluorescence detection, which is suitable for detecting a few to several hundred single nucleotide polymorphisms (SNPs) in large numbers of samples, have been developed for Abies alba Mill. [22]. These markers can be applied to genetic mapping, population genetics, or lineage management. In addition, for large numbers of SNPs identified through genomic and transcriptomic sequencing, microarray-based genotyping platforms have been developed, including GoldenGate (Illumina; e.g., for Japanese black pine, [23]), Infinium (Illumina; e.g., for white spruce, [24]), and Axiom (Applied Biosystems; e.g., for Douglas fir, [25]). The advantages of these microarray platforms are the larger number (3 to 1000 K) of loci and the cost per marker per assay, but the initial cost to design a custom array and the cost per sample are relatively high. Genotyping by sequencing (GBS), such as with restriction site-associated DNA sequencing (RAD-seq, reviewed by Parchman et al. [26]) or multiplexed inter-simple sequence repeat (ISSR) genotyping by sequencing (MIG-seq, [27]), is available to accomplish high-throughput SNP genotyping with NGS, although its limited marker density and linkage disequilibrium often compromise its utility [26], and genotype numbers among genotyping assays are not sufficiently reproducible to apply GS, which requires high marker density to cover the entire genome. It is necessary to select suitable genotyping methods that offer an appropriate yield of genotypes for the intended research purpose from various available analysis platforms.
Japanese cedar, Cryptomeria japonica (L.f.) D.Don, is the most common coniferous tree species in Japanese forestry, and various molecular information and markers have been prepared to evaluate its genetic diversity, to perform reliable lineage management, and to examine genetic demography in natural populations. Marker development in allozymes [28] and cleaved amplified polymorphic sequence (CAPS, [29]) drove early studies of population genetics in C. japonica. SSR markers have been developed [30,31,32,33] and used in various studies of genetic diversity [32], gene flow [34], and core collection [35]. The GoldenGate SNP genotyping platform (Illumina, San Diego, CA, USA) was used to detect over 1000 SNPs and conduct a genome-wide association study (GWAS) for wood properties and the quantity of male strobili [9]. Using even larger numbers of SNPs, Mishima et al. [36] constructed a comprehensive expressed sequence tag (EST) collection from multiple tissues and developed custom Axiom arrays that enabled the simultaneous genotyping of more than 70K SNPs. With Axiom arrays, they constructed a linkage map for the F1 population that was capable of detecting significant male sterility-related SNPs [36]. By applying the genotypes acquired by the Axiom arrays, Hiraoka et al. [37] performed GWAS and made genomic predictions for economically and socially important traits in unrelated first-generation C. japonica plus trees; many SNPs detected in the arrays were significantly correlated with economically and socially important traits. They also clarified that the accuracies of genomic predictions were dependent on the traits and populations reflecting the genetic architecture and on the background of the traits [37]. Although massive numbers of SNPs provide greater analytical capabilities, the authors noted the high cost of genotyping and suggested reducing the SNP number as an effective way of cutting genotyping cost [37]. In particular, analysis cost per individual is an important consideration when performing genotyping on large numbers of individuals. Prediction accuracies using SNPs selected based on the results of GWAS were similar to those using all SNPs for several combinations of traits and populations [37]. Pre-selection SNPs could be crucial for improving the quality of genomic predictions [38]. An efficient SNP genotyping system is required to verify the practicality of these SNPs and to apply them to actual breeding populations.
However, there are not many choices for medium-scale (up to several thousand loci) genotyping methods that can be redesigned flexibly and applied to GS in conifers. It is necessary to construct a platform for medium-scale high reproducibility genotyping to perform genomic prediction in C. japonica with high reliability. AmpliSeq (Thermo Fisher Scientific Inc., Waltham, MA, USA), which is an NGS-based genotyping method using multiplexed primer solutions for targeted amplicon sequencing, can enable amplification of up to 6000 amplicons simultaneously with ultra-high multiplex PCR and the construction of a targeted amplicon sequencing library in 10 h. This method has been used for studying inherited cancer in humans (e.g., [39]) and flowering time in soybean [40].
In this study, we constructed a medium-scale SNP genotyping system for C. japonica. We adopted an AmpliSeq custom primer panel (Thermo Fisher Scientific Inc.) as the platform and performed primary evaluation of the custom primer panel with actual sequencing and variant calling and with in silico PCR. We also examined the applicability of the custom primer panel for genomic prediction in a F1 population of C. japonica plus trees.
2. Materials and Methods
2.1. Primer Panel Design
Here, we selected 3034 target SNPs based on allelic effects of the SNPs on growth- (height and diameter at breast height, or DBH), wood property- (wood stiffness and wood density), and reproductive- (male fecundity) related traits as suggested by GWAS results [37] and their comprehensive distribution on the linkage map [36]. Primers for targeted amplicon sequencing on Ion Torrent platforms were designed with the online application program, AmpliSeq designer (https://www.ampliseq.com/login/login.action) with EST sequences containing target SNPs in C. japonica as reported by Mishima et al. [36] and bed files describing the position of target SNPs on contigs. A total of 3031 EST sequences and 3034 target SNPs (four SNPs were located in one sequence) were analyzed. A total of 3004 primer pairs for 99.0% of the target SNPs were designed in a multiplexed 2 × Ion AmpliSeq Primer Pool (Table S1). Primer pairs to amplify target sequences for the remaining 30 SNPs could not be designed.
2.2. Panel Evaluation Via Actual Genotyping
We used a total of 16 clones of C. japonica for primary evaluation of the custom primer panel; 11 of the 16 clones were genotyped with the Axiom custom genotyping array (Thermo Fisher Scientific Inc.) designed by Mishima et al. [36], and five clones had an unknown SNP genotype. Current year needles were collected and stored at −20 °C until DNA extraction. For DNA extraction, about 50 mg of frozen needles were transferred into 2.0 mL microtubes and ground with liquid nitrogen and beads in a Shake Master Auto Ver. 2.0 (Bio Medical Science, Tokyo, Japan). DNA was extracted from the pellet with a plant DNA extraction kit (Qiagen Inc., Hilden, Germany), and DNA was quantified with the Qubit 3.0 Fluorometer and the Qubit dsDNA BR Assay Kit (Thermo Fisher Scientific Inc.), according to the manufacturer’s instructions.
Libraries for amplicon sequencing were constructed with the AmpliSeq Library Kit v2.0 (Thermo Fisher Scientific Inc.) using the following protocol. For multiplex-PCR amplification, 5 ng DNA of each sample was amplified with the custom primer pool (3004 primer pairs) per reaction. Each reaction mix contained 2 µL of 5 × Ion AmpliSeq HiFi Master Mix, 5 µL of 2 × Ion AmpliSeq Primer Pool, and 5 ng of DNA, and it was brought to a volume of 10 µL with nuclease-free water. The reaction mix was heated for 2 min at 99 °C for enzyme activation, followed by 13 two-step cycles at 99 °C for 15 s and at 60 °C for 8 min, and ending with a holding period at 10 °C. Following the PCR, 1 µL of FuPa enzyme regents per sample was added to the reaction mix, the reaction mix was incubated at 50 °C for 10 min and at 55 °C for 10 min to digest the primers of the amplicons, and the mixture was incubated at 60 °C for 20 min to inactivate the enzyme. To enable library multiplexing on a single semiconductor chip, 2 µL of Switch Solution, 1 µL of diluted unique barcode adapter mix containing Ion Xpress Barcode and Ion P1 Adapters at standard volumes, and 1 µL of DNA ligase were added to the digested reaction mix, and the reaction mix was incubated at 22 °C for 30 min, followed by ligase inactivation for 5 min at 68 °C and 5 min at 72 °C. The adapter-ligated AmpliSeq library was purified using 22.5 µL of Agencourt AMPure XP Reagent (Beckman Coulter Inc., Brea, CA, USA), followed by washing with 75 µL of 70% ethanol twice. After the magnetic beads were dry, the AmpliSeq library was dissolved in 20 µL of Tris-EDTA (TE) buffer.
AmpliSeq libraries were evaluated for size distribution with a Bioanalyzer 2100 and High Sensitivity DNA Kit (Agilent Technologies Inc., Santa Clara, CA, USA), and the quantity was evaluated with a Qubit 3.0 Fluorometer and Qubit dsDNA HS Assay Kit (Thermo Fisher Scientific Inc.). The libraries identified by Ion Xpress Barcodes (Thermo Fisher Scientific Inc.) were multiplexed into a group of 16 samples for sequencing with an Ion Gene Studio S5 semiconductor sequencer and an Ion 520 semiconductor chip (Thermo Fisher Scientific Inc.). Emulsion PCR, emulsion breaking, and enrichment for the template preparation of ion sphere particles were performed with the Ion Chef and the Ion 520 and 530 Kit Chef (Thermo Fisher Scientific Inc.), according to the manufacturer’s instructions. Following preparation of the semiconductor tip, sequencing was performed with an Ion Gene Studio S5 semiconductor sequencer using the Ion 520 Chip (Thermo Fisher Scientific Inc.), according to the manufacturer’s instructions. The sequenced data were mapped to the reference gene sequence of C. japonica on a Torrent Server. Plugins, variantCaller v5.10.0.18 (Thermo Fisher Scientific Inc.) and reformatGBSCov v3.1 (Thermo Fisher Scientific Inc.) were used to construct a genotype table for the sequencing.
2.3. Data Processing and Visualization
Read depth per amplicon, read quality score, number of variants per site, GC ratio, and marker position within the genotyping with the AmpliSeq custom primer panel were summarized for each amplicon and drawn with the linkage position of the published C. japonica linkage map.
Genotyping efficiency for the primer panel was calculated for the 16 clones of C. japonica. Linkage positions of the SNPs on the published SNP linkage map [36] were drawn with R 3.6.0 [41]. The SNPs were distinguished by color on the linkage map at an 80% genotype call rate threshold. In addition, the SNP genotypes of the 11 of 16 clones were genotyped with the Axiom custom array (Axiom_Cj_70K_ver. 1.0; 73,274 SNPs; Gene Expression Omnibus Dataset (GEO): GSE95616; [36]) and compared with the genotyped results. The reproducibility of alleles was summarized and graphed on the R platform [41].
2.4. In Silico Panel Evaluation
The designed custom primer panel was tested with an in silico PCR program, Simulate_PCR version 1.2 ([42], https://sourceforge.net/projects/simulatepcr/) under a Perl 5.16.3 environment. The fasta files containing the 3031 EST sequences used to design the AmpliSeq custom primer panel, and the 34,731 EST sequences for the reference gene [36] of C. japonica were used for the input template reference file. The default settings and the options regarding included amplicon sizes were as follows: -minlen 50 and -maxlen 1000. The numbers of expected PCR products were summarized as follows: (a) amplified products in in silico PCR, (b) amplicon size ≤300 bp in in silico PCR, (c) correct pairing (intended pair of forward and reverse primers), (d) correct amplicon (annealing to correct contig with expected amplicon size), (e) off-target amplification (unintended primers annealing to the wrong contig), (f) unintended amplicon size (shorter or longer than expected amplicon), (g) mismatched pairing (unintended pair of forward and reverse primers), and (h) others (possible missing detection; amplicon size ≤300 bp and off target, unintended amplicon size, or mismatched pairing primers).
2.5. Genotyping a F1 Population
We used a total of 576 individuals of a F1 population, consisting of 547 individuals from eight half-diallelic F1 populations constructed with outcrossing between 32 plus trees originating from the Tokai breeding area (Table S2) and 29 individuals from open pollinated four maternal plus trees originating from the North-Kanto breeding area. The F1 population were planted in the Forest Tree Breeding Center (36°69′ N, 140°69′ E, 49.5 m above sea level), Hitachi, Ibaraki, Japan in 1995 with a plantation density of 3000 individuals per ha in a random block design with 6 replicates. At the timing of thinning in 2015, the materials for genotyping and phenotyping were collected. For genotyping, needles were placed in a plastic bag and stored at −20 °C until DNA extraction as described above. DNA concentration was measured with the QuantStudio 5 Real-Time PCR System and the Qubit dsDNA BR Assay Kit, according to the manufacturer instructions.
AmpliSeq libraries were constructed with an AmpliSeq Library Kit v2.0 (Thermo Fisher Scientific Inc.) as described above. Then, 22.5 µL of Agencourt AMPure XP Reagent (Beckman Coulter Inc.) was added with epMotion 96 (Eppendorf, Hamburg, Germany), and the magnetic beads were washed with 50 µL ethanol three times using HydroFlex (Tecan Group Ltd., Männedorf, Zürich, Switzerland) to purify the adapter-ligated AmpliSeq library. After the magnetic beads were dry, the AmpliSeq library was dissolved in 20 µL of TE buffer.
The purified AmpliSeq libraries were evaluated for size distribution with the Bioanalyzer 2100 and the High Sensitivity DNA Kit (Agilent Technologies Inc.) with quantification with the Qubit 3.0 fluorometer (Thermo Fisher Scientific Inc.). The libraries were distinguished by Ion Xpress Barcodes (Thermo Fisher Scientific Inc.), and 96 samples were multiplexed for sequencing with the Ion Gene Studio S5 semiconductor sequencer and a total of six Ion 540 semiconductor chips (Thermo Fisher Scientific Inc.). The sequenced data were mapped to the reference gene sequence of C. japonica on the Torrent Server. Plugins, variantCaller v5.10.0.18 and reformatGBSCov v3.1 were used to construct genotype tables for each run. All six sets of genotype data were collected in one genotype table.
2.6. Phenotypic Data
Phenotypic data of growth- and wood property-related traits were obtained by the following methods. Tree height, diameter at breast height (DBH), stress wave velocity (SWV), and pilodyn penetration depth (PP) were measured on trees that were 18 years old before harvesting. Tree height was measured with a Vertex III ultrasound instrument system (Haglöf, Västernorrland, Sweden), and DBH was measured at 1.3 m above ground with diameter calipers. The stress-wave propagation time of the stem was measured using a stress-wave timer (TreeSonic; Fakopp, Agfalva, Hungary). Briefly, the start sensor and the stop sensor were set on the stem from 0.7 to 1.7 m above the ground, and the stress-wave propagation time was measured five times from two directions at right angles to the direction of the slope, and SWV was determined by dividing the distance between the sensors by the mean value of the stress-wave propagation time. PP was measured using a Pilodyn 6J Forest (PROCEQ, Zurich, Switzerland) with a 2.5 mm diameter pin without removing the bark from the same directions used to obtain the stress-wave propagation time. After cutting the trees, logs from 1.0 to 2.5 m above the ground were collected for measuring the dynamic Young’s modulus (DMOE). DMOE was measured using a portable FFT analyzer AD-3527 (A&D, Tokyo, Japan), following the tapping methods described by Sobue et al. [43]. After measuring DMOE, discs (about 40 mm in thickness) and short logs (about 400 mm in length) were collected from the butt end of the logs used to measure DMOE.
Square specimens were prepared for determining basic density (BD) at every fifth annual ring from the pith. The BD calculated from oven-dried weight was divided by the green volume, which was measured by the water displacement method [44]. BD_1, BD_2, and BD_3 were defined as the BD of the segments containing the 1st to 5th annual rings, 6th to 10th annual rings, and 11th to 15th annual rings, respectively. BD was not measured outside the 16th annual ring. The average BD of the whole disc (BD_means) was estimated by the weighted average method using the area of segments BD_1, BD_2, and BD_3.
The heart wood color was measured using a color meter CR-300 (Minolta, Tokyo, Japan). Bark to bark radial boards (30 mm thickness) were prepared from the short logs. The surface was previously smoothed by a belt sander under air-dried conditions. Measurements were expressed in the L*a*b* color space. L* indicates lightness, a* indicates the red–green axis, and b* indicates the yellow–blue axis. The average values for five scattered points within each heartwood sample were used for analysis.
To determine the modulus of elasticity (MOE) and modulus of rupture (MOR), static bending tests were conducted according to the Japanese Industrial Standard (JIS) Z 2101-2009 [45] using bark-to-bark radial boards (30 mm thickness) prepared from the short logs. The boards were air-dried under laboratory conditions. A small clear specimen (20 (R) × 20 (T) × 320 (L) mm) was prepared from each board. All specimens were prepared at the same radial position: cross-section centered on the 4th annual ring from the pith. Static bending tests were conducted using a universal testing machine MSC-5/500-2 (Tokyo Testing Machine, Tokyo, Japan). Load was applied to the center of the radial surface of the specimen at 5 mm/min over a span of 280 mm. Data regarding load and deflection were recorded using a personal computer. After static bending tests, a small block was collected from each specimen for measuring the air-dried density and moisture content of the small clear specimen.
The microfibril angle of the S2 layer in latewood tracheid (MFA) was measured as the angle of the slit-like pit aperture of boarded pits in latewood tracheids [46,47,48]. Using a sliding microtome (ROM-710, Yamatokohki, Saitama, Japan) and small clear specimens after the static bending test, tangential sections of 20 μm in thickness containing latewood of the 4th annual ring from the pith were obtained. These sections were stained with 1% safranine and then dehydrated using graded ethanol. The dehydrated sections were dipped into xylene and mounted on slides with bioleit (Okenshoji, Tokyo, Japan). Photomicrographs of tangential sections were taken using a light microscope CX-41 (Olympus Corporation, Tokyo, Japan) equipped with a digital camera E-300 (Olympus Corporation, Tokyo, Japan). The angle of the slit-pit aperture in the bordered pits of latewood tracheids to longitudinal direction was measured as MFA using ImageJ (National Institute of Health, Bethesda, MD, USA). Thirty tracheids were measured in each tree.
For the phenotypic data of each individual, a spatial autocorrelation error was adjusted with the breedR package [49] of the R platform [41]. Coordinates of individuals in the plantation site and values for each trait were used to calculate the spatial autocorrelation error, and each error was subtracted from the raw value to calculate the adjusted value (Figure S1).
2.7. Genomic Prediction Within the F1 Population
We performed the genomic prediction for the F1 population and each trait using two methods: genomic best linear unbiased prediction (GBLUP) and Random Forest (RF). GBLUP and RF were performed using the “kin.BLUP” function of the rrBLUP package v 4.6.1 [50] and “randomForest” function of the randomForest package v 4.6-14 [51] of the R platform [41], respectively. For the methods of GBLUP and RF, raw trait and adjusted trait values with special autocorrelation errors were used independently to construct the genomic prediction model. Prediction accuracy was estimated using Pearson’s correlation coefficient between the phenotypic value and the genomic prediction value obtained from the validation dataset in the 10-fold cross-validation. The correlation coefficients from the 10-time replications in the 10-fold cross-validations were summarized.
3. Results
3.1. Primary Evaluation of the Multiplex Primer Panel
In the primary Ion S5 sequence run with an Ion 520 tip, a total of 1.32 Gb corresponding to 6.30 M reads was generated. The mean, median, and mode of the total sequence reads were 210, 228, and 235 bp, respectively, and 95.3% of obtained reads (6.00 out of 6.30 M reads) were successfully aligned to the reference sequence (Figure S2).
SNPs with a call rate of more than 80% were distributed over 11 linkage groups covering the entire previously constructed linkage map of C. japonica [36] (Figure 1). SNPs with a call rate of less than 80% were scattered over the linkage map (Figure 1), and there were some open areas where SNP markers were not originally designed because of the low degree of polymorphism among clones.
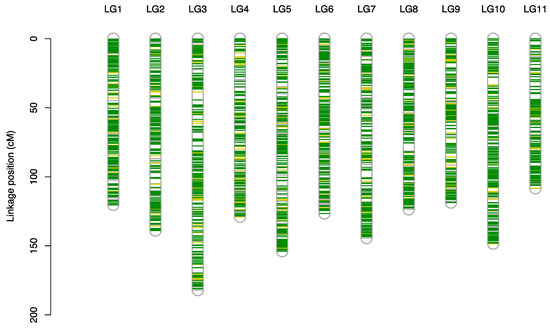
Figure 1.
Linkage map of single nucleotide polymorphisms (SNP) distribution on the 11 linkage groups for Cryptomeria japonica (L.f.) D.Don published by Mishima et al. [36]. SNPs that are 80% or more genotyped, less than 80% genotyped, and ungenotyped with the custom primer panel are shown in deep green, light green, and gray, respectively.
Read depth on the mapped loci and relative read quality for amplicon sequencing varied among the loci (Figure 2a). Alignment of amplicons to the reference sequence with variant calls shows that novel variants aside from the targeted SNPs were detected with more than one variant per amplicon (Figure 2c) and with 18 variants per locus in the upper part of linkage group (LG) 1, 20 at the lower part of LG5, and 19 at the intermediate part of LG9 (Figure 2c). GC ratios of the sequenced amplicons were not largely biased (Figure 2d). The GC ratio and read depth were not correlated in this analysis.
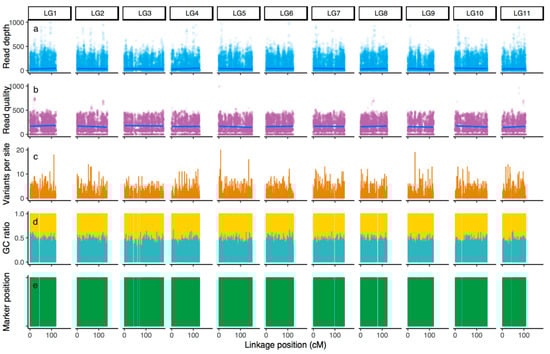
Figure 2.
Parameters determined through genotyping for primary evaluation with the custom primer panel: (a) read depth; (b) read quality score; (c) number of variants per site; (d) GC ratio; and (e) marker position. The linkage positions of the amplicons on the linkage map in C. japonica published by Mishima et al. [36] are shown.
The average number of called SNPs was 1990, corresponding to 68.5% of the SNP call rate through the genotyping for 16 clones of C. japonica. The obtained SNPs covered the linkage map (total of 1492.8 cm covering 11 linkage groups) of a previous study [36] with a mean distance between adjacent SNPs of 0.75 cm per SNP. For 11 clones, which were also previously genotyped with the Axiom arrays in a previous study [36] out of 16 clones, there were variations in the SNP call rate (Figure 3a) that are probably due to the low read depth (Table S3). The average SNP call rate of the 11 clones was 99.4% when genotyped with the Axiom arrays (Figure 3b). The comparison between the two genotyping platforms, i.e., Axiom and AmpliSeq, shows a genotype call rate of target SNPs with a custom primer panel for AmpliSeq that was less than that with Axiom (Figure 3c), although the average for the ratio consensus per genotyped SNP reached 94.9% (Figure 3d). Therefore, most of the called SNPs with the custom primer panel of AmpliSeq were consistent with results obtained with the custom genotyping array of Axiom, indicating the high reproducibility of these two genotyping systems.
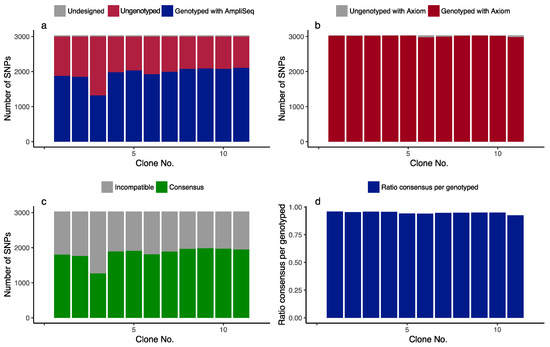
Figure 3.
Genotyping summary and comparison between the AmpliSeq custom primer panel and Axiom custom genotyping array: (a) number of the SNPs detected with AmpliSeq; (b) number of SNPs detected with Axiom; (c) number of SNPs in consensus in a comparison between AmpliSeq and Axiom; (d) ratio consensus per genotyped SNP by AmpliSeq. Of a total of 16 clones of C. japonica, 16 were genotyped with AmpliSeq and 11 were genotyped with Axiom.
Of the set of 3031 EST sequences that were used to design the custom primer panel and were used as the template reference for in silico panel evaluations, 3004 amplicons were synthesized by in silico PCR (Table 1), and all of the intended SNP genotyping was obtained. The total number of amplified products by in silico PCR was 3157, as some unintended additional amplicons were produced. Out of 3157 amplicons, 3052 amplicons were intended PCR products generated with the correct primer pairs, and 105 amplicons were unintended PCR products generated with wrong primer pairings (Table 1). Among the amplicons generated with correct primer pairings, six were off-target amplicons due to unintended primers annealing to the wrong contigs, and 42 were of unexpected size. The remaining 63 PCR products had an amplicon size ≤300 bp due to the wrong annealing position, presumably resulting in missing alleles in the process of genotyping (Table 1). In contrast, when all 34,731 EST sequences [36] were used as a template reference for in silico PCR, 2747 out of 3004 targeted amplicons were amplified with in silico PCR (Table 1). The total number of amplified products by in silico PCR was 3395, consisting of 3265 PCR products amplified by the intended primer pairs and 130 amplified by the wrong primer pairs (Table 1). Among the PCR products with correct primer pairing, 340 products were off target amplicons and 178 were of unintended amplicon size (Table 1). The remaining 504 PCR products had an amplicon size ≤300 bp (Table 1). When sequence data used for designing the custom primer panel were used for the template reference of the in silico PCR, all the targeted SNPs were genotyped, although some additional unintended amplification occurred. When different sequence data (in this case, 34,731 contigs) were applied to the template reference for in silico PCR, the proportion of the targeted amplification decreased to 2747 amplicons (80.9%), suggesting the redundancy of gene sequences in the C. japonica genome.

Table 1.
Summary of in silico PCR evaluations of the custom primer panel for Cryptomeria japonica (L.f.) D.Don.
3.2. Genotyping of the F1 Population
Ion S5 sequencing runs with the six Ion 540 tips generated a total of 62.2 Gb corresponding to 347.73 M reads. The mean, median, and mode of the total sequence reads were 178, 202, and 233 bp, respectively. Of these, 321.91 M reads (92.6%) were aligned to the reference sequence. Alignment accuracy of the reads to the reference sequence was high as well as the results of the primary evaluation of the custom primer panel.
Through genotyping 576 individuals of the F1 population, the average number of read counts per sample was 563,800 ± 242,311 (mean ± SD) and the average number of called SNPs was 1963 ± 153, giving an average SNP call rate of 64.7% (Figure 4a). The remaining SNPs (34.3%) were not genotyped. The relationship between the acquired read count per sample and the proportion of genotype call rate per sample was examined, and the proportion of the SNP call rate was saturated when the read count per sample reached more than 250,000 reads (Figure 4b), suggesting that a sufficient number of reads was obtained for most genotyping samples.
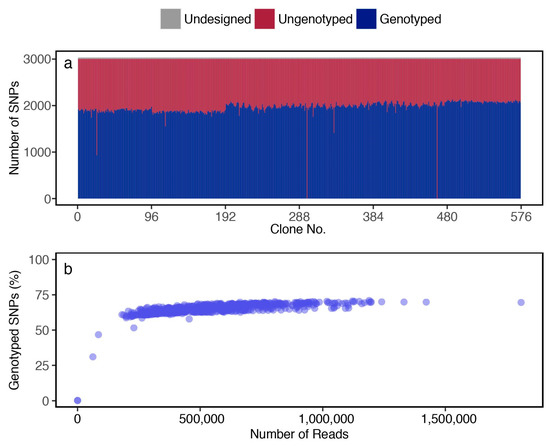
Figure 4.
For genotyping the F1 population, (a) number of SNPs detected by AmpliSeq; and (b) relationships between read count per sample and genotype call rate.
3.3. Construction of the Genomic Prediction Models with the F1 Population
The prediction accuracy ranged from 0.166 to 0.555 depending on the type of data applied to the prediction, examined traits, and the models used for the genomic prediction (Table 2). Prediction accuracy was improved for all traits when the data were adjusted with spatial autocorrelation (Table 2, Figure 5 and Figure S3). In the models constructed with GBLUP, the prediction accuracy ranged from 0.166 to 0.454 when using raw trait values, but it was 0.185 to 0.544 for the adjusted trait values (Figure S3). In models constructed with RF, the prediction accuracy ranged from 0.176 to 0.450 for the raw trait values and from 0.195 to 0.555 for the adjusted trait values (Table 2, Figure 5). The prediction accuracy for traits related to wood properties (e.g., PP) was higher than for growth-related traits (e.g., height) (Table 2, Figure 5). The prediction accuracy showed a greater range of variation for the growth-related traits (0.197–0.418 for height and 0.236–0.408 for DBH) than for those of wood properties (0.445–0.487 for SWV, 0.456–0.555 for PP, and 0.409–0.544 for BD_means). For many wood properties (SWV, PP, DMOE, BD_2, BD_3, and BD_means), the prediction accuracies were higher than 0.40 regardless of the applied models (Table 2), although prediction accuracies for heart wood color (L*, a*, and b*) were lower than 0.30 (Table 2). For DBH, DMOE, MOE, MOR, MFA, BD_1, BD_2, BD_3, and BD_means, the prediction accuracies were higher for the model with GBLUP than in the model with RF, but for tree height, L*, a*, b*, SWV, and PP, prediction accuracy was higher in the model with RF than in the model with GBLUP (Table 2).
Table 2.
Correlation coefficients for the genomic prediction models in the F1 population. BD: basic density, DBH: diameter at breast height, DMOE: dynamic Young’s modulus, GBLUP: genomic best linear unbiased prediction, MFA: microfibril angle, MOE: modulus of elasticity, MOR: modulus of rupture, PP: pilodyn penetration depth, SWV: stress wave velocity.
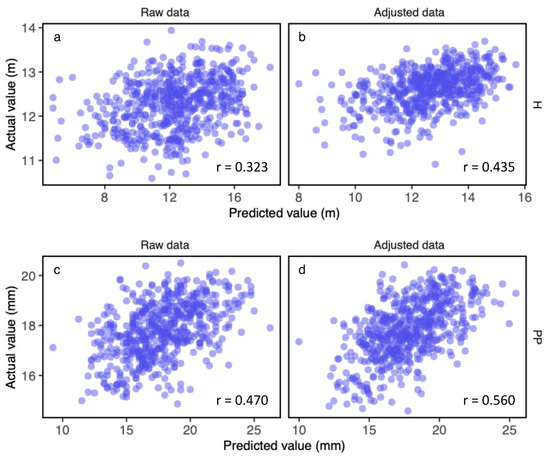
Figure 5.
Relationships between actual and predicted trait values for tree height (H) for (a) raw data and (b) adjusted data, and for pyridine penetration depth (PP) for (c) raw data and (d) adjusted data. Genomic predictions within the F1 population are shown. Predicted values were estimated by the genomic prediction model with data from random forest (RF). The relationships with the highest correlation efficient (r) were estimated by a round of 10-fold cross-validation, as shown for each trait without or with adjustment.
4. Discussion
In this study, we constructed and evaluated a multiplexed custom primer panel for amplicon sequencing in order to perform genomic prediction in C. japonica. We verified the high reproducibility of genotype calls by comparing results for two different methods: the custom genotyping array (Axiom) and the massive amplicon sequencing based genotyping (AmpliSeq). Genotyped SNPs by these two methods were in consensus for almost 2000 of the 3034 targeted SNPs (94.9%). Genotyped SNPs were distributed over the entire linkage map (1492.8 cm covering 11 LGs) of C. japonica without regional bias, as presented in a previous study [36] with a mean distance between adjacent SNPs of 0.75 cm per SNP. An unbiased distribution of the dense marker is essential for performing an accurate estimation of breeding value [3]. We also conducted genomic prediction with the F1 population using the genotypes acquired with the custom primer panel, and we therefore created the first platform for middle-scale genotyping with amplicon sequencing to archive genomic prediction in C. japonica.
A comparison with other genotyping platforms indicates the usefulness and availability of the custom primer panel for targeted amplicon sequencing. Amplicon sequencing with a custom primer panel is characterized by the high reproducibility of genotype calls and short processing time. In routine genotyping for breeding, NGS-based techniques need to meet several criteria, e.g., short processing time until interpretation of genotyping results for selection, limited requirements for DNA, sufficient read depth to accurately detect variants [40], and completeness of the genotype call. In lodgepole pine (Pinus contorta Douglas) and white spruce (Picea glauca (Moench) Voss), 17,765 and 17,845 SNPs were obtained for the pine and spruce, respectively, through GBS [52], and those were greater than the currently targeted SNP numbers by AmpliSeq. However, other crops have shown that genotyping with GBS shows a low completeness of SNPs called in those experiments, especially regarding low read depth [53]. Low completion rates of the total detected variants among samples leads to an increase in the number of genotypes that are treated as dominant markers rather than co-dominant markers. Stochastic molecular reactions at the condensation stage of genomic DNA at the step of constructing the sequencing library, such as cleavage by restriction enzymes in RAD-seq or binding less specific primers on short SSR sequences in PCR in MIG-seq, may produce different null alleles between experiments. These genotyping methods are suitable for mutation extraction, e.g., SNP discovery and/or experiments that do not assume repetition. In fact, Ueno et al. [54] detected hundreds of thousands of candidate SNPs in SNP discovery with RNA-Seq and RAD-Seq in C. japonica, although when analyzing the mapping population using them, they used the Fluidigm (South San Francisco, CA, USA) SNPType assay with 129 candidate SNPs and showed that 75 SNPs, representing 58.1%, were available as markers [54]. On the other hand, genotyping with AmpliSeq is suitable for breeding applications such as genomic selection with effective SNPs, owing to its high reproducibility among experiments.
In amplicon sequencing with the custom primer panels used in this study, around 34.3% of 3034 target SNPs were not detected (Figure 3a), even though primers for the target amplicon were designed and included in the custom primer panel. The relationship between acquired read count per sample and genotype call rate per sample shows a saturation curve (Figure 4), and it is suggested that a sufficient number of reads is obtained from most of the samples for genotyping. The most likely cause of why more than 30% of the target SNPs were not genotyped is that the amplicons were not synthesized as designed in the first PCR step of library construction. One of the following may prevent the successful synthesis of amplicons: (1) interception of the primers by other homologous gene loci, (2) synthesis of chimerical products, and (3) insertion of large introns in the genomic sequence. In the present study, we employed partial sequences of expressed genes [36] as a reference to design the custom primer panel. For the first scenario, duplicated gene loci, which were not included among the applied 3031 sequences, may interrupt binding to the specific loci of the designed amplicons. An in silico-based evaluation of the custom primer panel suggests the possibility that designed primers would anneal to off-targeted gene sequences (Table 1). For the second scenario, chimeric PCR products synthesized between different pairs of forward and reverse primers also consumed primers and seemed to have a low alignment ratio to the reference, although the primary evaluation of the custom primer panel showed a high alignment ratio against the reference (Figure S2). The third scenario is also likely to be an obstacle to sequencing and sequence alignments when designing a custom primer panel that does not target genome sequencing, because the expressed gene sequence after RNA splicing by spliceosomes does not include introns in the genomic sequence. However, the size distribution of the product lengths of the synthesized library was matched to the requirements of sequencing, and excess product length was not observed in the synthesized library. Therefore, the first scenario is the most likely cause to prevent the successful synthesis of amplicons. These considerations suggest that re-designing the custom primer panel would be necessary to improve the genotyping efficiency. Using redundant gene sequences or, if possible, genome sequences as a reference, it would be possible to construct a more accurate panel for genotyping in C. japonica.
In the F1 population of C. japonica, although results depend on traits and applied models, we confirmed that moderate accuracies (>0.5) were obtained for some wood properties in the genomic prediction modeling with the SNP genotypes (Table 2). Among the traits, genomic prediction accuracies for wood properties (e.g., SWV, PP, and basic densities) were higher than for growth traits (height and DBH). The ranges of prediction accuracies were more variable in growth traits (0.197–0.418 for height, and 0.236–0.408 for DBH) than in the wood property-related traits (0.445–0.487 for SWV, 0.456–0.555 for PP, and 0.409–0.544 for BD_means). Previous studies suggest that trait heritability is an important factor for the accuracy of genomic prediction [6]. The ranges of broad-sense heritability, which were previously reported for the associated traits in this study, were as follows: 0.37–0.72 for height [55,56], 0.21–0.52 for DBH [55,56,57], 0.65 for wood stiffness [57], and 0.78–0.88 for wood density [55,56]. In addition, higher prediction accuracies were observed for each trait when the trait values were adjusted by the spatial autocorrelation residuals that were employed for genomic predictions. This suggests that the F1 individuals at the plantation site are affected by local micro-environmental factors for both growth traits and wood properties; the growth traits were more sensitive to environmental heterogeneity than the wood property-related traits. Furthermore, this suggests that accurate individual phenotyping is important for accurate genomic prediction modeling.
In previous genomic prediction studies performed by Hiraoka et al. [37], prediction accuracy differed among populations and unrelated plus trees of C. japonica; the prediction accuracies in the Kyushu population were generally the highest, followed in order by those in North Kanto and South Kanto populations [37]. For example, prediction accuracies in DBH were 0.523, 0.299, and 0.033 in Kyushu, North Kanto, and South Kanto populations, respectively, when the prediction model was constructed based on all 32,036 SNPs [37]. In this study, the F1 population was mostly constructed by artificial crossings between the plus trees originating from the South Kanto population. Although the prediction model was constructed based on around 2000 SNPs, prediction accuracies in the F1 population were higher than the results of trait prediction modeling in unrelated plus trees in the South Kanto population. Genomic relationships arising from population structures could influence the prediction accuracy as well as linkage disequilibrium [58], and the genetic structure of the F1 population may show improved prediction accuracies compared to unrelated plus trees. Extended linkage disequilibrium in C. japonica [59] may have a positive effect on increased prediction accuracies. In addition, large numbers of individuals (n = 576) may positively affect prediction accuracies because the number of F1 individuals used in modeling was greater than that of the unrelated plus trees (n = 159 in the South Kanto population [37]). In a genomic prediction study in Pinus pinaster Aiton using 661 individuals and 2500 markers [14], the prediction accuracy for tree height and DBH was 0.47 and 0.43, respectively, which was comparable to the prediction accuracy in the present study. In Eucalyptus, the prediction accuracy for basic wood density was 0.67 in genomic prediction with 768 individuals and 24,806 SNPs [60]. Therefore, the population structure and the number of individuals may affect prediction accuracy. Assuming that the medium-scale genotyping is a prerequisite, it is necessary to increase the number of individuals in order to improve the prediction accuracies.
In this study, we performed genomic prediction for the F1 population, which was mostly constructed by artificial crossing between plus trees originating from the South Kanto population with AmpliSeq, a medium-scale genotyping platform. Genomic estimated breeding values generated by prediction models with moderate accuracies may be usable as a threshold for selecting individuals that have not been virtually phenotyped as candidate or superior trees. We consider that the GS procedure with the medium-scale genotyping applied in this study is more practical than a large-scale genotyping such as Axiom when adapted to a large number of individuals. In a simulation study of GS in C. japonica, Iwata et al. [8] showed that GS breeding with model updating based on a realistic number of markers (e.g., one in every 1 cm) outperformed phenotypic selection breeding over 60-year periods, even for a low-heritability polygenic trait. In the present study, we developed and used a comparable number of markers (0.75 cm intervals) as that assumed by Iwata et al. [8] for the genomic prediction. This indicates that the breeding scheme proposed by Iwata et al. [8] is one option for future genome-based breeding in this species. GS breeding with model updating particularly for traits with high heritability such as wood properties may obtain higher genetic gain than for a low-heritability polygenic trait. In-house genotyping using the custom primer panel allows for flexible model improvement.
Further trials of genomic prediction in progenies of other populations, e.g., North Kanto and Kyusyu populations, would make it possible to verify the effectiveness of these prediction models. In addition, an application of models constructed for first-generation plus trees would be required and useful for predictions in subsequent generations and further applications of GS in C. japonica breeding.
5. Conclusions
In this study, we constructed a custom primer panel for amplicon sequencing for C. japonica, and we evaluated the custom primer panel with actual sequencing and with in silico PCR. Although genotyping efficiency could be improved through redesign of the custom panel, based on the trials for the genotyping and the genomic prediction modeling in the F1 population, we demonstrated that the custom panel is useful for genomic prediction in C. japonica. In addition, we showed that prediction accuracy was improved when considering special autocorrelation errors arising from environmental heterogeneities. Since models are considered to be constructed for the first-generation plus trees and would also be useful for predictions in subsequent generations, further considerations are necessary for applying genomic prediction to C. japonica. Amplicon sequencing with the custom panel enables us to obtain genotype data efficiently in order to perform genomic prediction, to manage clones, and to advance forest tree breeding.
Supplementary Materials
The following are available online at https://www.mdpi.com/1999-4907/11/9/898/s1, Figure S1: Example of the effect of trait-value adjustment with special autocorrelation error for tree height, Figure S2: Alignment of amplicon sequences obtained by a primary evaluation of the custom primer panel for C. japonica, Figure S3: Relationships between actual and predicted trait value for tree height (H, a and b) and for pyridine penetration rate (PP, c and d) with best linear unbiased prediction (GBLUP), Table S1: List for the probe ID in the Axiom custom genotyping array, corresponding amplicon name, contig, SNP position, and primer sequence in the AmpliSeq custom panel, Table S2: Contents of half diallelic F1 populations, Table S3: Summary statistics in the primary evaluation for the custom primer panel.
Author Contributions
Conceptualization, Y.H. and T.H.; amplicon sequencing and SNP genotyping, S.N. and T.H.; in silico panel evaluation, S.N.; wood property analysis, T.I., Y.T., and F.I.; genomic prediction, Y.H., S.N., and M.M.; writing—original draft preparation, S.N. and Y.T.; writing—review and editing, M.T., K.M., T.H., and Y.H. All authors have read and agreed to the published version of the manuscript.
Funding
This work was supported in part by ‘Development of adaptation techniques to the climate change in the sectors of agriculture, forestry, and fisheries’ (Ministry of Agriculture, Forestry and Fisheries of Japan).
Acknowledgments
We are grateful to E. Fukatsu for introducing analysis software; K. Kato, T. Kaminaga, and M. Shibata for their assistance with laboratory experiment; N. Kuramoto for coordination of the research project; and other members of the Forest Tree Breeding Center for help with field investigations.
Conflicts of Interest
The authors declare no conflict of interest.
References
- Crossa, J.; Pérez-Rodríguez, P.; Cuevas, J.; Montesinos-López, O.; Jarquin, D.; Campos, G.; Burgueño, J.; Camacho-González, J.; Perez-Elizalde, S.; Beyene, Y.; et al. Genomic selection in plant breeding: Methods, models, and perspectives. Trends Plant Sci. 2017, 22, 961–997. [Google Scholar] [CrossRef]
- Lenaerts, B.; Collard, B.C.Y.; Demont, M. Review: Improving global food security through accelerated plant breeding. Plant Sci. 2019, 287, 110207. [Google Scholar] [CrossRef]
- Meuwissen, T.H.E.; Hayes, B.J.; Goddard, M.E. Prediction of total genetic value using genome-wide dense marker maps. Genetics 2001, 157, 1819–1829. [Google Scholar]
- Lin, Z.; Hayes, B.J.; Daetwyler, H.D. Genomic selection in crops, trees and forages: A review. Crop Pasture Sci. 2014, 65, 1177–1191. [Google Scholar] [CrossRef]
- Desta, Z.A.; Ortiz, R. Genomic Selection: Genome-wide prediction in plant improvement. Trends Plant Sci. 2014, 19, 592–601. [Google Scholar] [CrossRef]
- Davey, J.W.; Hohenlohe, P.A.; Etter, P.D.; Boone, J.Q.; Catchen, J.M.; Blaxter, M.L. Genome-wide genetic marker discovery and genotyping using next-generation sequencing. Nat. Rev. Genet. 2011, 12, 499–510. [Google Scholar] [CrossRef]
- Grattapaglia, D.; Resende, M.D.V. Genomic selection in forest tree breeding. Tree Genet. Genomes 2011, 7, 241–255. [Google Scholar] [CrossRef]
- Iwata, H.; Hayashi, T.; Tsumura, Y. Prospects for genomic selection in conifer breeding: A simulation study of Cryptomeria japonica. Tree Genet. Genomes 2011, 7, 747–758. [Google Scholar] [CrossRef]
- Uchiyama, K.; Iwata, H.; Moriguchi, Y.; Ujino-Ihara, T.; Ueno, S.; Taguchi, Y.; Tsubomura, M.; Mishima, K.; Iki, T.; Watanabe, A.; et al. Demonstration of genome-wide association studies for identifying markers for wood property and male strobili traits in Cryptomeria japonica. PLoS ONE 2013, 8, e79866. [Google Scholar] [CrossRef]
- Chagné, D.; Brown, G.; Lalanne, C.; Madur, D.; Pot, D.; Neale, D.; Plomion, C. Comparative genome and qtl mapping between maritime and loblolly pines. Mol. Breed. 2003, 12, 185–195. [Google Scholar] [CrossRef]
- Neale, D.B.; Wegrzyn, J.L.; Stevens, K.A.; Zimin, A.V.; Puiu, D.; Crepeau, M.W.; Cardeno, C.; Koriabine, M.; Holtz-Morris, A.E.; Liechty, J.D.; et al. Decoding the massive genome of loblolly pine using haploid DNA and novel assembly strategies. Genome Biol. 2014, 15, R59. [Google Scholar] [CrossRef]
- Neale, D.B.; Savolainen, O. Association genetics of complex traits in conifers. Trends Plant Sci. 2004, 9, 325–330. [Google Scholar] [CrossRef]
- Plomion, C.; Chancerel, E.; Endelman, J.; Lamy, J.-B.; Mandrou, E.; Lesur, I.; Ehrenmann, F.; Isik, F.; Bink, M.C.A.M.; van Heerwaarden, J.; et al. Genome-wide distribution of genetic diversity and linkage disequilibrium in a mass-selected population of maritime pine. BMC Genomics 2014, 15, 171. [Google Scholar] [CrossRef]
- Isik, F.; Bartholomé, J.; Farjat, A.; Chancerel, E.; Raffin, A.; Sanchez, L.; Plomion, C.; Bouffier, L. Genomic selection in maritime pine. Plant Sci. 2016, 242, 108–119. [Google Scholar] [CrossRef]
- Ritland, K.; Krutovsky, K.V.; Tsumura, Y.; Pelgas, B.; Isabel, N.; Bousquet, J. Genetic Mapping in Conifers. In Genetics, Genomics and Breeding of Conifers; Plomion, C., Bousquet, J., Eds.; CRC Press: Boca Raton, FL, USA, 2011; pp. 196–238. [Google Scholar]
- Echt, C.S.; May-Marquardt, P.; Hseih, M.; Zahorchak, R. Characterization of microsatellite markers in eastern white pine. Genome 1996, 39, 1102–1108. [Google Scholar] [CrossRef]
- Soranzo, N.; Provan, J.; Powell, W. Characterization of microsatellite loci in Pinus sylvestris L. Mol. Ecol. 1998, 7, 1260–1261. [Google Scholar]
- Elsik, C.G.; Minihan, V.T.; Hall, S.E.; Scarpa, A.M.; Williams, C.G. Low-copy microsatellite markers for Pinus Taeda L. Genome 2000, 43, 550–555. [Google Scholar] [CrossRef]
- Mariette, S.; Chagne, D.; Decroocq, S.; Giovanni Giuseppe, V.; Lalanne, C.; Madur, D.; Plomion, C. Microsatellite markers for Pinus Pinaster Ait. Ann. For. Sci. 2001, 58. [Google Scholar] [CrossRef]
- Paglia, G.P.; Olivieri, A.M.; Morgante, M. Towards second-generation STS (sequence-tagged sites) linkage maps in conifers: A genetic map of Norway spruce (Picea Abies K.). Mol. Gen. Genet. 1998, 258, 466–478. [Google Scholar] [CrossRef]
- Scotti, I.; Magni, F.; Paglia, G.; Morgante, M. Trinucleotide microsatellites in Norway spruce (Picea abies): Their features and the development of molecular markers. Theor. Appl. Genet. 2002, 106, 40–50. [Google Scholar] [CrossRef]
- Roschanski, A.M.; Csilléry, K.; Liepelt, S.; Oddou-Muratorio, S.; Ziegenhagen, B.; Huard, F.; Ullrich, K.; Postolache, D.; Giovanni Giuseppe, V.; Fady, B. Evidence of divergent selection for drought and cold tolerance at landscape and local scales in Abies alba Mill. in the French Mediterranean Alps. Mol. Ecol. 2016, 25, 776–794. [Google Scholar] [CrossRef]
- Hirao, T.; Matsunaga, K.; Hirakawa, H.; Shirasawa, K.; Isoda, K.; Mishima, K.; Tamura, M.; Watanabe, A. construction of genetic linkage map and identification of a novel major locus for resistance to pine wood nematode in Japanese black pine (Pinus thunbergii). BMC Plant Biol. 2019, 19. [Google Scholar] [CrossRef]
- Pavy, N.; Gagnon, F.; Rigault, P.; Blais, S.; Deschênes, A.; Boyle, B.; Pelgas, B.; Deslauriers, M.; Clément, S.; Lavigne, P.; et al. Development of high-density SNP genotyping arrays for white spruce (Picea glauca) and transferability to subtropical and Nordic congeners. Mol. Ecol. Res. 2013, 13, 324–336. [Google Scholar] [CrossRef]
- Howe, G.T.; Jayawickrama, K.; Kolpak, S.E.; Kling, J.; Trappe, M.; Hipkins, V.; Ye, T.; Guida, S.; Cronn, R.; Cushman, S.A.; et al. An Axiom SNP genotyping array for douglas-fir. BMC Genom. 2020, 21, 9. [Google Scholar] [CrossRef]
- Parchman, T.L.; Jahner, J.P.; Uckele, K.A.; Galland, L.M.; Eckert, A.J. RADseq Approaches and applications for forest tree genetics. Tree Genet. Genomes 2018, 14, 39. [Google Scholar] [CrossRef]
- Suyama, Y.; Matsuki, Y. MIG-seq: An effective PCR-Based method for genome-wide single-nucleotide polymorphism genotyping using the next-generation sequencing platform. Sci. Rep. 2015, 5, 16963. [Google Scholar] [CrossRef]
- Tsumura, Y.; Ohba, K. Allozyme variation of five natural populations of Cryptomeria japonica in western Japan. Jpn. J. Genet. 1992, 67, 299–308. [Google Scholar] [CrossRef][Green Version]
- Tsumura, Y.; Kado, T.; Takahashi, T.; Tani, N.; Ujino-Ihara, T.; Iwata, H. Genome scan to detect genetic structure and adaptive genes of natural populations of Cryptomeria japonica. Genetics 2007, 176, 2393. [Google Scholar] [CrossRef]
- Moriguchi, Y.; Iwata, H.; Ujino-Ihara, T.; Yoshimura, K.; Taira, H.; Tsumura, Y. Development and characterization of microsatellite markers for Cryptomeria japonica D. Don. Theor. Appl. Genet. 2003, 106, 751–758. [Google Scholar] [CrossRef]
- Tani, N.; Takahashi, T.; Ujino-Ihara, T.; Iwata, H.; Yoshimura, K.; Tsumura, Y. Development and characteristics of microsatellite markers for sugi (Cryptomeria japonica D. Don) derived from microsatellite-enriched libraries. Ann. For. Sci. 2004, 61, 569–575. [Google Scholar] [CrossRef]
- Takahashi, T.; Tani, N.; Taira, H.; Tsumura, Y. Microsatellite markers reveal high variation in natural populations of Cryptomeria japonica near refugial areas of the last glacial period. J. Plant Res. 2005, 118, 83–90. [Google Scholar] [CrossRef]
- Moriguchi, Y.; Ueno, S.; Higuchi, Y.; Miyajima, D.; Itoo, S.; Futamura, N.; Shinohara, K.; Tsumura, Y. Establishment of a microsatellite panel covering the sugi (Cryptomeria japonica) genome, and its application for localization of a male-sterile gene (ms-2). Mol. Breed. 2014, 33, 315–325. [Google Scholar] [CrossRef]
- Moriguchi, Y.; Tani, N.; Itoo, S.; Kanehira, F.; Tanaka, K.; Yomogida, H.; Taira, H.; Tsumura, Y. Gene flow and mating system in five Cryptomeria japonica D. Don seed orchards as revealed by analysis of microsatellite markers. Tree Genet. Genomes 2005, 1, 174–183. [Google Scholar] [CrossRef]
- Miyamoto, N.; Ono, M.; Watanabe, A. Construction of a core collection and evaluation of genetic resources for Cryptomeria japonica (Japanese cedar). J. For. Res. 2015, 20, 186–196. [Google Scholar] [CrossRef]
- Mishima, K.; Hirao, T.; Tsubomura, M.; Tamura, M.; Kurita, M.; Nose, M.; Hanaoka, S.; Takahashi, M.; Watanabe, A. Identification of novel putative causative genes and genetic marker for male sterility in Japanese cedar (Cryptomeria japonica D. Don). BMC Genom. 2018, 19, 277. [Google Scholar] [CrossRef]
- Hiraoka, Y.; Fukatsu, E.; Mishima, K.; Hirao, T.; Teshima, K.M.; Tamura, M.; Tsubomura, M.; Iki, T.; Kurita, M.; Takahashi, M.; et al. Potential of genome-wide studies in unrelated plus trees of a coniferous species, Cryptomeria japonica (Japanese cedar). Front. Plant Sci. 2018, 9. [Google Scholar] [CrossRef]
- Croiseau, P.; Legarra, A.; Guillaume, F.; Fritz, S.; Baur, A.; Colombani, C.; Robert-Granié, C.; Boichard, D.; Ducrocq, V. Fine tuning genomic evaluations in dairy cattle through SNP pre-selection with the elastic-net algorithm. Genet. Res. 2011, 93, 409–417. [Google Scholar] [CrossRef]
- Liu, S.; Wang, H.; Zhang, L.; Tang, C.; Jones, L.; Ye, H.; Ban, L.; Wang, A.; Liu, Z.; Lou, F.; et al. Rapid detection of genetic mutations in individual breast cancer patients by next-generation DNA sequencing. Hum. Genom. 2015, 9, 2. [Google Scholar] [CrossRef]
- Ogiso-Tanaka, E.; Shimizu, T.; Hajika, M.; Kaga, A.; Ishimoto, M. Highly multiplexed AmpliSeq technology identifies novel variation of flowering time-related genes in soybean (Glycine Max). DNA Res. 2019, 26, 243–260. [Google Scholar] [CrossRef]
- R Core Team. A Language and Environment for Statistical Computing; R Foundation for Statistical Computing: Vienna, Austria; Available online: https://www.R-project.org/2019 (accessed on 24 May 2019).
- Gardner, S.N.; Slezak, T. Simulate_PCR for Amplicon prediction and annotation from multiplex, degenerate primers and probes. BMC Bioinform. 2014, 15, 2–7. [Google Scholar] [CrossRef]
- Sobue, N. Measurement of Young’s modulus by transient longitudinal vibration of wooden beams using a fast fourier transformation spectrum analyzer. Mokuzai Gakkaishi 1986, 32, 744–747, (In Japanese with English Summary). [Google Scholar]
- Panshin, A.J.; de Zeeuw, C. Text Book of Wood Technology; McGraw-Hill Book, Co.: New York, NY, USA, 1980. [Google Scholar]
- Japanese Industrial Standards. Methods of Testing for Woods JIS Z 2101-2009; Japanese Standards Association: Tokyo, Japan, 2009. [Google Scholar]
- Cookrell, R.A. A Comparison of latewood pits, fibril orientation, and shrinkage of normal and compression wood of giant sequoia. Wood Sci. Technol. 1974, 8, 197–206. [Google Scholar] [CrossRef]
- Donaldson, L.A. The Use of pit apertures as windows to measure microfibril angle in chemical pulp fibers. Wood Fiber Sci. 1991, 23, 290–295. [Google Scholar]
- Hirakawa, Y.; Fujisawa, Y. The Relationships between microfibril angles of the S2 layer and latewood tracheid lengths in elite sugi tree (Cryptomeria japonica) Clones. Mokuzai Gakkaishi 1995, 41, 123–131, (In Japanese with English Summary). [Google Scholar]
- Muñoz, F.; Sanchez, L. breedR: Statistical Methods for Forest Genetic Resources Analysis. Available online: https://github.com/famuvie/breedR/2018 (accessed on 1 November 2018).
- Endelman, J. Ridge regression and other kernels for genomic selection with R package rrBLUP. Plant Genome 2011, 4, 250–255. [Google Scholar] [CrossRef]
- Liaw, A.; Wiener, M. Classification and regression by randomForest. R News 2002, 2, 18–22. [Google Scholar]
- Chen, C.; Mitchell, S.E.; Elshire, R.J.; Buckler, E.S.; El-Kassaby, Y.A. Mining conifer’s mega-genome using rapid and efficient multiplexed high-throughput genotyping-by-sequencing (GBS) SNP discovery platform. Tree Genet. Genomes 2013, 9, 1537–1544. [Google Scholar] [CrossRef]
- Huang, Y.; Poland, J.; Wight, C.; Jackson, E.; Tinker, N. Using genotyping-by-sequencing (GBS) for genomic discovery in cultivated oat. PLoS ONE 2014, 9. [Google Scholar] [CrossRef]
- Ueno, S.; Uchiyama, K.; Moriguchi, Y.; Ujino-Ihare, T.; Matsumoto, A.; Wei, F.; Saito, M.; Higuchi, Y.; Futamura, N.; Kanamori, H.; et al. Scanning RNA-Seq and RAD-Seq approach to develop SNP markers closely linked to MALE STERILITY 1 (MS1) in Cryptomeria japonica D. Don. Breed. Sci. 2019, 69, 19–29. [Google Scholar] [CrossRef]
- Tamura, A.; Kurinobu, S.; Fukatsu, E.; Iizuka, K. An investigation on the allocation of selection weight on growth and wood basic density to maximize carbon storage in the stem of sugi (Cryptomeria japonica D. Don) plus-tree clones. J. Jpn. For. Soc. 2006, 88, 15–20. [Google Scholar] [CrossRef][Green Version]
- Fukatsu, E.; Tamura, A.; Takahashi, M.; Fukuda, Y.; Nakada, R.; Kubota, M.; Kurinobu, S. Efficiency of the indirect selection and the evaluation of the genotype by environment interaction using pilodyn for the genetic improvement of wood density in Cryptomeria japonica. J. For. Res. 2011, 16, 128–135. [Google Scholar] [CrossRef]
- Fujisawa, Y.; Ohta, S.; Nishimura, K.; Toda, T.; Tajima, M. Wood characteristics and genetic variations in sugi (Cryptomeria japonica). 3. Estimation of variance-components of the variation in dynamic modulus of elasticity with plus-tree clones. Mokuzai Gakkaishi 1994, 40, 457–464. [Google Scholar]
- Daetwyler, H.; Kemper, K.; van der Werf, J.; Hayes, B. Components of the accuracy of genomic prediction in a multi-breed sheep population. J. Anim. Sci. 2012, 90, 3375–3384. [Google Scholar] [CrossRef]
- Moritsuka, E.; Hisataka, Y.; Tamura, M.; Uchiyama, K.; Watanabe, A.; Tsumura, Y.; Tachida, H. Extended linkage disequilibrium in noncoding regions in a conifer, Cryptomeria japonica. Genetics 2012, 190, 1145–1148. [Google Scholar] [CrossRef]
- Resende, R.; Resende, M.; Silva, F.; Azevedo, C.; Takahashi, E.; Silva, O.; Grattapaglia, D. Assessing the expected response to genomic selection of individuals and families in Eucalyptus breeding with an additive-dominant model. Heredity 2017, 119, 245–255. [Google Scholar] [CrossRef]
© 2020 by the authors. Licensee MDPI, Basel, Switzerland. This article is an open access article distributed under the terms and conditions of the Creative Commons Attribution (CC BY) license (http://creativecommons.org/licenses/by/4.0/).