Estimating Carbon Efficiency of Bioenergy Systems in the Mississippi Alluvial Valley


Abstract
:1. Introduction
2. Materials and Methods
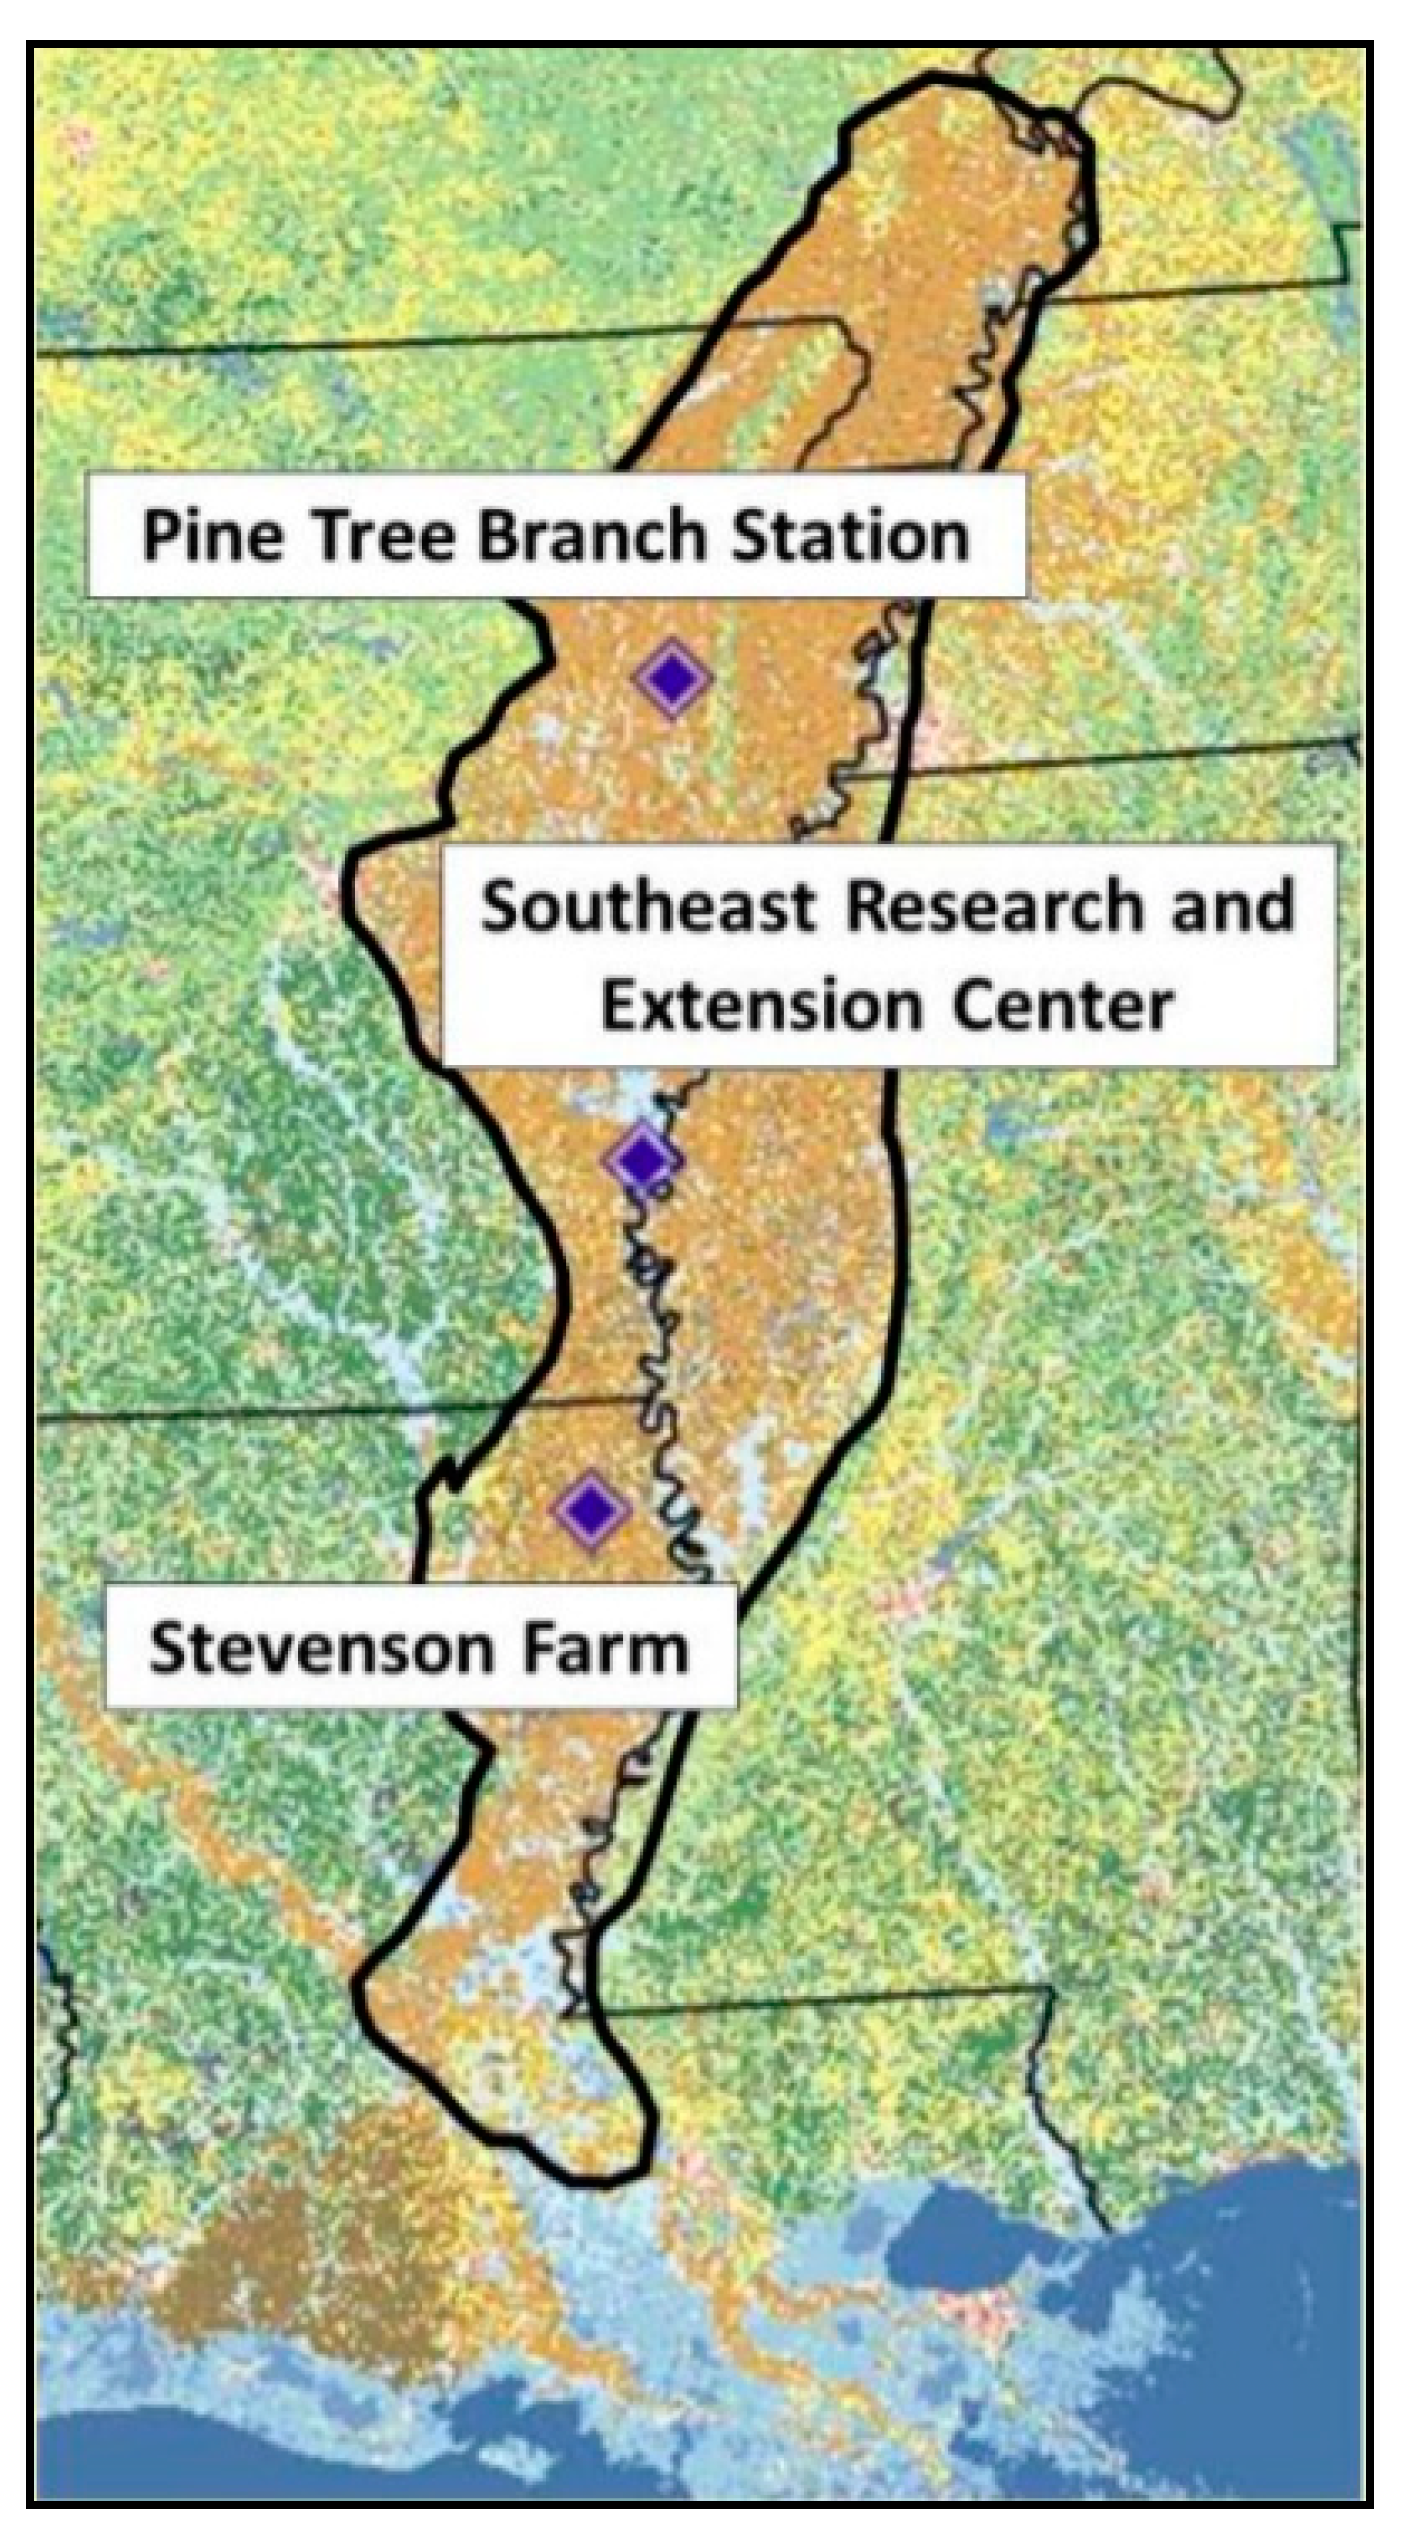
2.1. Study Area
- The University of Arkansas Division of Agriculture Pine Tree Branch Station (PTBS) near Colt, Arkansas.
- The University of Arkansas Division of Agriculture Southeast Research and Extension Center (SREC) in Rohwer, Arkansas.
- The Stevenson Farm (SF) near Archibald, Louisiana (Figure 1).
2.2. Goal Definition and Scoping
2.3. Inventory Analysis
2.3.1. Prior Site Operations
Seeds/Cuttings Production
Fertilizer and Herbicide Production
Transportation of Site Prep Materials
2.3.2. On Site Operations
2.3.3. Post-Harvest Operations
Carbon Estimation in Biomass
2.4. Carbon Efficiency Ratio
2.5. Statistical Analysis
2.6. Sensitivity Analysis
2.6.1. Scenario 1; Better Switchgrass Production
2.6.2. Scenario 2; Carbon Emission from the Combustion of Harvested Biomass
2.6.3. Scenario 3; Risk Analysis
3. Results
3.1. Carbon Emission
3.2. Carbon Sequestration
3.3. Carbon Efficiency Ratio
3.4. Wilcoxon Signed Rank Test for Emissions
3.5. Sensitivity Analysis
3.5.1. Scenario 1; Better Switchgrass Production
3.5.2. Scenario 2; Carbon Emission from the Combustion of Harvested Biomass
3.5.3. Scenario 3; Risk Analysis
4. Conclusions
Supplementary Materials
Author Contributions
Funding
Acknowledgments
Conflicts of Interest
Abbreviations
| C | carbon |
| CE | carbon equivalent |
| CO2e | carbon dioxide equivalent |
| GHG | greenhouse gases |
| GWP | global warming potential |
| ha | hectare |
| kg | kilogram |
| km | kilometer |
| l | liter |
| LCA | life cycle assessment |
| NOX | nitrogen oxides |
| t | tonne or metric ton |
References
- Bies, L. The Biofuels Explosion: Is Green Energy Good for Wildlife? Wildl. Soc. Bull. 2006, 34, 1203–1205. [Google Scholar] [CrossRef]
- Norgate, T.; Haque, N.; Somerville, M.; Jahanshahi, S. Biomass as a Source of Renewable Carbon for Iron and Steelmaking. ISIJ Int. 2012, 52, 1472–1481. [Google Scholar] [CrossRef] [Green Version]
- Environmental Impact Assessment. Electric Power Annual; Eia. Doe. Gov.: Washington, DC, USA, 2018.
- Perlack, R.D.; Wright, L.L.; Turhollow, A.F.; Graham, R.L.; Stokes, B.J.; Erbach, D.C. Biomass as Feedstock for a Bioenergy and Bioproducts Industry: The Technical Feasibility of a Billion-Ton Annual Supply; Oak Ridge National Laboratory: Oak Ridge, TN, USA, 2005. [Google Scholar]
- Environmental Impact Assessment. In August 2019 Monthly Energy Review, Monthly Energy Review; U.S. Department of Energy: Washington, DC, USA, 2019.
- Gan, J.; Smith, C.T. Co-benefits of utilizing logging residues for bioenergy production: The case for East Texas, USA. Biomass Bioenergy 2007, 31, 623–630. [Google Scholar] [CrossRef]
- Westover, R.H. Wood to Energy–Removing Woody Biomass from National Forests Helps Local Economies [WWW Document]; USDA Forest Service: Washington, DC, USA, 2017. [Google Scholar]
- Tenenbaum, D.J. Food vs. fuel diversion of crops could cause more hunger. Environ. Health Perspect. 2008, 116, 254–257. [Google Scholar] [CrossRef] [PubMed] [Green Version]
- Mehmood, S.R.; Zhang, D. Causes for Continuation of State Cost-Share Program for Nonindustrial Private Forest Landowners. For. Sci. 2002, 48, 471–478. [Google Scholar] [CrossRef]
- Joshi, O.; Mehmood, S.R. Factors affecting nonindustrial private forest landowners’ willingness to supply woody biomass for bioenergy. Biomass Bioenergy 2011, 35, 186–192. [Google Scholar] [CrossRef]
- Sandin, G.; Peters, G.M.; Svanström, M. Life Cycle Assessment of Forest Products: Challeneges and Solutions; Springer International Publishing: Cham, Switzerland, 2016. [Google Scholar]
- Huang, C.H.; Bagdon, B.A. Quantifying environmental and health benefits of using woody biomass for electricity generation in the Southwestern United States. J. Econ. 2018, 32, 123–134. [Google Scholar] [CrossRef]
- McKendry, P. Energy production from biomass (part 1): Overview of biomass. Bioresour. Technol. 2002, 83, 37–46. [Google Scholar] [CrossRef]
- Griffiths, N.A.; Rau, B.M.; Vaché, K.B.; Starr, G.; Bitew, M.M.; Aubrey, D.P.; Martin, J.A.; Benton, E.; Jackson, C.R. Environmental effects of short-rotation woody crops for bioenergy: What is and isn’t known. GCB Bioenergy 2018, 11, 554–572. [Google Scholar] [CrossRef] [Green Version]
- Loeffler, D.; Anderson, N. Emissions tradeoffs associated with cofiring forest biomass with coal: A case study in Colorado, USA. Appl. Energy 2014, 113, 67–77. [Google Scholar] [CrossRef]
- IPCC. Summary for Policymakers. In Global Warming of 1.5 °C. An IPCC Special Report on the Impacts of Global Warming of 1.5 °C above Pre-Industrial Levels and Related Global Greenhouse Gas Emission Pathways, in the Context of Strengthening the Global Response to the Threat of Climate Change; Masson-Delmotte, V., Zhai, P., Pörtner, H.-O., Roberts, D., Skea, J., Shukla, P.R., Pirani, A., Moufouma-Okia, W., Péan, C., Pidcock, R., et al., Eds.; IPCC: Geneva, Switzerland, 2018; p. 32. [Google Scholar]
- Hoegh-Guldberg, O.; Jacob, D.; Taylor, M.; Bindi, M.; Brown, S.; Camilloni, I.; Diedhiou, A.; Djalante, R.; Ebi, K.L.; Engelbrecht, F.; et al. Impacts of 1.5 °C Global Warming on Natural and Human Systems. In Global Warming of 1.5 °C. An IPCC Special Report on the Impacts of Global Warming of 1.5 °C above Pre-Industrial Levels and Related Global Greenhouse Gas Emission Pathways, in the Context of Strengthening the Global Response to the Threat of Climate Change; Masson-Delmotte, V., Zhai, P., Pörtner, H.-O., Roberts, D., Skea, J., Shukla, P.R., Pirani, A., Moufouma-Okia, W., Péan, C., Pidcock, R., et al., Eds.; IPCC: Geneva, Switzerland, 2018. [Google Scholar]
- Smith, P.; Bustamante, M.; Ahammad, H.; Clark, H.; Dong, H.; Elsiddig, E.A.; Haberl, H.; Harper, R.; House, J.; Jafari, M.; et al. Agriculture, Forestry and Other Land Use (AFOLU). In Climate Change 2014: Mitigation of Climate Change. Contribution of Working Group III to the Fifth Assessment Report of the Intergovernmental Panel on Climate Change; Edenhofer, O., Pichs-Madruga, R., Sokona, Y., Farahani, E., Kadner, S., Seyboth, K., Adler, A., Baum, I., Brunner, S., Eickemeier, P., et al., Eds.; Cambridge University Press: Cambrdige, UK; New York, NY, USA, 2014. [Google Scholar]
- Lemprière, T.C.; Kurz, W.A.; Hogg, E.H.; Schmoll, C.; Rampley, G.J.; Yemshanov, D.; McKenney, D.W.; Gilsenan, R.; Beatch, A.; Blain, D.; et al. Canadian boreal forests and climate change mitigation. Environ. Rev. 2013, 21, 293–321. [Google Scholar] [CrossRef]
- Tharakan, P.J.; Volk, T.A.; Lindsey, C.A.; Abrahamson, L.P.; White, E.H. Evaluating the impact of three incentive programs on the economics of cofiring willow biomass with coal in New York State. Energy Policy 2005, 33, 337–347. [Google Scholar] [CrossRef]
- White, E.M. Woody Biomass for Bioenergy and Biofuels in the United States-A Briefing Paper; USDA Forest Service: Washington, DC, USA, 2010. [Google Scholar] [CrossRef] [Green Version]
- US EPA. Life Cycle Assessment: Principle and Practice; U.S. Environmental Protection Agency (USEPA): Reston, VA, USA, 2006.
- Lenzen, M. Errors in Conventional and Input-Output—Based Life—Cycle Inventories. J. Ind. Ecol. 2000, 4, 127–148. [Google Scholar] [CrossRef]
- Brandão, M.; Levasseur, A.; Kirschbaum, M.U.F.; Weidema, B.P.; Cowie, A.L.; Jørgensen, S.V.; Hauschild, M.Z.; Pennington, D.W.; Chomkhamsri, K. Key issues and options in accounting for carbon sequestration and temporary storage in life cycle assessment and carbon footprinting. Int. J. Life Cycle Assess. 2013, 18, 230–240. [Google Scholar] [CrossRef]
- IPCC. IPCC third assessment report: Climate change 2001. In The Scientific Basis; Cambridge University Press: Cambridge, UK, 2001. [Google Scholar]
- S Sheehan, J.; Camobreco, V.; Duffield, J.; Graboski, M.; Shapouri, H. Life Cycle Inventory of Biodiesel and Petroleum Diesel for Use in an Urban Bus; National Renewable Energy Lab: Golden, CO, USA, 1998. [Google Scholar]
- Perez-Garcia, J.; Lippke, B.; Comnick, J.; Manriquez, C. An assessment of carbon pools, storage, and wood products market substitution using life-cycle analysis results. Wood Fiber Sci. 2005, 37, 140–148. [Google Scholar]
- Adler, P.R.; Grosso, S.J.; Del Parton, W.J. Life-cycle assessment of net greenhouse-gas flux for bioenergy cropping systems. Ecol. Appl. 2007, 17, 675–691. [Google Scholar] [CrossRef] [PubMed]
- Heller, M.C.; Keoleian, G.A.; Volk, T.A. Life cycle assessment of a willow bioenergy cropping system. Biomass Bioenergy 2003, 25, 147–165. [Google Scholar] [CrossRef]
- Liebig, M.A.; Schmer, M.R.; Vogel, K.P.; Mitchell, R.B. Soil Carbon Storage by Switchgrass Grown for Bioenergy. BioEnergy Res. 2008, 1, 215–222. [Google Scholar] [CrossRef] [Green Version]
- Zan, C.S.; Fyles, J.W.; Girouard, P.; Samson, R.A. Carbon sequestration in perennial bioenergy, annual corn and uncultivated systems in southern Quebec. Agric. Ecosyst. Environ. 2001, 86, 135–144. [Google Scholar] [CrossRef]
- Montagnini, F.; Nair, P.K.R. Carbon sequestration: An underexploited environmental benefit of agroforestry systems. Agrofor. Syst. 2004, 61–62, 281–295. [Google Scholar] [CrossRef]
- Tripp, S.; Powell, S.R.; Nelson, P. Regional Strategy for Biobased Products in the Mississippi Delta, Executive Summary; Battelle: Columbus, OH, USA, 2009. [Google Scholar]
- Berry, L.; Mitchell, K. Logistics Assessment of the Delta Region, Agbioworks; Battelle: Knoxville, TN, USA, 2009. [Google Scholar]
- Liechty, H.O.; Blazier, M.; Pelkki, M.; White, D.; Robinson, Z.; The Potential for Using Agroforests for Bioenergy Production in the Lower Mississippi Alluvial Valley. IUFRO Proc 2012. Available online: https://cdn.sare.org/wp-content/uploads/20171204125749/964759iufro-proceedings-liechty-et-al-2012.pdf (accessed on 18 January 2020).
- Parrish, D.J.; Fike, J.H. The biology and agronomy of switchgrass for biofuels. CRC Crit. Rev. Plant Sci. 2005, 24, 423–459. [Google Scholar] [CrossRef]
- Stanturf, J.A.; van Oosten, C.; Netzer, D.A.; Coleman, M.D.; Portwood, C.J. Ecology and silviculture of poplar plantations. In Poplar Culture in North America, Part A; Isebrands, J.G., Eckenwalder, J.E., Richardson, J., Eds.; NRC Research Press: Ottawa, ON, Canada, 2002; pp. 153–206. [Google Scholar]
- NRCS. Web Soil Survey: Natural Resources Conservation Science [WWW Document]. Available online: https://websoilsurvey.nrcs.usda.gov/app/WebSoilSurvey.aspx (accessed on 18 January 2020).
- Robinson, Z. Small Mammal Occurrence and Utilization of a Cottonwood/Switchgrass Agroforest System in the Lower Mississippi Alluvial Valley; University of Arkansas at Monticello: Monticello, AR, USA, 2012. [Google Scholar]
- Helton, M.; Brye, K.R.; Liechty, H.; Blazier, M.; West, C.; Gbur, E.; Savin, M.; Mason, E. Carbon dioxide emissions from switchgrass and cottonwood grown as bioenergy crops in the Lower Mississippi River Alluvial Valley. Biomass Bioenergy 2015, 83, 383–392. [Google Scholar] [CrossRef]
- West, T.O.; Marland, G. A synthesis of carbon sequestration, carbon emissions, and net carbon flux in agriculture: Comparing tillage practices in the United States. Agric. Ecosyst. Environ. 2002, 91, 217–232. [Google Scholar] [CrossRef]
- Grisso, R.D.; Kocher, M.F.; Vaughan, D.H. Predicting tractor fuel consumption. Appl. Eng. Agric. 2004, 20, 553–561. [Google Scholar] [CrossRef]
- EPA. Emission Factors for Greenhouse Gas Inventories 2018:5. Available online: https://www.epa.gov/sites/production/files/2018-03/documents/emission-factors_mar_2018_0.pdf (accessed on 16 September 2019).
- Lal, R. Carbon emission from farm operations. Environ. Int. 2004, 30, 981–990. [Google Scholar] [CrossRef] [PubMed]
- Breeze, P. Biomass-Based Power Generation. In Power Generation Technologies; Elsevier: Amsterdam, The Netherlands, 2019; pp. 351–374. [Google Scholar] [CrossRef]
- Lindsay, K.R.; Popp, M.P.; West, C.P.; Ashworth, A.J.; Rocateli, A.C.; Farris, R.; Kakani, V.G.; Fritschi, F.B.; Green, V.S.; Alison, M.W.; et al. Predicted harvest time effects on switchgrass moisture content, nutrient concentration, yield, and profitability. Biomass Bioenergy 2018, 108, 74–89. [Google Scholar] [CrossRef]
- Deshpande, S.D.; Bal, S.; Ojha, T.P. Physical Properties of Soybean. J. Agric. Eng. Res. 1993, 56, 89–98. [Google Scholar] [CrossRef]
- Haque, N.; Somerville, M. Techno-economic and environmental evaluation of biomass dryer. Procedia Eng. 2013, 56, 650–655. [Google Scholar] [CrossRef] [Green Version]
- Van der Stelt, M.J.C.; Gerhauser, H.; Kiel, J.H.A.; Ptasinski, K.J. Biomass upgrading by torrefaction for the production of biofuels: A review. Biomass Bioenergy 2011, 35, 3748–3762. [Google Scholar] [CrossRef]
- B Berggren, M.; Ljunggren, E.; Johnsson, F. Biomass co-firing potentials for electricity generation in Poland-Matching supply and co-firing opportunities. Biomass Bioenergy 2008, 32, 865–879. [Google Scholar] [CrossRef]
- Wenzl, H. The Chemical Technology of Wood, 1st ed.; Elsevier: Amsterdam, The Netherlands, 1970. [Google Scholar] [CrossRef]
- Pelkki, M.; Liechty, H.; Blazier, M.; White, D., Jr.; West, C. Building a better biomass ecosystem: Cottonwood-switchgrass agroforests on marginal land. In Proceedings of the 2012 National Conference Science Biomass Feedstock Production and Utilization, New Orleans, LA, USA, 2–5 October 2012; p. 12. [Google Scholar]
- Liska, A.J.; Yang, H.S.; Bremer, V.R.; Klopfenstein, T.J.; Walters, D.T.; Erickson, G.E.; Cassman, K.G. Improvements in Life Cycle Energy Efficiency and Greenhouse Gas Emissions of Corn-Ethanol. J. Ind. Ecol. 2009, 13, 58–74. [Google Scholar] [CrossRef]
- Follett, R.F.; Vogel, K.P.; Varvel, G.E.; Mitchell, R.B.; Kimble, J. Soil Carbon Sequestration by Switchgrass and No-Till Maize Grown for Bioenergy. BioEnergy Res. 2012, 5, 866–875. [Google Scholar] [CrossRef] [Green Version]
- Hill, J. Environmental costs and benefits of transportation biofuel production from food-and lignocellulose-based energy crops. A review. Agron. Sustain. Dev. 2007, 27, 1–12. [Google Scholar] [CrossRef] [Green Version]


| Cottonwood | Switchgrass | Soybean/Sorghum | |
|---|---|---|---|
| dry kg ha−1 | |||
| PTBS | 4126 | 18,503 | 4719 |
| SREC | 7516 | 0 | 5949 |
| SF | 5922 | 10,181 | 770 |
| Average | 5855 | 9561 | 3813 |
| Activities | Cottonwood | Switchgrass | Soybean/Grain Sorghum |
|---|---|---|---|
| kg C ha−1 (%) | |||
| Seeds/Cuttings | 45.8 (8.8%) | 14.4 (2.8%) | 43 (2.5%) |
| Production of fertilizers | 45.9 (8.8%) | 71.2 (13.9%) | 660.4 (38.1%) |
| Production of herbicides | 73.3 (14.1%) | 27.4 (5.3%) | 198.1 (11.4%) |
| Transportation of site preparation materials | 6.3 (1.2%) | 14.7 (2.9%) | 37.8 (2.2%) |
| Site preparation | 58.4 (11.2%) | 62.9 (12.3%) | 274.4 (15.8%) |
| Planting | 75.6 (14.6%) | 118.1 (23.0%) | 122.7 (7.1%) |
| Fertilization | 26.1 (5.0%) | 22.3 (4.4%) | 89.4 (5.2%) |
| Herbicide application | 64.2 12.4%) | 29.4 (5.7%) | 161.8 (9.3%) |
| Harvesting | 41.4 (8.0%) | 60.5 (11.8%) | 108.8 (6.3%) |
| Transportation of harvested biomass | 70.3 (13.5%) | 71.7 (14.0%) | 28.6 (1.7%) |
| Drying | 12.12 (2.33%) | 19.79 (3.9%) | 7.89 (0.5%) |
| Total | 519.5 (100%) | 512.4 (100%) | 1732.9 (100%) |
| Live Roots | Dead Roots | Surface Biomass | Total | ||
|---|---|---|---|---|---|
| Study Site | kg/hectare | ||||
| Cottonwood | PTBS | 1768.39 | 1528.92 | 4562.91 | 7860.22 |
| SREC | 2575.22 | 1471.81 | 5000.94 | 9047.97 | |
| SF | 1177.08 | 659.46 | 10,737.02 | 12,573.56 | |
| AVERAGE | 1840.23 | 1220.07 | 6766.95 | 9827.25 | |
| Switchgrass | PTBS | 5063.85 | 1866.02 | 0.00 | 6929.87 |
| SREC | 0.00 | 0.00 | 0.00 | 0.00 | |
| SF | 3323.10 | 3079.94 | 0.00 | 6403.04 | |
| AVERAGE | 2795.65 | 1648.65 | 0.00 | 4444.30 | |
| Soybean/Sorghum | PTBS | 132.63 | 4163.08 | 1802.58 | 6098.29 |
| SREC | 208.15 | 2591.79 | 2646.50 | 5446.45 | |
| SF | 819.72 | 2466.53 | 1347.93 | 4634.18 | |
| AVERAGE | 386.83 | 3073.80 | 1932.34 | 5392.98 | |
| Live Roots | Dead Roots | Surface Biomass | Total | ||
|---|---|---|---|---|---|
| Study Site | kg/hectare | ||||
| Cottonwood | PTBS | 744.60 | 546.26 | 1424.83 | 2715.70 |
| SREC | 1052.15 | 513.32 | 1359.13 | 2924.60 | |
| SF | 452.80 | 209.50 | 3362.15 | 4024.44 | |
| AVERAGE | 749.85 | 423.02 | 2048.71 | 3221.58 | |
| Switchgrass | PTBS | 2060.66 | 618.59 | 0.00 | 2679.25 |
| SREC | 0.00 | 0.00 | 0.00 | 0.00 | |
| SF | 1323.44 | 1069.89 | 0.00 | 2393.33 | |
| AVERAGE | 1128.03 | 562.83 | 0.00 | 1690.86 | |
| Soybean/Sorghum | PTBS | 50.53 | 1335.20 | 810.69 | 2196.43 |
| SREC | 73.65 | 855.55 | 1160.22 | 2089.42 | |
| SF | 320.56 | 879.70 | 619.71 | 1819.97 | |
| AVERAGE | 148.25 | 1023.49 | 863.54 | 2035.27 | |
| Site | Treatment | Carbon Sequestered on Site S (kg ha−1) | Amount of Harvested Carbon H (kg ha−1) | Carbon Emitted during Production E (kg ha−1) | Net Ratio of Carbon Balance S/E | Gross Ratio of Carbon Balance (S + H)/E |
|---|---|---|---|---|---|---|
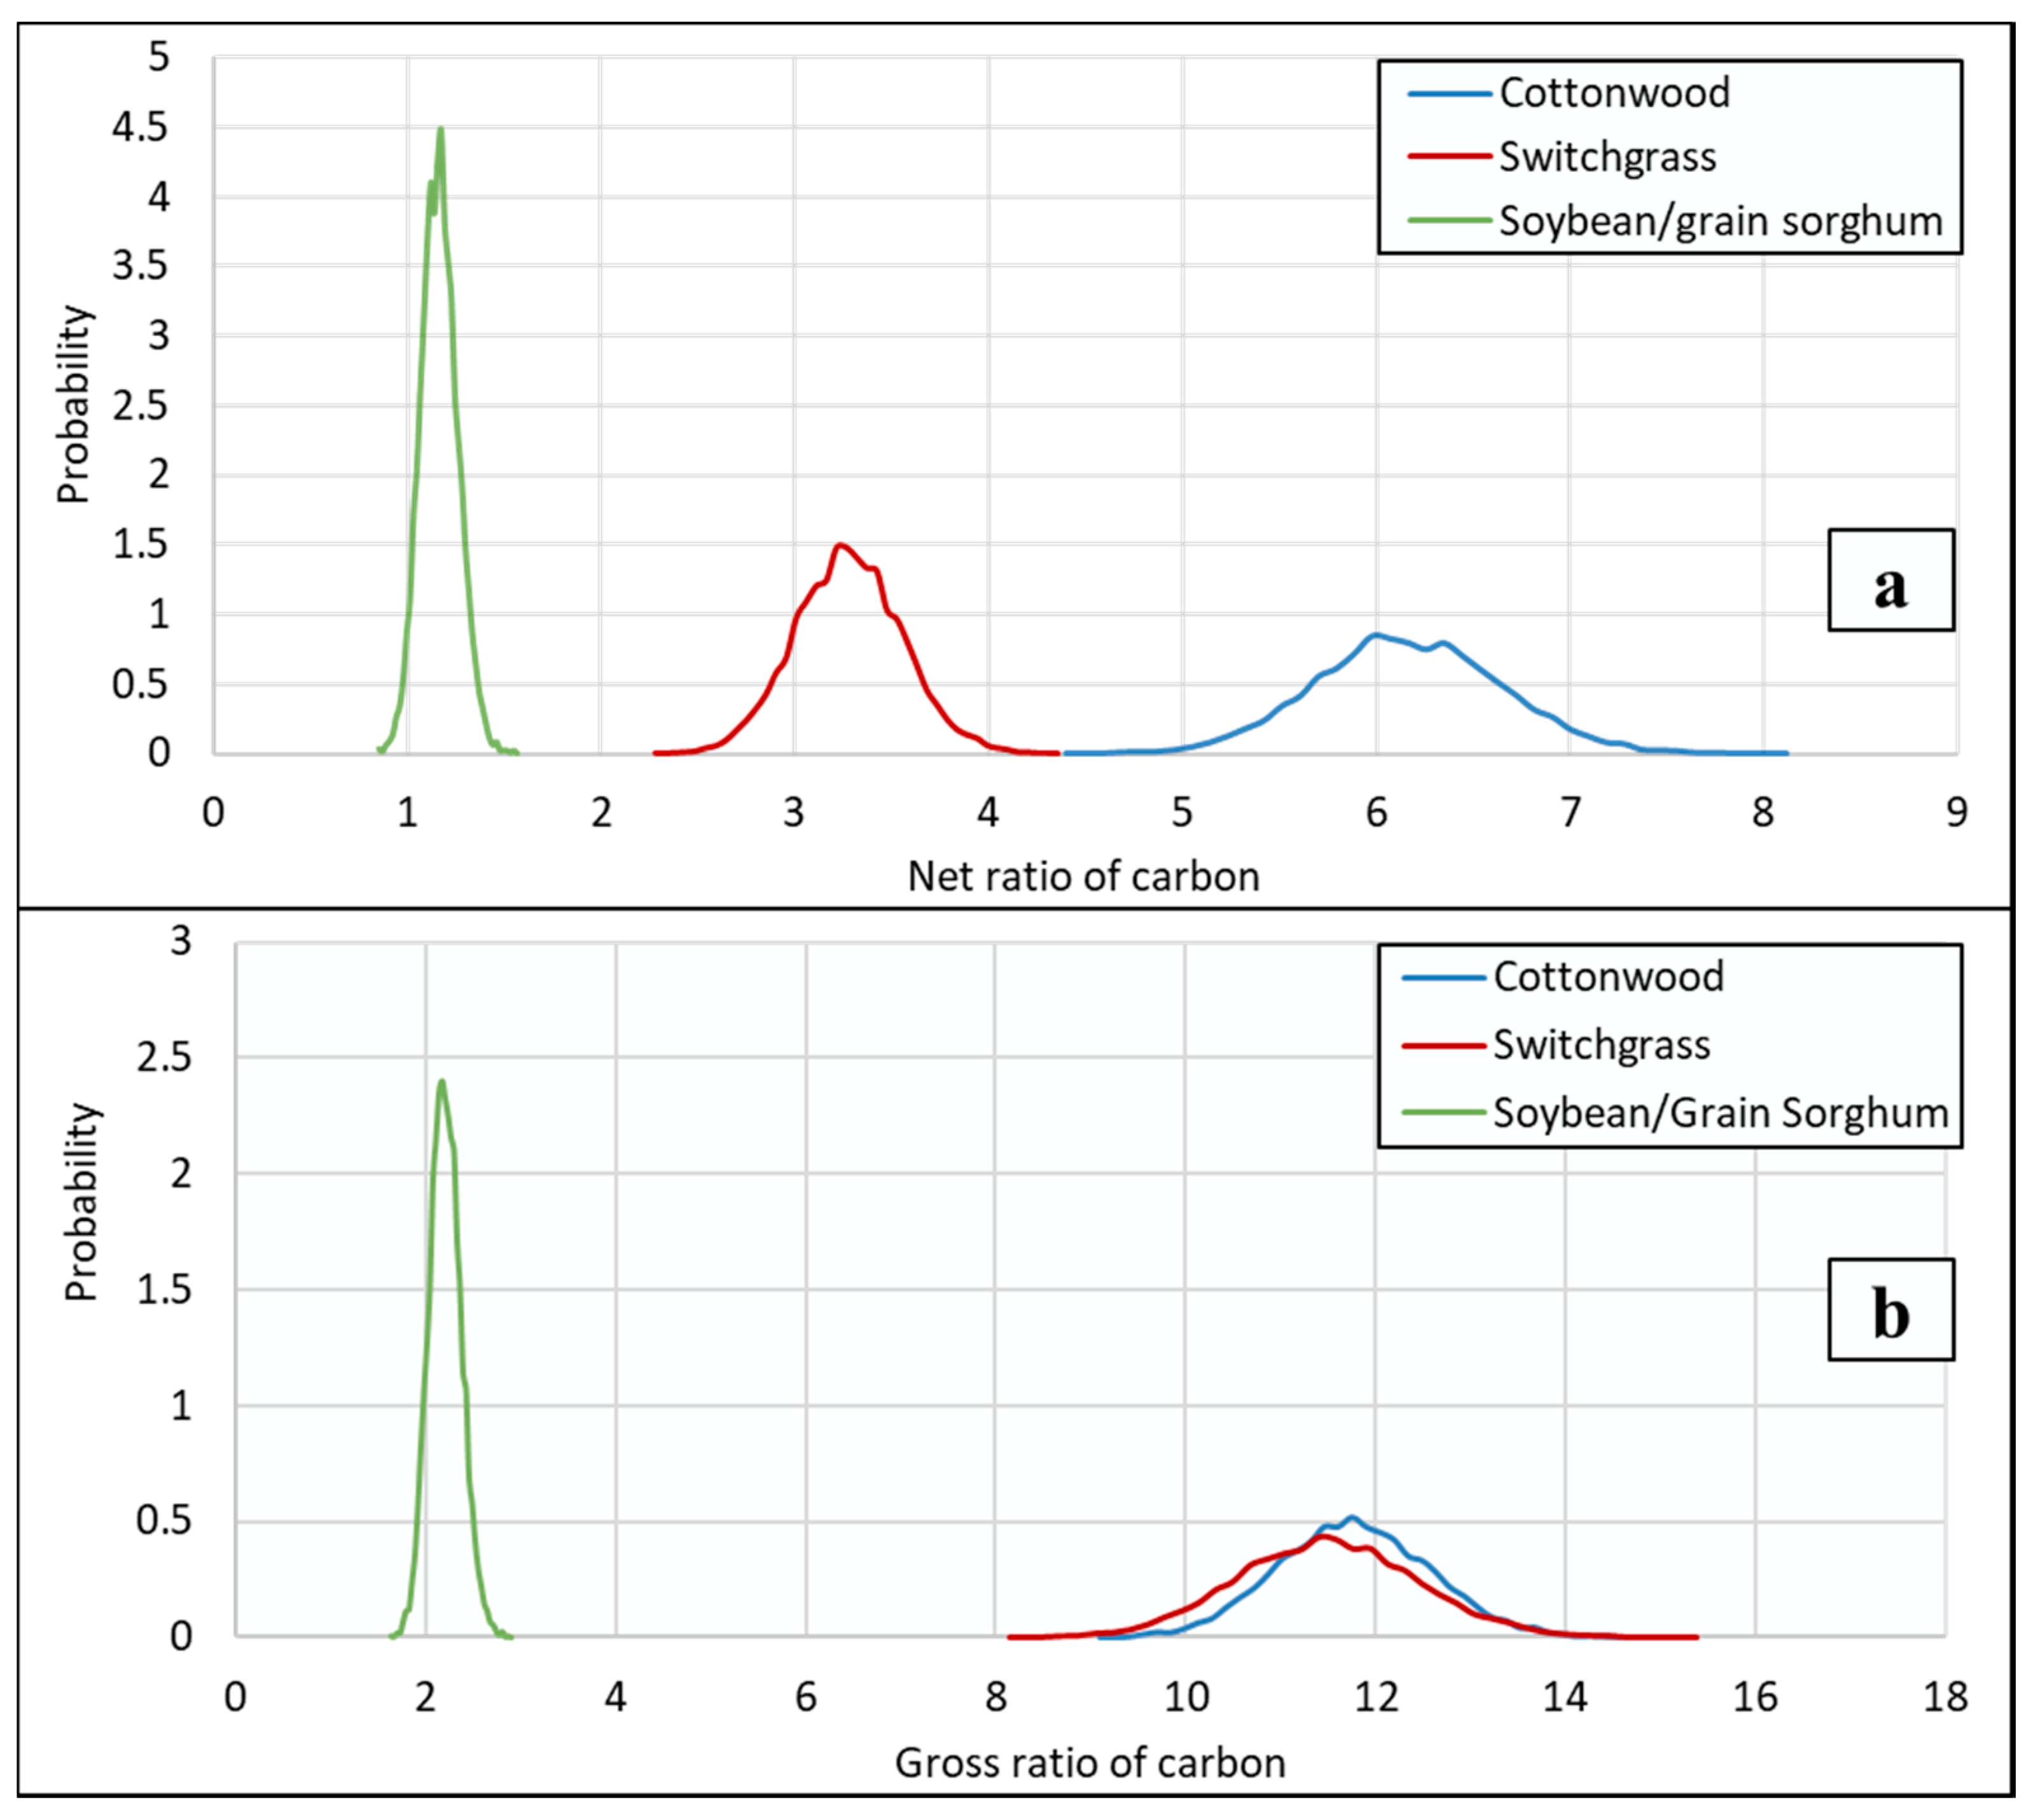
| PTBS | Cottonwood | 2716 | 2063 | 541 | 5.02 | 8.83 |
| Switchgrass | 2679 | 8207 | 563 | 4.76 | 19.33 | |
| Soybean/Grain Sorghum | 2196 | 2278 | 1260 | 1.74 | 3.55 | |
| SREC | Cottonwood | 2925 | 3758 | 484 | 6.04 | 13.80 |
| Switchgrass | 0 | 0 | 576 | 0.00 | 0.00 | |
| Soybean/Grain Sorghum | 2089 | 2771 | 2456 | 0.85 | 1.98 | |
| SF | Cottonwood | 4024 | 2961 | 533 | 7.55 | 13.11 |
| Switchgrass | 2393 | 4492 | 527 | 4.54 | 13.07 | |
| Soybean/Grain Sorghum | 1820 | 365 | 1535 | 1.19 | 1.42 | |
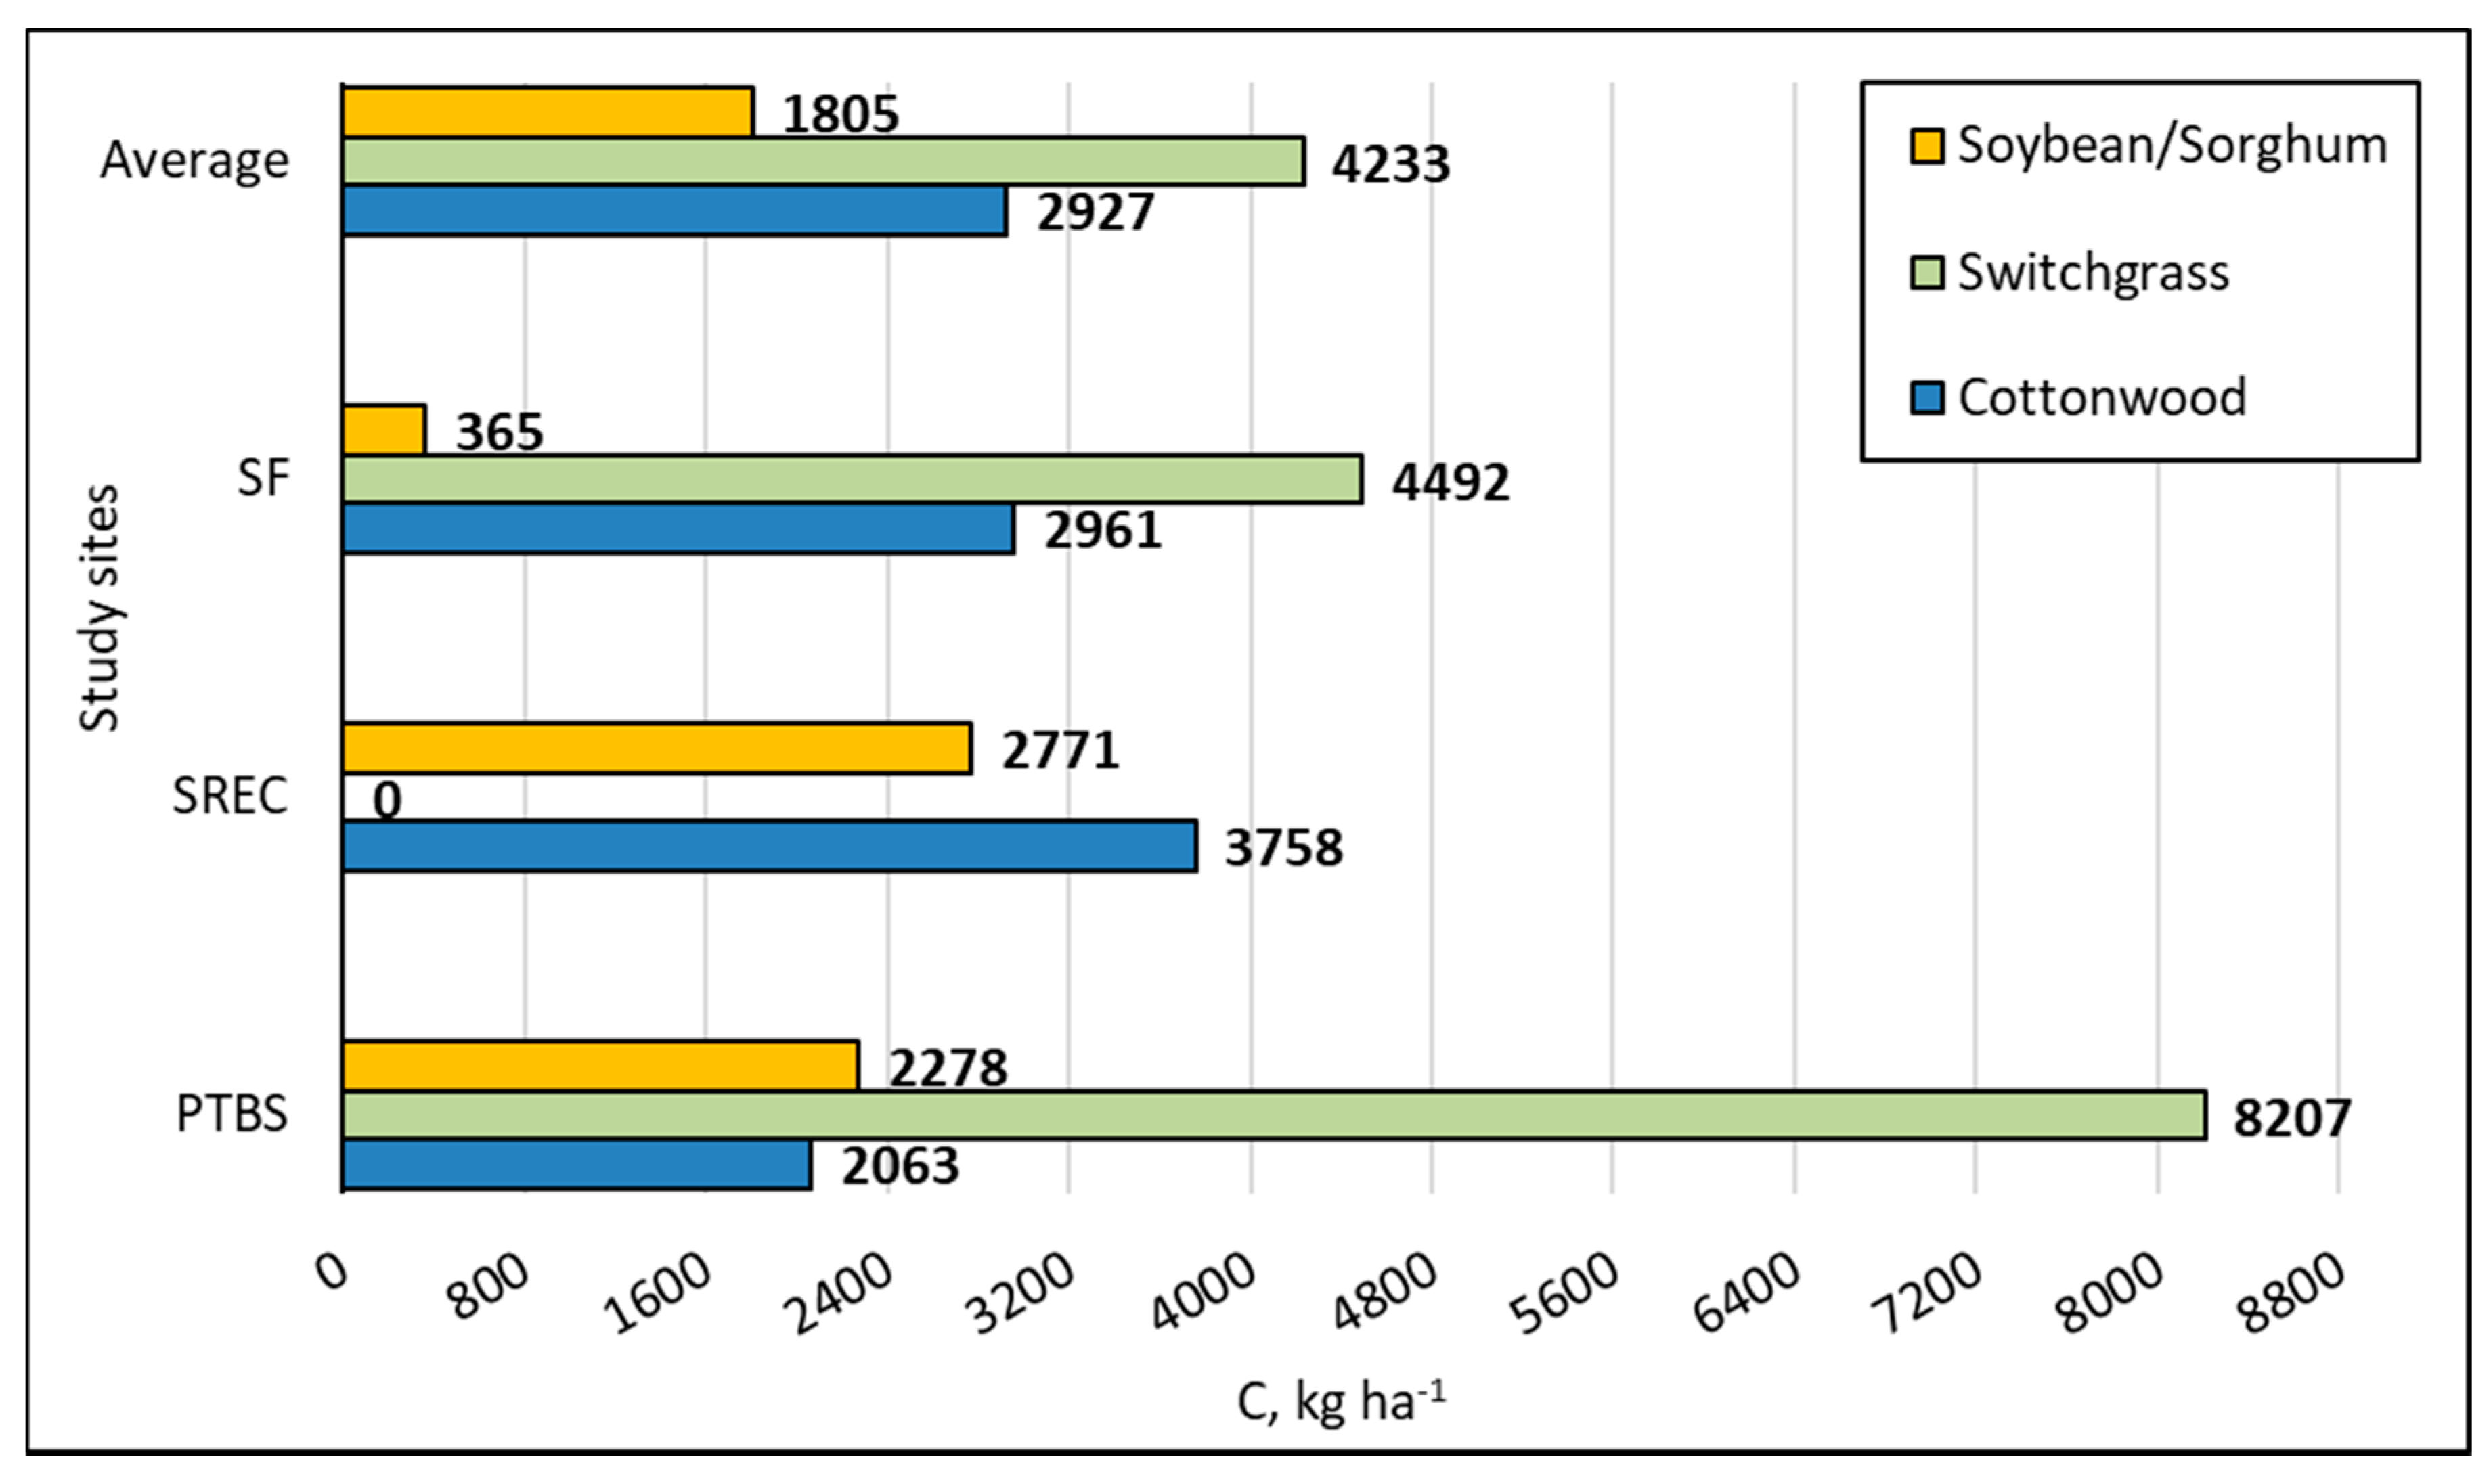
| Average | Cottonwood | 3222 | 2927 | 519 | 6.20 | 11.84 |
| Switchgrass | 1691 | 4233 | 512 | 3.30 | 11.56 | |
| Soybean/Grain Sorghum | 2035 | 1805 | 1733 | 1.17 | 2.22 |
| Hypothesis: Mean 1 − Mean 2 = 0 | Significance (Prob > |z|) |
|---|---|
| Cottonwood (1), Switchgrass (2) | Not significant (0.79) |
| Cottonwood (1), Soybean/Grain Sorghum (2) | Significant (0.02) |
| Switchgrass (1), Soybean/Grain Sorghum (2) | Significant (0.02) |
| Treatment | Carbon Sequestered on Site S (kg ha−1) | Amount of Harvested Carbon H (kg ha−1) | Carbon Emitted during Production E (kg ha−1) | Gross Ratio of Carbon Balance (S + H)/(E + H) |
|---|---|---|---|---|
| Cottonwood | 3222 | 2927 | 519 | 1.78 |
| Switchgrass | 1691 | 4233 | 512 | 1.25 |
| Soybean/Grain Sorghum | 2035 | 1805 | 1733 | 1.09 |
© 2020 by the authors. Licensee MDPI, Basel, Switzerland. This article is an open access article distributed under the terms and conditions of the Creative Commons Attribution (CC BY) license (http://creativecommons.org/licenses/by/4.0/).
Share and Cite
Masum, M.F.H.; Mehmood, S.R.; Pelkki, M.H.; Liechty, H.O. Estimating Carbon Efficiency of Bioenergy Systems in the Mississippi Alluvial Valley. Forests 2020, 11, 899. https://doi.org/10.3390/f11090899
Masum MFH, Mehmood SR, Pelkki MH, Liechty HO. Estimating Carbon Efficiency of Bioenergy Systems in the Mississippi Alluvial Valley. Forests. 2020; 11(9):899. https://doi.org/10.3390/f11090899
Chicago/Turabian StyleMasum, Md Farhad H., Sayeed R. Mehmood, Matthew H. Pelkki, and Hal O. Liechty. 2020. "Estimating Carbon Efficiency of Bioenergy Systems in the Mississippi Alluvial Valley" Forests 11, no. 9: 899. https://doi.org/10.3390/f11090899
APA StyleMasum, M. F. H., Mehmood, S. R., Pelkki, M. H., & Liechty, H. O. (2020). Estimating Carbon Efficiency of Bioenergy Systems in the Mississippi Alluvial Valley. Forests, 11(9), 899. https://doi.org/10.3390/f11090899