Article

Predicting Suitable Habitats of Camptotheca acuminata Considering Both Climatic and Soil Variables

1
Co-Innovation Centre for Sustainable Forestry in Southern China, Nanjing Forestry University, Nanjing 210037, China
2
College of Forestry, Nanjing Forestry University, Nanjing 210037, China
3
College of Biology and the Environment, Nanjing Forestry University, Nanjing 210037, China
4
Department of Forest and Conservation Sciences, Faculty of Forestry, University of British Columbia, Vancouver, BC V6T 1Z4, Canada
*
Authors to whom correspondence should be addressed.
Forests 2020, 11(8), 891; https://doi.org/10.3390/f11080891
Submission received: 19 June 2020 / Revised: 9 August 2020 / Accepted: 14 August 2020 / Published: 17 August 2020

Abstract

:
Camptotheca acuminata is considered a natural medicinal plant with antitumor activity. The assessment of climate change impact on its suitable habitats is important for cultivation and conservation. In this study, we applied a novel approach to build ecological niche models with both climate and soil variables while the confounding effects between the variables in the two categories were avoided. We found that the degree-days below zero and mean annual precipitation were the most important climatic factors, while the basic soil saturation, soil gravel volume percentage, and clay content were the main soil factors, determining the suitable habitats of C. acuminata. We found that suitable habitats of this species would moderately increase in future climates under both the RCP4.5 and RCP8.5 climate change scenarios for the 2020s, 2050s, and 2080s. However, substantial shifts among levels of habitat suitability were projected. The dual high-suitable habitats would expand, which would be favorable for commercial plantations. Our findings contribute to a better understanding of the impact of climate change on this species and provide a scientific basis for the cultivation and conservation purposes.

1. Introduction

Camptotheca acuminata is a plant species of the genus Camptotheca in the family of Nyssaceae, with nicknames Eclipta, water chestnut, and water tung tree, native to southern China and Tibet. It is an important multipurpose tree species with medicinal and ornamental values and was approved as a national second-level key protected wild plant by the State Council of China in 1999. C. acuminata is a fast-growing tree species in a temperate climate, but it is not cold-tolerant and requires moisture and fertile soil. Camptothecin (CPT) extracted from the fruit, roots, bark, branches, leaves, and other tissues are the sole inhibitors of Topoisomerase I so far. It has broad-spectrum anticancer activity and can be employed in the acute treatment of gastric cancer, rectal cancer [1], chronic myeloid leukemia, lymphatic leukemia, chorionic epithelial cancer, and lymphosarcoma. It has been considered as the second-most important antitumor medicinal plant in the world after Taxus [2]. The demand for C. acuminata has been growing worldwide in recent years. The total sale of C. acuminata derivatives has exceeded one billion dollars since 2010, becoming a major clinical agent [3]. In addition, C. acuminata plays a significant role in green ornamental and ecological protection [4]. Despite its importance, the impact of climate change on this species has not been assessed.
Unprecedented human-caused climate change has already caused species range shifts and local extirpation [5] and is predicted to have greater future impacts [6]. Thus, the original habitats of some plant species may no longer be appropriate for their growth and survival in future climates, resulting in existing populations with compromised health and productivity. Climate change has culminated in a steady northward shift of forests in the north [5], while forests in the south may be degraded and transformed into shrubs or grasslands in the Northern hemisphere. Changes in species distribution and abundance will depend on the degree of climate change, the intensity of local adaptation, and the potential for migration [7].
Niche-based ecological models have been widely used to predict suitable climatic habitats and to assess the potential impacts of climate change [8,9]. The widely used modeling algorithms include Garp, MaxEnt, Bioclim, randomForest, and Domain. Among them, the MaxEnt is probably the most often used one for being stable and predictable [10], and it can make a better response analysis to species on various environmental gradients [11], including identification of suitable habitats [12], risk assessments related to invasive species [13], potential impacts of climate change [14], design of protected areas, and protection of threatened species protection [15]. In addition, it requires presence data only, which makes the data collection and modeling process easier than others.
Most of the niche-based ecological models are built using only climate variables as predictors [16,17,18], as climate is the primary factor regulating geographic distributions of plant species [19]. However, the distribution of plant species is also related to soil type [20]. Failure to incorporate soil into the model may overestimate the future habitat adaptability of many plant species [21]. Therefore, some studies included both climate and soil variables as predictors in building niche-based models [22,23], but there are issues to do so due to collinearity [24] and beyond. Soil variables are often correlated with climate variables, as climate is a major soil-forming factor and has a significant influence on the properties of soil. Thus, in building a niche-based model with both climate and soil variables, some variance explained by soil variables in the model could have been explained by climate variables if soil variables were not included and vise versa. As soil conditions are relatively stable in comparison to a rapidly changing climate, and there are no future projections for soil, the explanatory power of soil variables in the model is wasted in future projections. On the other hand, if the opposite happens, the soil effect would be masked by climate variables. However, to our knowledge, this issue has not been addressed yet.
So far, studies on C. acuminata are focused on its antitumor mechanism [2]. The distribution of C. acuminata has not been reported in detail. The study of the climatic habitats of this species and the potential impact of climate change on its geographical distribution remains blank. This limits the cultivation and genetic conservation of this species. In this study, we used the MaxEnt model to predict the suitable habitats of C. acuminata in the current and two climate-change scenarios for three future periods (the 2020s, 2050s, and 2080s). In order to consider the effects of soil on the habitat prediction and to avoid mixed modeling of climate and soil variables, we built niche models with climate variables and soil variables separately and used a climatic niche model to predict suitable climatic habitats and applied a soil niche model to predict suitable soil habitats of the species. We then applied a novel approach to filter the climatic habitats by the soil habitats to incorporate the soil effect into our habitat predictions. To our best knowledge, this was the first attempt to consider both climatic and soil effects with such a two-step approach. Our results would provide a scientific basis for the development of adaptive strategies for this species under climate change, including in situ conservation, reforestation, and resource utilization.

2. Materials and Methods

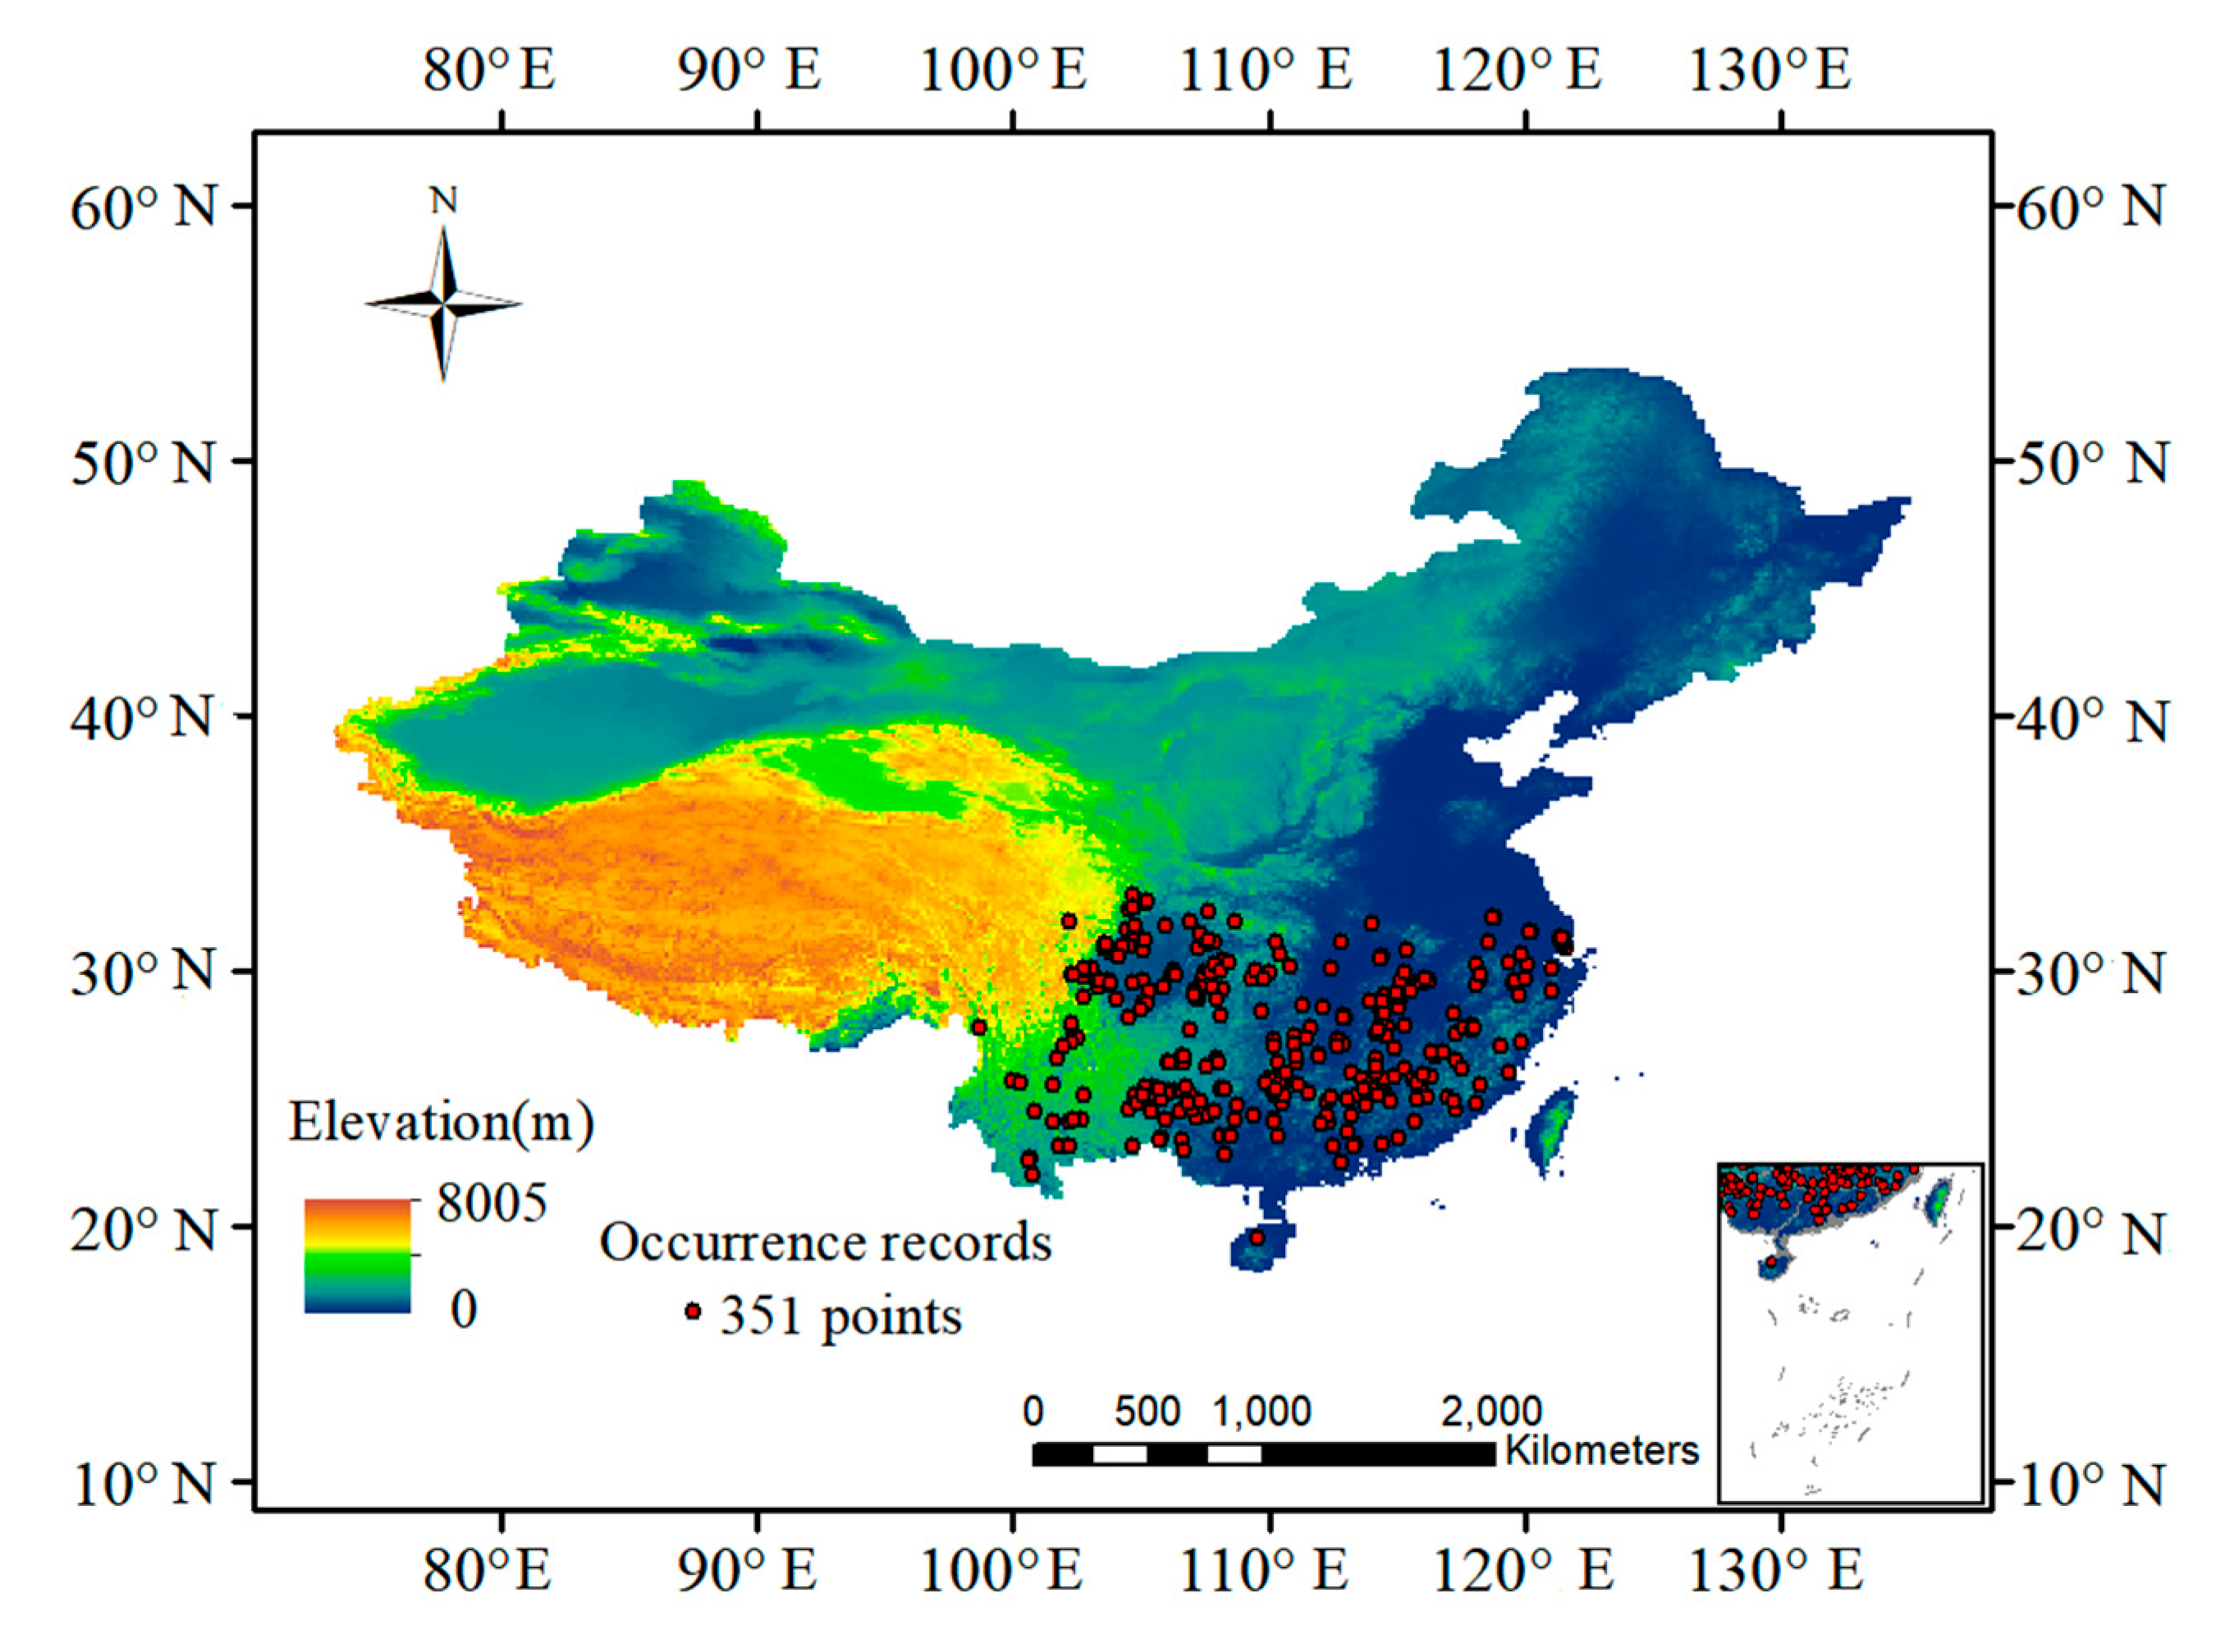
2.1. Species Occurrence Data

The data of natural distribution sites of C. acuminata were obtained from the China Digital Herbarium (http://www.cvh.ac.cn/), a teaching specimen resource-sharing platform (http://mnh.scu.edu.cn/main.aspx), the Global Biodiversity Information Database (GBIF, https://www.gbif.org/), and literature collections. To avoid multiple recording points from the same grid and the impact of sampling bias [25], the original data were filtered geographically to remove some blurred geographical distribution points. By selecting data points with precise coordinates (i.e., latitude and longitude) on Google Earth satellite maps, we finally obtained 351 data points of C. acuminata in China (Figure 1) reflecting naturally occurring populations.

2.2. Environment Data

The environmental variables selected in this study include 16 climate variables (Table 1) and 30 soil variables (Table 2). The climate data were generated by ClimateAP (http://ClimateAP.net) [26]. The ClimateAP software generates scale-free climate data for historical and future periods for specific locations based on longitude, latitude, and altitude, instead of grid averages from other climate models. For building the climatic niche model, we used ClimateAP to generate climate variables for the 351 data points for the normal reference period, 1961–1990. For predicting the geographical distributions of the climate habitats for the current and future periods, we also generated grid climate data at 4 × 4 km for the reference period (also called current) (1961–1990), the 2020s (2011–2040), 2050s (2041–70), and 2080s (2071–2100). The future climate data were from the general circulation models (GCMs) of the Coupled Model Intercomparison Project (CMIP5) included in the Intergovernmental Panel on Climate Change (IPCC) Fifth Assessment Report (IPCC 2014). We used the 15-GCMs ensembles of the two climate change scenarios RCP4.5 and RCP8.5 included in ClimateAP for this study. These two scenarios are the most widely used ones and represent intermediate and business-as-usual scenarios, respectively. Soil variables were derived from 30 basic soil indicators (HWSD, Table 3) obtained from the World Soil Database (http://www.iiasa.ac.at/web/home/research/researchPrograms/water/HWSD.html), which contains a key soil attribute raster data layer at a spatial resolution of 30 arc seconds [27].
In order to avoid overfitting and inaccurate models caused by the strong correlation between environmental variables in this study, we used the MaxEnt 3.4.1k version (http://www.cs.princeton.edu/schapire/maxent) and ArcGIS software to screen ecological factors and to select the climatic factors with the largest contribution to the distribution of C. acuminata. Firstly, following Koeling [28], we used all the 16 climate variables to prebuild the MaxEnt model for three times in succession and discarded the climate variables with no contribution to the models. Secondly, we use ArcGIS to calculate the Pearson correlation coefficient between each pair of the climatic variables. If two climatic variables were strongly correlated at r > 0.8, only one of the two variables with a higher contribution rate was selected to avoid the multicollinearity of environmental variables from violating statistical assumptions [29]. We applied the same procedures for the 30 soil variables. Through the two-step screening process, we selected 6 climate variables (Table 1, in bold) and 12 soil variables (Table 2, in bold) for model building.

2.3. Model Development

We used the MaxEnt algorithm to build a climatic niche model with the 6 selected climate variables and a soil niche model with the 12 selected soil variables, respectively. For comparisons, we also built a combined model with the 6 climate variables and 12 soil variables. We randomly selected 25% of the data points for model validation and used the remaining 75% data points to build the model. The Jackknife method was used to detect the importance of the variables [29]. To consider the uncertainty introduced by splitting the training and validation sets, 10 models were built by 10 repeated runs for cross-validation.
The outputs of the MaxEnt models for the reference and future periods were the “cumulative” probability for each pixel on the scale of 0–100% [30]. Based on the suitable habitat evaluation index method of Chun Yan Lu et al. [31], we divided the study area of C. acuminata into 4 types of habitats, namely unsuitable (p < 0.2), low-suitable (0.2 ≤ p < 0.4), moderate-suitable (0.4 ≤ p < 0.6), and high-suitable (0.6 ≤ p ≤ 1) for both climatic and soil models, respectively. We collectively called the last three suitable types as “suitable habitats”.

2.4. Model Evaluation

We utilized the receiver operating characteristic curve (ROC) built in the MaxEnt software to check the accuracy of the simulation results. The Area Under the Curve (AUC) value ranges from 0 and 1. The closer the AUC value is to 1, the greater the distance from the random distribution, the stronger the correlation between environmental variables and the geographical distribution of predicted species [32]. We used the general evaluation criteria of the ROC as follows: AUC value < 0.6 is the model failure, 0.6 ≤ AUC value of < 0.7 is considered to be a poor model and is barely acceptable, 0.7 ≤ AUC value < 0.8 is considered to be a general model, 0.8 ≤ AUC value < 0.9 is considered to be a good model, and 0.9 ≤ AUC is considered to be a good model [33].

2.5. Model Predictions and Assessments of Climate Change Impacts

Finally, we filtered the four types of climatic suitable habitats by soil suitable habitats, which was the combination of all the three suitable types. The filtered habitats were considered suitable for both climatic and soil conditions and simply called low-, moderate-, and high-suitable habitats, respectively. Changes in the area of suitable habitats were divided into three categories: expansion, contraction, and stable, following Zhang et al. [34]. We generated additional projections combining the high-suitable climatic habitats with the high-suitable soil habitats for establishing commercial plantation purposes. We called this combination the “dual high-suitable habitats”.
To assess the impact of climate changes on the suitable habitats of this species, we evaluated changes in spatial distributions, areas, and the centroid of the distributions of both the climatic and the filtered habitats under the six future climate scenarios relative to the reference period. In addition, we also assessed the shift of centroids of both the climatic and the dual high-suitable habitats in future climate scenarios.

3. Results

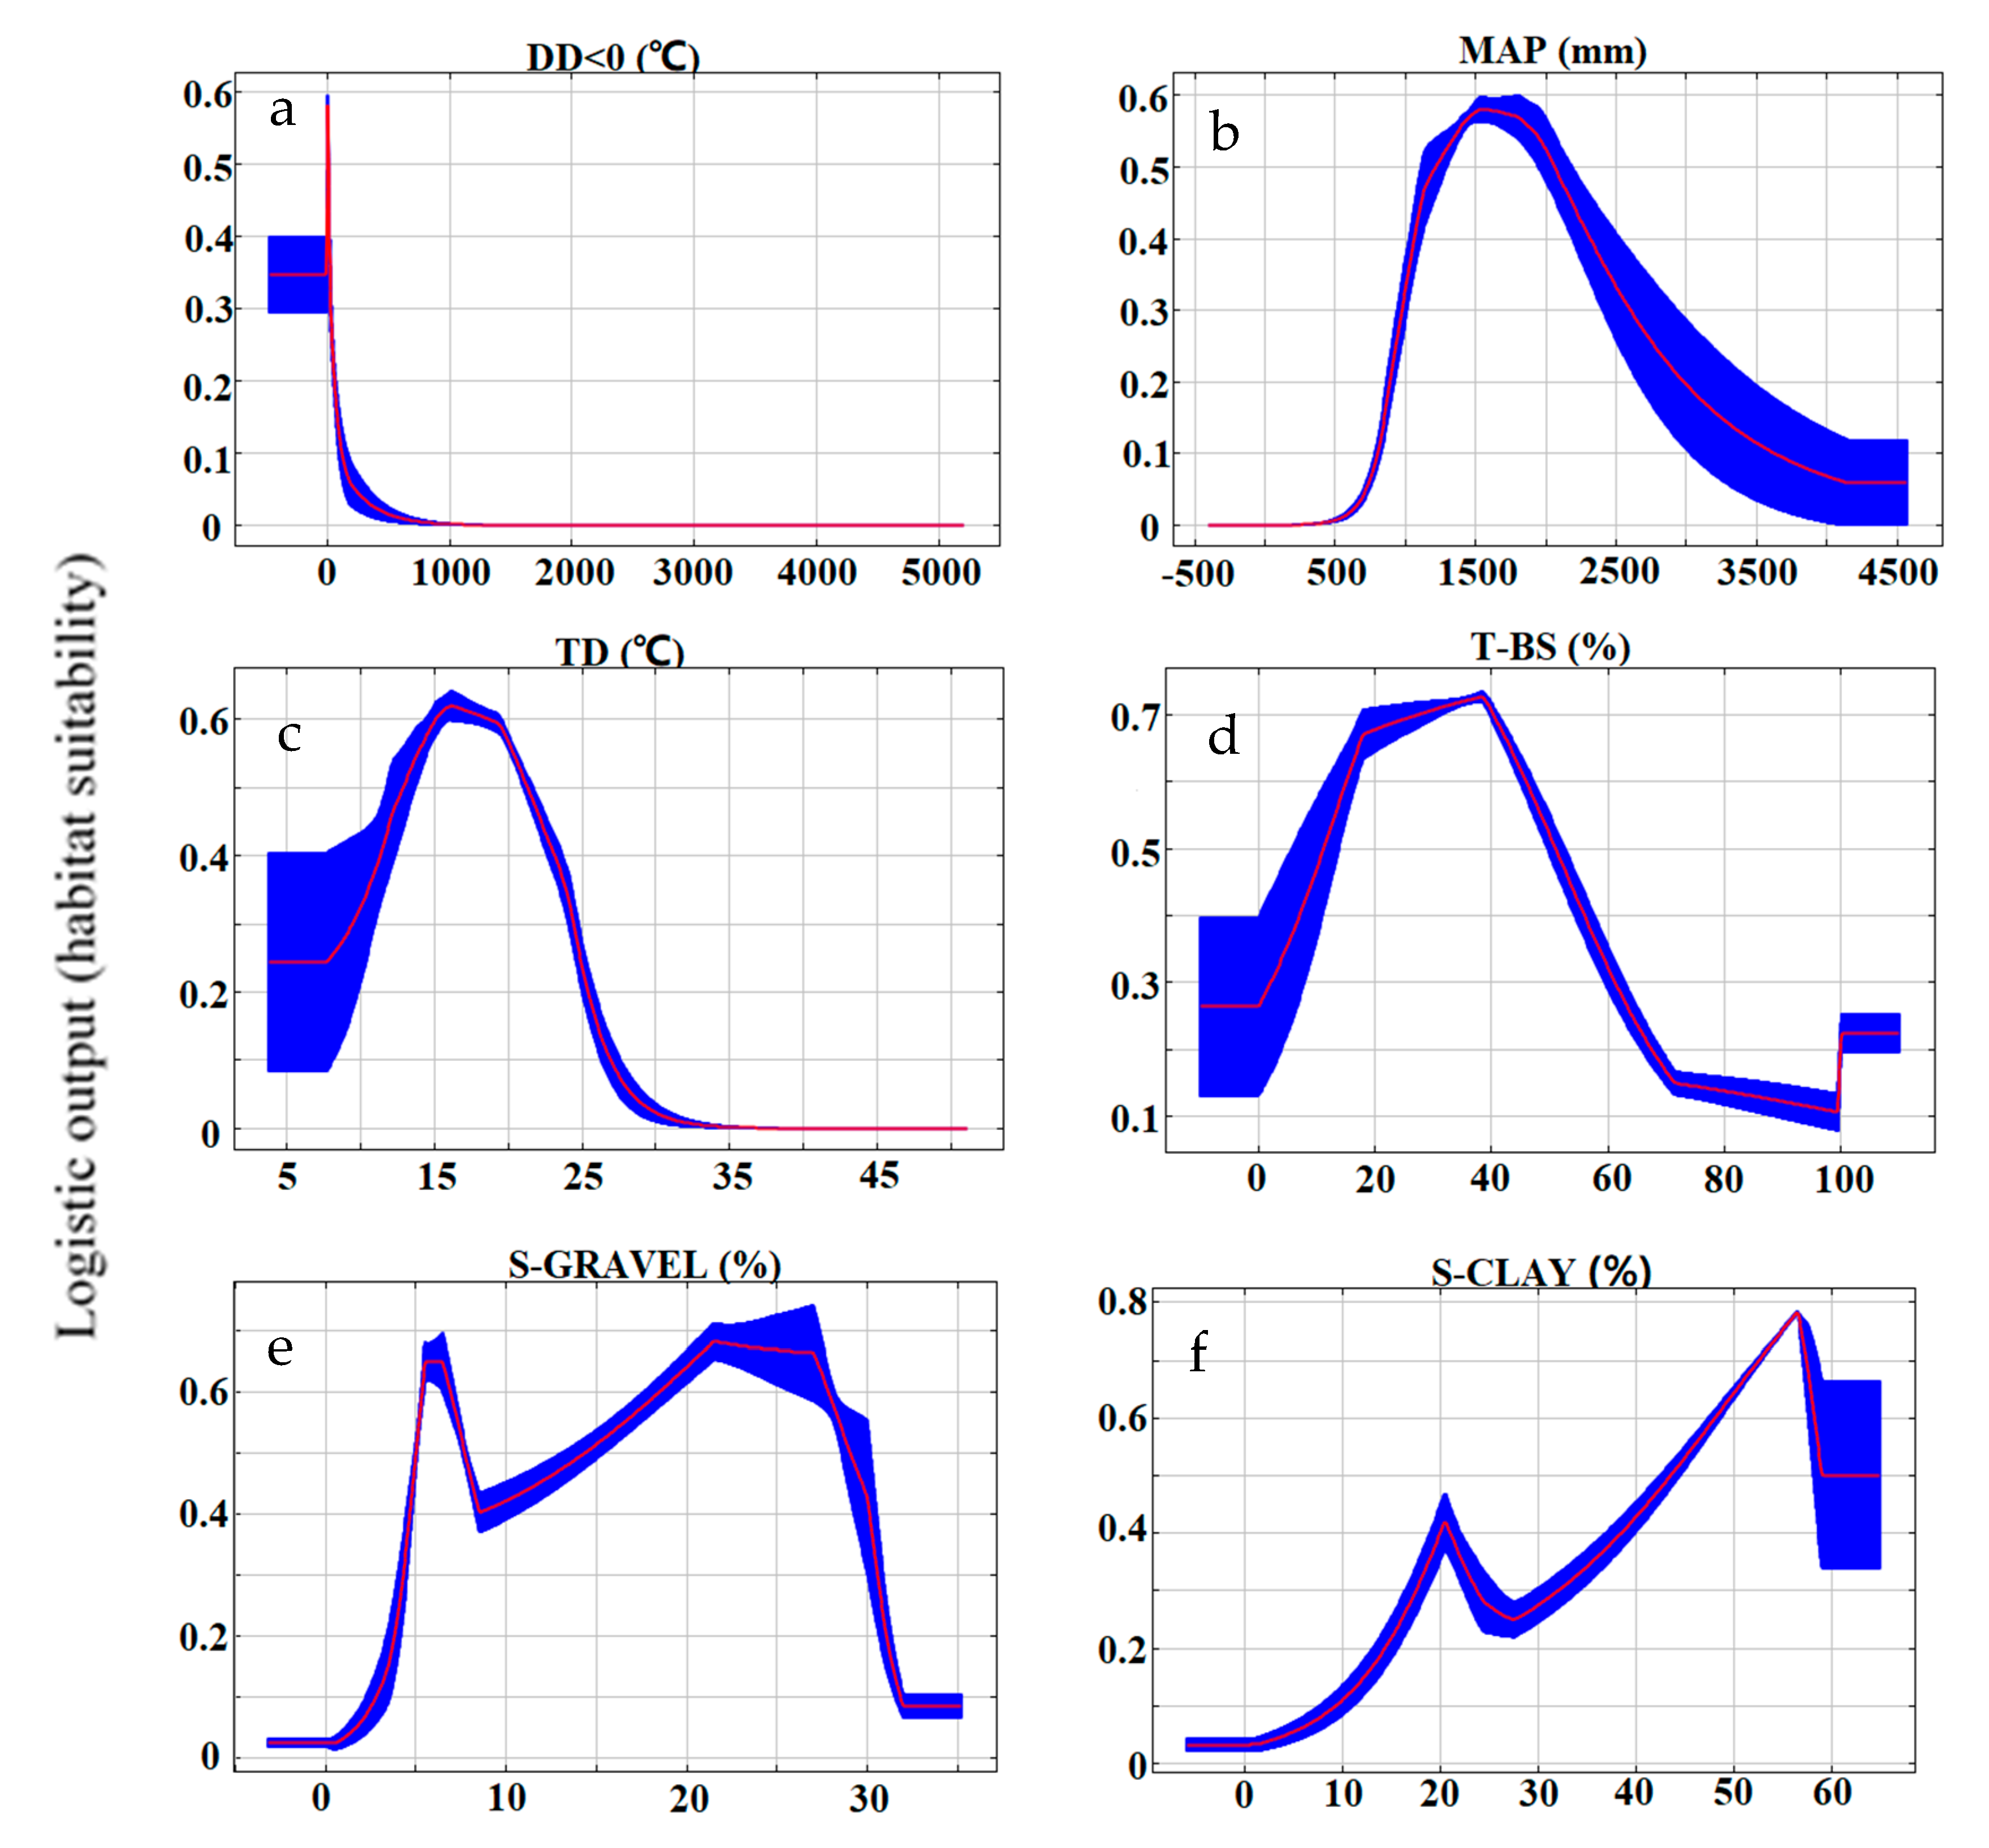
3.1. Model Performance and Contributing Variables

The AUC values for the model cross-validation training data and test data were 0.932 and 0.931 for the climatic model, 0.922 and 0.907 for the soil model, and 0.926 and 0.917 for the combined model, respectively. The ROC curves of all the three models were far away from the random distribution (0.5), indicating a high accuracy of the two models. Interestingly, the combined model was not the highest in model prediction accuracy, only slightly higher than the soil model and lower than the climatic model.
For the climatic model, variables with the largest contribution rate to the model was DD < 0 (80.7%), followed by MAP (6.3%) and TD (4.3%), which accumulatively interpreted 91.3% of the model (Table 3). Of these three variables, two were temperature-related variables, and one was a precipitation variable (Table 3). The remaining three variables contributed less than 10% to the model. For the soil model, the top three contributing variables were T-BS (31.8%), S-GRAVEL (22.7%), and S-CLAY (18.4%), collectively accounting for 72.9% of the total contribution of all the soil variables. Other soil factors demonstrated a limited impact on suitable habitats. For the combined model, climate variables contributed 91.6% in total, suggesting apparent domination over the soil variables (i.e., 8.4%), although the contribution of each climate variable was also reduced relative to that in the climatic model.
Response curves (Figure 2) of the three most important climate variables showed that their suitable ranges for C. acuminata were 0–25 ℃ for DD < 0, 1100–2000 mm for MAP, and 14–22 ℃ for TD, respectively. The suitable ranges for the three most significant soil variables were 18–50% for T-BS, 5–30% for S-GRAVEL, and 42–67% for S-CLAY, respectively (Figure 2).

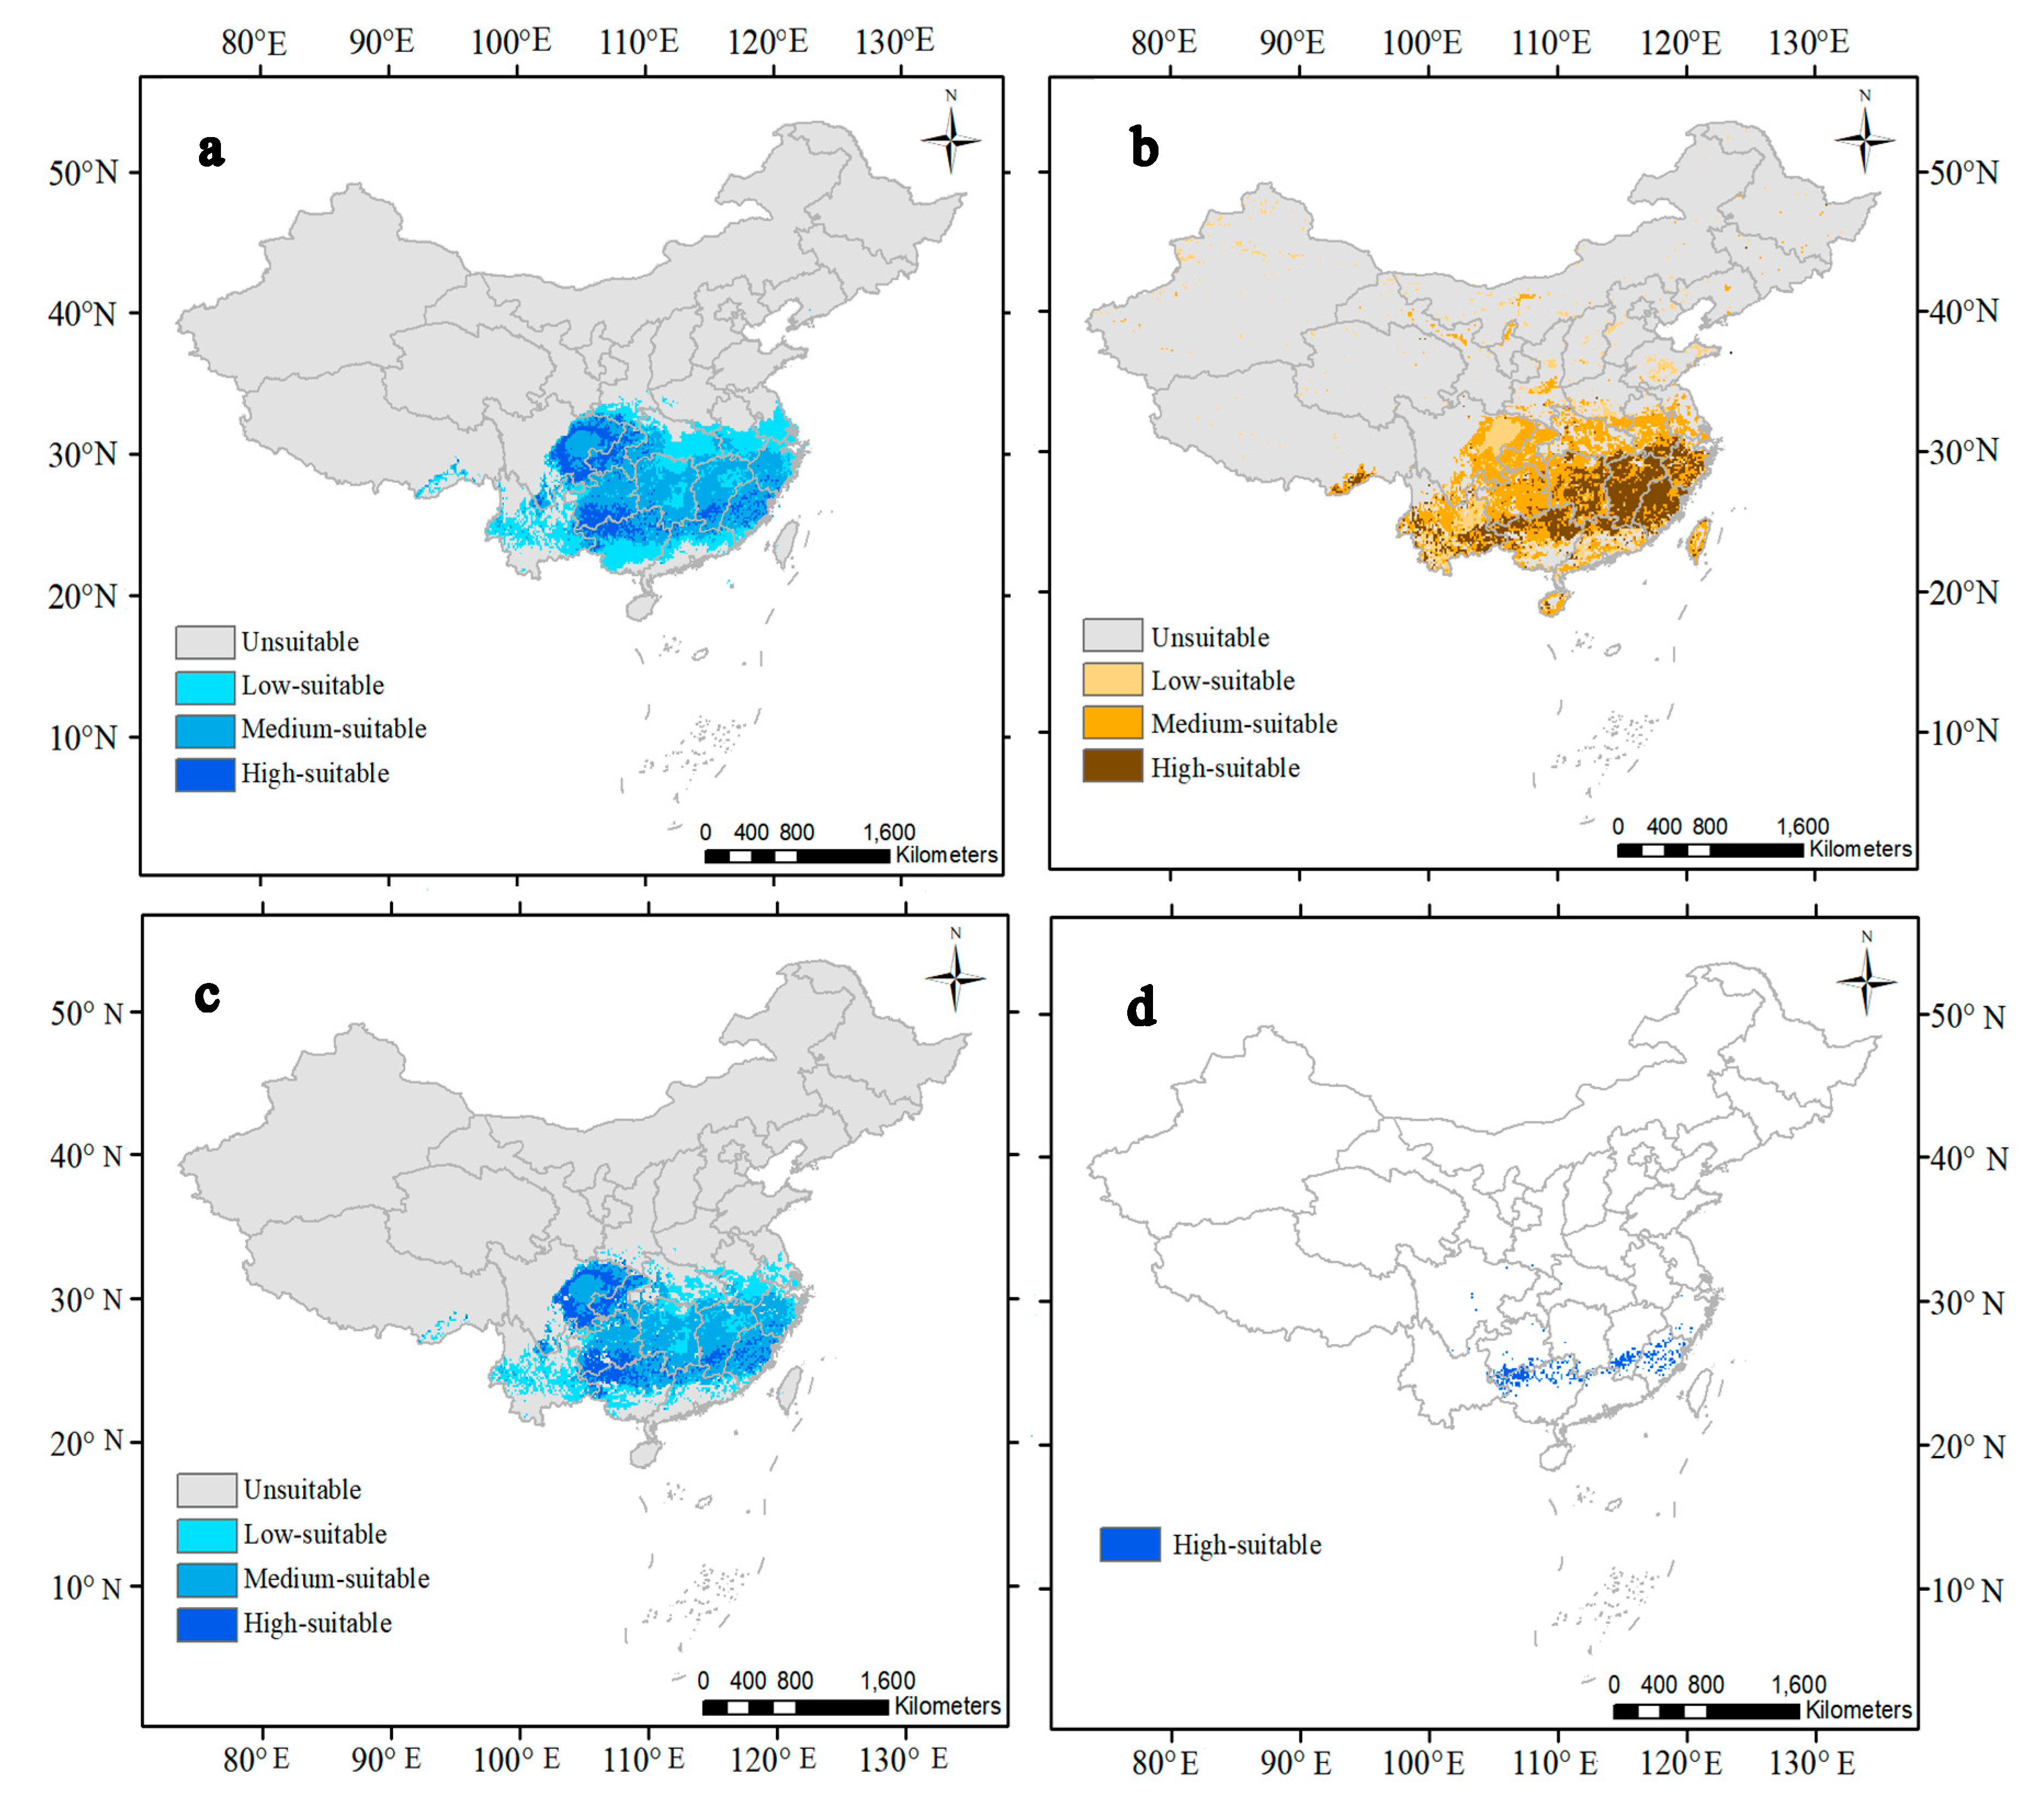
3.2. Predicted Suitable Habitats for the Current

The four types of climatic suitability of C. acuminata habitats for the current climate were mapped over all of China (Figure 3a and Table 4). The high-suitable habitats were concentrated between 25–33° N in latitude, accounting for 2.7% of the country’s land area. The medium-suitable habitats were distributed around the high-suitable habitats, accounting for 8.3%, and the low-suitable habitats were distributed further away from the high-suitable habitats, accounted for 7.2%. The unsuitable habitat accounted for the remaining 81.8%.
For the soil suitable habitats of C. acuminata (Figure 3b), the high-suitable habitat were mainly distributed between 18–35° N in latitude, accounting for 5.9% of the total land area. The medium-suitable and low-suitable habitats accounted for 10.1% and 4.2%, respectively. The rest of the country (79.8%) was unsuitable for this species in terms of soil conditions (Table 4). Overall, the distribution of soil-suitable habitats for this species was slightly broader than that for climatic ones. However, there were also some small areas showing nonoverlapping between the two habitats.
After the climatic habitats filtered by the soil habitats (Figure 3c), the areas of the high-suitable habitats accounted for 2.6% of the country. The medium-suitable and low-suitable habitats accounted for 7.8% and 4.8%, respectively. Unsuitable habitats accounted for 85% (Table 4). The difference between the filtered and nonfiltered climatic habitats was increased from high-suitable to low-suitable habitats, suggesting that most of the nonoverlapping areas occurred in the low-suitable habitats of the two categories, as expected. The dual high-suitable habitats (Figure 3d) accounted for 0.87% of the country, which was about a third of the high-suitable habitats (2.6%) (Table 4).

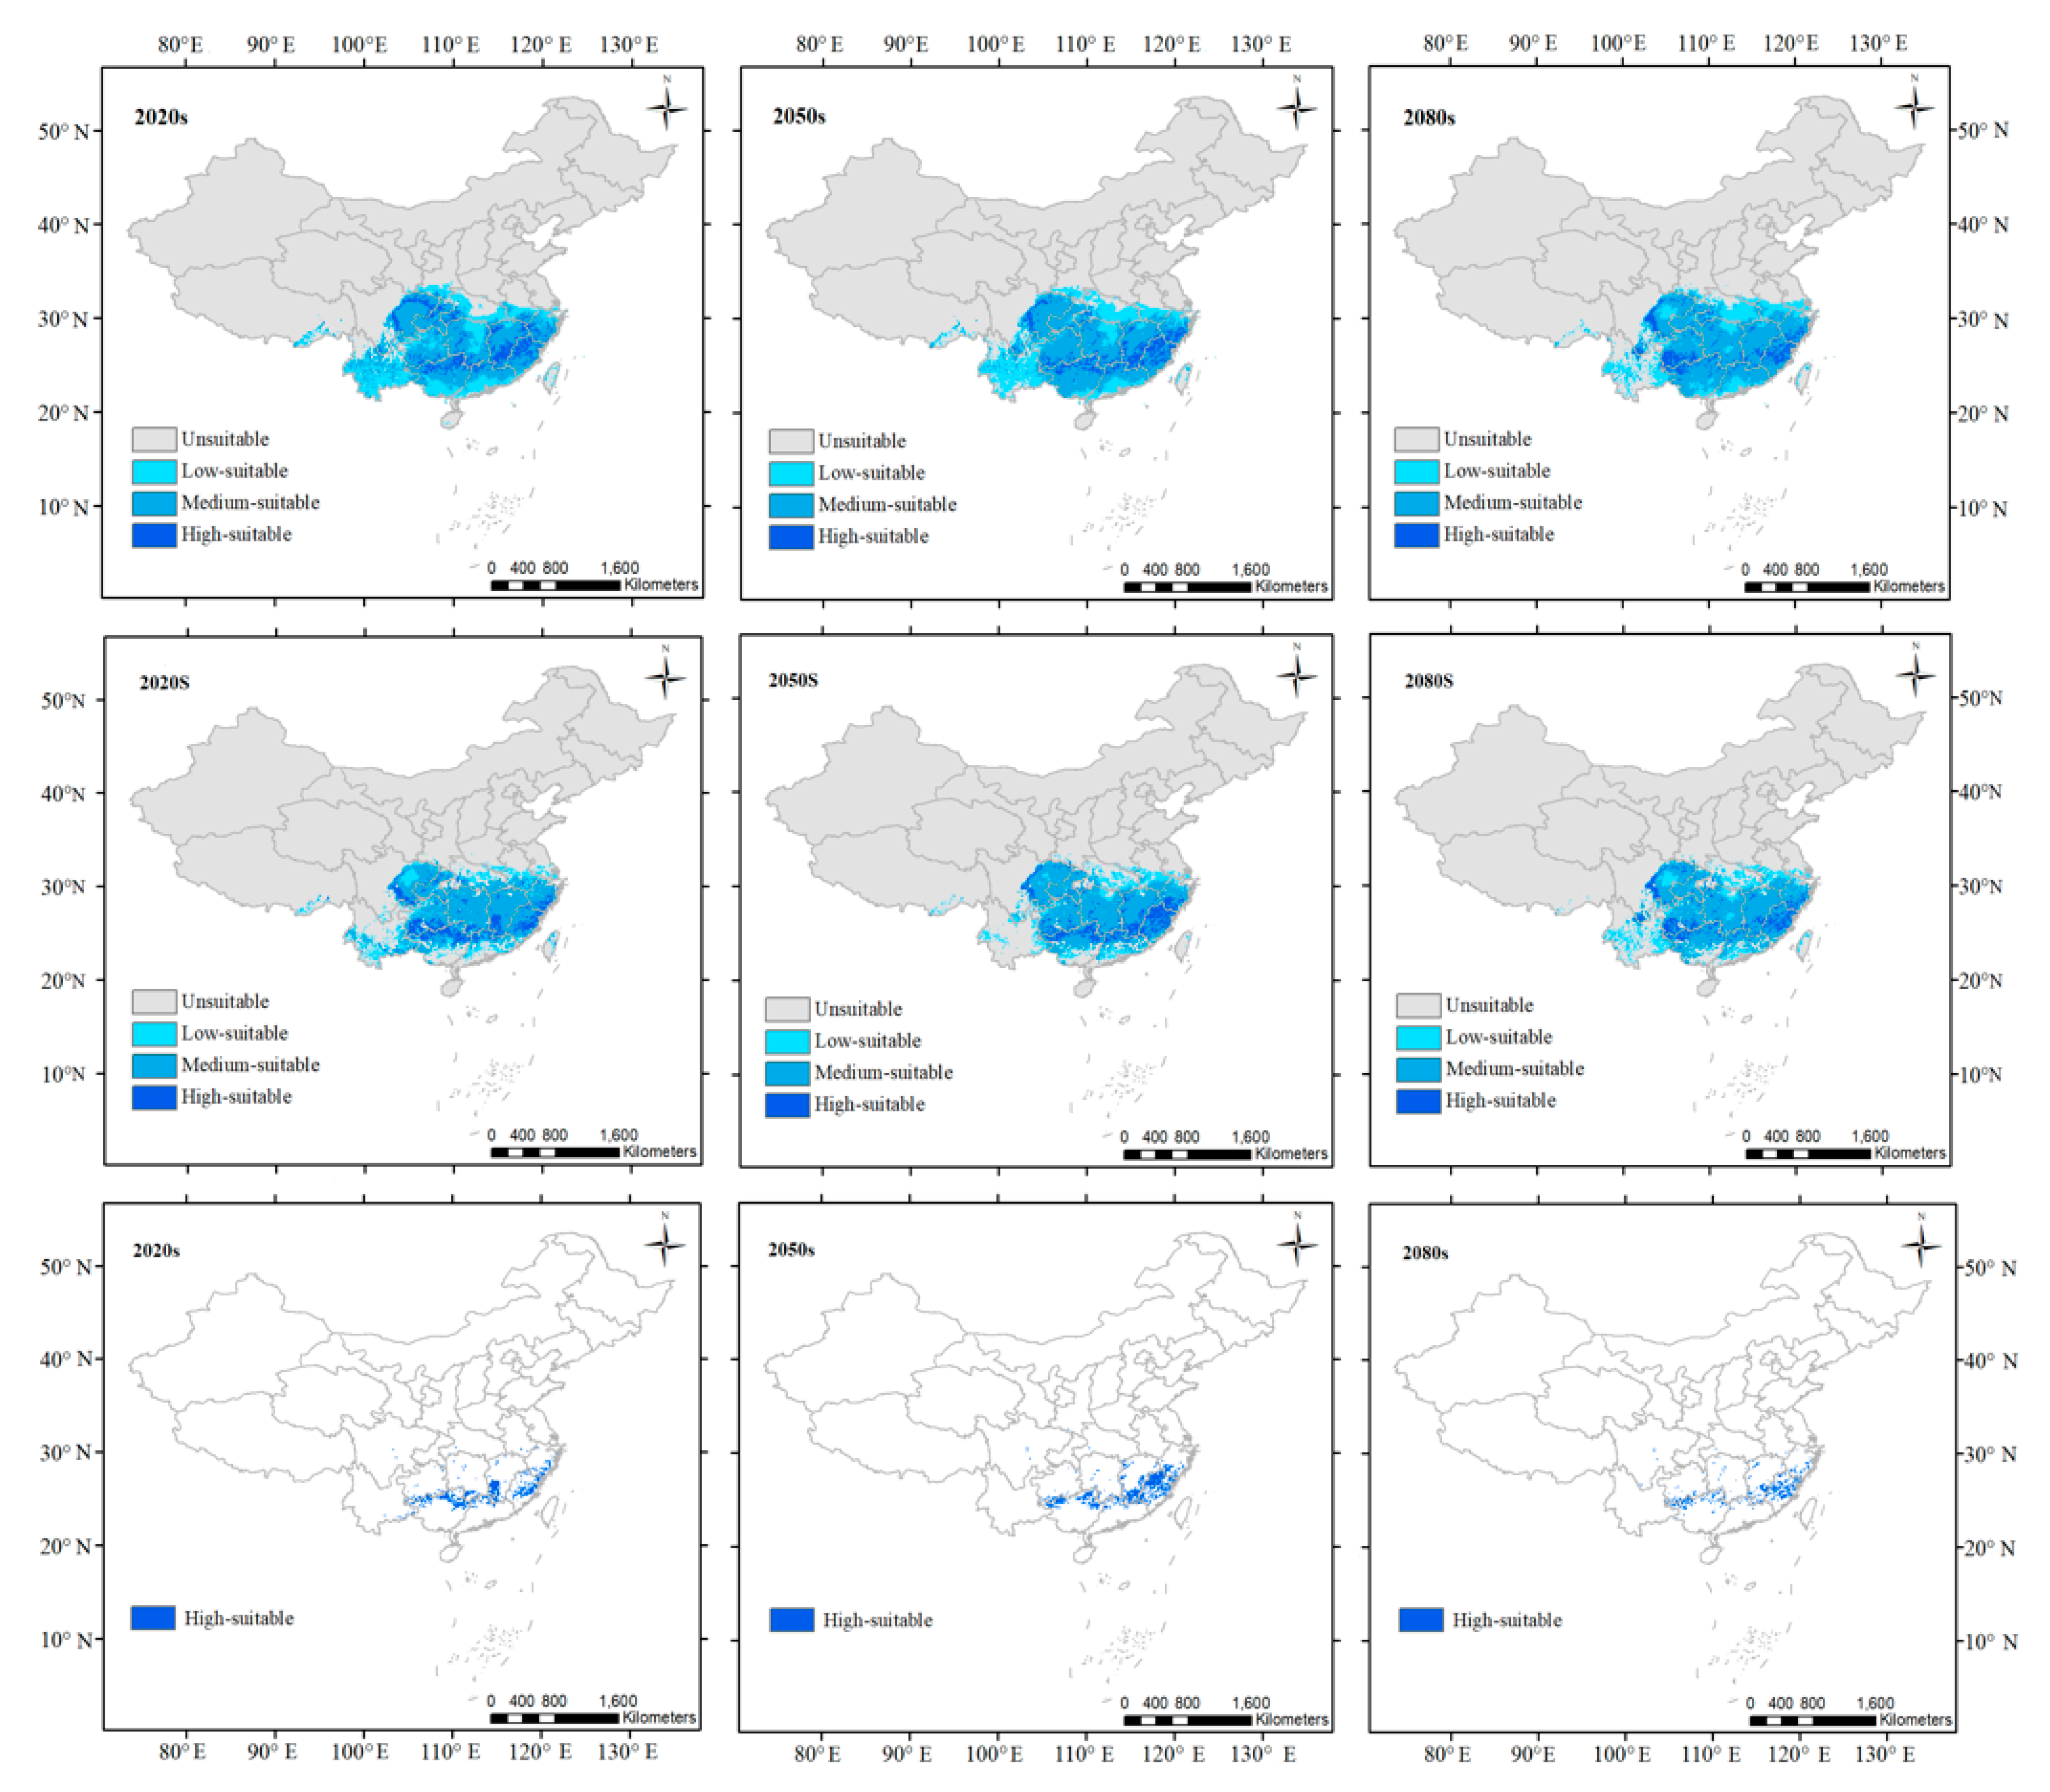
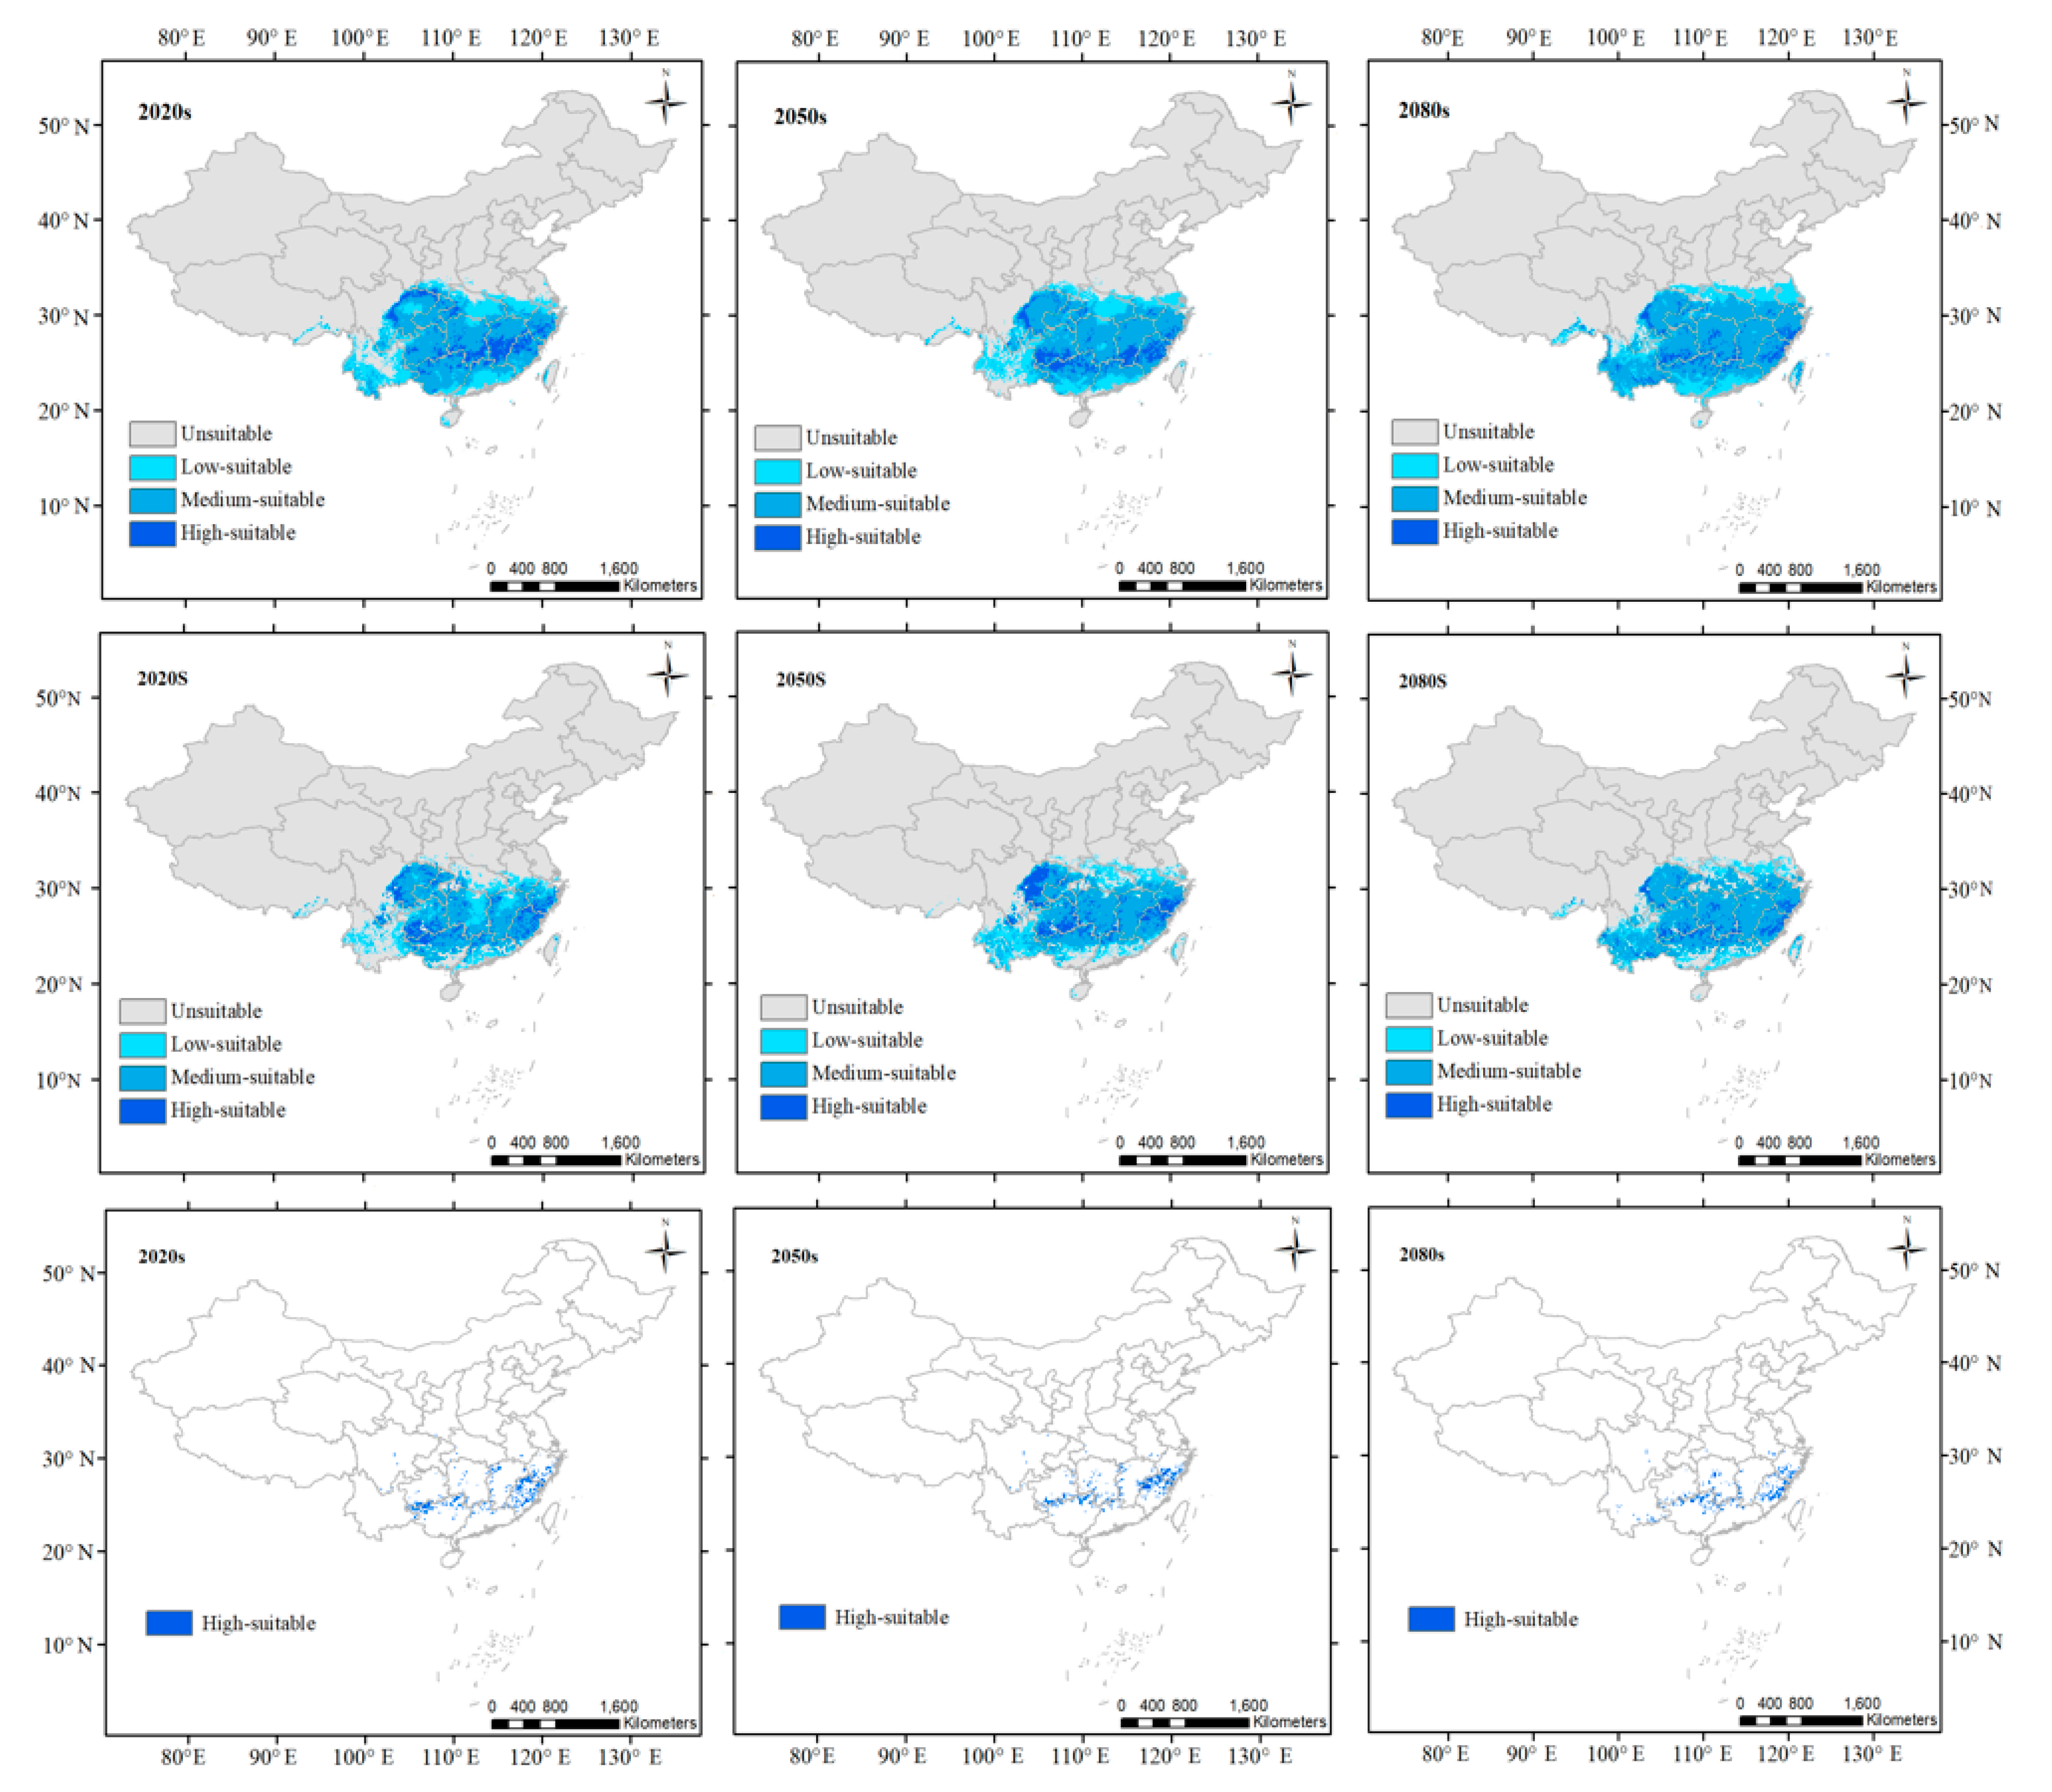
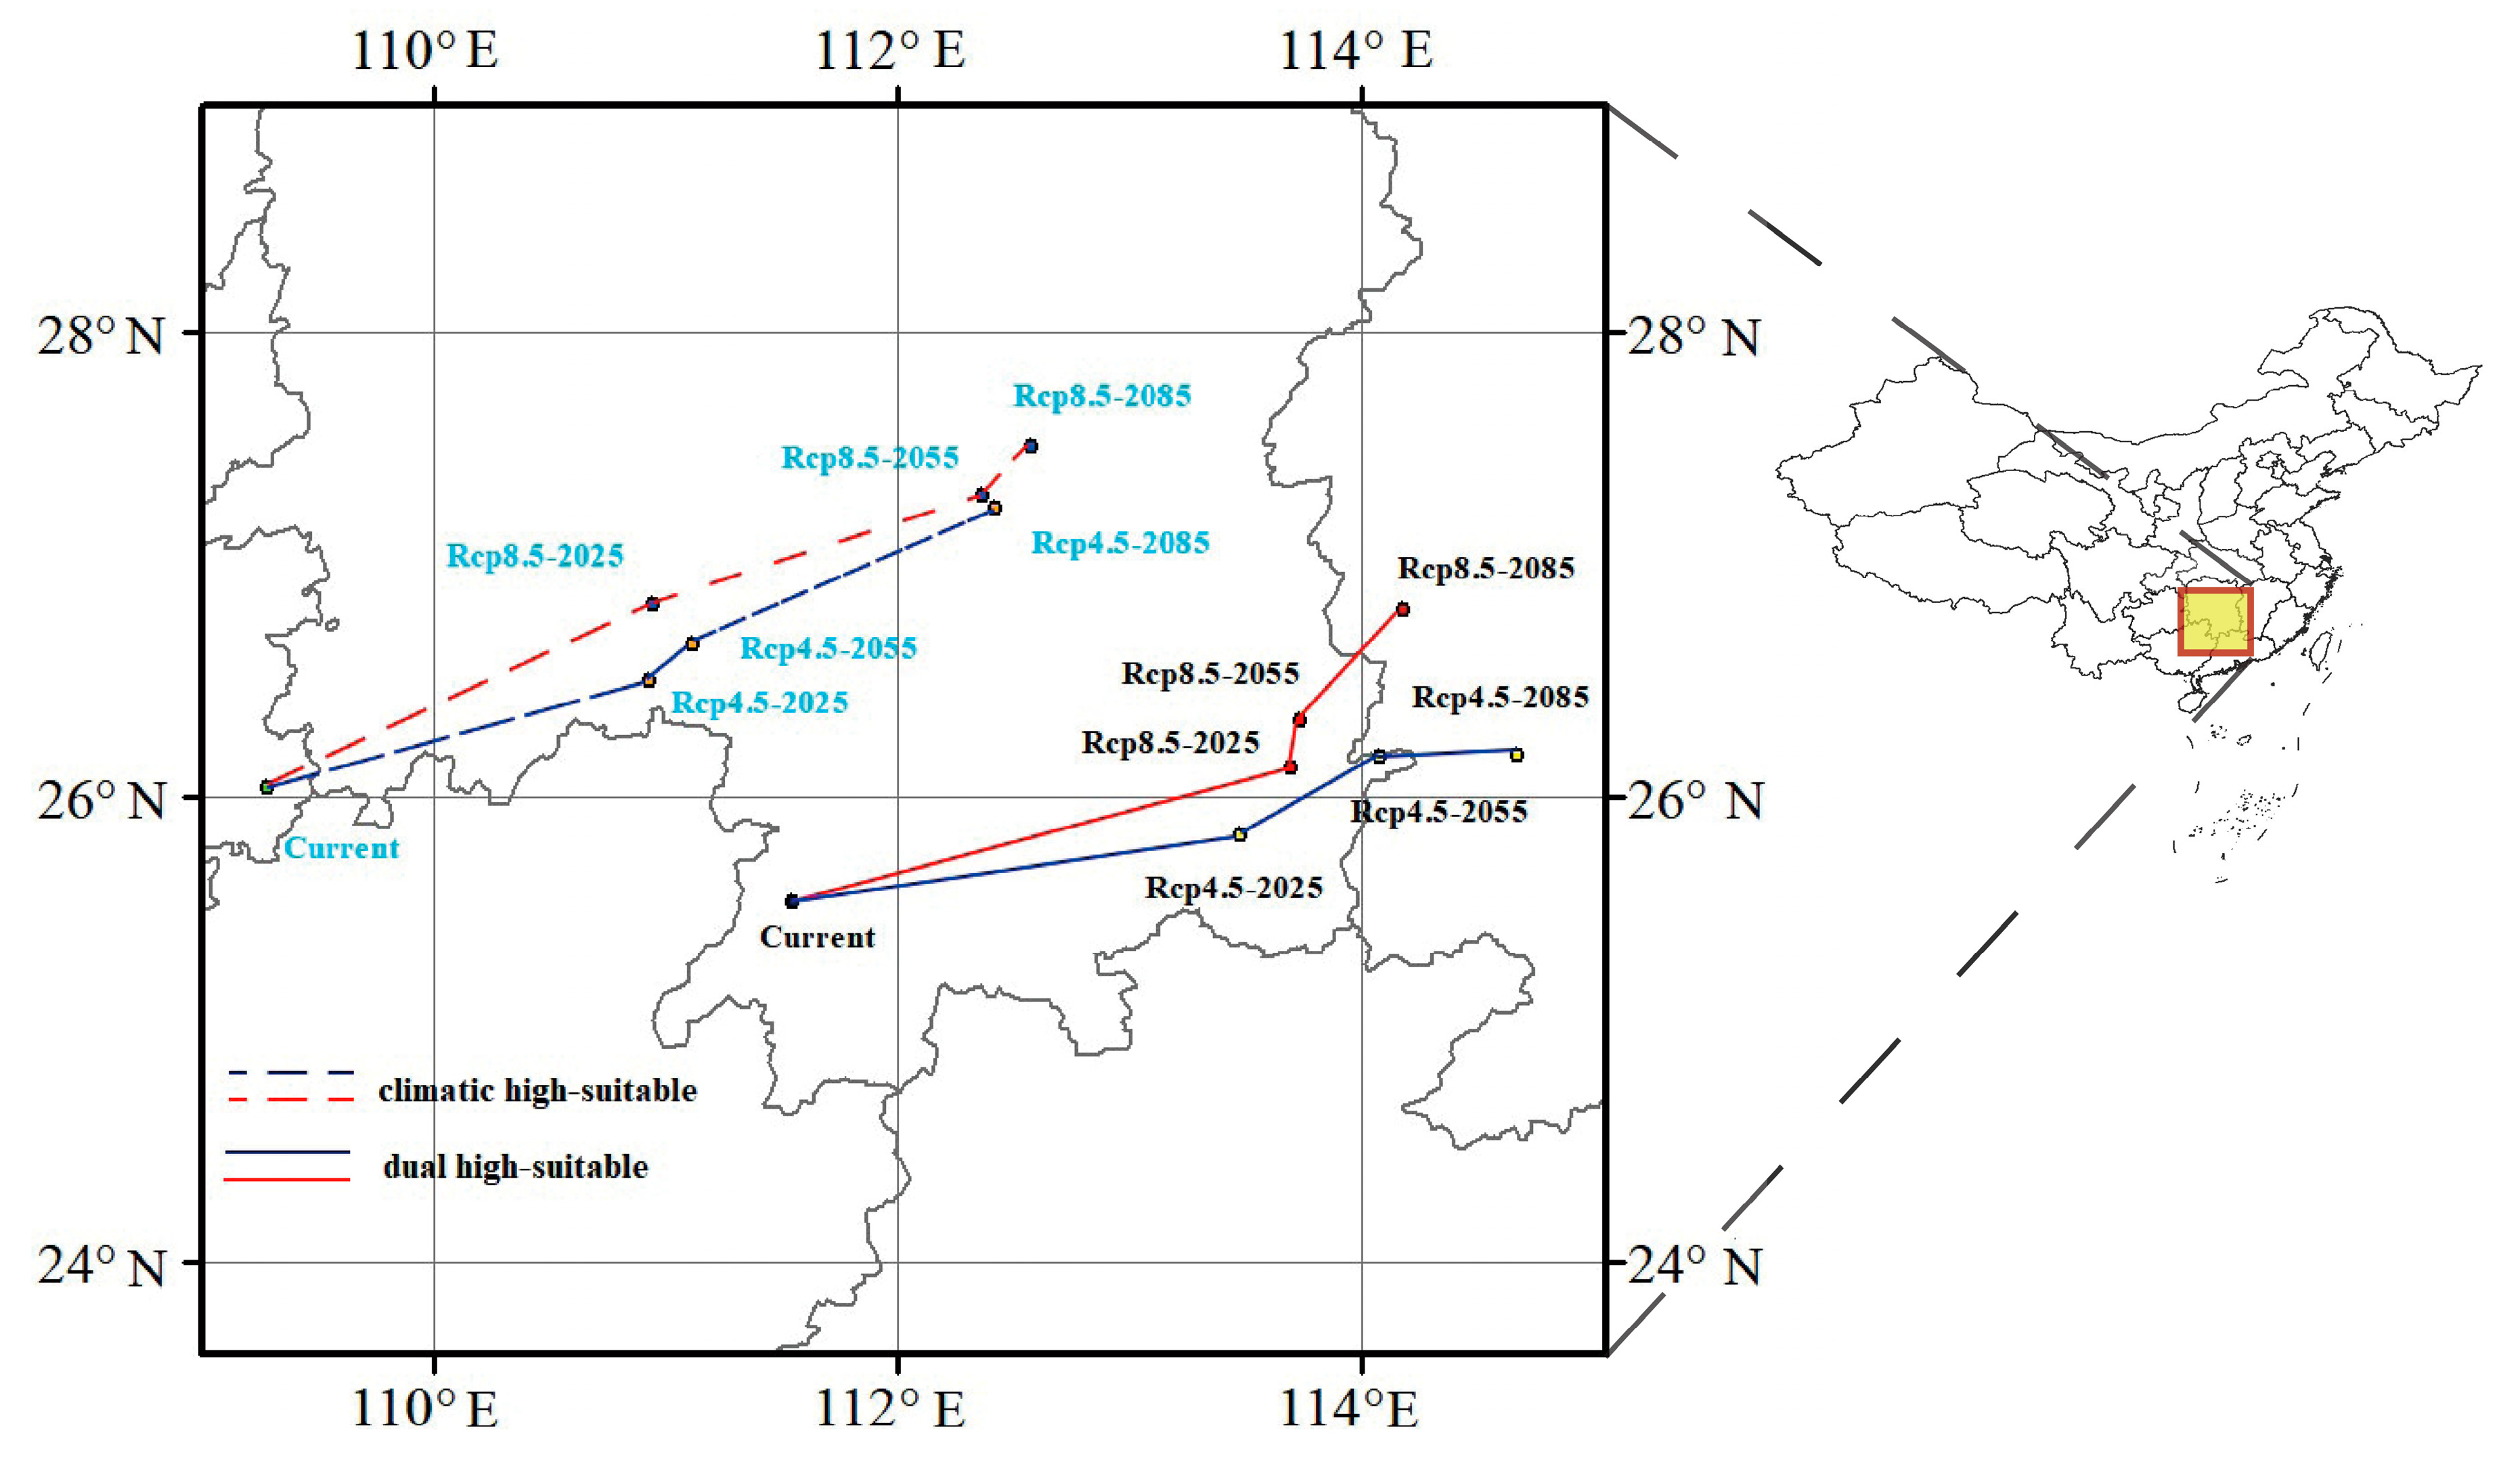
3.3. Projected Changes in Suitable Habitats for Future Periods

Compared with the current distribution (Figure 3a), the climatic suitable habitats show an increasing trend in the future climates by the end of the century under the two climate change scenarios (7–25%, Table 5). However, the increases were less than 11% in most cases, except for a jump for RCP8.5 in the 2080s (25.3%). No substantial geographic shift was projected.
After being filtered by soil habitats (Figure 3c), the high- and low-suitable habitats show a decreasing trend, while the moderate-suitable habitats show an increasing trend in the future climates. The area of the high-suitable habitats would decrease by 2.8% and 3.2% by the 2020s, 4.2% and 4.9% by the 2050s, and 28.7% and 24.6% by the 2080s under the RCP4.5 and RCP8.5 scenarios, respectively (Figure 4 and Table 5). The decline of the low-suitable habitats was at a similar magnitude, as for the high-suitable habitats. However, the area of the moderate-suitable habitats would increase by 14.8% and 18.6% by the 2020s, 17.4% and 23.1% by the 2050s, and 35.2% and 59.8% by the 2080s under the two scenarios, respectively. The total suitable habitats showed smaller increases than climate habitats alone. The centroid of the high-suitable habitats was projected to move northeastward from the current location in East Guizhou to West Hunan by the 2020s and keep moving to Northeast Hunan under the future climates.
However, future projections of the dual high-suitable habitats showed a different pattern. Compared to the current distribution (Figure 3d), their size was projected to increase by 98.0% and 105.3% by the 2020s and 100.5% and 66.1% by the 2050s under RCP4.5 and RCP8.5, respectively (Figure 5 and Table 5). However, their size was projected to decrease by 12.7% and 20.5% by the 2080s under the two scenarios, respectively. The centroid of the dual high-suitable habitats was projected to move from the current location in South Hunan (Figure 6) northeastward. By the 2080s, the centroid would shift to Jiangxi, with RCP8.5 moving more to the north. Compared with the centroid of high-suitable habitats, the current location and the shifting path were located at much lower latitudes for the centroid of the dual high-suitable habitats.

4. Discussion

Rapid climate changes have affected forest ecosystems and species habitats [35]. Thus, the distribution of suitable habitats of C. acuminata may also have been affected. Climatic niche-based ecological models have been widely used to predict the spatial distribution of the suitable habitats of species and project their future shifts under various climate change scenarios [16,36]. Such information can be used to guide management forest resources for adaptation to climate change [36,37]. Although most of the niche-based models involve only climatic variables [16], soil properties are often recommended to be considered, especially for practical applications [38]. In this study, we applied a novel two-step approach to incorporate the soil variables into the future projections without compromising the contribution of climate or soil variables. Thus, our projections of suitable habitats for C. acuminata may provide a more credible basis for forest conservation and adaptation to climate change.

4.1. Predicted Suitable Habitats Using Both Climatic and Soil Variables

Using only climate variables is the mainstream in building niche-based models [16,17,18]. Within a suitable climate niche, the distribution of a species may be restrained by soil conditions. Thus, a number of studies included both climate and soil variables in the same models [20,21]. However, the inclusion of soil variables in a niche-based model may compromise the role of climatic variables or soil variables due to correlations between the variables in the two categories [39]. As a result, it can either compromise the credibility of future predictions as soil variables are treated as constants or mask the soil effect by climate variables. In our case, climate variables (91.6% contribution to the model) clearly masked the contribution from soil variables (8.4%) in the combined model. However, the contribution of each climate variable was also reduced to some extent relative to that in the climatic model. These results suggest that the combined model basically does not represent the effect of soil, while the climatic effect is also slightly compromised. We avoided this problem by using a novel two-step approach. We first predicted the total areas with suitable climate conditions (the climatic niche) for the species—within which, suitable soil conditions may not be available in some areas. Our second step was to exclude such areas where soil conditions were not suitable. This approach can better reflect the true nature of climate and soil variables in determining the distribution of the species than that including both climate and soil variables into the same model. The accuracy of both climate and soil models for C. acuminata were high, with the AUC values greater than 0.9. The spatial predictions of suitable habitats for this species by the two models were in high agreement, especially for the high-suitable habitat areas. The restraint of soil conditions on climate habitats exhibited mainly in low-suitable habitat areas, which was expected.
From the perspective of climate conditions, we found that three climate variables had major contributions to the climatic niche model for C. acuminata. Two of them were temperature-related variables (DD < 0 and TD) and one precipitation variable (MAP). However, the contribution of DD < 0 was very dominant (80%) over the other two variables, suggesting the suitable climate habitats of this species being mainly restrained by low temperatures, with DD < 0 not greater than 25 °C (Figure 2). The suitable range of MAP, the second-most important climate variable, was between 1100 mm and 2000 mm, suggesting that this species also requires relatively high precipitation. For soil variables, we found that T-BS (32%), S-GRAVEL (23%), and S-CLAY (18%) were important factors for predicting the distribution of C. acuminata. T-BS is related to topsoil effective nutrient contents; thus, it is unsurprisingly the most important soil factor in our soil niche model. The content of gravel in the underlying soil (S-GRAVEL) affects the respiration and water absorption of the roots of C. acuminata, and the clay content provides higher soil organic carbon; the nutrient-holding and water-holding capacities of organic components contributes significantly to the growth of C. acuminata. As soil conditions are strongly affected by climate in the long term, climate change will eventually impact the soil conditions, although this process would be much slower than the rate of climate change. So far, no prediction is available for future soil conditions, and thus, soil variables can only be treated as constants in projecting species suitable habitats for future periods.

4.2. Impact of Climate Change

Our future projections show that the potentially climatic suitable habitats of C. acuminata would slightly expand under future climate scenarios. The magnitude of the northward expansion was much smaller than the projections for tree species in North America [40,41]. However, it is comparable to the future projections for the species distributed in the same region of C. acuminata, including Chinese fir and Masson pine [42]. The small impact of climate change on the habitats of C. acuminata can also be explained by the two most important contributing climate factors, DD < 0 and MAP. Although increasing temperatures due to climate change would expand the climate habitats of this species northward based on DD < 0, the change in MAP was projected to be small in future climates and not able to change the low precipitation status north of China, thus limiting the northward expansion of this species. Projected drought increases in North China, particularly in Dry Belt, may impose a serious challenge to forests, as well as the benefits of forests to mitigate climate change [43].
After being filtered by soil habitats, the area of the total suitable habitats still showed some increase but at a smaller magnitude than the climate habitats alone. This was expected, as the soil habitats were assumed static, and the shift of climatic habitats would cause some breakdown of the matches between climatic and soil habitats. This was evident for the high- and low-suitable habitats, and some of them were probably shifted to moderate-suitable habitats, as the expansion of this type was substantial. Eastern Sichuan Province, which was in the high-suitable habitats of C. acuminata at present, would be transformed into low-suitable habitats by the end of this century. More suitable habitats for C. acuminata would occur in Jiangsu, Anhui, and Henan in the future. On the other hand, some areas in Yunnan, Guangdong, and Guangxi Provinces would become unsuitable for C. acuminata in future climates.
It is worthy of note that our future projections are merely to represent suitable climate and soil conditions for C. acuminata to grow rather than projections of the species distribution in the future. Future species distributions would also be affected by many nonclimate and nonsoil factors, such as biotic interactions, seed dispersal, etc. [44], as well human interventions and disturbances, which are substantial or even greater than all biological factors in some regions.

4.3. Implications for Commercial Forest Management

Forest managers are interested in having their commercial plantations established in the most favorable environmental conditions. To address this, we generated projections for the dual high-suitable habitats, which was the combination of the high-suitable climatic habitats and the high-suitable soil habitats. Interestingly, the projected dual high-suitable habitats showed substantial increases in the 2020s and 2050s, while the high-suitable habitats were projected to decrease in the same periods. These inconsistent shifts were due to the matching between the climate and soil layers. The dual high-suitable habitats were only about 30% of the high-suitable habitats, and its near-future projections were better-matched with the soil high-suitable habitats than the high-suitable habitats. The shifting paths of the centroids of the dual high-suitable habitats were also located at much lower latitudes than the suitable-habitats, although their shifting directions were in parallel. The dual high-suitable habitats of C. acuminata were currently distributed along the latitude 28° N in China, including the junctions of Guizhou and Guangxi; Hunan and Guangdong; and Fujian, Jiangxi, and Zhejiang. In the future, these would move to near 30° N, including Hunan, Jiangxi, and Zhejiang. The current projections for the dual high-suitable habitats would support forest managers planning their plantations for commercial use to meet the growing market demand.

4.4. Implications for Genetic Conservation

The conservation of forest genetic resources has become a major concern due to climate change [45,46]. Fragmentations due to human activities have resulted in a lower level of gene flow and a higher level of genetic differentiation among populations of C. acuminata than that of other species in the region [47]. Thus, protections of local populations appear important. Projections of the shift in suitable habitats can help to develop conservation strategies [44]. We recommend that in situ conservation should be the main conservation measure for C. acuminata, as most of its current suitable habitats were projected to remain in future climates. In situ conservation allows the populations to evolve to adapt to changing environments. The shifts among the three levels of suitable habitats in a changing climate revealed in this study may impose selection pressure to promote evolutionary processes for adaptation. Our predictions show that C. acuminata has a high risk of habitat loss in the low latitudes under future climates. To prevent the loss of genetic resources in those areas, ex situ conservation through seed storage and assisted migration of the local genetic resources to potentially suitable locations are recommended in these areas.

5. Conclusions

We built niche-based models considering both climate and soil variables and mapped spatial distributions of their suitable habitats for the economically and medicinally important forest tree species C. acuminata. We applied a novel approach to integrate the predictions generated by the two models for the current and future climates under different climate-change scenarios. Our future projections indicate that climate change would have a relatively small impact on suitable habitats of this species as a whole, as a low temperature is the dominant limiting factor but would cause shifts among different levels of suitability. The dual high-suitable habitats showed a trend of increase up to the 2050s, which would be favorable for commercial plantations. Our results may provide guidance for the silviculture and conservation planning of this species.

Author Contributions

G.W. and T.W. conceived and designed the experiments; L.F., J.S., and Y.S. performed the experiments, analyzed the data, and wrote the manuscript; and T.W. revised the manuscript. All authors have read and agreed to the published version of the manuscript.

Funding

This research was funded by the National Key Research and Development Program of China (2017YFD0600700) and the Agricultural Science and Technology Independent Innovation Funds of Jiangsu Province (CX (16) 1005).

Conflicts of Interest

The authors declare no conflict of interest.

References

  1. Hsiang, Y.H.; Hertzberg, R.; Hecht, S.; Liu, L.F. Camptothecin induces protein-linked DNA breaks via mammalian DNA topoisomerase I. J. Biol. Chem. 1985, 260, 14873–14878. [Google Scholar]
  2. Zhang, Y.; Jiang, K.; Qing, D.; Bing, H.; Jiang, J.; Wang, S.; Yan, C. Accumulation of camptothecin and 10-hydroxycamptothecin and the transcriptional expression of camptothecin biosynthetic genes in Camptotheca acuminata cambial meristematic and dedifferentiated cells. RSC Adv. 2017, 7, 12185–12193. [Google Scholar] [CrossRef] [Green Version]
  3. Lorence, A.; Nessler, C.L. Camptothecin, over four decades of surprising findings. Phytochemistry 2004, 65, 2735–2749. [Google Scholar] [CrossRef] [PubMed]
  4. Zhao, D.; Zhang, X.; Wang, R.; Liu, D.; Sun, J.; Tao, J. Herbaceous peony tryptophan decarboxylase confers drought and salt stresses tolerance. Environ. Exp. Bot. 2019, 162, 345–356. [Google Scholar] [CrossRef]
  5. Chen, I.C.; Hill, J.K.; Ohlemüller, R.; Roy, D.B.; Thomas, C.D. Rapid Range Shifts of Species Associated with High Levels of Climate Warming. Science 2011, 333, 1024–1026. [Google Scholar] [CrossRef] [PubMed]
  6. Thomas, C.D.; Cameron, A.; Green, R.E.; Bakkenes, M.; Beaumont, L.J.; Collingham, Y.C.; Erasmus, B.F.; De Siqueira, M.F.; Grainger, A.; Hannah, L. Extinction risk from climate change. Nature 2004, 427, 145–148. [Google Scholar] [CrossRef] [PubMed]
  7. Peterson, M.L.; Doak, D.F.; Morris, W.F. Incorporating local adaptation into forecasts of species’ distribution and abundance under climate change. Glob. Chang. Biol. 2019, 25, 775–793. [Google Scholar] [CrossRef]
  8. Murray, N.J.; Keith, D.A.; Bland, L.M.; Ferrari, R.; Lyons, M.B.; Lucas, R.; Pettorelli, N.; Nicholson, E. The role of satellite remote sensing in structured ecosystem risk assessments. Sci. Total Environ. 2018, 619, 249–257. [Google Scholar] [CrossRef] [Green Version]
  9. Pearson, R.G.; Raxworthy, C.J.; Nakamura, M.; Peterson, A.T. Original Article: Predicting species distributions from small numbers of occurrence records: A test case using cryptic geckos in Madagascar. J. Biogeogr. 2007, 34, 102–117. [Google Scholar] [CrossRef]
  10. Li, G.; Du, S.; Wen, Z. Mapping the climatic suitable habitat of oriental arborvitae (Platycladus orientalis) for introduction and cultivation at a global scale. Sci. Rep. 2016, 6, 30009. [Google Scholar] [CrossRef] [Green Version]
  11. Guevara, L.; Gerstner, B.E.; Kass, J.M.; Anderson, R.P. Toward ecologically realistic predictions of species distributions: A cross-time example from tropical montane cloud forests. Glob. Chang. Biol. 2017, 24, 1511–1522. [Google Scholar] [CrossRef] [PubMed]
  12. Esfanjani, J.; Ghorbani, A.; Chahouki, M.A.Z. MaxEnt Modeling for Predicting Impacts of Environmental Factors on the Potential Distribution of Artemisia aucheri and Bromus tomentellus-Festuca ovina in Iran. Pol. J. Environ. Stud. 2018, 27, 1041–1047. [Google Scholar] [CrossRef]
  13. Mungi, N.A.; Coops, N.C.; Ramesh, K.; Rawat, G.S. How global climate change and regional disturbance can expand the invasion risk? Case study of Lantana camara invasion in the Himalaya. Biol. Invasions 2018, 20, 1849–1863. [Google Scholar] [CrossRef]
  14. Linhoss, A.C.; Underwood, W.V. Modeling Salt Panne Land-Cover Suitability under Sea-Level Rise. J. Coast. Res. 2016, 32, 1116–1125. [Google Scholar] [CrossRef]
  15. Ashoori, A.; Kafash, A.; Varasteh Moradi, H.; Yousefi, M.; Kamyab, H.; Behdarvand, N.; Mohammadi, S. Habitat modeling of the common pheasant Phasianus colchicus (Galliformes: Phasianidae) in a highly modified landscape: Application of species distribution models in the study of a poorly documented bird in Iran. Eur. Zool. J. 2018, 85, 372–380. [Google Scholar] [CrossRef] [Green Version]
  16. Araujo, M.B.; Peterson, A.T. Uses and misuses of bioclimatic envelope modeling. Ecology 2012, 93, 1527–1539. [Google Scholar] [CrossRef] [Green Version]
  17. Keith, D.A.; Akcakaya, H.R.; Thuiller, W.; Midgley, G.F.; Pearson, R.G.; Phillips, S.J.; Regan, H.M.; Araujo, M.B.; Rebelo, T.G. Predicting extinction risks under climate change: Coupling stochastic population models with dynamic bioclimatic habitat models. Biol. Lett. 2008, 4, 560–563. [Google Scholar] [CrossRef]
  18. Anderson, B.J.; Akcakaya, H.R.; Araujo, M.B.; Fordham, D.A.; Martinez-Meyer, E.; Thuiller, W.; Brook, B.W. Dynamics of range margins for metapopulations under climate change. Proc. R. Soc. B Biol. Sci. 2009, 276, 1415–1420. [Google Scholar] [CrossRef] [Green Version]
  19. Woodward, F.I.; Williams, B.G. Climate and plant distribution at global and local scales. Vegetation 1987, 69, 189–197. [Google Scholar] [CrossRef]
  20. Volis, S.; Zhang, Y.H.; Deng, T.; Dorman, M.; Blecher, M.; Abbott, R.J. Divergence and reproductive isolation between two closely related allopatric Iris species. Biol. J. Linn. Soc. 2019, 127, 377–389. [Google Scholar] [CrossRef]
  21. Zuquim, G.; Costa, F.R.C.; Tuomisto, H.; Moulatlet, G.M.; Figueiredo, F.O.G. The importance of soils in predicting the future of plant habitat suitability in a tropical forest. Plant Soil 2019, 450, 151–170. [Google Scholar] [CrossRef] [Green Version]
  22. Figueiredo, F.O.G.; Zuquim, G.; Tuomisto, H.; Moulatlet, G.M.; Balslev, H.; Costa, F.R.C. Beyond climate control on species range: The importance of soil data to predict distribution of Amazonian plant species. J. Biogeogr. 2018, 45, 190–200. [Google Scholar] [CrossRef]
  23. Syphard, A.D.; Franklin, J. Differences in spatial predictions among species distribution modeling methods vary with species traits and environmental predictors. Ecography 2009, 32, 907–918. [Google Scholar] [CrossRef]
  24. Dormann, C.F.; Elith, J.; Bacher, S.; Buchmann, C.; Carl, G.; Carré, G.; Marquéz, J.R.G.; Gruber, B.; Lafourcade, B.; Leitão, P.J.; et al. Collinearity: A review of methods to deal with it and a simulation study evaluating their performance. Ecography 2013, 36, 27–46. [Google Scholar] [CrossRef]
  25. Varela, S.; Anderson, R.P.; Garciavaldes, R.; Fernandezgonzalez, F. Environmental filters reduce the effects of sampling bias and improve predictions of ecological niche models. Ecography 2014, 37, 1084–1091. [Google Scholar] [CrossRef]
  26. Wang, T.; Wang, G.; Innes, J.L.; Seely, B.; Chen, B. ClimateAP: An application for dynamic local downscaling of historical and future climate data in Asia Pacific. Front. Agric. Sci. Eng. 2017, 4, 448–458. [Google Scholar] [CrossRef] [Green Version]
  27. Fischer, G.; Velthuizen, H.V.; Shah, M.; Nachtergaele, F. Global AgroEcological Assessment for Agriculture in the 21st Century; International Institute for Applied Systems Analysis: Laxenburg, Austria, 2002. [Google Scholar]
  28. Koeling, R. Chunking with maximum entropy models. In Proceedings of the Conference on Computational Natural Language Learning, Lisbon, Portugal, 13–14 September 2000; pp. 139–141. [Google Scholar]
  29. Yang, X.Q.; Kushwaha, S.P.S.; Saran, S.; Xu, J.; Roy, P.S. Maxent modeling for predicting the potential distribution of medicinal plant, Justicia adhatoda L. in Lesser Himalayan foothills. Ecol. Eng. 2013, 51, 83–87. [Google Scholar] [CrossRef]
  30. Guo, J.; Liu, X.P.; Zhang, Q.; Zhang, D.F.; Liu, X. Prediction for the potential distribution area of Codonopsis pilosula at global scale based on Maxent model. J. Appl. Ecol. 2017, 28, 992–1000. [Google Scholar]
  31. Lu, C.Y.; Gu, W.; Dai, A.H.; Wei, H.Y. Assessing habitat suitability based on geographic information system (GIS) and fuzzy: A case study of Schisandra sphenanthera Rehd. et Wils. in Qinling Mountains, China. Ecol. Model. 2012, 242, 105–115. [Google Scholar] [CrossRef]
  32. Hanley, J.A.; Mcneil, B.J. The meaning and use of the area under a receiver operating characteristic (ROC) curve. Radiology 1982, 143, 29–36. [Google Scholar] [CrossRef] [Green Version]
  33. Swets, J.A. Measuring the accuracy of diagnostic systems. Science 1988, 240, 1285–1293. [Google Scholar] [CrossRef] [PubMed] [Green Version]
  34. Zhang, K.; Yao, L.; Meng, J.; Tao, J. Maxent modeling for predicting the potential geographical distribution of two peony species under climate change. Sci. Total Environ. 2018, 634, 1326–1334. [Google Scholar] [CrossRef] [PubMed]
  35. Koralewski, T.E.; Wang, H.H.; Grant, W.E.; Byram, T.D. Plants on the move: Assisted migration of forest trees in the face of climate change. For. Ecol. Manag. 2015, 344, 30–37. [Google Scholar] [CrossRef]
  36. Keenan, R.J. Climate change impacts and adaptation in forest management: A review. Ann. For. Sci. 2015, 72, 145–167. [Google Scholar] [CrossRef] [Green Version]
  37. Pecchi, M.; Marchi, M.; Burton, V.; Giannetti, F.; Moriondo, M.; Bernetti, I.; Bindi, M.; Chirici, G. Species distribution modelling to support forest management. A literature review. Ecol. Model. 2019, 411, 108817. [Google Scholar] [CrossRef]
  38. Antúnez, P.; Suárez-Mota, E.M.; Valenzuela-Encinas, C.; Ruiz-Aquino, F. The Potential Distribution of Tree Species in Three Periods of Time under a Climate Change Scenario. Forests 2018, 9, 628. [Google Scholar] [CrossRef] [Green Version]
  39. Sehler, R.; Li, J.; Reager, J.; Ye, H. Investigating Relationship Between Soil Moisture and Precipitation Globally Using Remote Sensing Observations. J. Contemp. Water Res. Educ. 2019, 168, 106–118. [Google Scholar] [CrossRef] [Green Version]
  40. Wang, T.; Campbell, E.M.; O’Neill, G.A.; Aitken, S.N. Projecting future distributions of ecosystem climate niches: Uncertainties and management applications. For. Ecol. Manag. 2012, 279, 128–140. [Google Scholar] [CrossRef]
  41. Rehfeldt, G.E.; Crookston, N.L.; Warwell, M.V.; Evans, J.S. Empirical analyses of plant-climate relationships for the western United States. Int. J. Plant Sci. 2006, 167, 1123–1150. [Google Scholar] [CrossRef]
  42. Wang, T.; Wang, G.; Innes, J.; Nitschke, C.; Kang, H. Climatic niche models and their consensus projections for future climates for four major forest tree species in the Asia—Pacific region. For. Ecol. Manag. 2016, 360, 357–366. [Google Scholar] [CrossRef]
  43. Mátyás, C.; Sun, G. Forests in a water limited world under climate change. Environ. Res. Lett. 2014, 9, 085001. [Google Scholar] [CrossRef] [Green Version]
  44. Aitken, S.N.; Yeaman, S.; Holliday, J.A.; Wang, T.; Curtis-McLane, S. Adaptation, migration or extirpation: Climate change outcomes for tree populations. Evol. Appl. 2008, 1, 95–111. [Google Scholar] [CrossRef] [PubMed]
  45. Campbell, E.M.; Antos, J.A. Distribution and severity of white pine blister rust and mountain pine beetle on whitebark pine in British Columbia. Can. J. For. Res. 2000, 30, 1051–1059. [Google Scholar] [CrossRef]
  46. Allendorf, F.W.; Luikart, G.; Aitken, S.N. Conservation and the Genetics of Populations, 2nd ed.; Blackwell Publishing: Malden, MA, USA, 2012; p. 624. [Google Scholar]
  47. Wang, Y.; Clack, B.; Li, S. Genetic Diversity in Camptotheca Decaisne. Pharm. Crop. 2014, 5, 120–134. [Google Scholar]
Figure 1. Distribution points of Camptotheca acuminata.
Forests 11 00891 g001
Figure 2. Response curves of the three important climate variables (ac) and the three important soil variables (df) in the MaxEnt climatic and soil models, respectively. The maximum entropy logistic output (also known as habitat suitability) is represented by the vertical Y-axis and the variable by the horizontal X-axis. When the logical output value is greater than 0.5, the probability of species presence under this condition is higher than that under a “typical” condition, which indicates that the condition is suitable for the species. The red curves shown are the averages over 10 replicate runs; blue margins show ± 1 standard deviation (SD) calculated over 10 replicates.
Forests 11 00891 g002
Figure 3. Distributions of the current (1960–1990) suitable habitats of C. acuminata in China: (a) climatic habitats, (b) soil habitats, (c) climatic habitats filtered by the soil habitats, and (d) dual high-suitable habitats.
Forests 11 00891 g003
Figure 4. Suitable habitats of C. acuminata in China for climatic (1st row), soil-filtered climatic (2nd row), and dual high-suitable habitats (3rd row) in the 2020s, 2050s, and 2080s under RCP4.5, respectively.
Forests 11 00891 g004
Figure 5. Suitable habitats of C. acuminata in China for climatic (1st row), soil-filtered climatic (2nd row), and dual high-suitable habitats (3rd row) in the 2020s, 2050s, and 2080s under RCP8.5, respectively.
Forests 11 00891 g005
Figure 6. Shifts of centroids of the high-suitable and the dual high-suitable habitats of C. acuminata. The dotted line indicates the shifting path of high-suitable habitats. The solid line indicates the shifting path of dual high-suitable habitats.
Forests 11 00891 g006
Table 1. List of the climate variables. Variables in bold are selected for model building.
CodeDescriptionCodeDescription
MATMean annual temperature (℃)DD > 5Degree-days above 5 ℃, growing degree-days
MWMTMean warmest month temperature (℃)DD < 0Degree-days below 0 ℃, chilling degree-days
MCMTMean coldest month temperature (℃)NFFDNumber of frost-free days
TDTemperature difference between MWMT and MCMT, or continentality (℃)PASPrecipitation as snow (mm)
MAPMean annual precipitation (mm)EMTExtreme minimum temperature over 30 years
EXTExtreme maximum temperature over 30 yearsErefHargreaves reference evaporation
AHMAnnual heat:moisture index (MAT+10)/(MAP/1000))CMDHargreaves climatic moisture deficit
DD < 18Degree-days below 18 °CDD > 18Degree-days above 18 °C
Table 2. List of the soil variables. Variables in bold are selected for model building.
CodeDescriptionCodeDescription
T-GRAVELTopsoil Gravel ContentS-GRAVELSubsoil Gravel Content
T-SANDTopsoil Sand FractionS-SANDSubsoil Sand Fraction
T-SILTTopsoil Silt FractionS_SILTSubsoil Silt Fraction
T-CLAYTopsoil Clay FractionS-CLAYSubsoil Clay Fraction
T_REF_BULK_DENSITYTopsoil bulk densityS_REF_BULK_DENSITYSubsoil bulk density
T-OCTopsoil Organic CarbonS-OCSubsoil Organic Carbon
T-PH-H2OTopsoil pH (H 2 O)S-PH-H2OSubsoil pH (H 2 O)
T-CEC-CLAYTopsoil CEC (clay)S-CEC-CLAYSubsoil CEC (clay)
T-CEC-SOILTopsoil CEC (soil)S-CEC-SOILSubsoil CEC (soil)
T-BSTopsoil Base SaturationS-BSSubsoil Base Saturation
T-TEBTopsoil TEBS-TEBSubsoil TEB
T-CACO3Topsoil Calcium CarbonateS-CACO3Subsoil Calcium Carbonate
T-CASO4Topsoil GypsumS-CASO4Subsoil Gypsum
T-ESPTopsoil Sodicity (ESP)S-ESPSubsoil Sodicity (ESP)
T-ECETopsoil Salinity (Elco)S-ECESubsoil Salinity (Elco)
Table 3. Contributions of the environmental variables to the models.
ModelVariableUnitContribution (%)
DD < 080.7
MAPmm6.3
ClimaticTD4.3
CMDmm3.8
PASmm3.1
DD > 181.9
T-BS%31.8
S-GRAVEL%22.7
S-CLAY%18.4
S-CASO4%7.1
T-CEC-CLAY 5.8
SoilS-ESP 2.9
S-CEC-CLAY 2.9
T-TEB 2.7
T-GRAVEL%1.9
T-REF-BULK 1.7
T-SILT%1.2
S-CACO3%0.9
DD < 079.6
MAPmm4.4
T-BS%3.2
TD2.8
CMDmm2.7
DD > 181.5
Climatic + SoilS-CASO4%1.5
T-GRAVEL%1.3
PASmm0.6
T-CEC-CLAY 0.5
S-ESP 0.4
S-CLAY%0.4
T-REF-BULK 0.4
S-GRAVEL%0.2
T-SILT%0.2
S-CEC-CLAY 0.1
S-CACO3%0.1
T-TEB 0.1
Table 4. Distribution areas of the current (1960–1990) habitat suitability of Camptotheca acuminata in China.
ClassesHigh-SuitableMedium-SuitableLow-SuitableUnsuitable
AreaProportionAreaProportionAreaProportionAreaProportion
km2%km2%km2%km2%
Climatic habitats260,1192.7799,6268.3693,6527.27,880,65881.8
Soil habitats568,4095.9973,03910.1404,6304.27,687,97779.8
Climatic habitats filtered by soil habitats246,4002.6733,2007.6463,0004.88,179,40085
Dual high-suitable habitats83,6000.87
Table 5. Area changes in soil habitat-filtered climatic habitats of C. acuminata relative to the current by the 2020s, 2050s, and 2080s under RCP4.5 and RCP8.5, respectively.
TimeCurrent Area (km2)Change by 2020s (%)Change by 2050s (%)Change by 2080s (%)
Emissions Scenarios RCP4.5RCP8.5RCP4.5RCP8.5RCP4.5RCP8.5
Climatic habitats1,758,000+7.2+11.3+7.7+10.1+9.5+25.3
High-suitable habitats246,400−2.8−3.2−4.2−4.9−28.7−24.6
Medium-suitable habitats733,200+14.8+18.6+17.4+23.135.2+59.8
Low-suitable habitats463,000−4.1−10−8.6−19.9−20.6−29.6
Total suitable habitats1,442,600+5.7+5.7+5.4+4.5+6.4+16.7
Dual high-suitable habitats83,600+98+105.3+100.5+66.1−12.7−20.5

