Article

Loosening of Bolted Connections under Transverse Loading in Timber Structures

School of Mechanical and Electronic Engineering, Nanjing Forestry University, Nanjing 210037, China
*
Author to whom correspondence should be addressed.
Forests 2020, 11(8), 816; https://doi.org/10.3390/f11080816
Submission received: 27 June 2020 / Revised: 22 July 2020 / Accepted: 23 July 2020 / Published: 28 July 2020
(This article belongs to the Special Issue Timber and Construction Structure)

Abstract

:
Bolted joints are widely used in timber structures, and the loosening of bolt connections will reduce the structural performance. In this paper, a mechanical model of bolt connection for timber structures is established, and the process of bolt loosening under a transverse load is investigated. By using the finite element method to construct an accurate thread model with a helix angle, the thread contact state during the bolt loosening procedure was analyzed in detail, and the factors such as load amplitude, load frequency, load location, and different timber materials on bolt loosening are also studied. In the timber structure, the load amplitude is the main factor affecting the bolt loosening, the decay rate of the preload in the bolted joint is positively correlated with the amplitude of the cyclic transverse load. The frequency of the loading has a smaller effect on the looseness, the preload decreases as the frequency increases. When the load is applied to the smooth rod part of the bolt, the preload force will decrease rapidly, and the distance between the load position and the bolt has no effect on the change in looseness. The decreasing range of the preload is different with different timber material, but the decreasing law is the same. The model can be applied to analyze the loosening rule of bolted connections in timber structures.

1. Introduction

Bolted connections have been widely applied to timber structures due to their advantages of a reliable connection and convenient operation. When a timber structure is subjected to continuous vibration load, the reduction of the reliability of the bolted connection may lead to the failure of the structure, and the loosening of the bolted joint is a key factor. Therefore, the loosening analysis of bolted connections in timber structures is of great significance in improving the performance of timber structures.
Investigations on loosening of bolted connection include experimental, theoretical, and numerical methods. Most of the test methods for the loosening problem were based on the classical Junker test device, Junker [1] proposed that the dynamic transverse load is more likely to cause loosening of the threaded connection than the axial load. The test results showed that when the transverse load is applied, the resultant force along the thread contact ramp may exceed the friction, which causes the relative movement of the fastener and causes the loosening of the bolt, Junker’s test has been widely recognized as the effective experimental method. Zhou [2] studied the effect of load amplitude and material under shear load, and the results showed that the amplitude of shear load at a critical point below which the bolt will not be completely loose. Ksentini [3] studied the related values of bolt assembly loosening under the transverse load. Jiang [4] analyzed the loosening performance of bolts in the connection structure of super-elastic shape memory alloy material. Yang [5] used a fatigue testing machine to detect the degree of bolt loosening under different amplitude conditions, obtained a bolt displacement-loose life curve, and established a linear cumulative model of bolt loosening, which can predict the bolt loosening life. Gong [6] studied the reduction mechanism of bolt preload under the transverse vibration and found a new reason for the reduction of preload, which is denoted as stress release and redistribution.
For the detection of bolt loosening, a bolt connection model based on fractal contact theory was constructed by Huo [7], piezoelectric transducers were adopted to monitor bolt loosening waves. Zhao [8] proposed a method to monitor the pretension of bolted connections in timber structures by pasting lead zirconate titanate (PZT) patches to reflect the looseness of bolts. Wang [9] compared the antiloosening effect of different composite bolted forms under high temperature vibration environment through a random vibration test. Xu [10] proposed a bolt loosening identification method based on a system nonlinear price reduction model and the experimental results showed that the model response solution could give a reliable and sensitive indication of bolt loosening. Zhang [11] collected quantitative audio of bolt loosening and used support vector machines to train and test the data to obtain quantitative detection of bolt loosening. Li [12] systematically studied the characteristics of the second-order output spectral transmittance along the physical structure of the sensor chain with bolts, and proposed a novel method based on the second-order output spectrum to detect multiple bolt loosening. Xu [13] modified the traditional time reversal method to detect bolt loosening, which improved the accuracy and sensitivity of the detection. Du [14] proposed a guided wave method based on a virtual time inversion (VTR) and tightness index representing refocusing capability for the monitoring of preload of single and multiple bolts. However, most bolt looseness detections are based on the fact that the bolted structure has been set up, which provides little help to the design and construction process of the bolted structure.
Some new methods were also used to detect the loosening of bolts. Wang [15] used a virtual material method and layering theory to equivalently simulate bolted connections as laminates, and can obtain the sound pressure level through acoustic radiation pattern methods to identify bolt loosening. Tuan-Cuong and Thanh-Canh [16,17] used image processing technology to identify the degree of bolt loosening by identifying the rotation angle of the nut from the picture through the Hough transform. Ramana [18] proposed a fully automated vision-based method for detecting loosened civil structural bolts using the Viola–Jones algorithm and support vector machines. Zhao [19] combined image processing with deep learning technology and after a large number of training models, the accuracy of bolt loosening angle recognition was improved. However, the contact state and force state of the contact surface between the bolt and the structure cannot be identified and detected.
The theoretical model of bolt loosening is often based on strong idealization assumptions. Yin [20] used a mathematical model to model and detect bolts loosening on periodically supported beam-type structures endowed with bolted flange joints by using measured modal parameters. Nassar [21] used sector division to calculate bending torque, thread contact pressure and friction, and rotational speed acceleration, then integrated to obtain the loosening process, and established a mathematical model for loosening, but most models ignored the area change of the thread contact portion and the corresponding pressure change, so accurate agreement with actual experimental results was not guaranteed. The finite element model of bolted connections has been constructed from a non-threaded bare rod model to an axisymmetric model, taken into account the rising angle of the thread. The establishment of the model was gradually approaching the reality, and the results of the simulation analysis have also evolved from the analysis of the change of the force to the analysis of the state changes of the various values of the bolt connection loosening process. Leite Vilela [22] has established a finite element analysis model of bolted connections that connects two or three plates, and was suitable for most bolted types. Jiang [23] used the thin-layer element method to identify the mechanical properties of the contact surface of the bolted structure, but cannot express the mechanical characteristics during loosening. Wi [24] has studied the self-loosening phenomenon of 3D printed bolts under transverse vibration through finite element analysis and experiments. Zhang [25] proposed a finite element model that considers the evolution of the wear profile of the thread surface to simulate self-loosening of the bolt under transverse load. Jiang [26] used the finite element analysis to study the bolt self-loosening mechanism in curvic coupling caused by the structural ratcheting under cyclic loading. Baek [27] determined the loosening mechanism of threaded fasteners for complex structures through finite element analysis and experiments. Gong [28] has studied the key factors that affect the loosening of the bolted connection in the finite element analysis. The bolt model with the thread rise angle provided more detailed data for the analysis of the process of the loosened bolted connection, but the huge calculation caused by this can easily lead to the phenomenon of non-convergence in the analysis, which makes the finite element simulation analysis slightly insufficient in practical applications. The establishment of a finite element model was usually a simplification of the actual situation, and the constraints on components such as nuts and screw heads vary from person to person. However, the bolt loosening phenomenon mainly occurs in the thread part. The establishment of the finite element model is relatively difficult. In addition, many factors that affect the bolt loosening need to be analyzed and determined. Most of the bolt loosening studies were based on the overlapping of steel structures, and few attempts have been made to investigate the bolt loosening analysis of structures facing anisotropic materials such as wood.
Aiming at the failure of bolted connections of timber structures, Zhang [29] studied the tensile properties of bolted connections of wood plywood with initial cracks through a three-dimensional model, and the results showed that the initial cracks can lead to a reduction in bearing capacity and stiffness. Kaliyanda [30] numerically simulated the deformation behavior of the wood–steel single-bolt connection structure under a double shear load, and provided a relevant reference basis. Shu [31] studied the rotational properties of glulam bolted connections, including the dispersion of joint performance, joint mechanical properties, and failure modes. Most of the failure studies of bolted connections in timber structures were based on the strength properties of timber structures, and few studies on the performance of bolted connections in timber structures under vibration loads [32,33].
In this paper, the loosening process of the bolted connection in the timber structure under the periodic transverse load was investigated. The change of the state of the surface between bolt and wood and the change of preload force were analyzed, and the effects of transverse load amplitude, frequency, position, and material on loosening were compared.

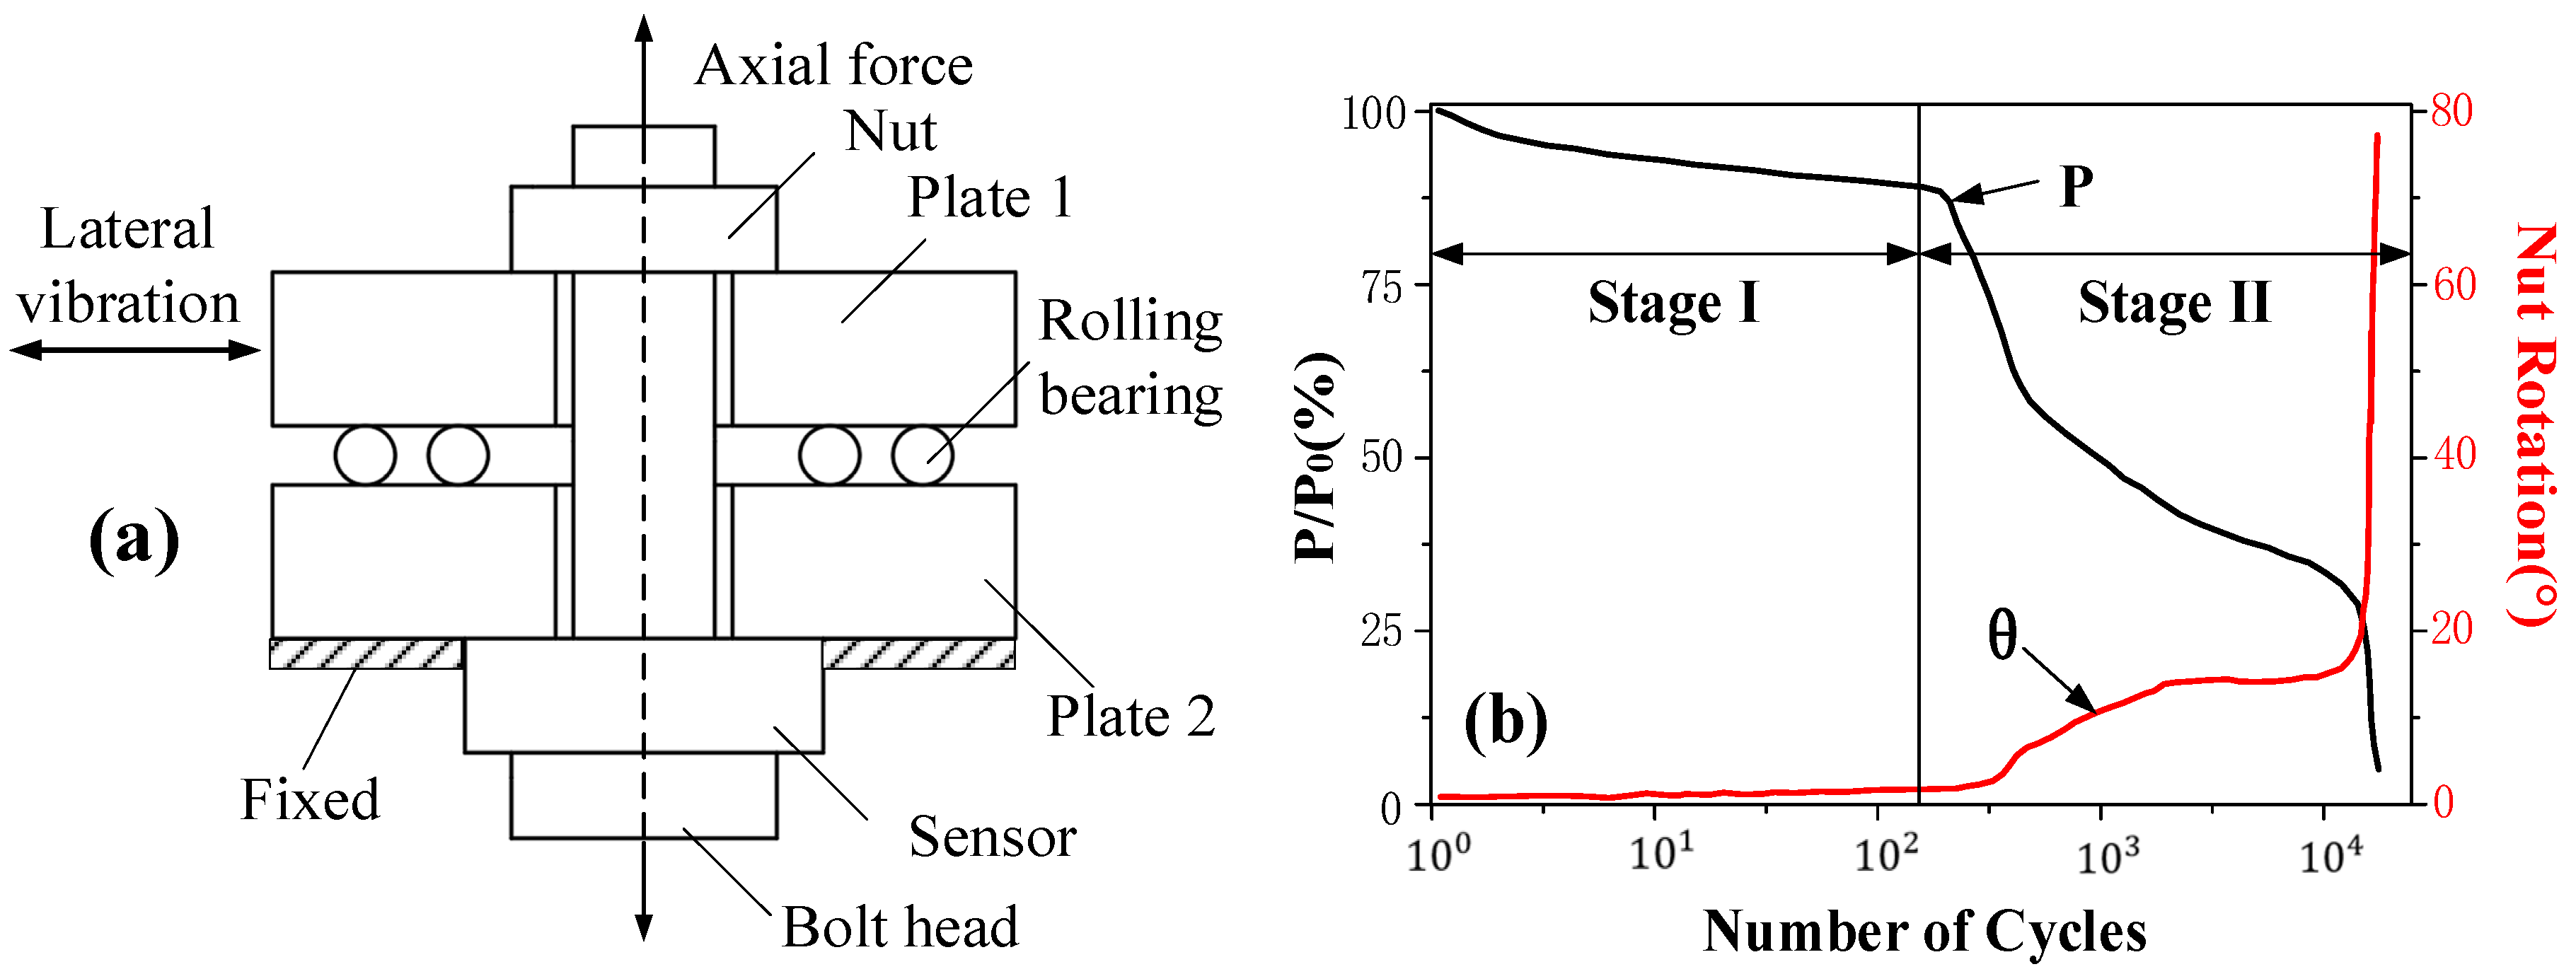
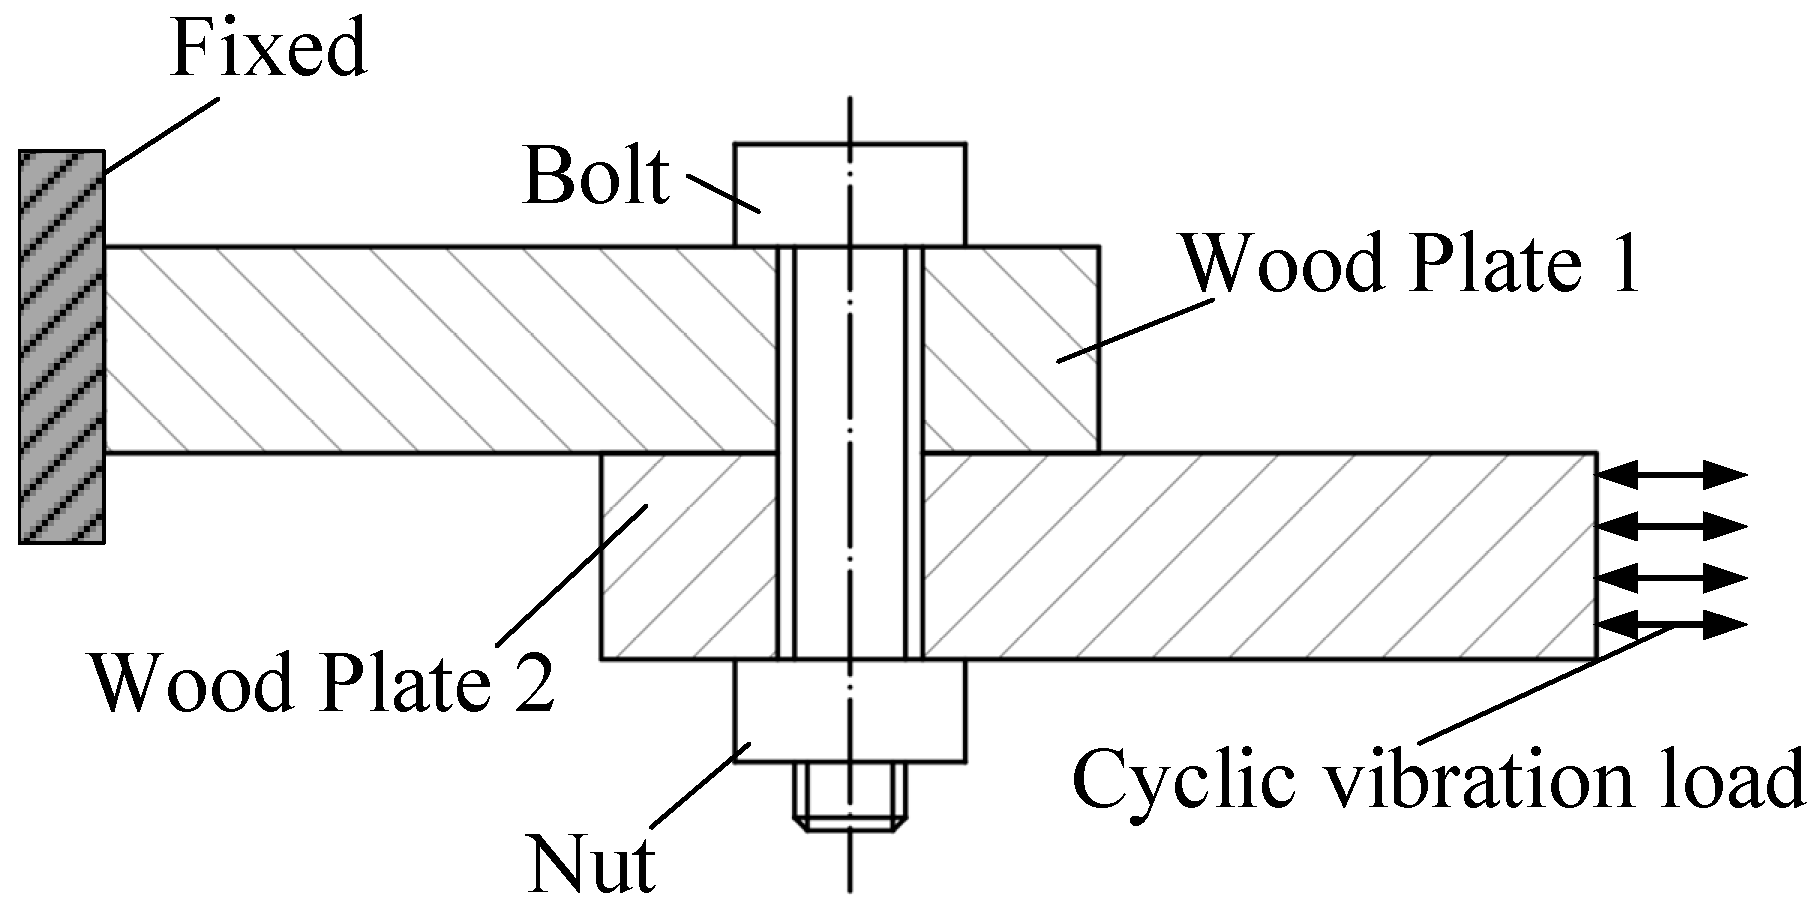
2. Problem Description

At present, most of the loosening studies of bolted connections were based on the steel connection structure. The standard test in the existing research was that the scholar Junker built a bolt loosening experimental device, as shown in Figure 1a. The bolt loosening test curve based on this is shown in Figure 1b [24]. P represents preload and θ represents the angle of nut rotation. When there is no relative motion between the nut and the bolt, the preload drop curve is in stage I. Once the bolt starts to rotate, the preload will drop rapidly (stage II curve), resulting in structural failure.
Vibration load is an important cause of loosening failure of bolted connections. Analysis of the loosening process of bolted connections of timber structures under vibration load is of great significance to the safety performance of bolted connections. Due to the difference in the material of wood and steel bolts, when the bolts are rotated, it often means that the wood has deformed and failed. Therefore, the study of the looseness of bolted connections of wooden structures was based on the loosening curve of stage I, and did not consider the plastic deformation of the wood. Based on this condition, the loosening behavior of the bolted connection of the wooden structure under the transverse vibration load was analyzed to provide some reference for the design of the bolted connection of the wooden structure. The research process of this paper is shown in Figure 2.

3. Materials and Methods

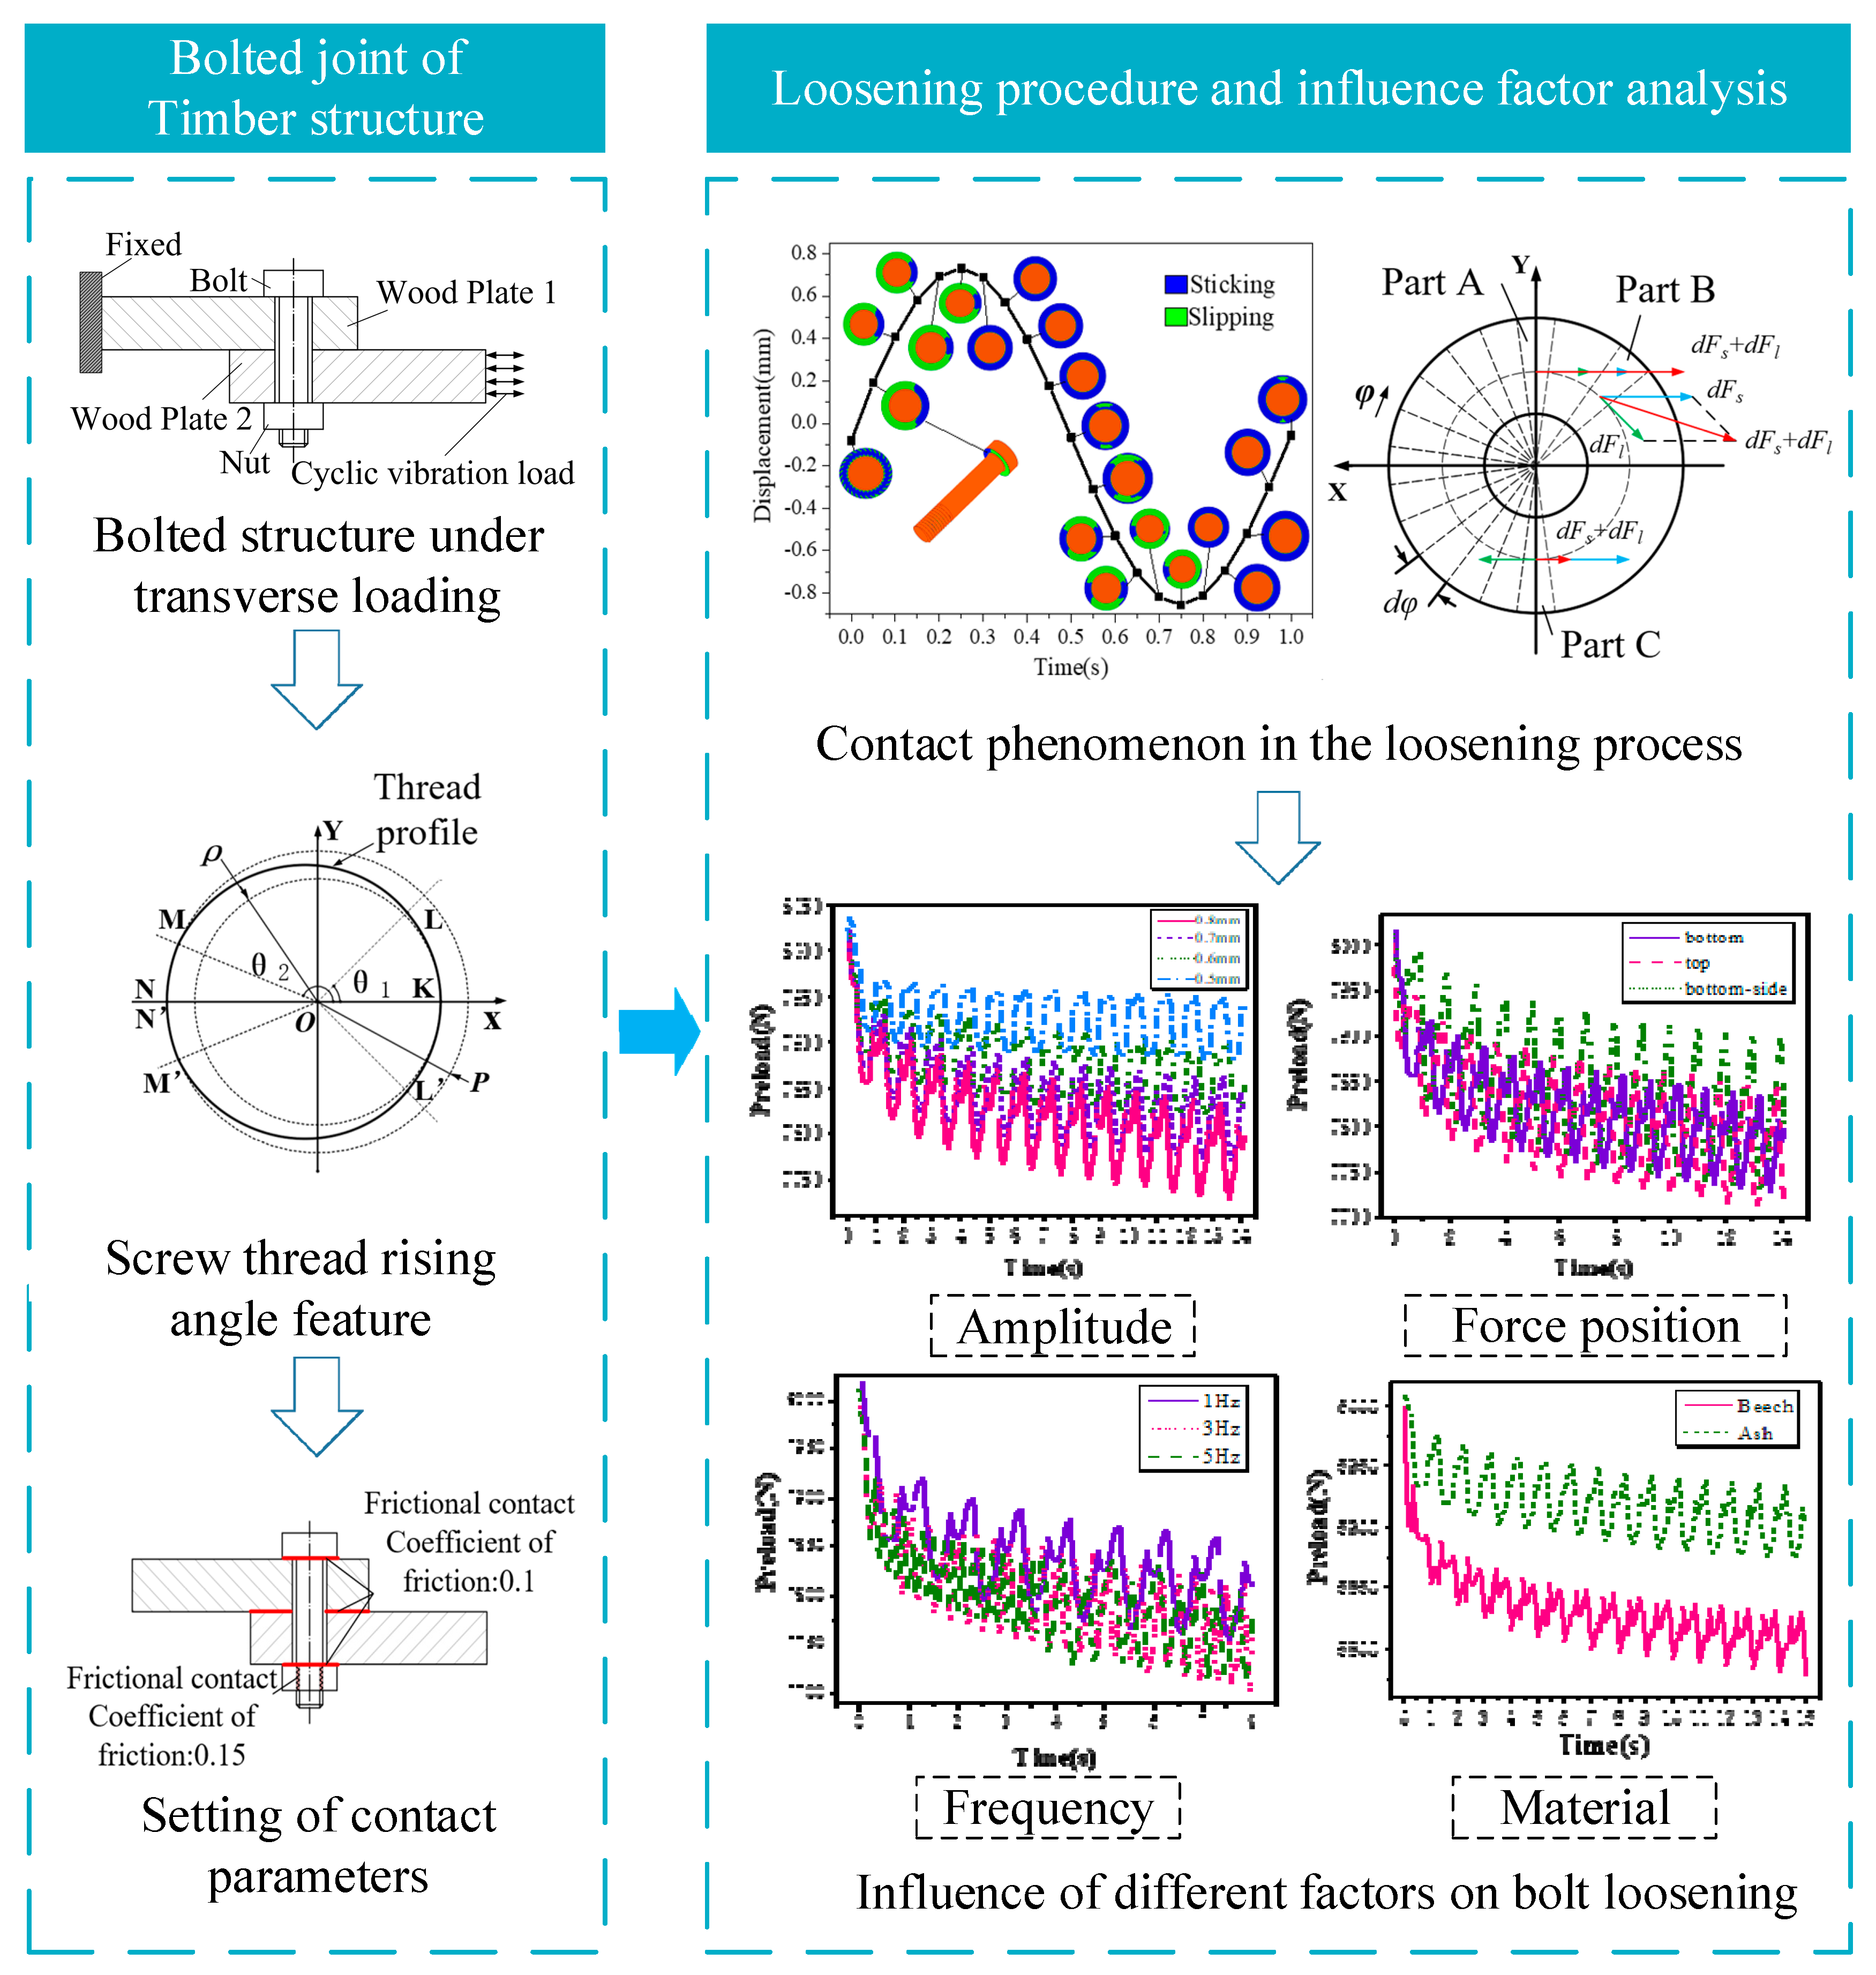
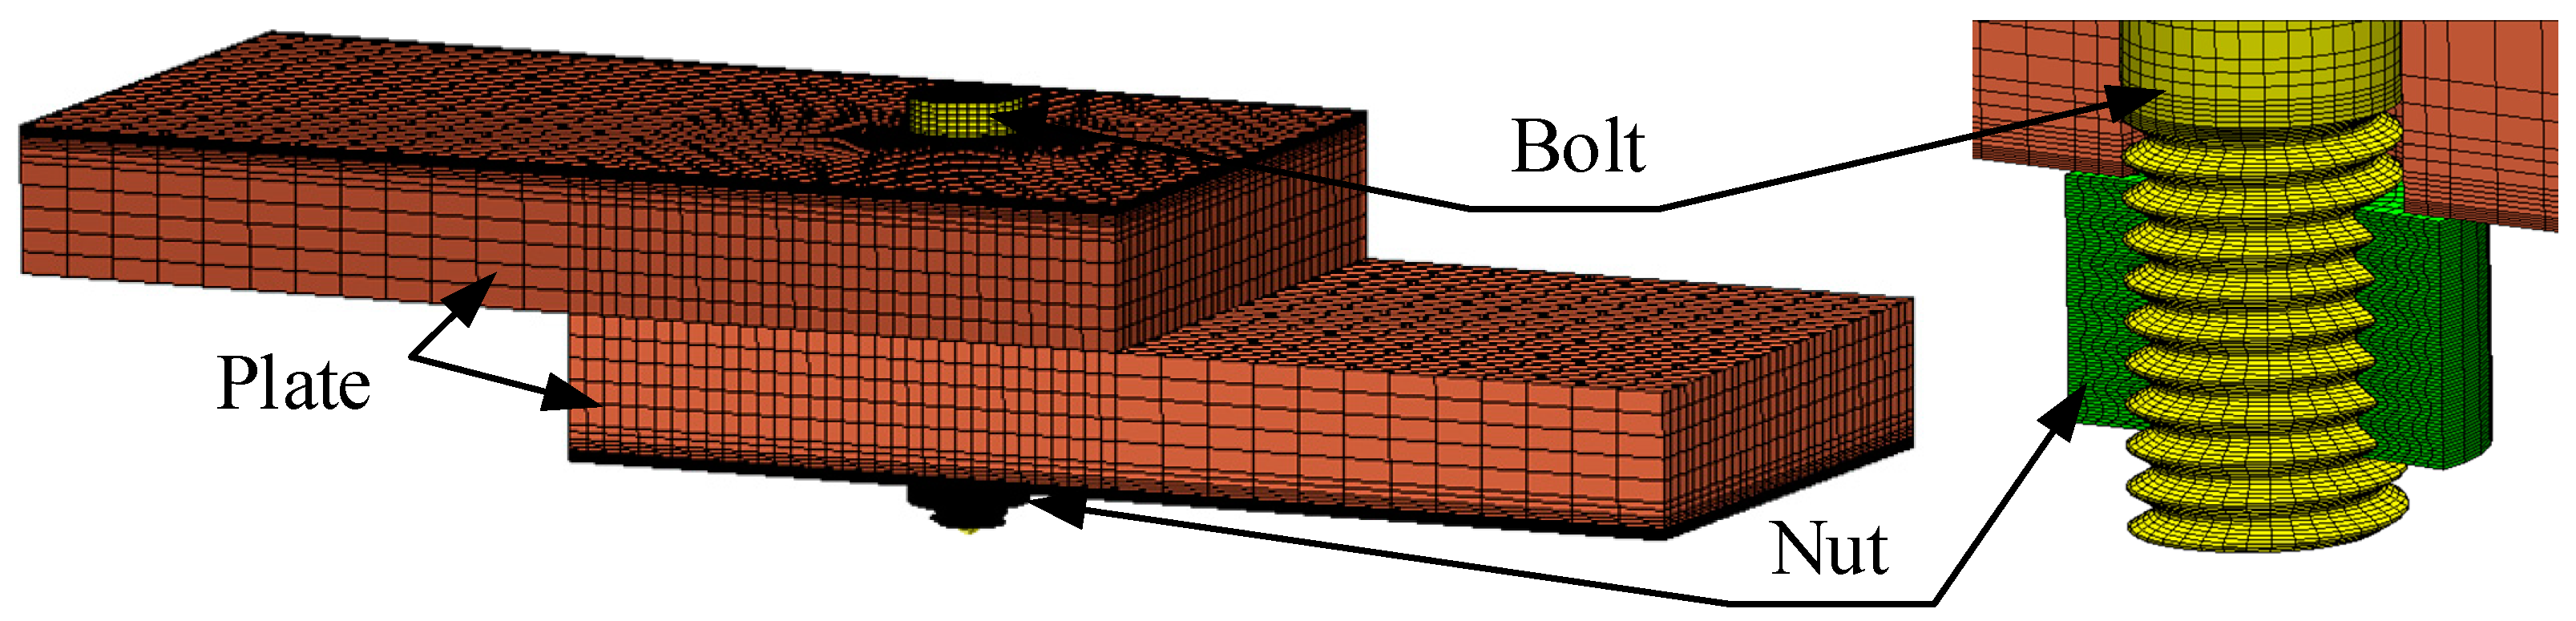
3.1. Single-Lap Bolted Joint in Timber Structure

In order to study the bolt loosening phenomenon in timber structures, a timber structure bolt connection model was set up for analysis. The model design refers to the classic Junker experimental model. As shown in Figure 3, it consisted of two wooden plate, one bolt and a nut. The size of the wooden plate was 160 mm × 80 mm × 20 mm. The bolt was an M10 bolt in the ASTM A194/A194M standard. The key parameters of the bolts were: the thread diameter was 10 mm, and the pitch was 1.5 mm, total bolt length was 58 mm, and thread length was 26 mm.
Due to the concentrated effect of local stress, the screw thread part of the bolt may be plastically deformed, which reduced the preload force. Gong’s research showed that the decrease in preload force caused by the shaping of the material is more obvious in the first few cycles of loading, and the effect of the shaping of the material afterwards is small, that is, after the ratchet effect caused by the plastic deformation of the material in the loosening period is stabilized, the material shaping has little effect on the loosening rate. Therefore, regardless of the influence of material shaping, an elastic model of the timber plate and bolt and nut was established. The bolt and nut were made of steel, and elastic modulus: E = 210   Gpa and Poisson ratio: v = 0.3 . The material of the timber plate was beech with high strength, and the elastic constant is shown in Table 1.

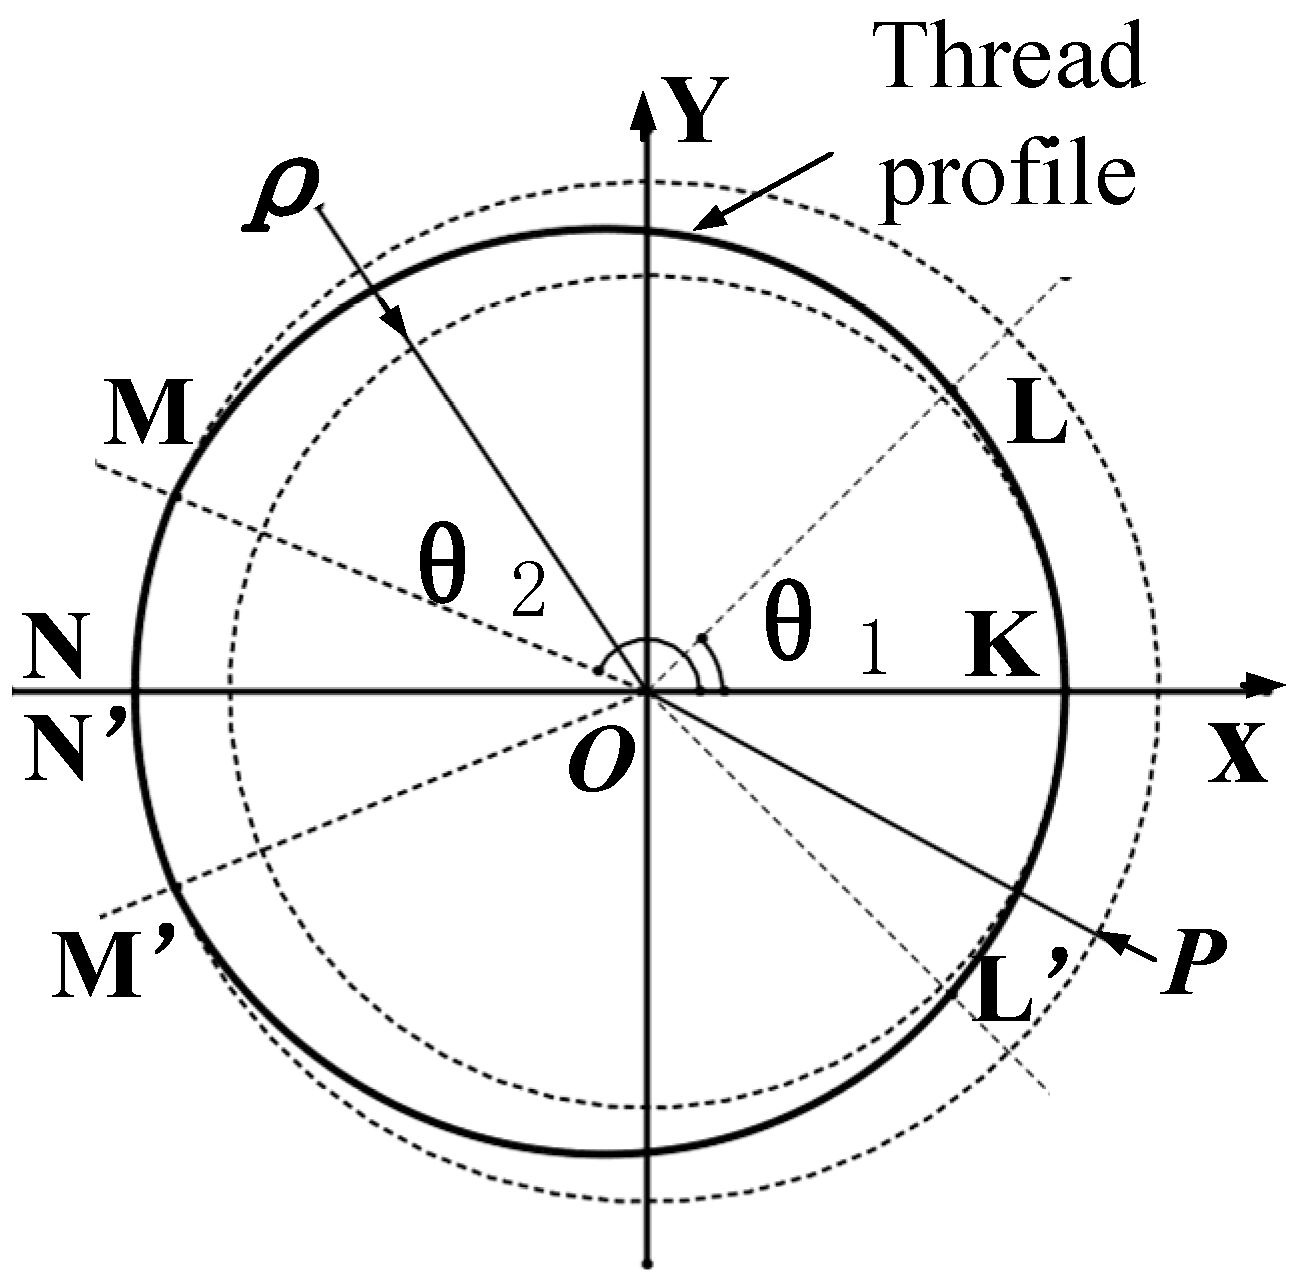
3.2. Modeling of the Thread

In the finite element analysis of bolted connections, the threaded part was simplified to an axisymmetric model, and the main analysis was the stress state, and the analysis time was relatively short. However, in the study of the loosening process of the bolt, the feature of the thread rising angle cannot be ignored in the connection structure, so the thread part must be accurately modeled. Fukuoka [34] proposed a hexahedral finite element modeling method that can accurately construct the geometry of bolt threads. This method expressed the external contour of the thread by equation (1), where θ 1 = 1 4 π ,   θ 2 = 7 8 π ,   ρ 3 12 P ,   H = 3 2 P , d is the nominal diameter of the external thread, P is the pitch of the external thread, and ρ is the radius of the bottom circle of the external thread. The outline drawn is shown in Figure 4. The KL line segment represents the thread bottom line segment, the LM line segment represents the thread side line segment, and the MN line segment represents the thread top line segment. The threaded solid can be viewed as the profile section rising and rotating at the same time. One pitch d of the thread can be divided into n parts. In the Hypermesh software (www.altair.com/hypermesh), the thread cross section was first meshed, and then the cross section was rotated 360/n degrees every d/n distance along the bolt axis, then formed a thread entity with a pitch length, and then a full-length thread was formed. The nut threads were created in the same way. For ease of analysis, the shape of the screw head and nut was set to cylindrical. The overall finite element model is shown in Figure 5.
r = { d 2 7 8 H + 2 ρ ρ 2 P 2 4 π 2 θ 2 ( 0 θ θ 1 ) H π θ + d 2 7 8 H ( θ 1 θ θ 2 ) d 2 ( θ 2 θ π )

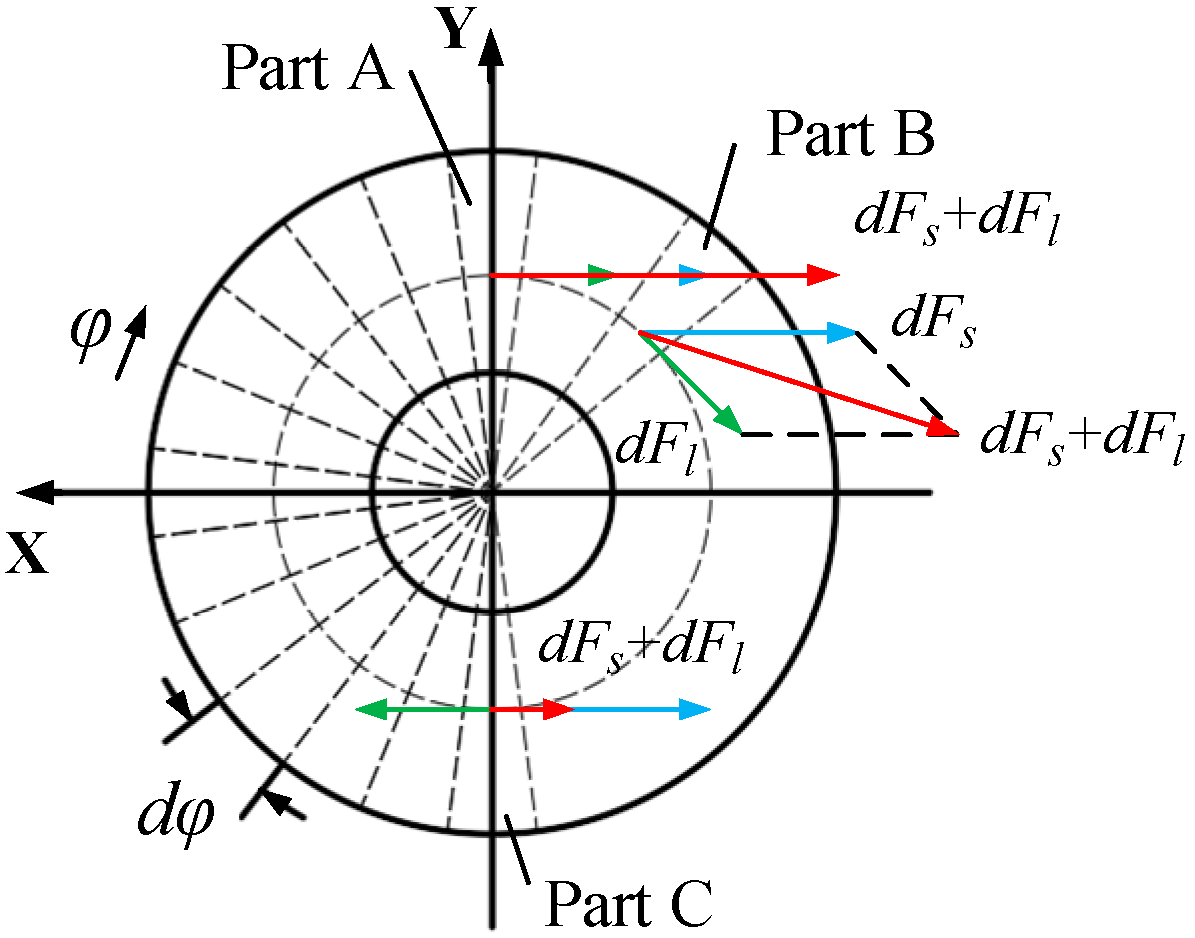
3.3. Analytical Method

In order to accurately simulate the tightening state of the bolts during assembly, Gong [35] compared the four methods of loading the bolts’ preloading force to obtain a conclusion that the preloading force unit can better consider the accuracy and cost of the calculation. The model was analyzed by ABAQUS software (www.3ds.com/products-services/simulia/products/abaqus), and the bolt preload force was applied by the bolt load application method. The loading method was divided into four steps. The first analysis step restricted the rigid body displacement of the screw head and the nut, and applied a small force to make it into stable contact. The second analysis step hid the extra constraints and applied the bolt preload to the set value. The third analysis step was set to be fixed at the current length, so that the preload was applied to achieve the bolt tightening effect, and the fourth analysis step applied a transverse load on the outside of the plate.
The contact surface between the bolt and the wood and the contact surface between wood were set as the frictional contact, and the form of friction action was set as the limited slip. As shown in Figure 6, the friction coefficient of the contact surface between the bolt and the nut was set to 0.15, and the friction coefficient of the remaining contact surfaces was set to 0.1. The tangential behavior of friction was set to penalize friction, and the normal behavior of friction was set to hard contact.
To simulate the classic Junker experiment, the transverse load was applied in the form of forced displacement, and its displacement function was   μ = μ 0 s i n ( 2 π f t ) , μ 0 showed the magnitude of the load, that is, the displacement, and f was the frequency. It can be seen from the displacement function formula that the load amplitude and frequency as variables may affect the looseness of the bolt connection, so the bolt connection looseness under different load amplitudes and frequencies was analyzed. In addition, the effect of the load acting position was studied. Depending on the load acting position, the force change of the bolt may be different. When a force is applied to the timber plate in contact with the pressure-bearing surface of the bolt head, the bolt head first moved, which then causes the threaded part to move; when a force was applied to the wooden board in contact with the thread, the threaded part of the bolt first moved, which in turn caused the overall movement of the bolt.

4. Results and Discussion

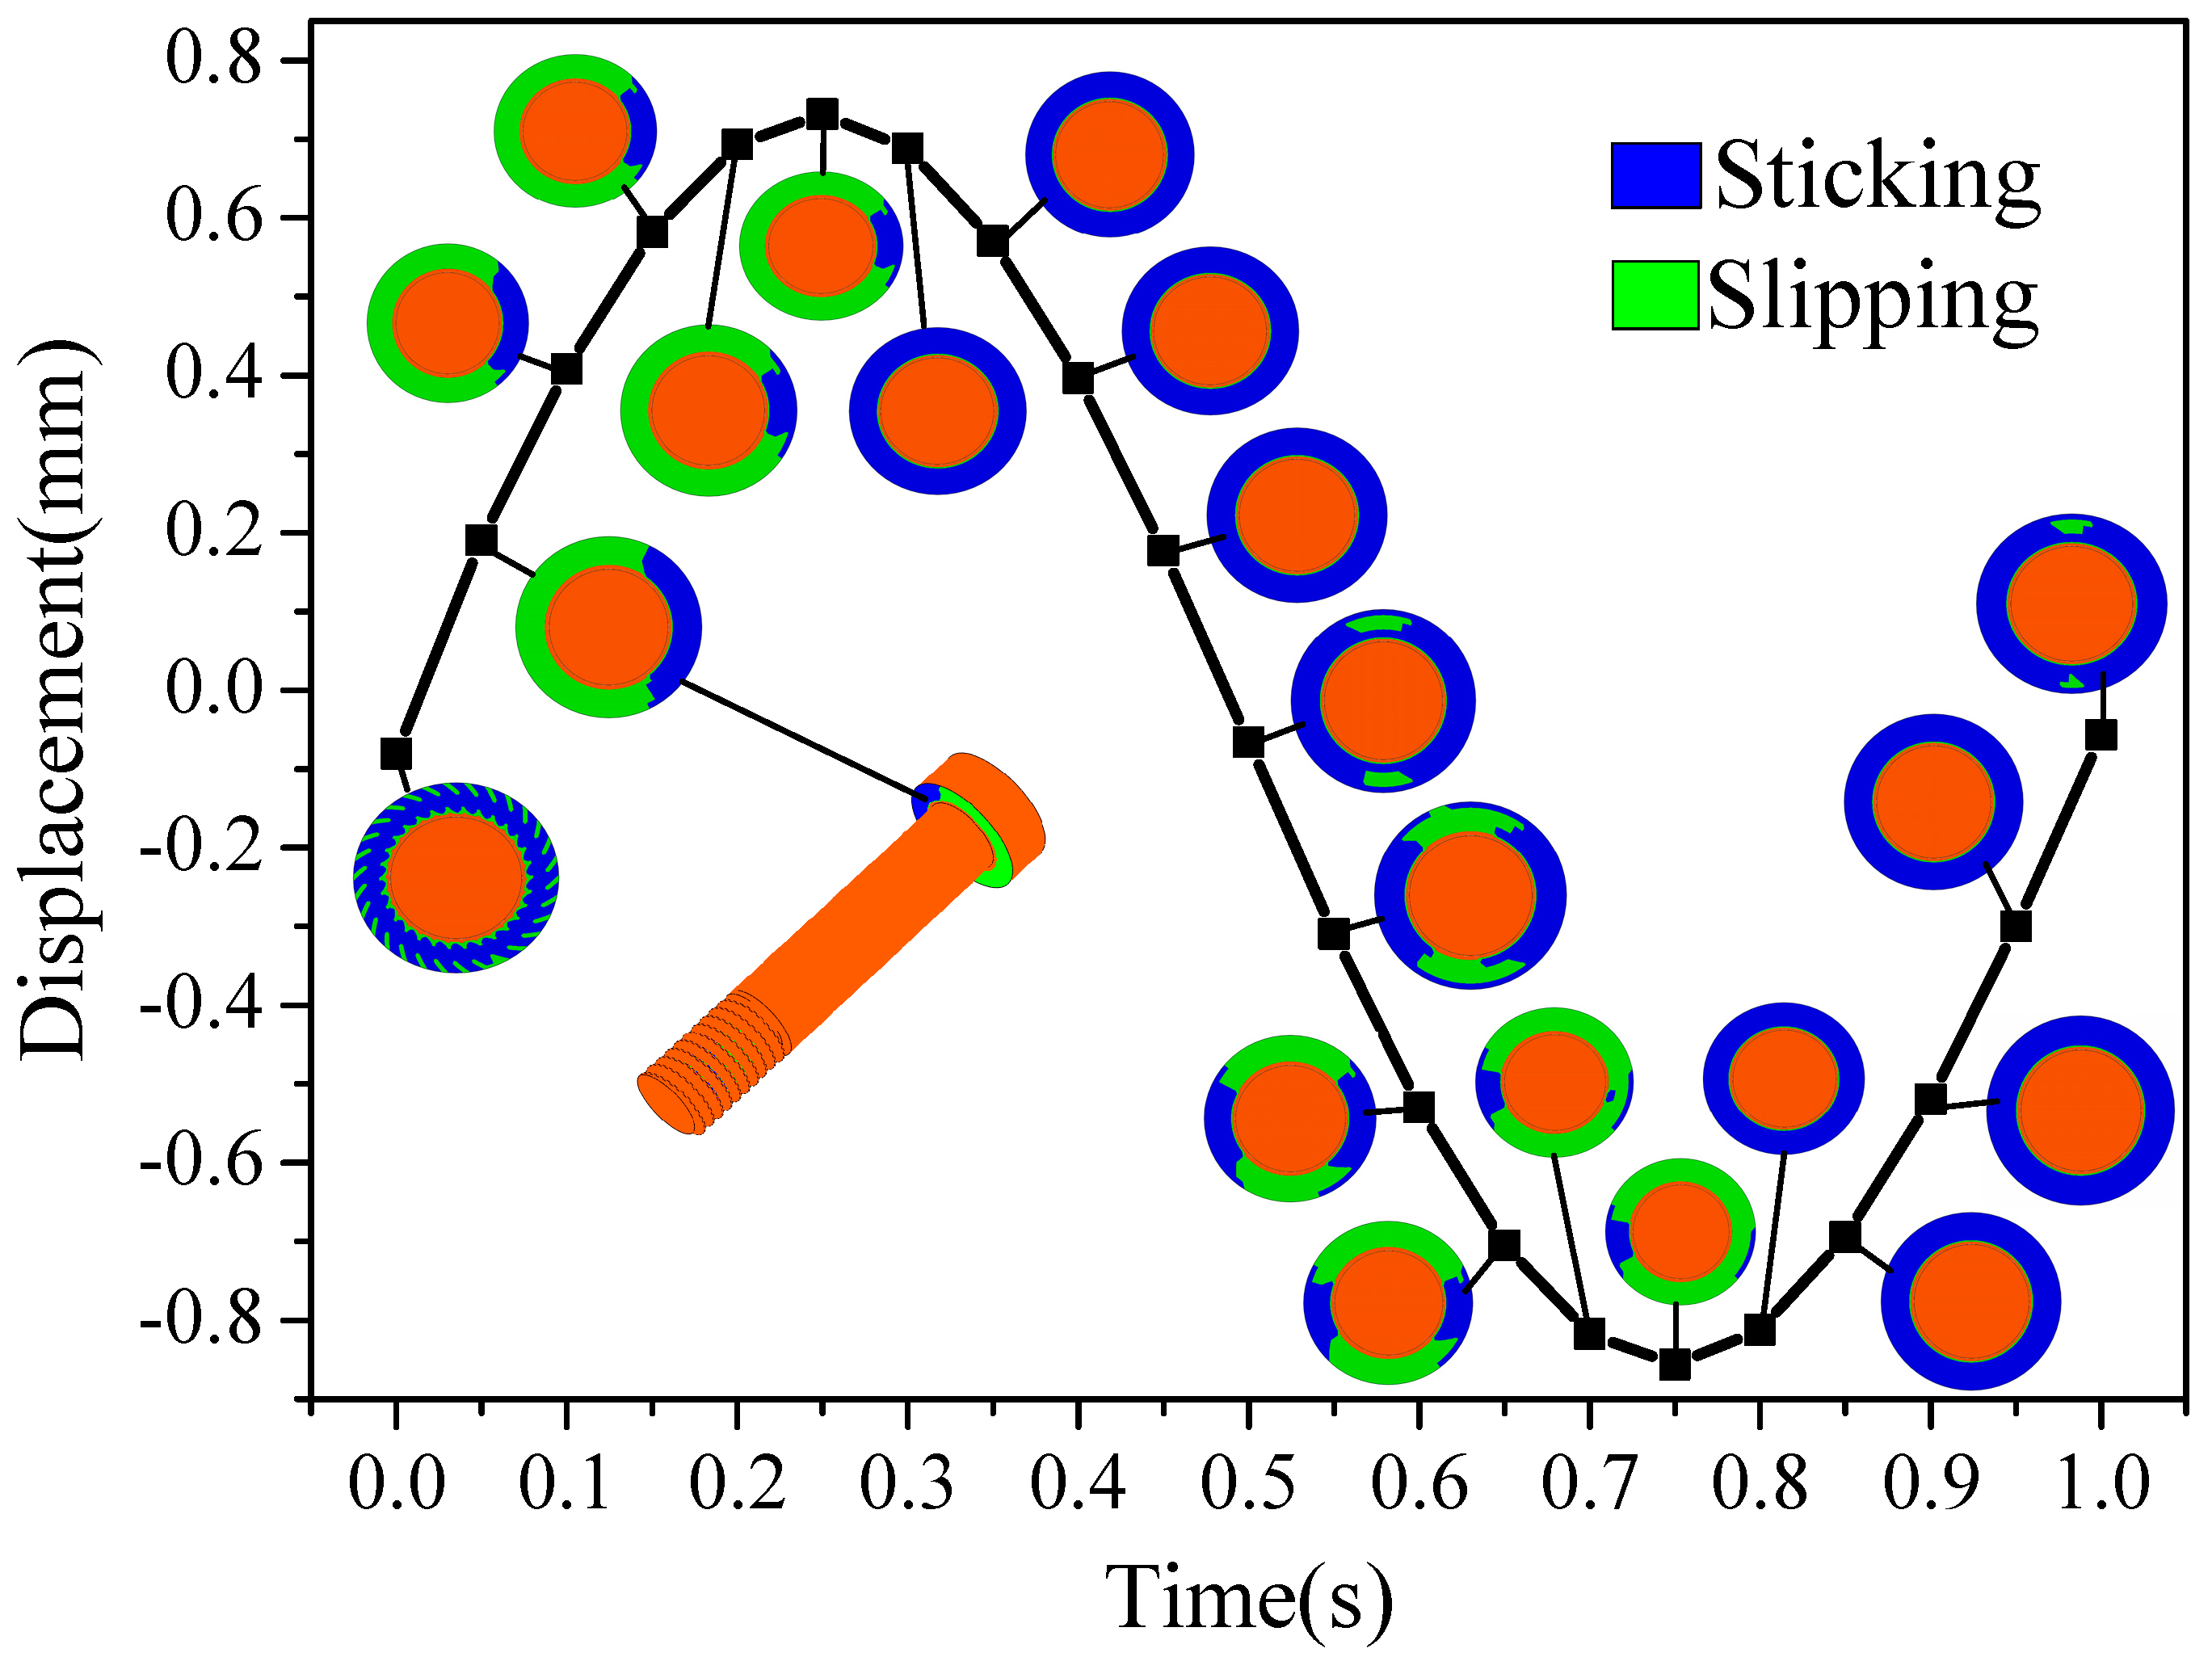
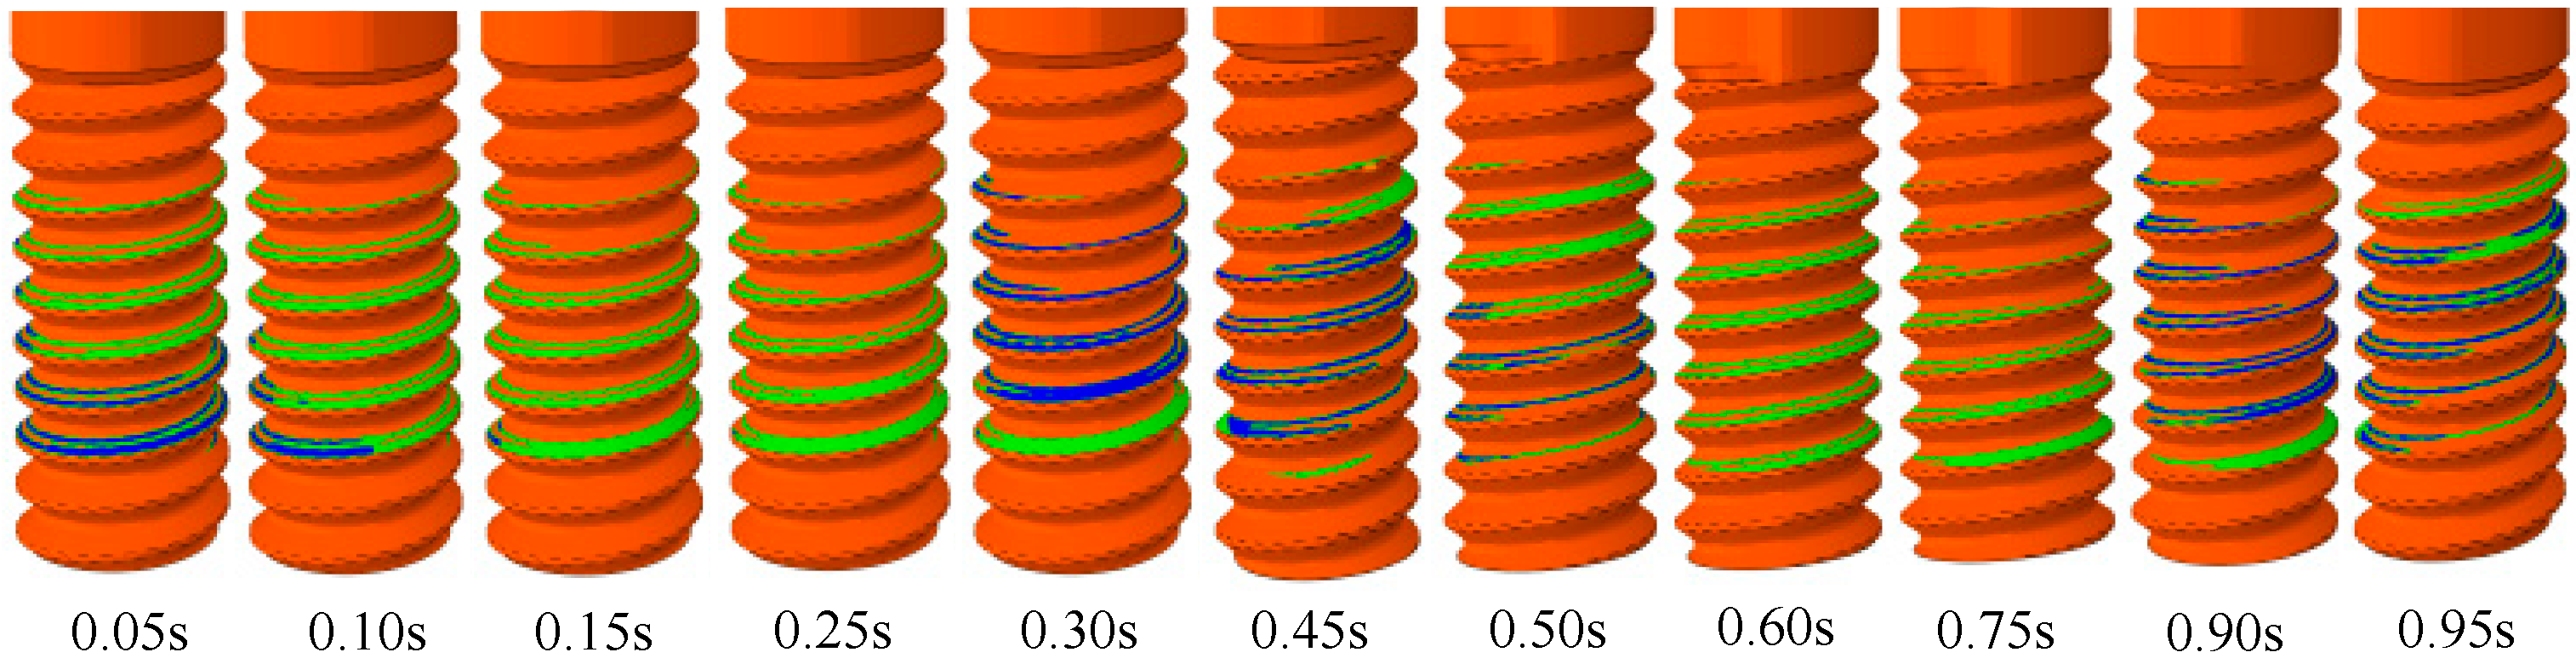
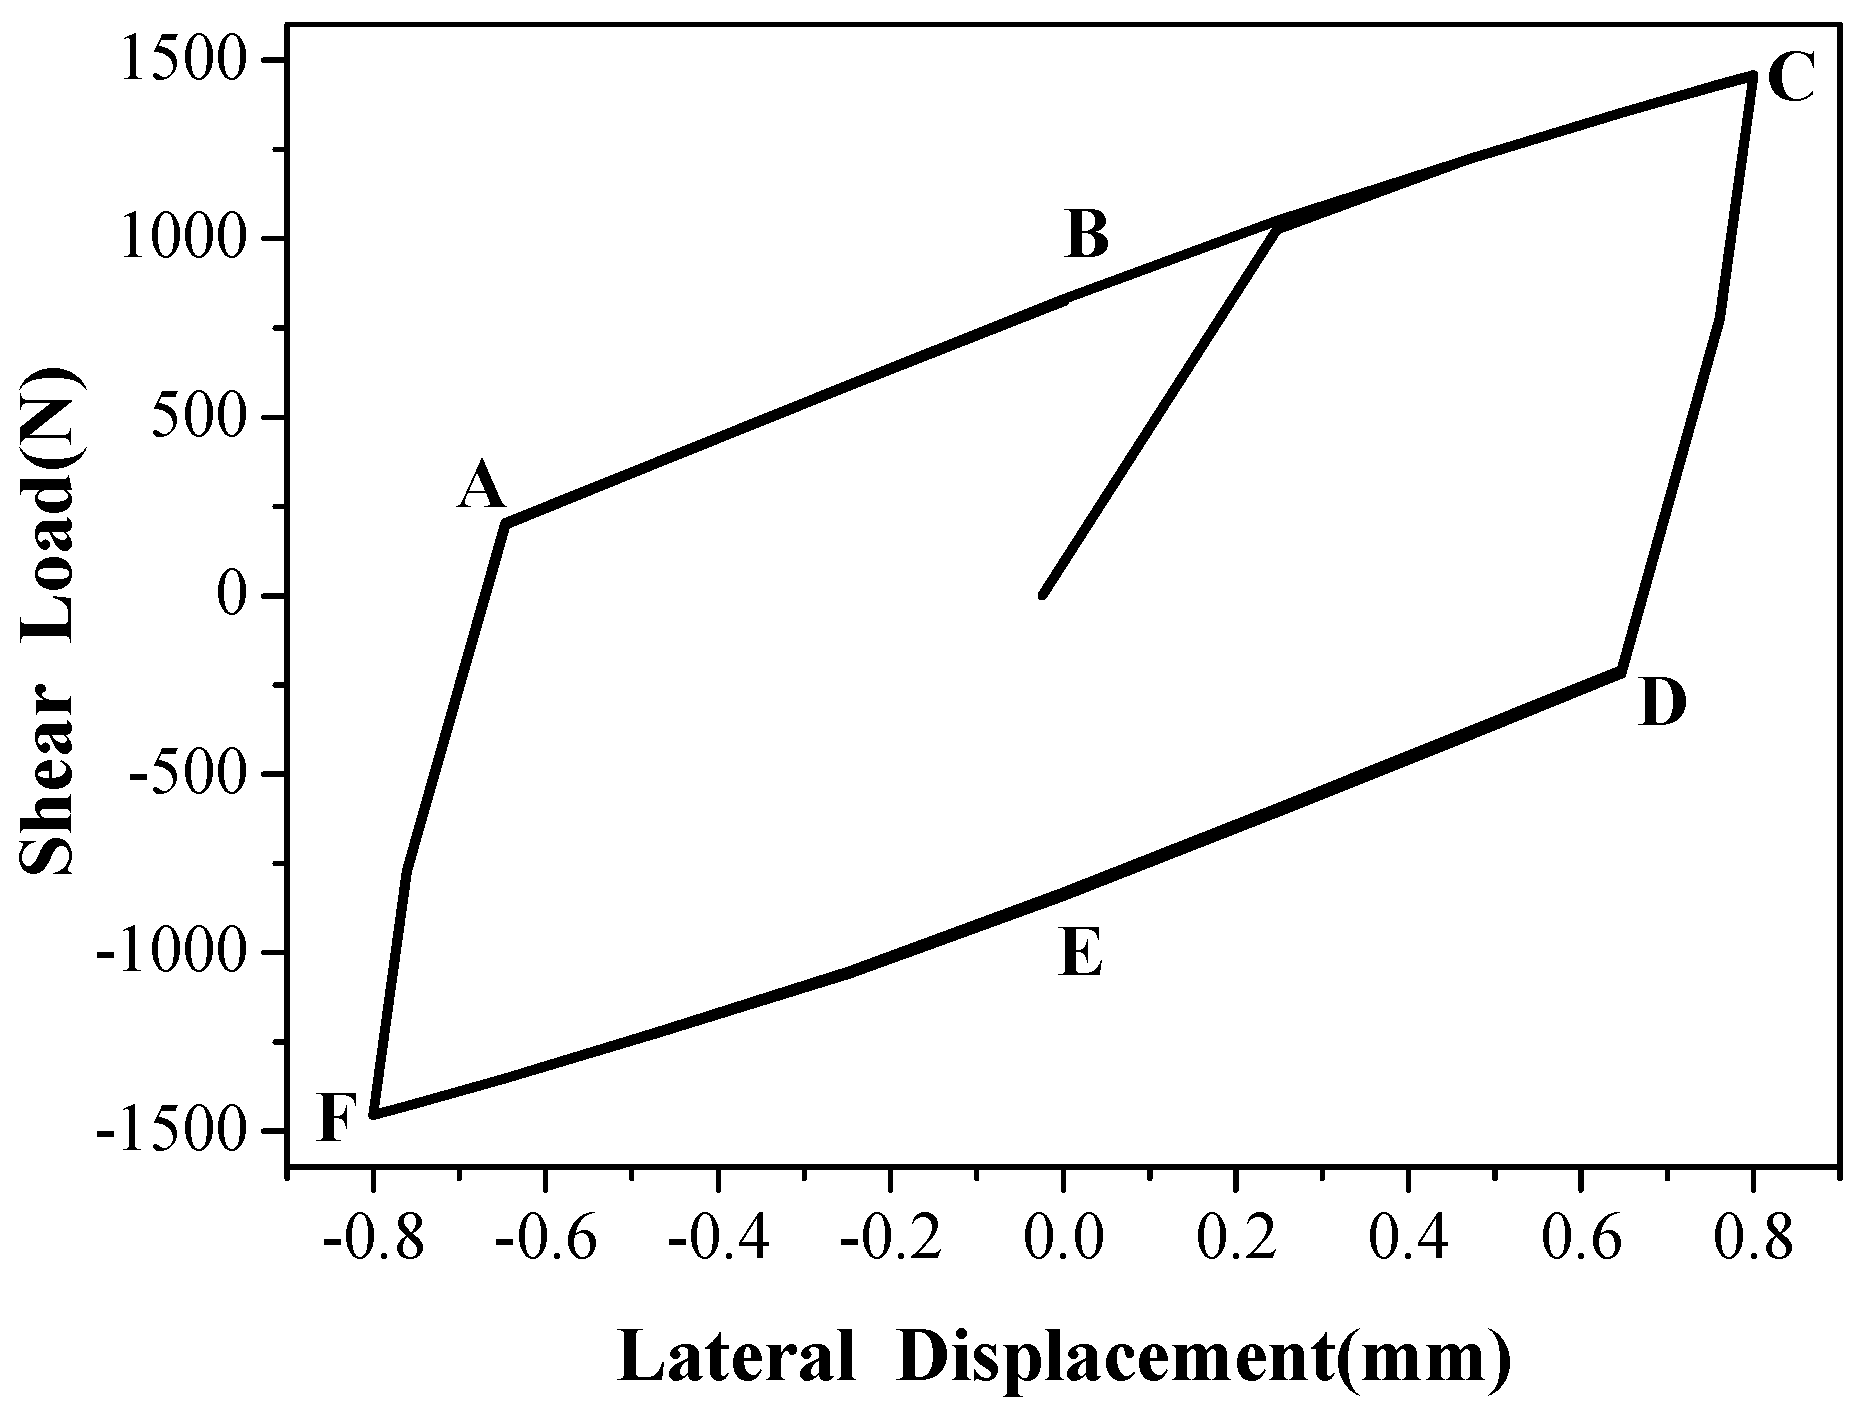
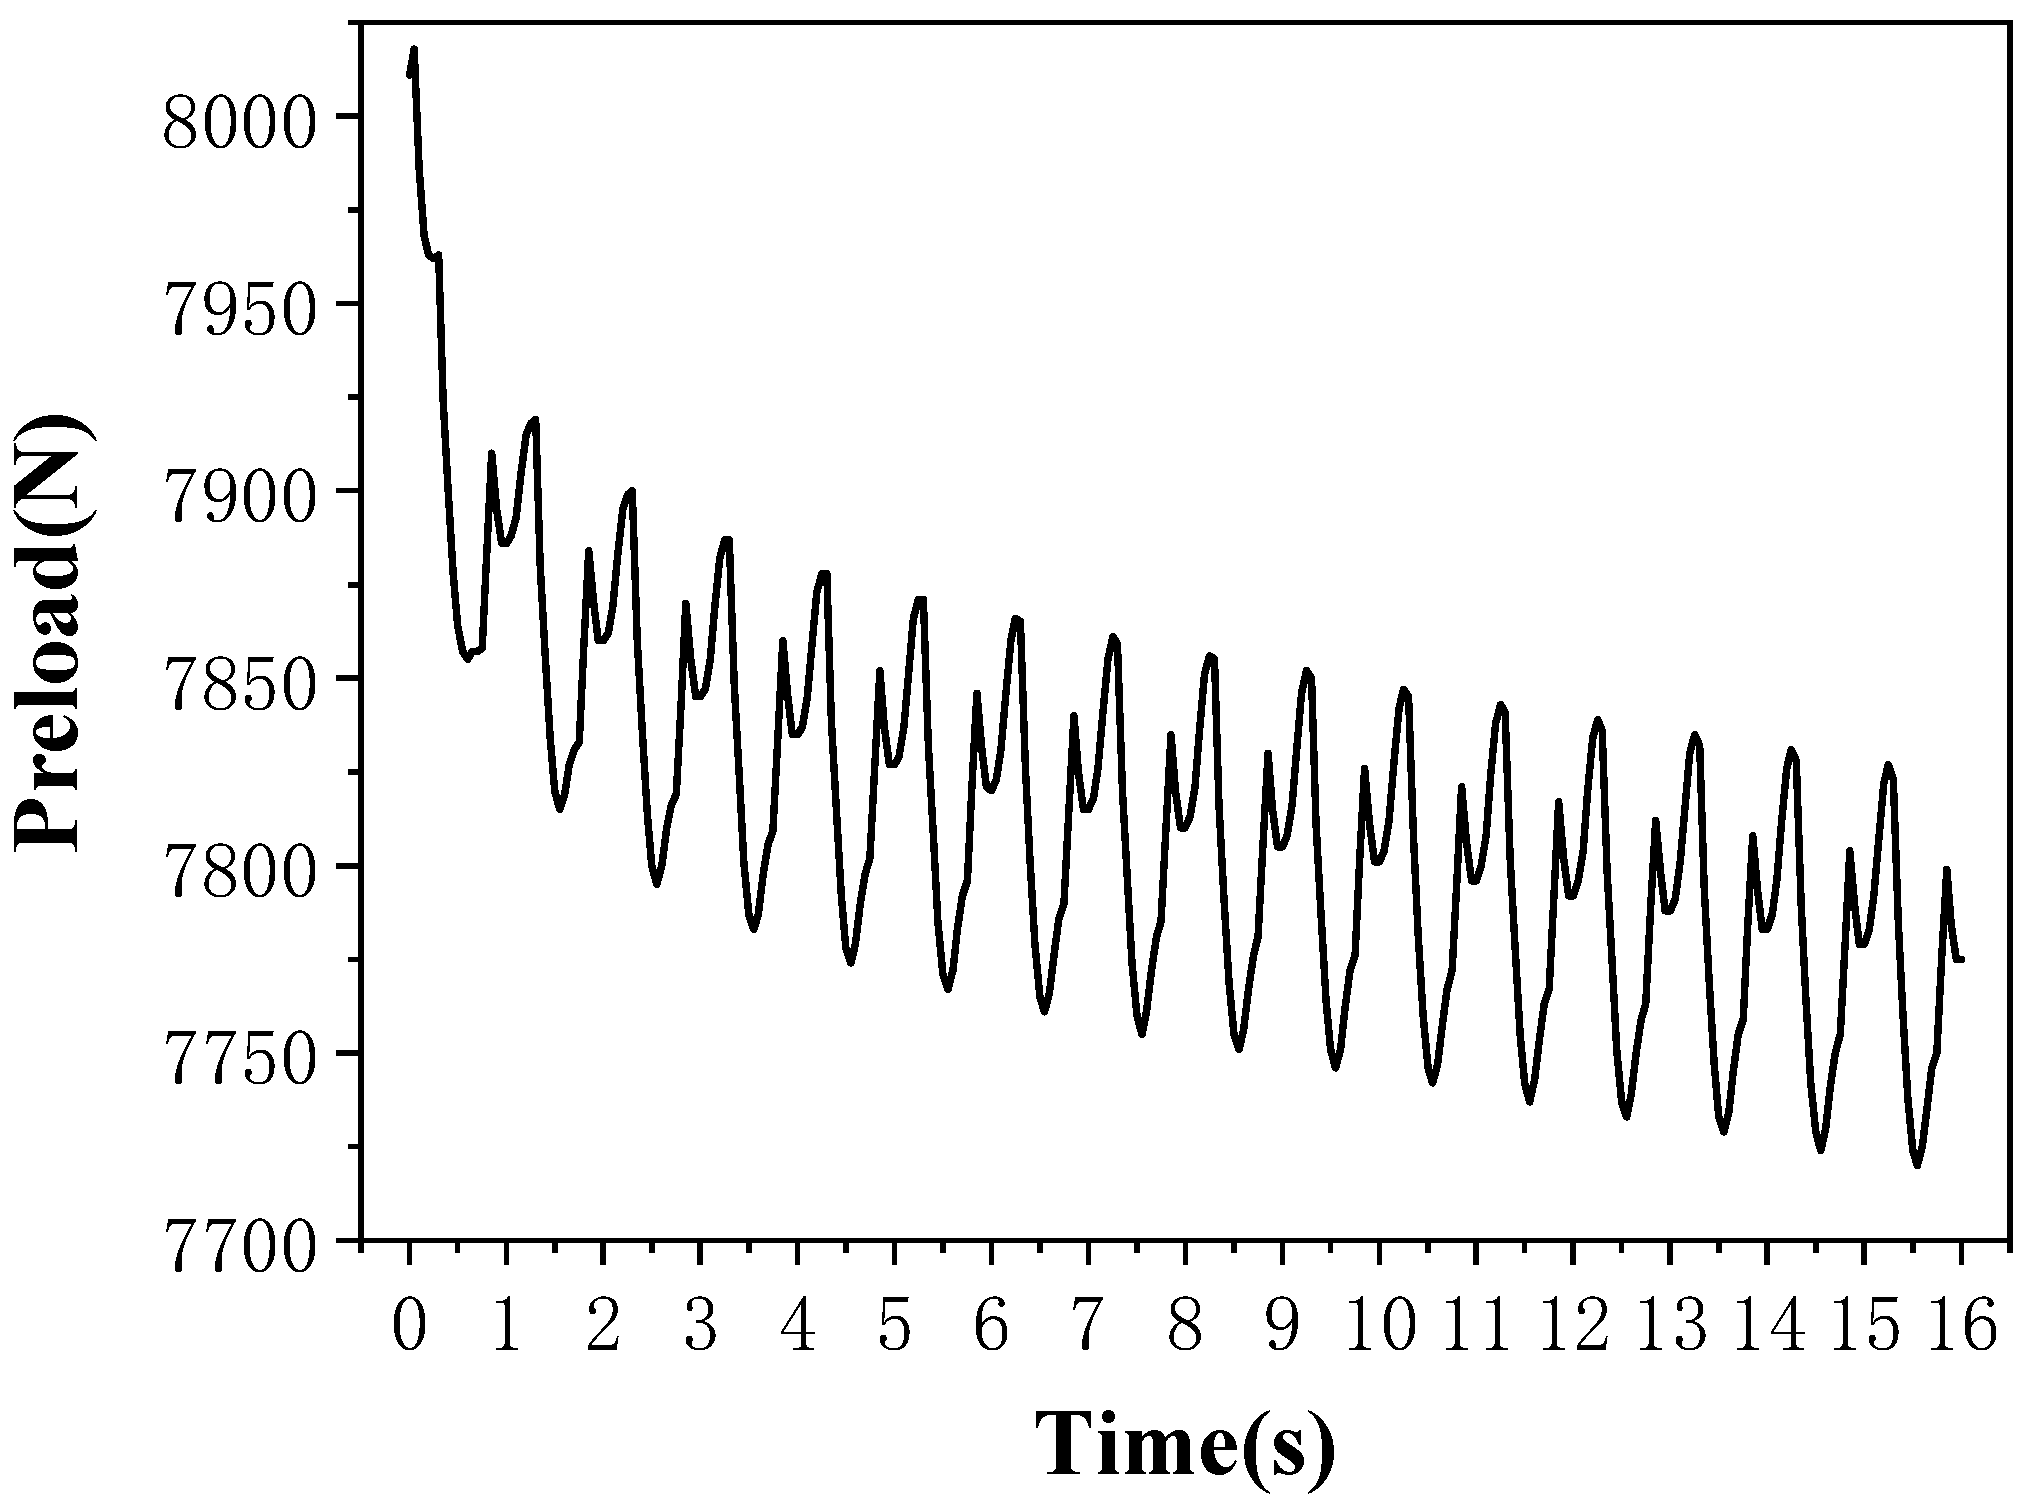
4.1. Analysis of the Loosening Process of Bolted Connections

In the analysis setting of the ABAQUS software, the transverse load amplitude was set to 0.8 mm and the action position was on the end face of the lower plate, and then the change of the contact state of the contact surface between the bolt head and the upper plate and the contact surface between the thread during a load cycle was observed. The one-cycle load curve and contact status of bolt head are shown in Figure 7.
Figure 8 shows the contact state change process, where blue indicates contact and green indicates slip. The thread contact surface and the bolt head contact surface had a local slip at the same time. With the increase of the load, the slip area gradually increased. The thread contact surface was fully slipped from 0.15 to 0.25 s, and a small part of the contact surface of the bolt head was still in contact. The load started to decrease after reaching the peak value at 0.25 s, and the slippage between the thread contact surface and the bolt head contact surface stopped instantly (0.30 s). During the gradual reduction of the load, the thread contact surface partially slipped (0.45 s), and the bolt head contact surface did not slip. The load started to reverse in 0.50 s. During the process of reaching 0.75 s, the sliding area of the thread contact surface gradually increased (0.50 s) and gradually reached the full slip state (0.60 s), while the sliding area of the contact surface of the bolt head gradually increased but did not reach the full slip. When the load began to decrease, the sliding of the thread contact surface and the bolt head contact surface stopped immediately (0.90 s), but during the process of gradually decreasing the load, the thread contact surface appeared to have local slippage (0.95 s).
Pai and Hess [36,37] applied the finite element analysis to simulate transverse vibration conditions and first proposed the theory of local slip. Based on this theory, Izumi [38] found that regardless of the sliding state of the bearing surface, when the thread surface reached the full sliding state, it would start to loosen. Therefore, the contact and slip state of the bolt connection was analyzed firstly. When the transverse load was applied, the bending deformation of the screw generated a shear force F s , and there was also frictional force at the contact surface of the screw head and a loosening moment due to the helix angle. The contact surface was divided into several parts, that is, F s was divided into equal parts, each part was d F s , the direction was along the load direction, the loosening moment was expressed as d F l , and the direction was tangential, as shown in Figure 9. At different positions of the contact surface, the angles of d F s and d F l were different, and the magnitude of friction was also different. Take three typical parts A, B, and C. In part A, d F s and d F l were in the same direction. As the load increased, the combined force of the two first exceeded the static friction. At this time, part A entered a slip state. As the load continued to increase, the slip zone gradually expanded from part A to both sides, and the whole rotates around part C, which was the most difficult to enter the slip state. If part C also enters the slip zone, the bearing surface will completely slip, otherwise, partial slip will occur. When the load changed direction, the positions of part A and part C were interchanged, so that they swing back and forth around part A and part C to gradually turn the bolt out.
The threaded part of the bolt was subjected to the contact force F s and the frictional force F l between the threads perpendicular to the thread surface. These two forces were resolved in the axial, radial, and tangential directions. The component forces in the axial and radial directions did not generate a moment around the shaft of the rod, and the component forces in the tangential direction generated torque. If the direction of the sum of the two torques is the same as the tightening direction, a tightening effect will be produced. If the direction of the sum of the two torques is the opposite, a loosening torque T l will be generated and transmitted to the bolt head along the bolt.
By extracting the relationship curve between transverse displacement and shear load, the change law of shear stiffness under cyclic load can be analyzed. The shear hysteresis curve is shown in Figure 10.
In the BC stage, the transverse load was forwardly applied to the peak value, and the sliding area of the contact surface of the bolt head gradually increased, but the rate of increase was small, so the slope of the curve was small and the shear stiffness was minimal. In the CD stage, the transverse load gradually decreased, and the sliding contact between the thread contact surface and the bolt head contact surface stopped, so the curve slope was large and the shear stiffness was the largest. During the DE phase, the transverse load gradually dropped to zero, the thread contact surface slipped locally, and the bolt head contact surface did not slip, and the slope of the curve was slightly larger than the BC segment. The slope of the curve between the BC segment and DE segment was not much different, which indicated that the sliding state of the contact surface of the bolt head had an influence on the shear stiffness of the bolt connection, but it had little effect. What is more, the slope of the CD segment was very large, which indicates that the sliding state of the thread contact surface had a great influence on the shear stiffness of the bolt connection.
Figure 11 shows the change of the preload force of the bolt. The curve shows a downward trend as a whole during the loosening process, but alternately rose and fell during a single load cycle, indicating that the bolts alternately tightened and loosened during a transverse load cycle. Since the tightening torque of the bolt itself was always greater than the loosening torque, when the loosening torque generated by the transverse load was greater than the loosening torque of the bolt itself, the loosening value must be greater than the tightening value, as a result, the nut slightly rotated after a single load cycle and was accompanied by a decrease in preload.
The nut rotation was obtained by calculating the relative rotational displacement between the nut and the bolt. Figure 12 shows the changes in nut rotation and clamping force with the number of loading cycles. In the figure, the horizon axis represents the number of loading cycles in the logarithmic scale. The nut rotation was plotted on the right-sided vertical axis while the relative clamping force, P/P0, was plotted on the left-sided vertical axis.

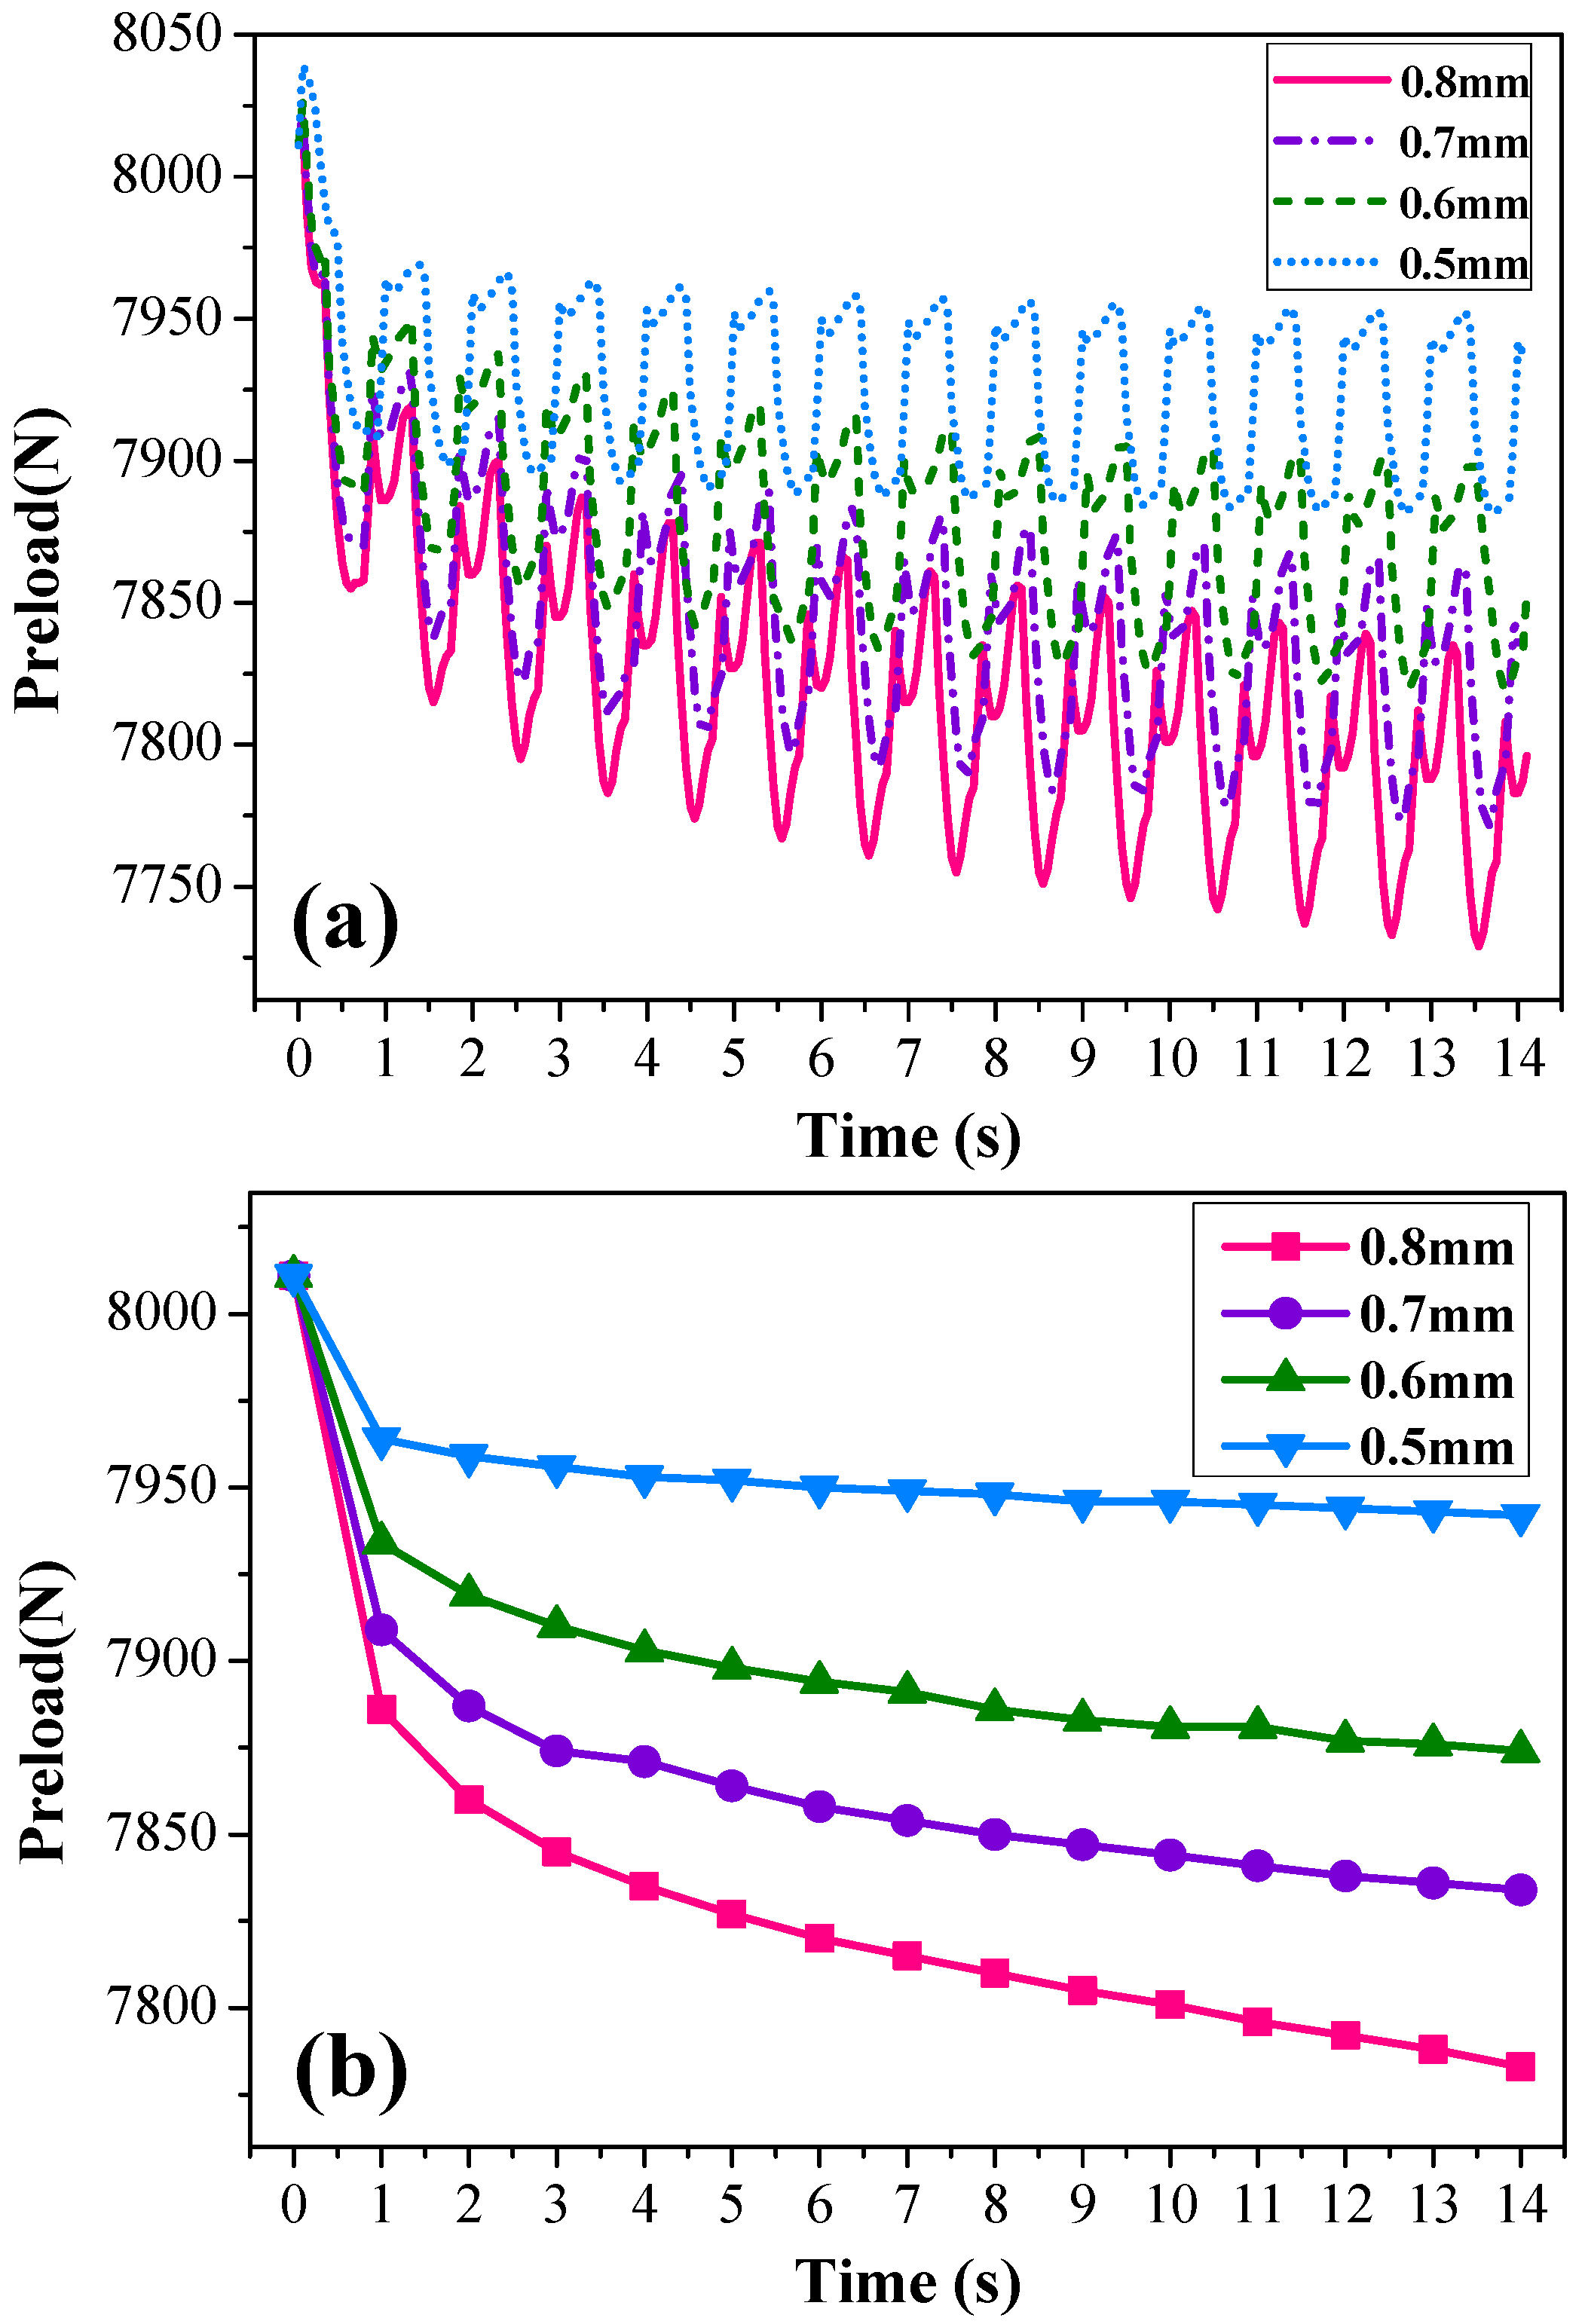
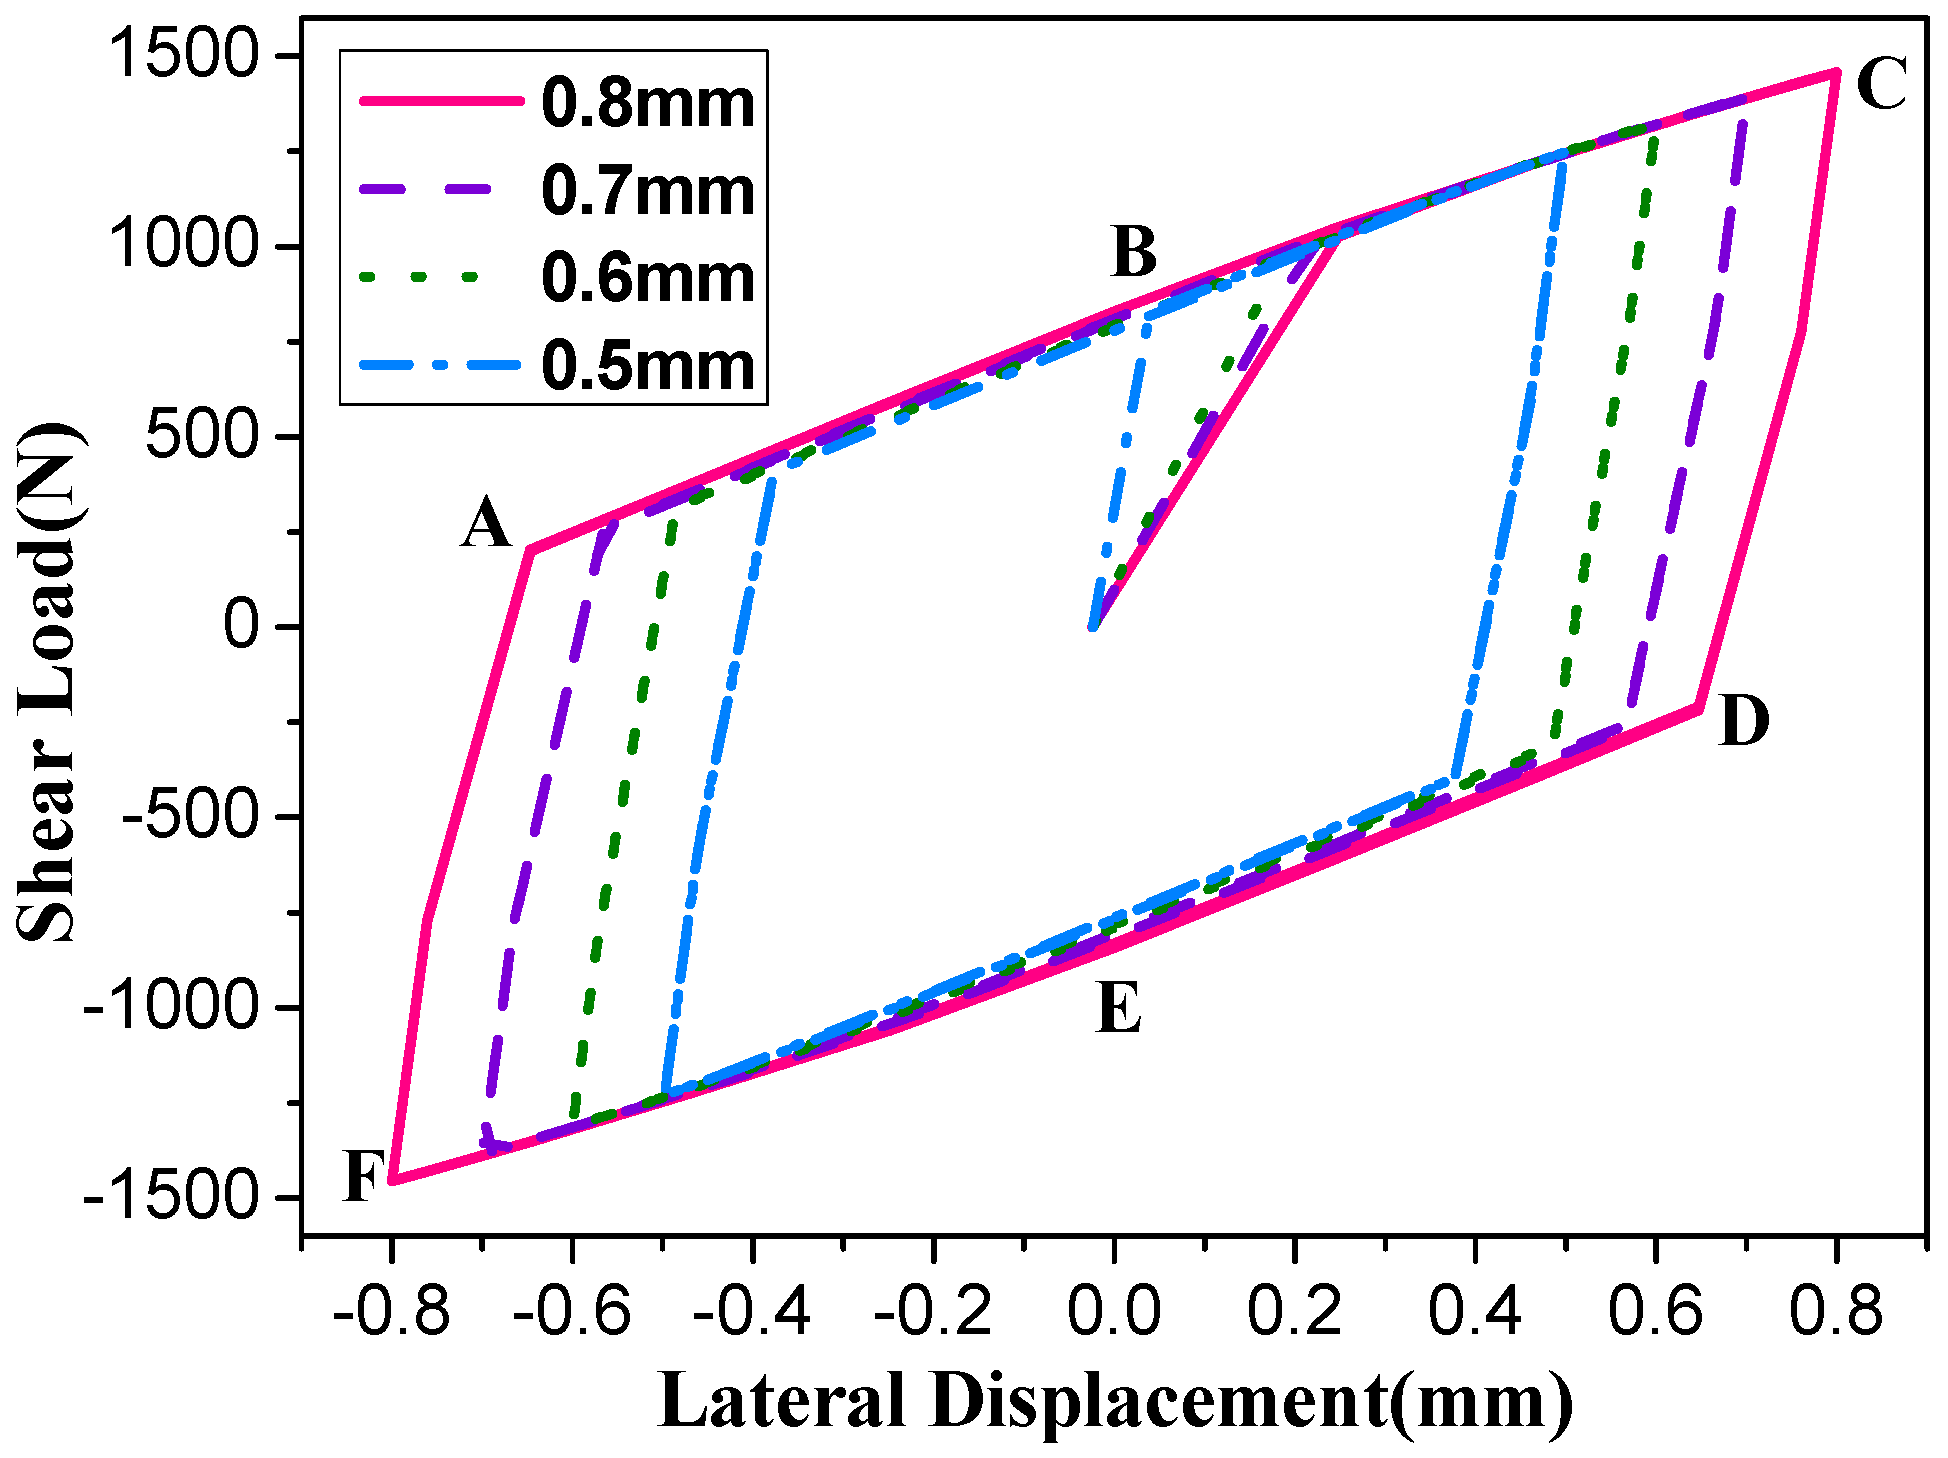
4.2. Influence of Transverse Load Amplitude on Looseness

Under the conditions of load amplitudes of 0.8 mm, 0.7 mm, 0.6 mm, and 0.5 mm, the changes in the preload force were compared. The analysis results are shown in Figure 13a. As the magnitude of the load increased, the magnitude of the decrease in preload became larger. Figure 13b shows the preload data curve at the same cycle point. The minimum values of the preload force drop at different amplitudes were 7783 N, 7834 N, 7874 N, and 7942 N, and preload reduction rates were 2.7%, 2.1%, 1.5%, and 0.7%. As a whole, with the increase of loading time, the overall decline of the preload force tended to stabilize, and the slope of the curve approached zero.
Figure 14 shows the curve of the shear load hysteresis curve at different amplitudes. When the transverse load amplitude was relatively small, such as 0.5 mm and 0.6 mm, the decrease in the preload force was relatively small, and the slope of the shear load curve of the AB and BC sections changed little. When the transverse load amplitude increased, the slopes of the AB and BC sections changed. The CD segment was the stage of load reduction, while the thread contact surface and the bolt head contact surface did not slip, and the shear stiffness at this time was approximately the normal state.

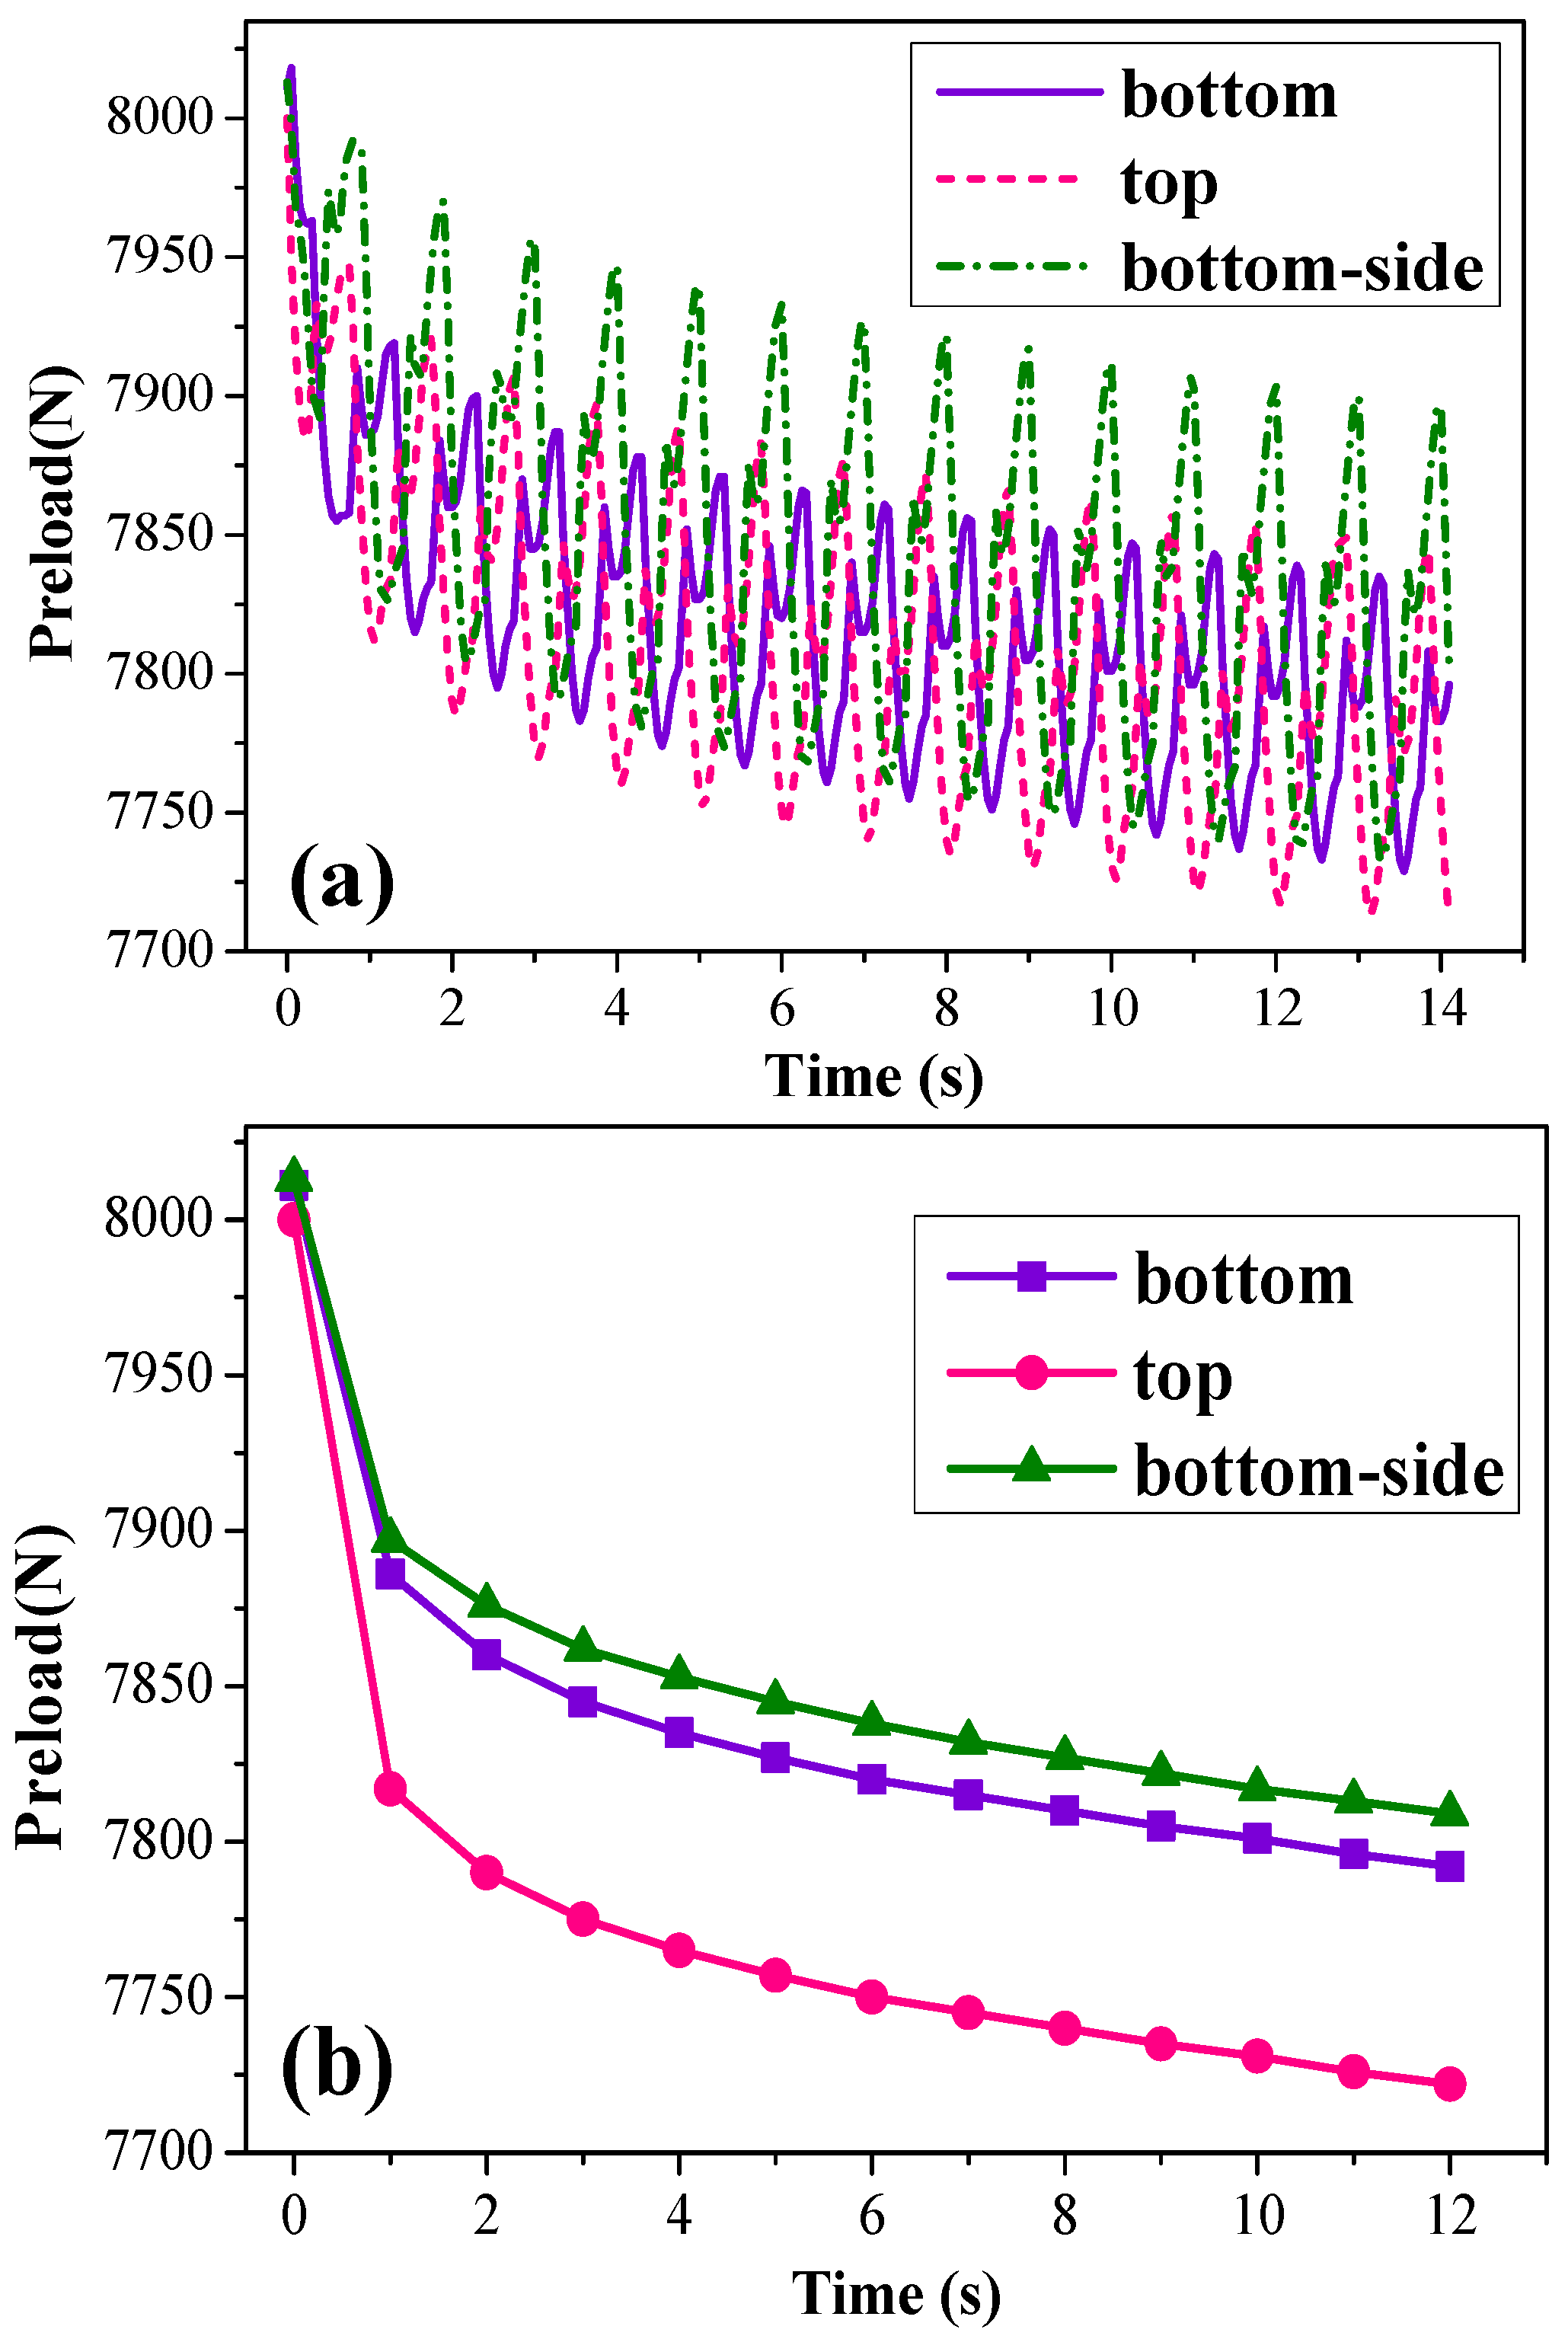
4.3. Influence of the Transverse Load Position on Looseness

The effects of transverse loads on the outside of the top plate, the outside of the bottom plate, and the side of the bottom plate were studied. The position of the load is shown in Figure 15. The load amplitude was 0.8 mm. Consider the effect of force on the side to compare the effect of the distance of action. Figure 16a shows the curve of the preload reduction and Figure 16b shows the preload force curve at the same loading cycle point. When time = 12 s, the values of the preload force at the three positions were 7722 N, 7792 N, and 7809 N, and the declines were 3.4%, 2.6%, and 2.3%. It can be seen that when the load was applied to the unthreaded position of the bolt, the reduction of the preload was relatively large, and when the load action distance was shortened, the decrease of the preload was only 0.3%. It can be obtained that the distance between the load position and the bolt had little effect on the looseness. On the whole, the preload drop curves at different positions had different stable values at the same loading time. It can be seen that when the transverse load was applied at different positions, although the direction of force transfer was different, the reduction rate of pretightening force was almost the same.

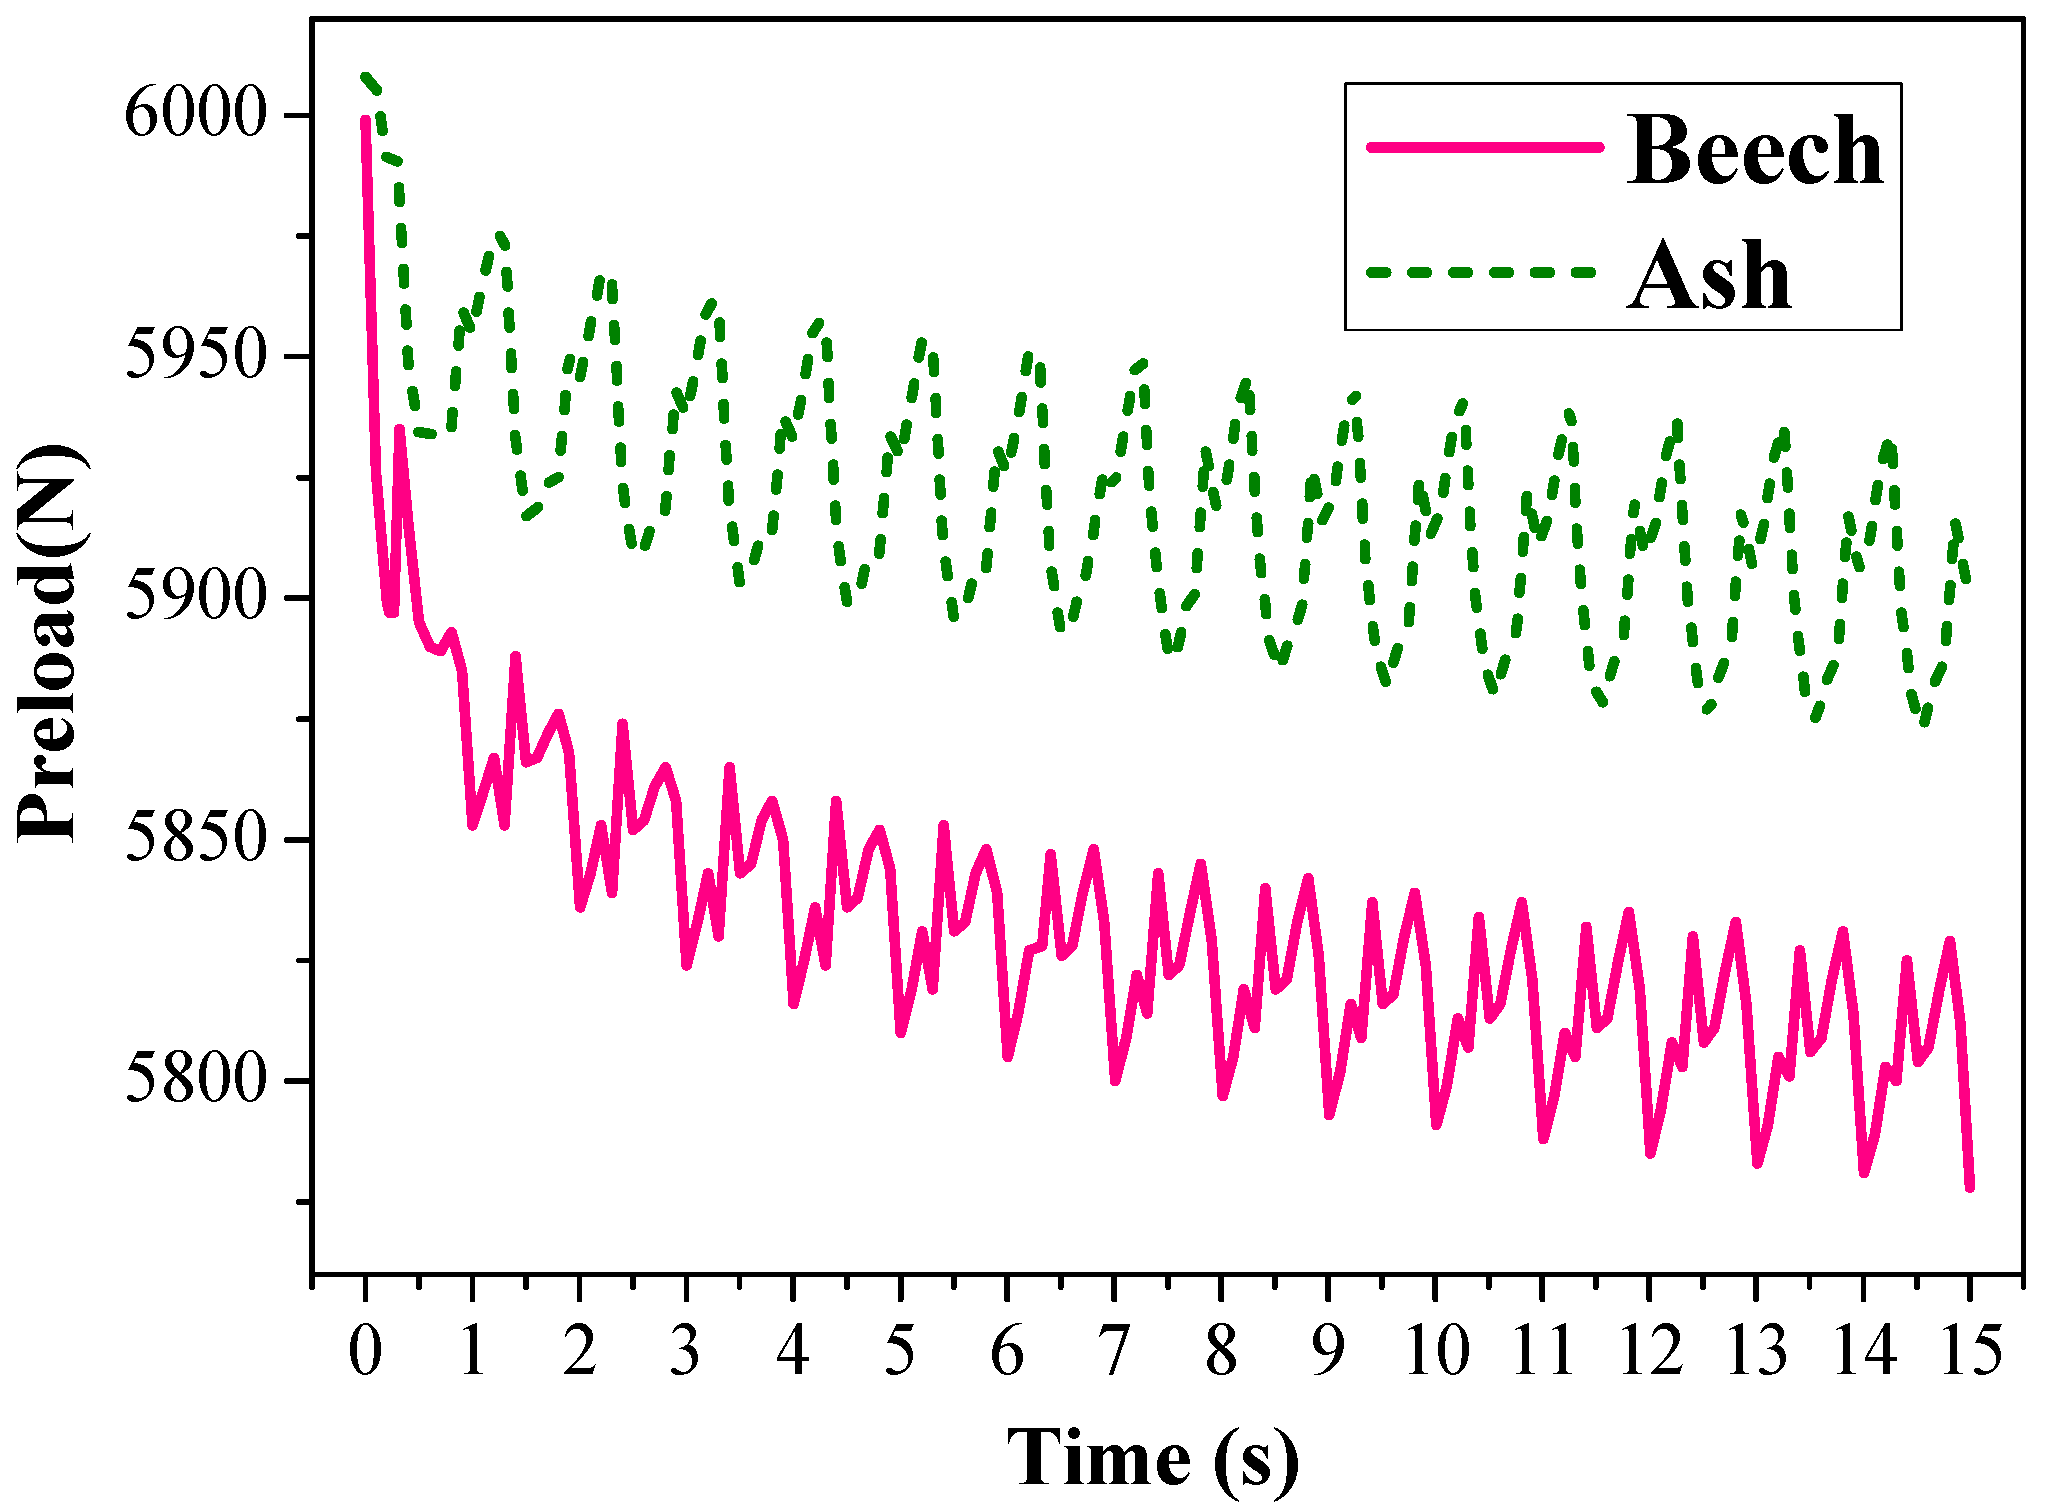
4.4. Influence of Transverse Load Frequency and Timber Properties on Looseness

The loading frequency was 1 Hz, 3 Hz, and 5 Hz, and the loading amplitude was 0.8 mm. The change curve of the preload force is shown in Figure 17a. When the time was 8 s, the preload force values were 7810 N, 7729 N, and 7744 N, respectively, with a decrease of 2.3%, 3.3%, and 3.2%, respectively. Figure 17b shows the variation curve of the average values of the adjacent maximum and minimum values in each cycle. With the increase of frequency, the decrease of the preload force increased slightly, but the decrease curve of preload force of 3 Hz and 5 Hz almost coincided. It could be considered that in the low frequency region, the increase of load frequency had little effect on the change of preload force in the process of bolt loosening.
In the finite element analysis of bolt loosening of steel connection structures, Gong [35] set the preload force to 10 KN and the load amplitude to 0.3 mm. After 50 loading cycles, the preload force decreased to about 9400 N, a decrease of about 6%, and when the loading cycle is 14 s, the decrease is about 2.5%. As can be seen from Figure 13, in the wooden structure, when the amplitude was 0.5 mm, the preload force decreased only by 0.7% when the loading cycle was 14 s. It could be inferred that due to the material difference between wood and steel, if the preload of the bolted connection in the wooden structure is to be significantly reduced, the amplitude of the vibration of the applied load is slightly larger than that of the steel.
In addition, in order to compare the looseness of bolted connections in different timber structures, ash was selected for finite element analysis. Material performance values are shown in Table 2 and the analysis results are shown in Figure 18. The initial preload was 6000 N. When time = 15 s, the value of Ash’s preload was 5905 N, and the rate of decline was 1.5%. The value of Ash’s preload was 5778 N, and the rate of decline was 3.7%. Since wood is a kind of anisotropic material, the decrease range of the preload force was different due to the different strength of wood, but the law of the preload force decreasing curve was about the same. The corresponding relationship between wood properties and pretightening force needs to be analyzed for a large number of different timber structures.

5. Conclusions

The connection state had a significant influence on the failure of the bolted timber structure. The loosening procedure of bolted connections of timber structures under transverse loads was investigated in this paper, without a loss of generality, a detailed finite element model of single bolted connections of timber structures was constructed, and analyzed the state changes of the contact surface between bolts and timber structures. In addition, the influence of the amplitude, frequency, position, distance, and material properties of the load on the looseness was studied. Results show that under the action of the cyclic transverse load, the preload force alternated with rising and falling. The thread contact surface was more prone to a slip than the bolt head contact surface, and the slip state of the thread contact surface was the main factor affecting the shear stiffness. In timber structures, the load amplitude was still an important factor that caused the bolts to loosen. As the amplitude increased, the looseness became more obvious, but as the loading time increased, the value of the preload force gradually stabilized. In the lower load frequency region, the increase in load frequency had little effect on bolt loosening. The position and distance of the transverse load had little effect on the looseness. Compared with the bolt connection in steel connection structures, loosening bolts in wooden structures required a larger load amplitude.
The next step is to study the loosening behavior of bolts under different structural forms, such as using laminated timber or adding connecting steel plates into timber structures. Finally, the agreement between the results of the finite element analysis and the actual working environment results will be verified through experiments.

Author Contributions

Conceptualization, J.C. and D.J.; methodology, J.C.; validation, H.W.; formal analysis, Y.Y.; investigation, H.W. and Y.Y.; resources, D.J.; data curation, J.C.; writing-original draft preparation, J.C.; writing-review and editing, D.J. and Y.L.; visualization, J.C.; supervision, D.J. and Y.L.; project administration, D.J. and Y.L.; funding acquisition, D.J. and Y.L. All authors have read and agreed to the published version of the manuscript.

Funding

This research was funded by the National Natural Science Foundation of China (11602112) and sponsored by Qing Lan Project.

Conflicts of Interest

The authors declare no conflict of interest.

References

  1. Junker, G.H. Criteria for self loosening of fasteners under vibration. Aircr. Eng. Aerosp. Technol. 1972, 44, 14–16. [Google Scholar] [CrossRef]
  2. Zhou, J.; Liu, J.; Ouyang, H.; Cai, Z.; Peng, J.; Zhu, M. Self-loosening behavior of bolted joints subjected to dynamic shear load. Int. J. Mod. Phys. B 2019, 33, 1940009. [Google Scholar] [CrossRef]
  3. Ksentini, O.; Combes, B.; Abbes, M.; Daidié, A.; Haddar, M. Numerical study of self-loosening of a bolted assembly under transversal load. Mech. Ind. 2016, 17, 507. [Google Scholar] [CrossRef]
  4. Jiang, X.; Huang, J.; Wang, Y.; Li, B.; Du, J.; Hao, P. Finite element analysis for the self-loosening behavior of the bolted joint with a superelastic shape memory alloy. Materials 2018, 11, 1592. [Google Scholar] [CrossRef] [PubMed] [Green Version]
  5. Yang, G.; Che, C.; Xiao, S.; Yang, B.; Zhu, T.; Jiang, S. Experimental study and life prediction of bolt loosening life under variable amplitude vibration. Shock Vib. 2019, 2019, 2036509. [Google Scholar] [CrossRef] [Green Version]
  6. Gong, H.; Liu, J.; Ding, X. Study on the mechanism of preload decrease of bolted joints subjected to transversal vibration loading. Proc. Inst. Mech. Eng. Part B J. Eng. Manuf. 2019, 233, 2320–2329. [Google Scholar] [CrossRef]
  7. Huo, L.; Wang, F.; Li, H.; Song, G. A fractal contact theory based model for bolted connection looseness monitoring using piezoceramic transducers. Smart Mater. Struct. 2017, 26, 104010. [Google Scholar] [CrossRef]
  8. Zhao, Z.; Chen, P.; Zhang, E.; Lu, G. Health Monitoring of Bolt Looseness in Timber Structures Using PZT-Enabled Time-Reversal Method. J. Sens. 2019, 2019, 2801638. [Google Scholar] [CrossRef] [Green Version]
  9. Wang, M.; Tan, Z.; He, D.; Jiang, D.; Fei, Q. Anti-loosening experiment of composite bolted structures under high temperature and vibration circumstance. J. Vib. Meas. Diagn. 2018, 38, 1169–1175. [Google Scholar]
  10. Xu, C.; Huang, C.; Zhu, W. Bolt loosening detection in a jointed beam using empirical mode decomposition-based nonlinear system identification method. Int. J. Distrib. Sens. Netw. 2019, 15, 1550147719875656. [Google Scholar] [CrossRef]
  11. Zhang, Y.; Zhao, X.; Sun, X.; Su, W.; Xue, Z. Bolt loosening detection based on audio classification. Adv. Struct. Eng. 2019, 22, 2882–2891. [Google Scholar] [CrossRef]
  12. Li, Q.; Jing, X. Fault diagnosis of bolt loosening in structures with a novel second-order output spectrum-based method. Struct. Health Monit. Int. J. 2020, 19, 123–141. [Google Scholar] [CrossRef]
  13. Xu, C.; Wu, G.; Du, F.; Zhu, W.; Mahdavi, S.H. A modified time reversal method for guided wave based bolt loosening monitoring in a lap joint. J. Nondestruct. Eval. 2019, 38, 85. [Google Scholar] [CrossRef]
  14. Du, F.; Xu, C.; Zhang, J. A bolt preload monitoring method based on the refocusing capability of virtual time reversal. Struct. Control Health Monit. 2019, 26, e2370. [Google Scholar] [CrossRef]
  15. Wang, F.; Ho, S.; Song, G. Modeling and analysis of an impact-acoustic method for bolt looseness identification. Mech. Syst. Signal Process. 2019, 133, 106249. [Google Scholar] [CrossRef]
  16. Nguyen, T.; Huynh, T.; Ryu, J.; Park, J.; Kim, J. Bolt-loosening identification of bolt connections by vision image-based technique. In Proceedings of the Nondestructive Characterization and Monitoring of Advanced Materials, Aerospace, and Civil Infrastructure 2016, Las Vegas, NE, USA, 21–24 March 2016. [Google Scholar]
  17. Huynh, T.; Park, J.; Jung, H.; Kim, J. Quasi-autonomous bolt-loosening detection method using vision-based deep learning and image processing. Autom. Constr. 2019, 105, 102844. [Google Scholar] [CrossRef]
  18. Ramana, L.; Choi, W.; Cha, Y. Fully automated vision-based loosened bolt detection using the Viola–Jones algorithm. Struct. Health Monit. 2018, 18, 422–434. [Google Scholar] [CrossRef]
  19. Zhao, X.; Zhang, Y.; Wang, N. Bolt loosening angle detection technology using deep learning. Struct. Control Health Monit. 2019, 26, e2292. [Google Scholar] [CrossRef] [Green Version]
  20. Yin, T.; Wang, X.; Zhu, H. A probabilistic approach for the detection of bolt loosening in periodically supported structures endowed with bolted flange joints. Mech. Syst. Signal Process. 2019, 128, 588–616. [Google Scholar] [CrossRef]
  21. Nassar, S.; Housari, B. Self-loosening of threaded fasteners due to cyclic transverse loads. In Proceedings of the ASME 2005 Pressure Vessels and Piping Conference, Denver, CO, USA, 17–21 July 2005. [Google Scholar]
  22. Vilela, P.; Carvalho, H.; Grilo, L.; Montenegrob, P.; Calçadab, R.B. Unitary model for the analysis of bolted connections using the finite element method. Eng. Fail. Anal. 2019, 104, 308–320. [Google Scholar] [CrossRef]
  23. Jiang, D.; Wu, S.; Shi, Q.; Fei, Q. Contact interface parameter identification of bolted joint structure with uncertainty using thin layer element method. Eng. Mech. 2015, 32, 220–227. [Google Scholar]
  24. Wi, J.; Ahn, H.; Lee, K.; Lee, C. Self-loosening characteristics of three-dimensional printed bolted joints. 3D Print. Addit. Manuf. 2019, 6, 354–360. [Google Scholar] [CrossRef]
  25. Zhang, M.; Zeng, D.; Lu, L.; Zhang, Y.; Wang, J.; Xu, J. Finite element modelling and experimental validation of bolt loosening due to thread wear under transverse cyclic loading. Eng. Fail. Anal. 2019, 104, 341–353. [Google Scholar] [CrossRef]
  26. Jiang, X.; Li, Z.; Wang, Y.; Pan, F. Self-loosening behavior of bolt in curvic coupling due to materials ratcheting at thread root. Adv. Mech. Eng. 2019, 11, 1687814019841137. [Google Scholar] [CrossRef]
  27. Baek, K.; Jeong, N.; Hong, H.; Choi, S.; Lee, E.; Kim, H.; Kwon, J.; Song, S.; Jang, H.; Lee, H.; et al. Loosening mechanism of threaded fastener for complex structures. J. Mech. Sci. Technol. 2019, 33, 1689–1702. [Google Scholar] [CrossRef]
  28. Gong, H.; Liu, J.; Ding, X. Study on the critical loosening condition toward a new design guideline for bolted joints. Proc. Inst. Mech. Eng. Part C J. Mech. Eng. Sci. 2019, 233, 3302–3316. [Google Scholar] [CrossRef]
  29. Zhang, J.; He, M.J.; Li, Z. Numerical analysis on tensile performance of bolted glulam joints with initial local cracks. J. Wood Sci. 2018, 64, 364–376. [Google Scholar] [CrossRef] [Green Version]
  30. Kaliyanda, A.; Rammer, D.; Rowlands, R. Three-dimensional nonlinear finite-element analysis of wood-steel bolted joints subjected to large deformations. J. Struct. Eng. 2019, 145, 04019108. [Google Scholar] [CrossRef]
  31. Shu, Z.; Li, Z.; Yu, X.; Zhang, J.; He, M. Rotational performance of glulam bolted joints: Experimental investigation and analytical approach. Constr. Build. Mater. 2019, 213, 675–695. [Google Scholar] [CrossRef]
  32. Feng, X.; Jing, X.; Xu, Z.; Guo, Y. Bio-inspired anti-vibration with nonlinear inertia coupling. Mech. Syst. Signal Process. 2019, 124, 562–595. [Google Scholar] [CrossRef]
  33. Gu, Y.; Zhu, L.; Wu, X. Polarization resolved analysis of phonon transport in a multi-terminal system. Chin. Phys. B 2019, 28, 124401. [Google Scholar] [CrossRef]
  34. Fukuoka, T.; Nomura, M. Proposition of helical thread modeling with accurate geometry and finite element analysis. In Proceedings of the ASME Pressure Vessels and Piping Conference, Vancouver, BC, Canada, 23–27 July 2006. [Google Scholar]
  35. Gong, H.; Liu, J. Some factors affecting the loosening failure of bolted joints under vibration using finite element analysis. Proc. Inst. Mech. Eng. Part C J. Mech. Eng. Sci. 2018, 232, 3942–3953. [Google Scholar] [CrossRef]
  36. Pai, N.; Hess, D. Three-dimensional finite element analysis of threaded fastener loosening due to dynamic shear load. Eng. Fail. Anal. 2002, 9, 383–402. [Google Scholar] [CrossRef]
  37. Pai, N.; Hess, D. Experimental study of loosening of threaded fasteners due to dynamic shear loads. J. Sound Vib. 2002, 253, 585–602. [Google Scholar] [CrossRef]
  38. Izumi, S.; Yokoyama, T.; Iwasaki, A.; Sakai, S. Three-dimensional finite element analysis of tightening and loosening mechanism of threaded fastener. Eng. Fail. Anal. 2005, 12, 604–615. [Google Scholar] [CrossRef]
Figure 1. Experimental equipment of bolt loosening (a) and bolt loosening curves (b).
Forests 11 00816 g001
Figure 2. Loosening analysis of timber structures under transverse loading.
Forests 11 00816 g002
Figure 3. Model schematic.
Forests 11 00816 g003
Figure 4. Thread external contour.
Forests 11 00816 g004
Figure 5. Overall finite element model.
Forests 11 00816 g005
Figure 6. Contact surface settings.
Forests 11 00816 g006
Figure 7. Load curve and contact state.
Forests 11 00816 g007
Figure 8. Changes in contact status in a single cycle.
Forests 11 00816 g008
Figure 9. Force analysis of the contact surface of the bolt head.
Forests 11 00816 g009
Figure 10. Shear hysteresis curve.
Forests 11 00816 g010
Figure 11. Preload drop curve.
Forests 11 00816 g011
Figure 12. Finite element results.
Forests 11 00816 g012
Figure 13. Curves of the preload force decrease with different amplitudes (a) and the preload data curve at the same cycle point (b).
Forests 11 00816 g013
Figure 14. Shear hysteresis curves of different amplitudes.
Forests 11 00816 g014
Figure 15. Load location.
Forests 11 00816 g015
Figure 16. Curve of decreasing preload force at different positions (a) and the preload data curve at the same cycle point (b).
Forests 11 00816 g016
Figure 17. Curves of preload force reduction at different frequencies (a) and the variation curve of the average values of the adjacent maximum and minimum values in each cycle (b).
Forests 11 00816 g017
Figure 18. Influence of materials.
Forests 11 00816 g018
Table 1. Elastic constant of timber.
ParameterValue
E L 13,700 Mpa
E R 2240 Mpa
E T 1140 Mpa
G LT 1060 Mpa
G LR 1610 Mpa
G TR 460 Mpa
μ RT 0.75
μ LR 0.45
μ LT 0.51
Table 2. Elastic constant.
Material ParameterAsh Value
E L 15,790 Mpa
E R 1516 Mpa
E T 827 Mpa
G LT 896 Mpa
G LR 1310 Mpa
G TR 269 Mpa
μ RT 0.71
μ LR 0.46
μ LT 0.51

