Article

Organic Carbon Storage and 14C Apparent Age of Upland and Riparian Soils in a Montane Subtropical Moist Forest of Southwestern China

1
College of Chemistry, Biology and Environment, Yuxi Normal University, Yuxi 653100, China
2
Department of Environmental Sciences, College of Natural Sciences, University of Puerto Rico, P.O. Box 70377, San Juan, PR 00936-8377, USA
3
College of Biology and the Environment, Nanjing Forestry University, Nanjing 210037, China
4
CAS Key Laboratory of Tropical Forest Ecology, Xishuangbanna Tropical Botanical Garden, Chinese Academy of Sciences, Kunming 650223, China
5
Research Institute of Tropical Forestry, Chinese Academy of Forestry, Guangzhou 510520, China
*
Author to whom correspondence should be addressed.
Forests 2020, 11(6), 645; https://doi.org/10.3390/f11060645
Submission received: 13 May 2020 / Revised: 2 June 2020 / Accepted: 4 June 2020 / Published: 5 June 2020
(This article belongs to the Special Issue Organic Carbon Pools and Storage in Forest Soil)

Abstract

:
Upland and riparian soils usually differ in soil texture and moisture conditions, thus, likely varying in carbon storage and turnover time. However, few studies have differentiated their functions on the storage of soil organic carbon (SOC) in sub-tropical broad-leaved evergreen forests. In this study, we aim to uncover the SOC storage and 14C apparent age, in the upland and riparian soils of a primary evergreen broad-leaved montane subtropical moist forest in the Ailao Mountains of southwestern China. We sampled the upland and riparian soils along four soil profiles down to the parent material at regular intervals from two local representative watersheds, and determined SOC concentrations, δ13C values and 14C apparent ages. We found that SOC concentration decreased exponentially and 14C apparent age increased linearly with soil depth in the four soil profiles. Although, soil depth was deeper in the upland soil profiles than the riparian soil profiles, the weighted mean SOC concentration was significantly greater in the riparian soil (25.7 ± 3.9 g/kg) than the upland soil (19.7 ± 2.3 g/kg), but has an equal total SOC content per unit of ground area around 21 kg/m2 in the two different type soils. SOC δ13C values varied between −23.7 (±0.8)‰ and −33.2 (±0.2)‰ in the two upland soil profiles and between −25.5 (±0.4)‰ and −36.8 (±0.4)‰ along the two riparian soil profiles, with greater variation in the riparian soil profiles than the upland soil profiles. The slope of increase in SOC 14C apparent age along soil depth in the riparian soil profiles was greater than in the upland soil profiles. The oldest apparent age of SOC 14C was 23,260 (±230) years BP (before present, i.e., 1950) in the riparian soil profiles and 19,045 (±150) years BP in the upland soil profiles. Our data suggest that the decomposition of SOC is slower in the riparian soil than in the upland soil, and the increased SOC loss in the upland soil from deforestation may partially be compensated by the deposition of the eroded upland SOC in the riparian area, as an under-appreciated carbon sink.

1. Introduction

Soil organic matter, as the largest carbon pool in terrestrial ecosystems, plays an important role in regulating soil biogeochemistry and ecosystem functioning [1,2,3,4]. As a fundamental part of soil organic matter, soil organic carbon (SOC) comprises not only soil biomass, biotic residues and their decomposing byproducts, but also includes a small part of highly carbonized compound such as charcoal, graphite and coal [5,6,7]. The forest ecosystem is an essential and important component of global terrestrial SOC storage and carbon cycling [8,9]. Various factors or measures can increase SOC storage in forest ecosystems, including reforestation or revegetation of abandoned agricultural land and human ruined forest ecosystems, and effective management of existing forest ecosystems with fertilization [10,11,12,13]. It is reported that about 40% of soil carbon in the tropical zones is stored in forest soils [14,15]. Moreover, many studies performed from local scales to the global meta-analyses demonstrate that SOC storage varies greatly across multiple landscapes differing in climate, topography (ridge, slope and valley) and land uses (agroforestry, agriculture, forest and pasture) [14,16,17,18,19,20]. Thus, significant uncertainties exist in estimating soil carbon storage over large areas.
One of the main difficulties for ecologists is clarifying the distribution and turnover rates of SOC reservoir along soil profiles, and among various landscapes, in order to understand the global carbon sinking and cycling [10,21,22]. It is reported that SOC concentration varies greatly across soil types, topographic positions and vegetation types within a landscape, and decreases rapidly from the topsoil to a certain soil depth, in which SOC concentration being maintaining a relative stable value down to the soil parent material [14,16,22]. Therefore, it is crucial to identify the controlling factors for SOC storage and their turnover time, and to observe the variations of SOC vertical distribution across various landscape positions within a forest ecosystem. Moreover, worldwide deforestation and the subsequent land-use changes are predicted to cause massive landslides and soil erosion, as well as to elevate carbon release rate from the soil to the atmosphere [23,24,25]. The changing soil environment, caused by intensive deforestation and land-use changes, should be considered as one of the important factors for estimating changes in SOC storage and carbon cycling.
SOC concentration is typically viewed as a function of soil clay, which is a product of interaction among soil forming factors, including time, vegetation type, topography, climate and soil parent materials [5,22,26,27,28,29,30]. SOC contents in the top 20 cm soil layer of shrub-land, grassland and forest can respectively reach to 33%, 42% and 50% of total SOC storage stored in the entire soil profile, suggesting the key roles of climate and vegetation in SOC formation [18,22]. Variation of SOC δ13C values (an isotopic signature, measuring the ratio of stable isotopes 13C/12C) along soil depth or SOC 14C apparent age often indicate changes in paleovegetation and paleoclimate, because plant species produce organic compounds with varying δ13C signatures and contrasting organic matter turnover rates in the context of climate change [31,32,33]. At the Dinghushan Biosphere Reserve of southern China located in the similar latitudinal zone as the Ailao Mountains, the spatial and temporal distribution of SOC δ13C value and 14C age along soil depth varied with topography and vegetation across an altitudinal gradient [16,34,35]. Within a forest ecosystem, upland and riparian soils usually differ in parent materials, topographic position, water availability and tree species composition [36]. The upland area usually has residual soils with no water logging, while the riparian area usually has alluvial soils with water logging at a certain depth or for a period of time during each year. Abundant data on SOC in upland soil are available in the literature [16,37,38], but few data are reported from riparian soils, which are part of the forest landscape, probably due to their small fraction of the total forest area.
China has evergreen broad-leaved forest with the widest distribution and the largest area in the world from 24° N to 32° N and from 99° E to 123° E [39,40]. As an important component of the subtropical terrestrial ecosystems, the evergreen broad-leaved forests play a significant role in preserving biodiversity, protecting ecological environment, providing ecosystem service, regulating climate conditions, maintaining the balance of local and global carbon cycling, and sustaining the development of human society [41,42,43,44,45]. The moist evergreen broad-leaved primary forest in the Ailao Mountains is the largest area of the evergreen broad-leaved forest in the subtropical region of China and probably the world, with many endemic plants as the dominant species [46]. Together, with its special geographical locations (low in latitude and high in altitude), the heterogeneity of topography and microclimate contributes to the unique congenital advantage for species diversity [47,48]. The broad-scale forest ecosystem serves as a water reservoir during raining season and as a water source during dry season, reducing natural calamities for the downstream crops. The high altitude, steep slope and abundant rainfall allow for the development of abundant riparian areas in the subtropical evergreen broad-leaved forest of the Ailao Mountains.
Soils in the forest ecosystems at the Ailao Mountains Natural Reserve include upland soil in the upstream forest and riparian soil in the downstream shrub meadow. We hypothesize that SOC concentration is higher and its 14C apparent age is higher in the riparian soil than in the upland soil, because decomposition of SOC is slower in the often-saturated riparian soil and there is an extra input of organic debris from the upland forest. We conceived and designed this study, in order to understand the roles of upland and riparian soils in SOC storage and turnover rate in an evergreen broad-leaved subtropical moist forest of southwestern China. Our objectives were to: (1) Examine the distribution patterns of SOC concentration and 14C apparent age along the upland and riparian soil profiles; and (2) compare SOC content and 14C apparent age between the upland and riparian soils. We carried out this study in the Ailao Mountains Natural Reserve of Yunnan province and determined SOC concentration, δ13C value and 14C apparent age in the samples obtained from both, the upland and riparian soils in two watersheds.

2. Materials and Methods
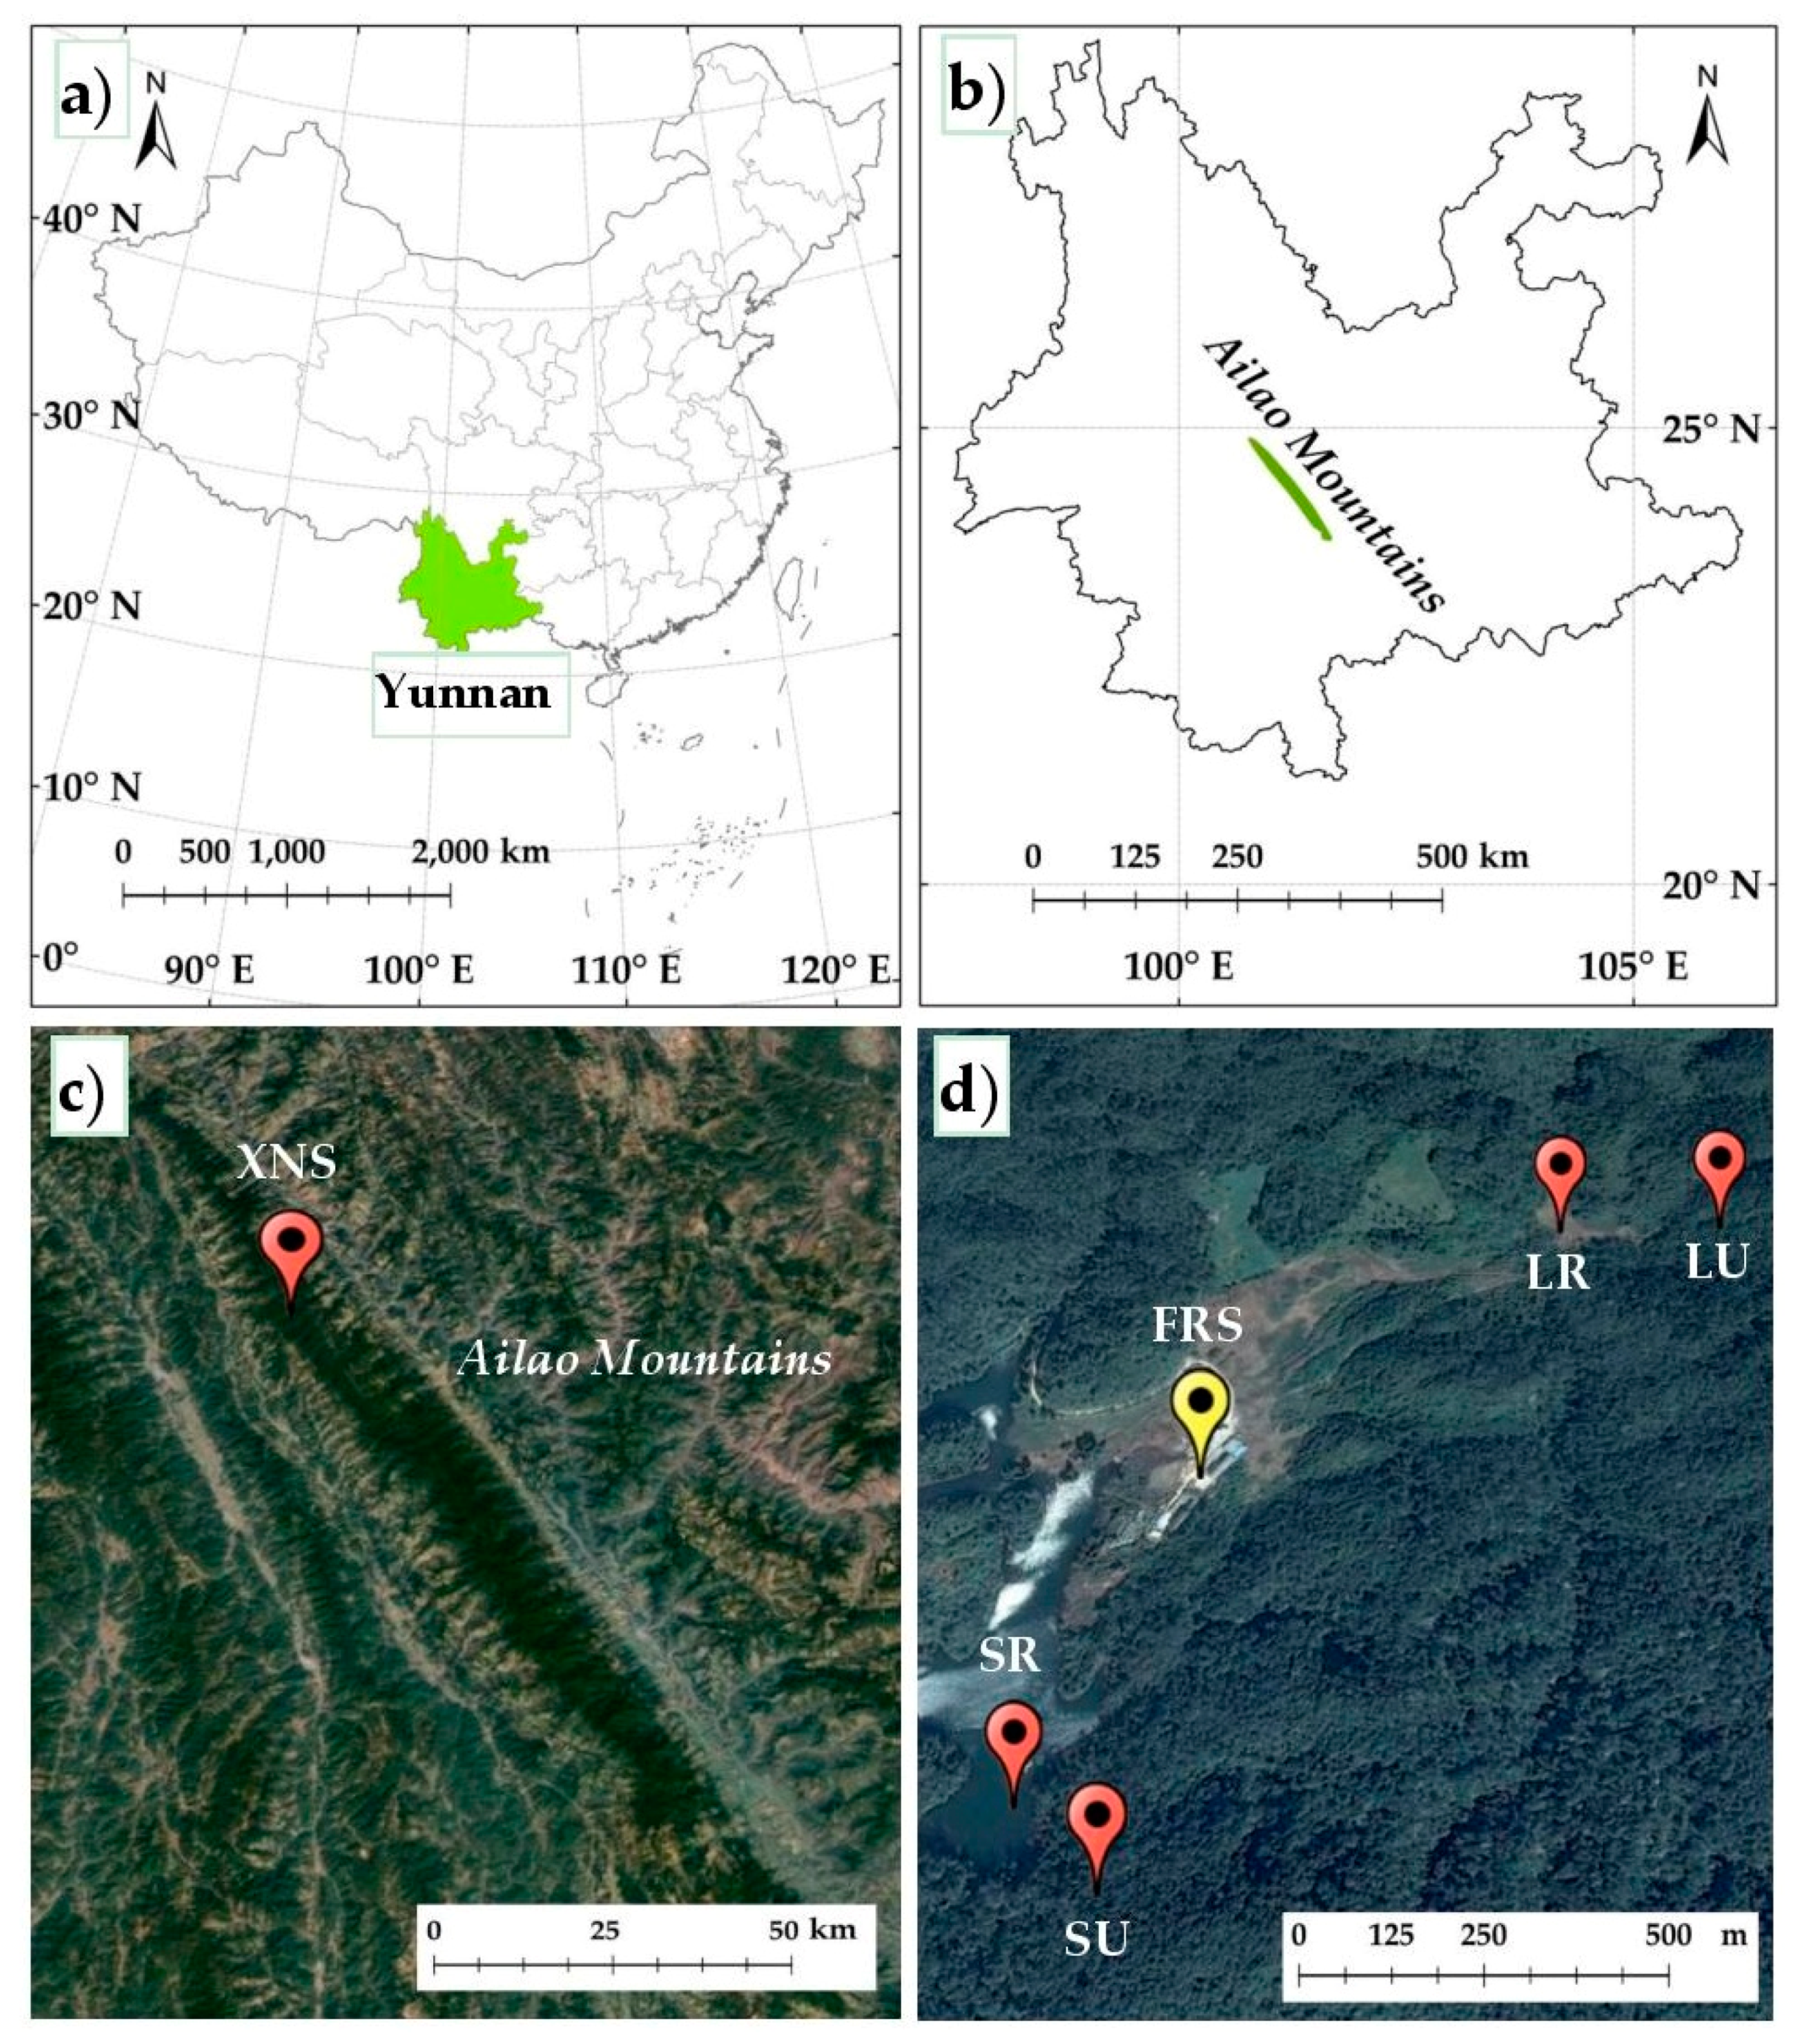
2.1. Study Sites

We conducted this study in the Xujiaba Nature Sanctuary located in the central area of the Ailao Mountains Natural Reserve (23°35′ N–24°44′ N, 100°54′ E–101°30′ E, at 2000–2650 m a.s.l. elevation) in Yunnan province of southwestern China (Figure 1). Due to the remote geographic location, the area is covered by the primary forest with, or without, little anthropogenic disturbance during the past centuries. Mean annual precipitation is about 1931 mm, with more than 85% allocating to the wet season from May to October, and less than 15% allocating to the dry season from November to the next April [49,50]. The annual mean temperature is 11.3 °C, with the coldest mean monthly temperature of 5.4 °C in January and the hottest mean monthly temperature of 15.6 °C in July [49]. The climate is classified as a wet and dry tropical climate (Cwa) based on the updated Köppen-Geiger classification system [51]. Frequent natural disturbance includes strong wind and occasional cold spell with accompanied heavy snowfall in winter [52]. The main vegetation types include the primary subtropical evergreen broad-leaved forest in upland area with the dominant species of Lithocarpus xylocarpus (Kurz) Markgr., Castanopsis wattii (King) A. Camus, Lithocarpus chintungensis Hsu et HJ Qian, Illicium macranthum AC. Smith, Machilus yunnanensis Lecomte., Machilus bombycina King. ex Hook.f., Schima noronhae Reinw. ex Blume., Manglietia insignis (Wall.) Bl, Machilus viridis Hand. -Mazz., and Hartia siensis Dunn, and the secondary vegetation with the dominant species of Populus bonatii (Levl.) and Alnus nepalensis (D. Don) [49,53]. The downland riparian valley is occupied by the secondary shrubby meadow vegetation following anthropogenic disturbance and deforestation due to the construction of a river dam. The meadow shrubs mainly include Eupatorium adenophorum Sprengel [Syn. Ageratina adenophora (Sprengel) R. M. King and H. Robinson], Lyonia ovalifolia Hort. ex Gard, Hypericum uralum Buch., Gaultheria forrestii Diels, and Osbeckia opipara C. Y. Wu et C. Chen [54,55]. The soil, both in the upland and riparian areas, belongs to loamy Alfisols, with a pH of 4.2, a SOC concentration of 116 g/kg, a total nitrogen concentration of 17 g/kg, a soil microbial biomass carbon of 2.51 g/kg, and a soil labile organic carbon of 5.39 g/kg in the top 10 cm mineral soil [56,57]. The upland soil is typically yellow-brown loam developed from schist, gneiss and diorite, whereas the riparian soil is an alluvial deposit [58].

2.2. Field Sampling and Laboratory Processing

We selected two local representative watersheds in the Xujiaba Nature Sanctuary, the Laojunshanshen watershed and the Sankeshu watershed, as our study sites, because they were protected as the field experimental sites in the long term without intense anthropogenic disturbances [59,60]. In each of these two watersheds, the vegetation types include the primary forest in upland area and the shrubby meadow in riparian valley (Table 1 and Figure 2). We excavated two soil profiles in each of the two selected watersheds, one from the upland forest and another from the riparian shrubby meadow. We named these four soil profiles as LU and LR for the upland and riparian sites in the Laojunshanshen watershed and SU and SR for the upland, and riparian sites in the Sankeshu watershed, respectively. Each soil profile was located in the area >50 m far away from the boundary between the upland and riparian vegetations.
We collected all the soil samples in August 2010. At each site, we vertically dug a soil pit down to the parent material with a maximum depth of 2.05 m at the LU site, 1.55 m at the LR site, 1.20 m at the SU site, and 1.15 m at the SR site (Table 1). The LU site had a thick layer of floor mass and humus on the mineral soil surface with roots of the dominant tree species reaching 1.85 m belowground, the deepest among the four soil profiles. The LR soil profile had a relative flat level topography and high ground water table about 0.50 m (Figure 2 LR). In the process of soil sampling, we had to excavate the soil profile and collect the soil samples quickly because perennial groundwater could fill up the soil pit within one hour of time. Sparse shrub and dense grass roots concentrated in the shallow soil layers, around down to 25 cm deep. The SU soil profile was located in the middle of a steep slope of approximately 30° with a thin layer of floor mass and humus. Tree roots reached to 1.10 m soil depth. Although there was no apparent water table within the SR soil profile, the deep soil layers showed a grey color, indicating seasonal water saturation (Figure 2 SR). All plants in riparian sites are terrestrial plants.
We collected top layer 0–5 cm soil sample from each soil profile both in the upland and riparian sites. The other soil samples below 5 cm in depth were collected at 10 cm intervals down to the parent material. Each soil sample was sealed in a plastic bag, transported to the laboratory, and stored in refrigerator at 4 °C before further determination of SOC concentration, δ 13C value and 14C age.
Due to the limits on research funding, we selected one soil sample from every other soil layer along each soil profile to determine SOC δ13C value and 14C age (i.e., the soil samples along the soil profiles in LU and LR included soil layers with 0–5 cm, 15–25 cm, 35–45 cm, and so on; and the soil samples along the soil profiles in SU and SR included soil layers with 5–15 cm, 25–35 cm, 45–55 cm, and so on.). We weighed 50 g fresh soil from each selected soil sample, sealed in the plastic bag and sent to the Xi’an Accelerator Mass Spectrometry Center of the Institute of Earth Environment (the Chinese Academy of Sciences) to determine SOC δ13C value and 14C age, and saved the rest of the soil samples for further physical and chemical analyses.
In the Xi’an Accelerator Mass Spectrometry Center, all visible plant fractions, soil animals and rock fragments were removed from fresh soil samples. Soil samples were then oven-dried at 75 °C–85 °C for 24 h, and ground and stored in plastic bags. After carbonates with 0.1 mol/L hydrochloric acid (HCl) were excluded, the soil samples were rinsed repeatedly with distilled water, oven-dried again, and saved as the pretreated samples. SOC 13C was determined using the pretreated samples with a Finnigan MAT-251 mass spectrometer (Finnigan Mat/The Mass Spectrometry Company, Hemel Hempstead, UK). The results were reported as SOC δ13C following the International Pee Dee belemnite standard [61].
To determine 14C age, the pre-treated soil samples were placed in quartz tubes and combusted at around 800 °C. The produced CO2 was converted into Li2C2 at around 650 °C in a Li-reactor, and converted into C6H6 after being hydrolyzed to C2H2. 14C data from the C6H6 were determined using a 1220 Quantulus ultralow-level liquid scintillation spectrometer (Perkin-Elmer Inc., Turku, Finland). All the 14C results were normalized with δ13C and reported in radiocarbon dates as years before present (1950), i.e., BP [62].
Soil physical and chemical data were determined in the chemistry laboratory of the Xishuangbanna Tropical Botanical Garden (the Chinese Academy of Sciences) using air-dried and sieved through 2 mm soil samples. Soil texture was determined according to the USDA classes [63]. We weighed 50 g air-dried soil sample, mixed it adequately in 40 mL sodium hydroxide (NaOH, 0.50 mol/L) and then 250 mL distilled water, shook the mixed solution for 8 h, filtered using filter paper with different diameters (0.002 mm and 0.05 mm) after stirring, then left for a scheduled period of time, oven-dried and weighed each component with different particle sizes. Soil carbon density fraction was divided into light (<1.6 g/cm3), medium (1.6–2.0 g/cm3), and heavy (>2.0 g/cm3) fractions by chemical sodium polytungstate (Na6O39W12) [64]. We weighed 20 g of air-dried and acid-treated soil sample, stirred and mixed adequately in sodium polytungstate solution with different densities, and determined carbon concentration in each suspension. SOC concentration was determined by the sulfuric acid-potassium dichromate method [65]. We weighed 0.50 g air-dried and acid-treated soil sample, mixed and shook adequately in 5 mL potassium dichromate (K2Cr2O7) and 5 mL concentrated sulfuric acid (H2SO4), heated to 175–185 °C for 5 min, titrated with ferrous sulfate (FeSO4) after cooled the solution, and calculated carbon concentration in soil sample using the volume of consumed ferrous sulfate. The SOC fraction includes all SOC, except possibly for a small amount of acid-soluble SOC.

2.3. Data Analyses

We fitted the linear regression model between SOC concentration and soil clay percent, as well as between SOC 14C apparent age and soil depth, both in the upland and riparian soils,
Y = a X + b ,
where Y is the SOC concentration or 14C apparent age; X is soil clay percent or soil depth; a is the slope constant reflecting SOC concentration increase rate with soil clay content or SOC 14C apparent age increase rate with soil depth; and b is the intercept. We excluded the SOC 14C data from the bottom two soil layers in the SR soil profile because of their apparent abnormalities as outliers.
We fitted exponential regression between SOC concentration and soil depth both in the upland and riparian soils,
Y = A e B X + Y 0 ,
where Y is SOC concentration; X is soil depth; A + Y0 is the maximum SOC concentration in the surface soil when X is zero; B is decay rate.
We compared the statistical difference of soil moisture and SOC concentration among three soil layers (0–5 cm, 5–10 cm and 15–25 cm) for each soil profile, and total SOC storage (content) in the whole soil profiles per unit of ground area and SOC concentration in each soil layer per unit of soil weight among the four soil profiles by one-way ANOVA using the software Statistical Package for the Social Sciences 20 (SPSS 20, IBM Corp. RA Johnson and DW Wichern, Armonk, NY, USA, 1992). We log-transformed all the data prior to the analyses for meeting the homogeneity (Levene’s test [66]) and normality (Kolmogorov–Smirnov test [67]) requirements. In addition, we analyzed the statistical difference of slopes and intercepts in equation (2) between the upland and riparian soils using the paired t-test [68]. All the significance level was set at p < 0.05.

3. Results and Discussion

3.1. Soil Moisture, Texture and Carbon Density Fraction

The soil properties in the top 25 cm soil layers including soil moisture, texture, SOC concentration and carbon density fractions differed substantially between the upland and riparian soils and among different soil layers (Figure 3). Mean soil moisture was apparently higher in the riparian soils than in the upland soils and is the highest in the 0–5 cm soil layer among the three shallow soil layers in the four soil profiles. The upland soils contained apparently less sand fraction and more silt or clay fractions than the riparian soils. There were no significant differences in sand fraction among the three surface soil layers for either the upland or riparian soils, but soil clay fraction was the highest in the 0–5 cm soil layer among the top three soil layers both in the upland and riparian sites. SOC concentration was the highest in the top 0–5 cm soil layer, midterm in the 5–15 cm soil layer and the lowest in the 15–25 cm soil layer among three soil layers in the four soil profiles. Although riparian soils had higher fraction of heavy organic carbon on the surface 0–5 cm soil layer than the upland soils, the upland soils had a higher fraction of light organic carbon in all the three soil layers than the riparian soils. There was not apparent pattern between SOC concentration and soil clay content in the LR soils, but SOC concentration correlated linearly and positively with soil clay content in the other three soils (Figure 4).

3.2. Vertical Variation and Storage of SOC

SOC concentration was the highest in the topsoil layer and decreased exponentially with soil depth both in the upland and riparian soils (Figure 5). The depth to the soil parent material was deeper for the upland soil profiles than the riparian soil profiles, with an average depth of 1.80 m and 1.20 m, respectively. However, total SOC storages per unit surface area did not differ between the upland and riparian soils because the weighted average SOC concentration per soil weight was greater in the riparian soil profiles (25.7 ± 3.9 g/kg) than the upland soil profiles (19.7 ± 2.3 g/kg), which compensated for the smaller soil volume in the riparian soil profiles (Figure 6).
The main factors determinant of soil formation and development, include climate, parent material, topography, biota and time [28,69]. The climate shows the overarching control on SOC because temperature and moisture predominantly affect both, photosynthesis and decomposition in terrestrial ecosystems. Under the same climate conditions, soil clay content becomes the integrator of these main factors associated with soil development and SOC levels [70,71,72]. However, the role of climate and soil clay in SOC formation is weakened under anaerobic conditions when oxygen becomes the dominant control over SOC decomposition [73,74,75]. This is consistent with our study in the LR soil profile (Figure 2 LR and Figure 4). It is obvious that SOC concentrations in the upland soils are largely under the influence of soil clay, while SOC concentrations in riparian soils are probably controlled by additional factors. Topographical differentiation between upland and riparian area creates the exact contrast between the permanently aerobic upland soils and the partially or permanently anaerobic riparian soils, and this differentiation might affect SOC decomposition levels and would result in relatively high SOC concentration in the riparian soils. In our study, SOC concentration is higher in the riparian soils than in the upland soils and is consistent with the previous studies [76,77,78]. However, bulk SOC per unit area does not differ between the upland and riparian soils, due to deeper soil depths in the upland soil profiles than the riparian soil profiles (Figure 6).
The riparian soils are known to be under periodical water saturated conditions [36,79]. Through its influence on anaerobic conditions in riparian soils, topography may become a prominent control over climate and clay on the decomposition of SOC, resulting in higher SOC concentration in the riparian soils than in the upland soils, regardless of lower clay content in the former.
Soil age is one of five principal controls of soil development including the accumulation of SOC [28,80]. Riparian and upland soils differ in soil-age profile. Riparian soils are deposited sequentially as soil is transported from the upland, therefore soil age increases with depth. Upland soils develop by weathering, so that soil age decreases with depth. The deposition processes in the riparian alluvial soils create a soil profile in which the youngest soils are located on the surface and the oldest soils are located in the bottom of the soil profile. In contrast, the upland residual soils are developed from the parent materials where the youngest soils are formed at the bottom of the soil profile, and the oldest soils are those located on the surface, and soil age decreases with depth (Figure 7). Regardless of soil age profile, high SOC concentration occurs on the surface soil in both the upland and riparian soils and decreases exponentially as soil depth increases, suggesting that time, on the scale of older than centuries associated with alluvial deposition, plays little role on the accumulation of SOC in the riparian soils in the subtropical moist forest. Moreover, SOC and soil will not necessarily have the same age distribution along soil profiles because of transport of soil bearing SOC or charcoal from surface to bottom layers.
The SOC concentration in six soil profiles at the Dinghushan Biosphere Reserve, which had the similar latitude and forest type to the Ailao Mountains Natural Reserve [16,81], also decreased exponentially from the topsoil to the bottom soil layer. In our study, the SOC concentration had a similar pattern along soil profile in the four soil profiles, with the highest SOC concentration in the topsoil layer, the rapid decreasing concentration with soil depth from the topsoil to a certain soil layer, and a relative stable concentration after a certain soil layer. The study was carried out in the six soil profiles of the Dinghushan Biosphere Reserve, showing that SOC concentration started to keep a relative stable value from around 40 cm soil depth down to the soil parent material [16]. However, we found that SOC concentration decreased quickly from the topsoil to about 50 cm soil depth in our study, and then kept a relatively stable value, probably resulting from its special soil characteristics and hydrological conditions [16,82]. In addition, the soil in our study site belonged to sandy loam with sand predominant, which was convenient to accumulate and sink SOC along soil profiles. Moreover, the relatively gentle slope and plenty of surface water and groundwater offered convenient conditions for SOC deposition in the riparian sand loamy soils.
Compared to the upland soil profiles, the riparian soil profiles have advantages to accumulate more SOC, likely because: (1) The perennial water flow inhibit soil microbial activity and SOC decomposition, especially during the wet season and wet year; and (2) the extra input of plant litter and topsoil from the upland forest. While, the upland soil profile in the upstream forest has deeper soil depth, the riparian soil profile in the downstream shrubby meadow has higher average SOC concentration, resulting in a similar total SOC storage per unit of ground area, between the upland and riparian soils. Overall, the riparian soil plays an important role in retaining SOC, and the riparian soil has greater potential to sequestrate SOC than the upland soil per unit soil volume.

3.3. SOC 14C Apparent Age

Topsoil had the youngest SOC 14C apparent age for both the upland and riparian soil profiles and SOC 14C apparent age increased linearly as soil depth increased, with two exceptions for the bottom two soil layers (85–95 cm and 105–115 cm) of the SR soil profile (Figure 8). The riparian soils had older SOC 14C apparent age than the upland soils. The oldest SOC 14C apparent age in the riparian soils was 23,260 (±230) years BP in the soil layer of 95–105 cm of the LR soil profile, whereas it was 19,040 (±150) years BP in the soil layer of 195–205 cm of the upland soils. Similarly, the youngest SOC 14C apparent age in the upland soils was 145 (±50) years BP in the topsoil of the LU soil profile, whereas it was 820 (±50) years BP in the riparian soils of the LR soil profile. Soils from the Laojunshanshen watershed had overall older SOC 14C apparent age than soils from the Sankeshu watershed. Correlation slopes of the two riparian soils were greater than those of the upland soils and did not differ between the riparian soils, suggesting that soil deposition in the riparian soils is faster than the soil formation in the upland soils (Figure 8 and Table 2). Correlation intercept was greater in upland soil than its corresponding riparian soil from the same watershed.
The riparian soils appear to have older SOC 14C apparent age than the upland soils in the corresponding same soil layer of the two watersheds, suggesting a slower turnover rate of SOC in the riparian soils. The anaerobic conditions resulting from the periodical flooding in the riparian soils can be a limiting factor for the decomposition of SOC and plant litter as shown in Ruan et al. [36]. The riparian soils were shown to be lower in soil oxygen levels [83], lower soil microbial biomass [36], and higher in SOC concentration than the upland soils. These conditions can all contribute to a reduced SOC turnover rate in the riparian soils. Our SOC δ13C data also showed lower values and larger variations for the riparian soils than the upland soils, suggesting a moist but variable soil environment in the riparian soils. Especially in the SR soil profile, it appeared to gradually accumulate massive old carbon in soil between 3500 and 6300 years BP and resulted in intensive decrease of SOC δ13C value.
SOC 14C apparent age increases with soil depth in both the upland and riparian soils even though soil age is the youngest at the parent material layer in the bottom of the upland soil profiles (Figure 7), suggesting that the SOC apparent age is independent of soil age at pedological time scale (weathering of parent materials) of more than thousands of years in the upland soils. Our data showed a trend of continuous downward movement of old SOC towards the bottom of soil profile regardless of the relative soil age at the bottom (young in residual soil and old in alluvial soil) or the input of root carbon throughout the rooting zone. This downward movement of old SOC challenges, in part, the doctrine that SOC is stabilized by soil mineral and clay [71,72]. If SOC were protected by soil minerals, the relatively old upland surface soil should retain the oldest SOC and the young upland parent materials should have the youngest SOC. Clay accumulates largely in the B horizon. If SOC were protected by soil clay, high SOC concentration should occur in the B horizon where soil clay content could reach to the highest, and the oldest SOC should not occur in the C horizon where soil age is the youngest and clay content is relatively low in the upland.
There are three possible mechanisms resulting in the downward movement of old SOC along soil profiles (Figure 7): (1) Solid SOC with mineral clay (organo-mineral complex) or without mineral clay moves downward along soil profile [84,85]; (2) DOC moves from ground surface down to deep soil layers [86,87]; and (3) root inputs (litter and exudates) occurs in deep soil layers. It is becoming clear that SOC is composed of plant debris carbon and humus carbon, derived from microbial necromass, or dead microbial cell walls, and the decomposition of microbial necromass is extremely slow [78,88,89]. These microbial necromass are preserved in soil likely because (1) they are physically isolated from microbial access by clay protection, or (2) evolution and natural selection do not allow for microbes to decompose their own cell walls. Thus, old microbial necromass moves downward either with or without soil clay along soil profile to the bottom toward parent materials. However, the linear correlation between SOC 14C apparent age and soil depth suggests that SOC down movement is most likely accompanied by the clay downward movement rather than microbial necromass alone, because the movement of necromass alone would be clay-content dependent resulting in a non-linear correlation. If SOC were passed to bottom soil through DOC or root inputs, SOC 14C apparent age would decrease with soil age, which conflicts with our observation in the upland soils. Therefore, it is most likely that the SOC moves downwards in the solid form of organo-mineral (or necromass-mineral) complex. This organo-mineral movement was attributed to DOC movement in Michalzik et al. study because they did not consider the possibility of this new mechanism [87].
Worldwide mean residual time of SOC was reported as 2100 years BP [37]. Our mean SOC 14C apparent ages were substantially greater, 7930 (±1470) years BP and 9300 (±1960) years BP for the upland and riparian soils, respectively. In addition, our oldest SOC 14C apparent age was older than that of the upland soils at the Dinghushan Biosphere Reserve (23,260 years BP vs. 12,790 years BP), but was comparable with those of the European pine and spruce forests whose carbon age ranged between 16,750 and 32,500 years BP [90].
One possible error for the estimated SOC 14C apparent age was the inclusion of charcoal particles in the soil samples. We found the presence of charcoals in most of the soil layers of our four soil profiles. Charcoal might be present in deep soil layers through either incomplete combustion of coarse roots or the washdown of surface charcoal along soil tunnels originated from dead roots or faunal activities. Charcoal presence may increase or decrease the estimated age of SOC, depending on their relative turnover time. It was reported that charcoals could be protected and saved in the soil profile for as short as 2000 years or for as long as 40,000 years [91,92,93].
Deforestation occurs widely in the past decades and is seen as the second largest cause of increase in atmospheric carbon after fossil fuel combustion [94,95,96,97]. Deforestation can often cause soil erosion in the upland areas and deposit these eroded upland soil and accompanying organic debris in the riparian area. The reduced decomposition rate and increased concentration of SOC in riparian soils may function partially as a sink of SOC, thus, can potentially reduce the emission of carbon to atmosphere after deforestation, resulting in an underestimated function of riparian soils. Therefore, riparian soils can serve as temporary sinks for some of the soil carbon that would otherwise be released quickly into the atmosphere after a severe disturbance in forest ecosystems.

3.4. SOC δ13C Distribution

The SOC δ13C values appeared to be lower for the riparian soils (with mean value −29.2 ± 1.8‰) than their corresponding upland soils (with mean value −26.5 ± 0.8‰) in the same watershed, varying mostly between −23.7‰ and −27.9‰ in the two upland soil profiles except one with the value −33.2‰ in the soil layer of 65–75 cm in the SU soil profile and between −25.5‰ and −36.8‰ in the two riparian soil profiles (Figure 9a). Variations of the SOC δ13C values with soil depth appeared to be greater in the riparian soils than in the corresponding upland soils (Figure 9b). Furthermore, soils from the Laojunshanshen watershed had overall lower SOC δ13C values than soils from the Sankeshu watershed. Because vegetation are all C3 plants, obvious lower mean SOC δ13C values in the riparian soils than those in the upland soils suggested that (1) less water stress in the riparian than the upland sites [36], (2) a reservoir effect existed in the riparian soils [98], or (3) different metabolic decompositions of soil organic matter occurred in these two different type soils [99]. It is apparent that water stress is less likely to occur in the riparian sites than in the upland sites in both, frequency and intensity due to topographical redistribution of water.
In our study, ground water is unlikely to impose a pronounced effect on SOC δ13C values in the riparian soils, because (1) the riparian sites have never been a lake with aquatic plants and animals, although the lake built in 1960’s was within a distance of 100–200 m [100]; (2) both the upland and riparian soils with a pH of 4.2 are developed from silicate igneous or metamorphic rocks [56,57]; (3) the lake water is not hardwater, or the riparian soils would have substantially higher SOC δ13C values than the upland soils if ground hardwater existed and had an influence on their δ13C values [101]; and (4) we pretreated all the soil samples with acid to remove carbonate effect on our carbon isotopic values. In the top 15 cm soil layer, SOC δ13C values varied between −26.7‰ and −27.1‰ in the two upland soil profiles and between −27.6‰ and −27.9‰ in the two riparian soil profiles with small difference (between −0.5‰ and −1.2‰) between the upland and riparian soils.
In addition, varying both soil environment and soil microbial biomasses and diversities between the upland and riparian soils may combust different SOC components (light, medium and heavy) or have different respiration rates, thus affect SOC δ13C values [102,103]. Riparian soils can be under anaerobic conditions with anaerobic microorganisms and slow decomposition rates that can result in more negative SOC δ13C values. Therefore, it is most likely that the lower SOC δ13C value in the riparian soils than in the upland soils is due to either the reduced water stress in the riparian sites or a reduced decomposition of SOC in the periodically water saturated riparian environments. Large difference in SOC δ13C values (up to 10 units) both within the riparian soils and between the upland and riparian soils occurred in deep (>15 cm) and old soil layers. This difference exceeded substantially the regular variation of about 4 units in SOC δ13C values due to water stress, suggesting a predominant microbial (anaerobic) influence on the fractionation of carbon isotopic values.

4. Conclusions

In summary, the riparian soils in the evergreen subtropical broad-leaved primary moist forest in the Ailao Mountains play an important role in SOC storage and turnover. Specifically, we found that: (1) SOC concentration decreases exponentially with soil depth both, in the upland and riparian soil profiles; (2) upland and riparian soil profiles accumulate equal amount of total SOC. However, the riparian soils have greater capacity to store SOC than the upland soils; (3) SOC 14C apparent age positively correlated with soil depth both in the upland and riparian soil profiles; and (4) SOC turnover time in the riparian soil profiles is longer than in the upland soil profiles. With equal soil depths, the riparian soils will store more SOC and older SOC than the upland soils, suggesting that the riparian soils can be viewed as a SOC reservoir in forest ecosystems. These outstanding characteristics of the riparian soils will increase SOC heterogeneity across the large landscape in forest ecosystems and decrease the rate of soil carbon release from the upland soils to the atmosphere. We therefore highlight the need to pay more attention to the riparian areas in the future, because the riparian soil in the forest ecosystems plays a distinct role as a SOC sink and inhibitor for SOC turnover, especially under the scenario of increasing rate of deforestation and land-use changes.

Author Contributions

X.L., M.C., and X.Z. conceived and designed this study; X.L., X.Z., and T.L. collected soil samples in the experimental forest; X.L. pretreated soil samples in the laboratory, investigated plot information, took the photos of the four soil profiles and determined soil moisture, soil texture and soil carbon density fraction; X.L. and X.Z. analyzed the data; X.L. make the tables and figures, and wrote the manuscript; X.Z., M.C. and T.L. revised the manuscript. All authors have read and agreed to the published version of the manuscript.

Funding

This research was funded by the Scientific Research Funding (Yunnan Provincial Department of Education, China; 2019J0739) and the National Natural Science Foundation of China (31040015).

Acknowledgments

Hua Du, Xuefeng Lu and Xiaohu Xiong in the Xi’an Accelerator Mass Spectrometry Center of Institute of Earth Environment (the Chinese Academy of Sciences) determined SOM δ13C and 14C data. We thank Douglas A. Schaefer working in the Xishuangbanna Tropical Garden for helpful comments, the staff of the Ailao Station for Forest Ecosystem Studies for field assistance, and Lu Qiao and Shangzhi Liu for collecting soil samples.

Conflicts of Interest

The authors declare no conflict of interest.

References

  1. Parton, W.J.; Scurlock, J.M.O.; Ojima, D.S.; Gilmanov, T.G.; Scholes, R.J.; Schimel, D.S.; Kirchner, T.; Menaut, J.-C.; Seastedt, T.; Garcia Moya, E.; et al. Observations and modeling of biomass and soil organic matter dynamics for the grassland biome worldwide. Glob. Biogeochem. Cycles 1993, 7, 785–809. [Google Scholar] [CrossRef] [Green Version]
  2. Paustian, K.; Parton, W.J.; Persson, J. Modeling soil organic matter in organic-amended and nitrogen-fertilized long-term plots. Soil Sci. Soc. Am. J. 1992, 56, 476–488. [Google Scholar] [CrossRef]
  3. Smith, P.; Smith, J.U.; Powlson, D.S.; McGill, W.B.; Arah, J.R.M.; Chertov, O.G.; Coleman, K.; Franko, U.; Frolking, S.; Jenkinson, D.S.; et al. A comparison of the performance of nine soil organic matter models using datasets from seven long-term experiments. Geoderma 1997, 81, 153–225. [Google Scholar] [CrossRef]
  4. Schmidt, M.W.I.; Torn, M.S.; Abiven, S.; Dittmar, T.; Guggenberger, G.; Janssens, I.A.; Kleber, M.; Kögel-Knabner, I.; Lehmann, J.; Manning, D.A.; et al. Persistence of soil organic matter as an ecosystem property. Nature 2011, 478, 49. [Google Scholar] [CrossRef] [PubMed] [Green Version]
  5. Nelson, D.W.; Sommers, L.E. Total carbon, organic carbon, and organic matter. Methods Soil Anal. Part 3—Chem. Methods 1996, 5, 961–1010. [Google Scholar]
  6. Hohl, H.; Varma, A. Chapter 1: Soil-the living matrix. In Soil Heavy Metals; Sherameti, I., Varma, A., Eds.; Springer: Heidelberg, Germany; Dordrecht, The Netherlands; London, UK; New York, NY, USA, 2010; Volume 19, pp. 1–18. [Google Scholar]
  7. Cook, S.F. The nature of charcoal excavated at archaeological sites. Am. Antiq. 1964, 29, 514–517. [Google Scholar] [CrossRef]
  8. Nave, L.E.; Vance, E.D.; Swanston, C.W.; Curtis, P.S. Harvest impacts on soil carbon storage in temperate forests. For. Ecol. Manag. 2010, 259, 857–866. [Google Scholar] [CrossRef]
  9. Achat, D.L.; Fortin, M.F.; Landmann, G.; Ringeval, B.; Augusto, L. Forest soil carbon is threatened by intensive biomass harvesting. Sci. Rep. 2015, 5, 1–10. [Google Scholar] [CrossRef]
  10. Torn, M.S.; Trumbore, S.E.; Chadwick, O.A.; Vitousek, P.M.; Hendricks, D.M. Mineral control of soil organic carbon storage and turnover. Nature 1997, 389, 170–173. [Google Scholar] [CrossRef]
  11. Binkley, D.; Resh, S.C. Rapid changes in soils following Eucalyptus afforestation in Hawaii. Soil Sci. Soc. Am. J. 1999, 63, 222–225. [Google Scholar] [CrossRef]
  12. Scott, N.A.; Tate, K.R.; Ford-Robertson, J.; Giltrap, D.J.; Smith, C.T. Soil carbon storage in plantation forests and pastures: Land-use change implications. Tellus B Chem. Phys. Meteorol. 1999, 51B, 326–335. [Google Scholar] [CrossRef]
  13. Johnson, D.W.; Curtis, P.S. Effects of forest management on soil C and N storage: Meta analysis. For. Ecol. Manag. 2001, 140, 227–238. [Google Scholar] [CrossRef]
  14. Eswaran, H.; Van Den Berg, E.; Reich, P. Organic carbon in soils of the world. Soil Sci. Soc. Am. J. 1993, 57, 192–194. [Google Scholar] [CrossRef] [Green Version]
  15. Pan, Y.D.; Birdsey, R.A.; Fang, J.Y.; Houghton, R.; Kauppi, P.E.; Kurz, W.A.; Phillips, O.L.; Shvidenko, A.; Lewis, S.L.; Canadell, J.G.; et al. A large and persistent carbon sink in the world’s forests. Science 2011, 333, 988–993. [Google Scholar] [CrossRef] [PubMed] [Green Version]
  16. Chen, Q.Q.; Shen, C.D.; Sun, Y.M.; Peng, S.L.; Yi, W.X.; Li, Z.A.; Jiang, M.T. Spatial and temporal distribution of carbon isotopes in soil organic matter at the Dinghushan Biosphere Reserve, South China. Plant Soil 2005, 273, 115–128. [Google Scholar] [CrossRef]
  17. Townsend, A.R.; Asner, G.P.; Cleveland, C.C. The biogeochemical heterogeneity of tropical forests. Trends Ecol. Evol. 2008, 23, 424–431. [Google Scholar] [CrossRef]
  18. Chatterjee, N.; Nair, P.K.R.; Chakraborty, S.; Nair, V.D. Changes in soil carbon stocks across the forest-agroforest-agriculture/pasture continuum in various agroecological regions: A meta-analysis. Agric. Ecosyst. Environ. 2018, 266, 55–67. [Google Scholar] [CrossRef]
  19. De Stefano, A.; Jacobson, M.G. Soil carbon sequestration in agroforestry systems: A meta-analysis. Agrofor. Syst. 2018, 92, 285–299. [Google Scholar] [CrossRef]
  20. Guo, L.B.; Gifford, R.M. Soil carbon stocks and land use change: A meta analysis. Glob. Chang. Biol. 2002, 8, 345–360. [Google Scholar] [CrossRef]
  21. Bascomb, C.L. Distribution of pyrophosphate-extractable iron and organic carbon in soils of various groups. J. Soil Sci. 1968, 19, 251–268. [Google Scholar] [CrossRef]
  22. Jobbágy, E.G.; Jackson, R.B. The vertical distribution of soil organic carbon and its relation to climate and vegetation. Ecol. Appl. 2000, 10, 423–436. [Google Scholar] [CrossRef]
  23. López-Rodríguez, S.R.; Blanco-Libreros, J.F. Illicit crops in tropical America: Deforestation, landslides, and the terrestrial carbon stocks. Ambio 2008, 37, 141–143. [Google Scholar] [CrossRef] [Green Version]
  24. Kavian, A.; Azmoodeh, A.; Solaimani, K. Deforestation effects on soil properties, runoff and erosion in northern Iran. Arab. J. Geosci. 2014, 7, 1941–1950. [Google Scholar] [CrossRef]
  25. Gandois, L.; Cobb, A.R.; Hei, I.C.; Lim, L.B.L.; Salim, K.A.; Harvey, C.F. Impact of deforestation on solid and dissolved organic matter characteristics of tropical peat forests: Implications for carbon release. Biogeochemistry 2013, 114, 183–199. [Google Scholar] [CrossRef] [Green Version]
  26. Burke, I.C.; Yonker, C.M.; Parton, W.J.; Cole, C.V.; Schimel, D.S.; Flach, K. Texture, climate, and cultivation effects on soil organic matter content in US grassland soils. Soil Sci. Soc. Am. J. 1989, 53, 800–805. [Google Scholar] [CrossRef]
  27. Fu, X.L.; Shao, M.G.; Wei, X.R.; Horton, R. Soil organic carbon and total nitrogen as affected by vegetation types in Northern Loess Plateau of China. Geoderma 2010, 155, 31–35. [Google Scholar] [CrossRef]
  28. Jenny, H. Chapter 2: Methods of presentation of soil data. In Factors of Soil Formation: A System of Quantitative Pedology; Dover Publications: Mineola, NY, USA, 1994; pp. 21–30. [Google Scholar]
  29. Percival, H.J.; Parfitt, R.L.; Scott, N.A. Factors controlling soil carbon levels in New Zealand grasslands is clay content important? Soil Sci. Soc. Am. J. 2000, 64, 1623–1630. [Google Scholar] [CrossRef]
  30. Chatterjee, N.; Nair, P.K.R.; Nair, V.D.; Bhattacharjee, A.; Filho, E.M.V.; Muschler, R.G.; Noponen, M.R.A. Do coffee agroforestry systems always improve soil carbon stocks deeper in the soil?—A case study from Turrialba, Costa Rica. Forests 2020, 11, 49. [Google Scholar] [CrossRef] [Green Version]
  31. Boutton, T.W. Stable carbon isotope ratios of organic matter and their use as indicators of vegetation and climate changes. In Mass Spectrometry of Soils; Boutton, T.W., Yamazaki, S., Eds.; Mercel Dekker: New York, NY, USA, 1996; pp. 47–82. [Google Scholar]
  32. Meyers, P.A.; Lallier-Vergès, E. Lacustrine sedimentary organic matter records of Late Quaternary paleoclimates. J. Paleolimnol. 1999, 21, 345–372. [Google Scholar] [CrossRef]
  33. Wang, G.; Feng, X.; Han, J.; Zhou, L.; Tan, W.; Su, F. Paleovegetation reconstruction using δ13C of soil organic matter. Biogeosciences 2008, 5, 1325–1337. [Google Scholar] [CrossRef] [Green Version]
  34. Shen, C.D.; Yi, W.X.; Sun, Y.M.; Xing, C.P.; Yang, Y.; Peng, S.L.; Li, Z.A. 14C apparent ages and δ13C distribution of forest soils in Dinghushan Natural Reserve. Quat. Sci 2000, 20, 335–344. [Google Scholar]
  35. Chen, Q.Q.; Shen, C.D.; Peng, S.L.; Sun, Y.M.; Yi, W.X.; Li, Z.A.; Jiang, M.T. Soil organic matter turnover in the subtropical mountainous region of South China. Soil Sci. 2002, 167, 401–415. [Google Scholar] [CrossRef]
  36. Ruan, H.H.; Li, Y.Q.; Zou, X.M. Soil communities and plant litter decomposition as influenced by forest debris: Variation across tropical riparian and upland sites. Pedobiologia 2005, 49, 529–538. [Google Scholar] [CrossRef]
  37. He, Y.J.; Trumbore, S.E.; Torn, M.S.; Harden, J.W.; Vaughn, L.J.S.; Allison, S.D.; Randerson, J.T. Radiocarbon constraints imply reduced carbon uptake by soils during the 21st century. Science 2016, 353, 1419–1424. [Google Scholar] [CrossRef] [PubMed] [Green Version]
  38. Wang, Y.G.; Li, Y.; Ye, X.H.; Chu, Y.; Wang, X.P. Profile storage of organic/inorganic carbon in soil: From forest to desert. Sci. Total Environ. 2010, 408, 1925–1931. [Google Scholar] [CrossRef]
  39. Song, Y.C. On the global position of the evergreen broad-leaved forests of China. In Vegetation Science in Forestry; Box, E.O., Peet, R.K., Masuzava, T., Yamada, I., Fujiwara, K., Maycock, P.F., Eds.; Kluwer Academic Publishers: Norwell, MA, USA, 1995; pp. 69–84. [Google Scholar]
  40. Song, Y.C.; Chen, X.Y.; Wang, X.H. Studies on evergreen broadleaved forests of China: A retrospect and prospect. J East China Norm. Univ. 2005, 1, 1–8. [Google Scholar]
  41. Wu, C.Z.; Hong, W.; Chen, H.; Lan, B.; Zheng, Q.R. Species diversity of subtropical evergreen broad-leaved forest in Wanmulin Mountain. J. Fujian Coll. For. 1996, 16, 33–37. [Google Scholar]
  42. Li, C.H. The distribution of evergreen broad-leaved forest in East Asia. Nat. Resour. 1997, 2, 37–46. [Google Scholar]
  43. Huang, W.; Lin, C.L.; Wu, C.Z.; He, D.J.; Chen, K. Research on species diversity of evergreen broad-leaved shelter-forests in Jianxi River valley, Fujian. Chin. Biodivers. 1999, 7, 208–213. [Google Scholar]
  44. Ding, S.Y.; Song, Y.C. Research advances in vegetation dynamic of evergreen broad-leaved forest. Acta Ecol. Sin. 2004, 24, 1765–1775. [Google Scholar]
  45. Yan, S.J.; Hong, W.; Hong, T.; Wu, C. Changes of species diversity in gap gradient of mid-subtropical evergreen broad-leaved forest in Wanmulin Forest. J. Appl. Ecol. 2006, 17, 947–950. [Google Scholar]
  46. Zhang, S.B.; Zheng, Z. Quantity and distribution of standing dead trees in montane moist evergreen broad-leaved forest in Ailao Mountain, Yunnan. J. Northeast For. Univ. 2009, 37, 3–13. [Google Scholar]
  47. He, Y.T.; Li, G.C.; Cao, M.; Tang, Y. Tree species diversity of a secondary broadleaved forest on Ailao Mountain in Yunnan. J. Trop. Subtrop. Bot. 2003, 11, 104–108. [Google Scholar]
  48. Shi, J.P.; Zhao, C.J.; Zhu, H. Characteristics and species composition of main vegetation types on west slope of the Ailao Mountains in Yunnan. Chin. J. Appl. Environ. Biol. 2005, 11, 1–7. [Google Scholar]
  49. Li, X.S.; Liu, W.Y.; Chen, J.W.; Yuan, C.M. Seedling regeneration in primary moist evergreen broad-leaved forest and different type secondary vegetation in Ailao Mountains. Chin. J. Ecol. 2009, 28, 1921–1927. [Google Scholar]
  50. Zhang, K.Y.; Zhang, Y.P.; Liu, Y.H.; Li, Y.R. Vertical distribution characteristics of rainfall in the Ailao Mountain. Sci. Geogr. Sin. 1994, 2, 144–151. [Google Scholar]
  51. Beck, H.E.; Zimmermann, N.E.; McVicar, T.R.; Vergopolan, N.; Berg, A.; Wood, E.F. Present and future Köppen-Geiger climate classification maps at 1-km resolution. Sci. Data 2018, 5, 180214. [Google Scholar] [CrossRef] [Green Version]
  52. Liu, W.Y.; Fox, J.E.D.; Xu, Z.F. Litterfall and nutrient dynamics in a montane moist evergreen broad-leaved forest in Ailao Mountains, SW China. Plant Ecol. 2003, 164, 157–170. [Google Scholar] [CrossRef]
  53. Yang, L.P.; Liu, W.Y.; Yang, G.P.; Ma, W.Z.; Li, D.W. Composition and carbon storage of woody debris in moist evergreen broad-leaved forest and its secondary forests in Ailao Mountains of Yunnan provinve. J. Appl. Ecol. 2007, 18, 2153–2159. [Google Scholar]
  54. Chai, Y.; Zhu, H.; Meng, G.T.; Shi, J.P.; Yang, G. Population structure and distribution pattern of dominant tree species in ancient tea tree community in Ailao Mountains of Yunnan province, China. For. Res. Beijing 2011, 24, 277–284. [Google Scholar]
  55. Li, Y.P.; Feng, Y.L. Differences in seed morphometric and germination traits of crofton weed (Eupatorium adenophorum) from different elevations. Weed Sci. 2009, 57, 26–30. [Google Scholar] [CrossRef]
  56. Zou, X.M.; Ruan, H.H.; Fu, Y.; Yang, X.D.; Sha, L.Q. Estimating soil labile organic carbon and potential turnover rates using a sequential fumigation–incubation procedure. Soil Biol. Biochem. 2005, 37, 1923–1928. [Google Scholar] [CrossRef]
  57. Chan, O.C.; Yang, X.D.; Fu, Y.; Feng, Z.L.; Sha, L.Q.; Casper, P.; Zou, X.M. 16S rRNA gene analyses of bacterial community structures in the soils of evergreen broad-leaved forests in south-west China. Fems Microbiol. Ecol. 2006, 58, 247–259. [Google Scholar] [CrossRef] [PubMed] [Green Version]
  58. Liu, W.Y.; Fox, J.E.; Xu, Z.F. Nutrient fluxes in bulk precipitation, throughfall and stemflow in montane subtropical moist forest on Ailao Mountains in Yunnan, south-west China. J. Trop. Ecol. 2002, 18, 527–548. [Google Scholar] [CrossRef]
  59. Feng, W.T.; Zou, X.M.; Schaefer, D. Above-and belowground carbon inputs affect seasonal variations of soil microbial biomass in a subtropical monsoon forest of southwest China. Soil Biol. Biochem. 2009, 41, 978–983. [Google Scholar] [CrossRef]
  60. Zheng, Z.; Zhang, S.B.; Yang, G.P.; Tang, Y.; Baskin, J.; Baskin, C.; Yang, L.Y. Abundance and distribution of cavity trees in an old-growth subtropical montane evergreen broad-leaved forest. Can. J. For. Res. 2009, 39, 2234–2245. [Google Scholar] [CrossRef]
  61. Srivastava, A.; Verkouteren, R.M. Metrology for stable isotope reference materials: 13C/12C and 18O/16O isotope ratio value assignment of pure carbon dioxide gas samples on the Vienna PeeDee Belemnite-CO2 scale using dual-inlet mass spectrometry. Anal. Bioanal. Chem. 2018, 410, 4153–4163. [Google Scholar] [CrossRef]
  62. Mook, W.G.; Van Der Plicht, J. Reporting 14C activities and concentrations. Radiocarbon 1999, 41, 227–239. [Google Scholar] [CrossRef] [Green Version]
  63. Fernandez-Illescas, C.P.; Porporato, A.; Laio, F.; Rodriguez-Iturbe, I. The ecohydrological role of soil texture in a water-limited ecosystem. Water Resour. Res. 2001, 37, 2863–2872. [Google Scholar] [CrossRef]
  64. Alvarez, R.; Russo, M.E.; Prystupa, P.; Scheiner, J.D.; Blotta, L. Soil carbon pools under conventional and no-tillage systems in the Argentine Rolling Pampa. Agron. J. 1998, 90, 138–143. [Google Scholar] [CrossRef]
  65. Kalembasa, S.J.; Jenkinson, D.S. A comparative study of titrimetric and gravimetric methods for the determination of organic carbon in soil. J. Sci. Food Agric. 1973, 24, 1085–1090. [Google Scholar] [CrossRef]
  66. O’Neill, M.E.; Mathews, K. Theory & methods: A weighted least squares approach to Levene’s test of homogeneity of variance. Aust. New Zealand J. Stat. 2000, 42, 81–100. [Google Scholar]
  67. Razali, N.M.; Wah, Y.B. Power comparisons of Shapiro-Wilk, Kolmogorov-Smirnov, Lilliefors and Anderson-Darling tests. J. Stat. Modeling Anal. 2011, 2, 21–33. [Google Scholar]
  68. Puth, M.T.; Neuhäuser, M.; Ruxton, G.D. Effective use of Pearson’s product–moment correlation coefficient. Anim. Behav. 2014, 93, 183–189. [Google Scholar] [CrossRef]
  69. Mage, S.M.; Porder, S. Parent material and topography determine soil phosphorus status in the Luquillo Mountains of Puerto Rico. Ecosystems 2013, 16, 284–294. [Google Scholar] [CrossRef]
  70. Parton, W.J.; Schimel, D.S.; Cole, C.V.; Ojima, D.S. Analysis of factors controlling soil organic matter levels in Great Plains Grasslands. Soil Sci. Soc. Am. J. 1987, 51, 1173–1179. [Google Scholar] [CrossRef]
  71. Sollins, P.; Homann, P.; Caldwell, B.A. Stabilization and destabilization of soil organic matter: Mechanisms and controls. Geoderma 1996, 74, 65–105. [Google Scholar] [CrossRef]
  72. Bird, M.; Kracht, O.; Derrien, D.; Zhou, Y.P. The effect of soil texture and roots on the stable carbon isotope composition of soil organic carbon. Soil Res. 2003, 41, 77–94. [Google Scholar] [CrossRef]
  73. Keiluweit, M.; Nico, P.S.; Kleber, M.; Fendorf, S. Are oxygen limitations under recognized regulators of organic carbon turnover in upland soils? Biogeochemistry 2016, 127, 157–171. [Google Scholar] [CrossRef] [Green Version]
  74. Cambardella, C.C. Carbon cycle in soils formation and decomposition. In Encyclopedia of Soil in the Environment; Elsevier Ltd.: Amsterdam, The Netherlands, 2005; pp. 170–175. [Google Scholar]
  75. McCauley, A.; Jones, C.; Jacobsen, J. Soil pH and organic matter. Nutr. Manag. Modul. 2009, 8, 1–12. [Google Scholar]
  76. Ricker, M.C.; Stolt, M.H.; Zavada, M.S. Comparison of soil organic carbon dynamics in forested riparian wetlands and adjacent uplands. Soil Sci. Soc. Am. J. 2014, 78, 1817–1827. [Google Scholar] [CrossRef]
  77. Hill, A.R.; Devito, K.J.; Campagnolo, S.; Sanmugadas, K. Subsurface denitrification in a forest riparianzone: Interactions between hydrology and supplies ofnitrate and organic carbon. Biogeochemistry 2000, 51, 193–223. [Google Scholar] [CrossRef]
  78. Ricker, M.C.; Stolt, M.H.; Donohue, S.W.; Blazejewski, G.A.; Zavada, M.S. Soil organic carbon pools in riparian landscapes of southern New England. Soil Sci. Soc. Am. J. 2013, 77, 1070–1079. [Google Scholar] [CrossRef]
  79. Luke, S.H.; Luckai, N.J.; Burke, J.M.; Prepas, E.E. Riparian areas in the Canadian boreal forest and linkages with water quality in streams. Environ. Rev. 2007, 15, 79–97. [Google Scholar] [CrossRef]
  80. Lin, H. Linking principles of soil formation and flow regimes. J. Hydrol. 2010, 393, 3–19. [Google Scholar] [CrossRef]
  81. Li, L.H.; Zhang, Y.P.; Tan, Z.H.; Song, Q.H.; Luo, Y.Y. Variation patterns of solar radiation above subtropical evergreen broadleaved forest and open area in Ailao Mountains. Chin. J. Ecol. 2011, 30, 1435–1440. [Google Scholar]
  82. Ding, P.; Shen, C.D.; Wang, N.; Yi, W.X.; Ding, X.F.; Fu, D.P.; Liu, K.X.; Zhou, L.P. Turnover rate of soil organic matter and origin of soil 14CO2 in deep soil from a subtropical forest in Dinghushan Biosphere Reserve, South China. Radiocarbon 2010, 52, 1422–1434. [Google Scholar] [CrossRef] [Green Version]
  83. Silver, W.L.; Lugo, A.E.; Keller, M. Soil oxygen availability and biogeochemistry along rainfall and topographic gradients in upland wet tropical forest soils. Biogeochemistry 1999, 44, 301–328. [Google Scholar] [CrossRef]
  84. Dwivedi, D.; Tang, J.Y.; Bouskill, N.; Georgiou, K.; Chacon, S.S.; Riley, W.J. Abiotic and biotic controls on soil organo–mineral interactions: Developing model structures to analyze why soil organic matter persists. Rev. Mineral. Geochem. 2019, 85, 329–348. [Google Scholar] [CrossRef] [Green Version]
  85. Keiluweit, M.; Bougoure, J.J.; Nico, P.S.; Pett-Ridge, J.; Weber, P.K.; Kleber, M. Mineral protection of soil carbon counteracted by root exudates. Nat. Clim. Chang. 2015, 5, 588–595. [Google Scholar] [CrossRef]
  86. Sanderman, J.; Amundson, R. A comparative study of dissolved organic carbon transport and stabilization in California forest and grassland soils. Biogeochemistry 2008, 89, 309–327. [Google Scholar] [CrossRef]
  87. Michalzik, B.; Tipping, E.; Mulder, J.; Gallardo Lancho, J.F.; Matzner, E.; Bryant, C.L.; Clarke, N.; Lofts, S.; Vicente Esteban, M.A. Modelling the production and transport of dissolved organic carbon in forest soils. Biogeochemistry 2003, 66, 241–264. [Google Scholar] [CrossRef]
  88. Miltner, A.; Bombach, P.; Schmidt-Brücken, B.; Kästner, M. SOM genesis: Microbial biomass as a significant source. Biogeochemistry 2012, 111, 41–55. [Google Scholar] [CrossRef]
  89. Certano, A.K.; Fernandez, C.W.; Heckman, K.A.; Kennedy, P.G. The afterlife effects of fungal morphology: Contrasting decomposition rates between diffuse and rhizomorphic necromass. Soil Biol. Biochem. 2018, 126, 76–81. [Google Scholar] [CrossRef]
  90. Willis, K.J.; Rudner, E.; Sümegi, P. The full-glacial forests of central and southeastern Europe. Quat. Res. 2000, 53, 203–213. [Google Scholar] [CrossRef]
  91. Wang, X.; van der Kaars, S.; Kershaw, P.; Bird, M.; Jansen, F. A record of fire, vegetation and climate through the last three glacial cycles from Lombok Ridge core G6-4, eastern Indian Ocean, Indonesia. Palaeogeogr. Palaeoclimatol. Palaeoecol. 1999, 147, 241–256. [Google Scholar] [CrossRef]
  92. Burbridge, R.E.; Mayle, F.E.; Killeen, T.J. Fifty-thousand-year vegetation and climate history of Noel Kempff Mercado National park, Bolivian Amazon. Quat. Res. 2004, 61, 215–230. [Google Scholar] [CrossRef]
  93. Huang, W.; Liu, X.B.; González, G.; Zou, X.M. Late Holocene fire history and charcoal decay in subtropical dry forests of Puerto Rico. Fire Ecol. 2019, 15, 14. [Google Scholar] [CrossRef]
  94. Geist, H.J.; Lambin, E.F. What drives tropical deforestation. Lucc Rep. Ser. 2001, 4, 116. [Google Scholar]
  95. Kaimowitz, D.; Angelsen, A. Section 2: Types of economic deforestation models. In Economic Models of Tropical Deforestation: A Review; Cifor: Bogor, Indonesia, 1998; pp. 7–14. [Google Scholar]
  96. Landry, J.S.; Matthews, H.D. Non-deforestation fire vs. fossil fuel combustion: The source of CO2 emissions affects the global carbon cycle and climate responses. Biogeosciences (BG) 2016, 13, 2137–2149. [Google Scholar] [CrossRef] [Green Version]
  97. Houghton, R.A. Tropical deforestation and atmospheric carbon dioxide. In Tropical Forests and Climate; Springer: Dordrecht, The Netherlands, 1991; Volume 19, pp. 99–118. [Google Scholar]
  98. Ascough, P.L.; Cook, G.T.; Church, M.J.; Dunbar, E.; Einarsson, Á.; McGovern, T.H.; Dugmore, A.J.; Perdikaris, S.; Hastie, H.; Friðriksson, A. Temporal and spatial variations in freshwater 14C reservoir effects: Lake Mývatn, northern Iceland. Radiocarbon 2010, 52, 1098–1112. [Google Scholar] [CrossRef] [Green Version]
  99. Saggar, S.; McIntosh, P.D.; Hedley, C.B.; Knicker, H. Changes in soil microbial biomass, metabolic quotient, and organic matter turnover under Hieracium (H. pilosella L.). Biol. Fertil. Soils 1999, 30, 232–238. [Google Scholar] [CrossRef]
  100. Li, X.S.; Liu, W.Y.; Tang, C.Q. The role of the soil seed and seedling bank in the regeneration of diverse plant communities in the subtropical Ailao Mountains, Southwest China. Ecol. Res. 2010, 25, 1171–1182. [Google Scholar] [CrossRef]
  101. Bottrell, S.; Hipkins, E.V.; Lane, J.M.; Zegos, R.A.; Banks, D.; Frengstad, B.S. Carbon-13 in groundwater from English and Norwegian crystalline rock aquifers: A tool for deducing the origin of alkalinity? Sustain. Water Resour. Manag. 2019, 5, 267–287. [Google Scholar] [CrossRef] [Green Version]
  102. Ehleringer, J.R.; Buchmann, N.; Flanagan, L.B. Carbon isotope ratios in belowground carbon cycle processes. Ecol. Appl. 2000, 10, 412–422. [Google Scholar] [CrossRef]
  103. Cerling, T.E.; Solomon, D.K.; Quade, J.; Bowman, J.R. On the isotopic composition of carbon in soil carbon dioxide. Geochim. Cosmochim. Acta 1991, 55, 3403–3405. [Google Scholar] [CrossRef]
Figure 1. Location of the study area and four soil profiles at the Ailao Mountains Natural Reserve, southwestern China. (a) Yunnan province of China with bright green color; (b) Ailao Mountains with dark green color in Yunnan province; (c) location of the study area named Xujiaba Nature Sanctuary (XNS) in the Ailao Mountains; and (d) location of the four soil profiles (LU in the upland forest and LR in the riparian shrubby meadow of the Laojunshanshen watershed, and SU in the upland forest and SR in the riparian shrubby meadow of the Sankeshu watershed) near the forest research station (FRS).
Forests 11 00645 g001
Figure 2. Photos of the four soil profiles (LU, LR, SU and SR) in a montane subtropical moist forest of southwestern China. Note the standing water table in LR and the grey color in SR.
Forests 11 00645 g002
Figure 3. Soil moisture (a), texture (b), soil organic carbon (SOC) concentration (c) and soil carbon density fraction (d) of the top 25 cm soil layers in the four soil profiles (LU, LR, SU and SR) in a montane subtropical moist forest of southwestern China. Same lowercase letters (a, b and c) in (a,c) indicate no significant difference among three different soil layers in the same soil profile; Uppercase letters (A, B and C) in (b,d) represent different soil layers in each soil profile (A: 0–5 cm; B: 5–15 cm; and C: 15–25 cm). Error bars indicate one standard error.
Forests 11 00645 g003
Figure 4. Relationship between soil organic carbon (SOC) concentration and soil clay content in the four soil profiles (LU, LR, SU and SR) in a montane sub-tropical moist forest of southwestern China.
Forests 11 00645 g004
Figure 5. Exponential decay of soil organic carbon (SOC) concentration with soil depth in the four soil profiles (LU, LR, SU and SR) in a montane subtropical moist forest of southwestern China. Error bars indicate one standard error.
Forests 11 00645 g005
Figure 6. Total soil organic carbon (SOC) content (i.e., storage) in each soil profile and the weighted average SOC concentration in each soil layer in the four soil profiles (LU, LR, SU and SR) in a montane subtropical moist forest of southwestern China. Same lowercase letters (a and b) indicate no significant difference of SOC content or mean SOC concentration in the whole soil profile among the four soil pits. Error bars indicate one standard error.
Forests 11 00645 g006
Figure 7. Schematic diagram showing the downward movement of organo-mineral complex along soil profiles and changes in soil organic carbon (SOC) 14C apparent age, soil age and SOC concentration with soil depth in the upland and riparian soils.
Forests 11 00645 g007
Figure 8. Linear increase of soil organic carbon (SOC) 14C apparent age with soil depth in the four soil profiles (LU, LR, SU and SR) in a montane subtropical moist forest of southwestern China. Note, we excluded the data from the bottom two soil layers in the SR soil profile because of their apparent abnormalities (the two values in the circle).
Forests 11 00645 g008
Figure 9. Temporal (a) and spatial (b) distributions of soil organic carbon (SOC) δ13C values with SOC 14C apparent age and soil depth in the four soil profiles (LU, LR, SU and SR) in a montane subtropical moist forest of southwestern China. Error bars indicate analytical precision of two standard deviations.
Forests 11 00645 g009
Table 1. Information of the four soil profiles (LU, LR, SU and SR) in a montane subtropical moist forest of southwestern China.
Soil
Profile
CoordinatesElevation
(m a.s.l.)
AspectSoil
Depth (m)
Soil
Type
Vegetation
Type
LU24°32′47.19″ N
101°01′51.48″ E
2500Southwest2.05ResidualPrimary forest
LR24°32′47.83″ N
101°01′49.13″ E
2496East1.55AlluvialPerennial
shrubby meadow
SU24°32′29.99″ N
101°01′39.48″ E
2496North1.20ResidualPrimary forest
SR24°32′30.77″ N
101°01′37.23″ E
2475North1.15AlluvialPerennial
shrubby meadow
Table 2. Statistical significance (p–value) of two parameters (slope a and intercept b) in the linear increase function between soil organic carbon 14C apparent age and soil depth in the four soil profiles (LU, LR, SU and SR) in a montane subtropical moist forest of southwestern China. Bold indicates p < 0.05.
Soil ProfileSlope aIntercept b
LULRSUSRLULRSUSR
LU––– –––
LR0.025––– 0.012–––
SU<0.000<0.000––– 0.0060.649–––
SR0.0080.7080.001–––0.0100.4990.046–––

