Article

Altitude and Vegetation Affect Soil Organic Carbon, Basal Respiration and Microbial Biomass in Apennine Forest Soils

1
Istituto Zooprofilattico Sperimentale dell’Umbria e delle Marche ‘Togo Rosati’, Via G. Salvemini, 1, 06126 Perugia, Italy
2
Department of Agricultural, Food and Environmental Sciences, University of Perugia, Borgo XX giugno, 74, 06121 Perugia, Italy
3
Department of Agricultural and Food Sciences, Alma Mater Studiorum-University of Bologna, Via Fanin, 40, 40127 Bologna, Italy
4
Research Institute on Terrestrial Ecosystem (IRET-CNR), Via Madonna del Piano, 10, 50019 Sesto Fiorentino (FI), Italy
*
Author to whom correspondence should be addressed.
Forests 2020, 11(6), 710; https://doi.org/10.3390/f11060710
Submission received: 15 May 2020 / Revised: 23 June 2020 / Accepted: 25 June 2020 / Published: 26 June 2020
(This article belongs to the Special Issue Organic Carbon Pools and Storage in Forest Soil)

Abstract

:
Both altitude and vegetation are known to affect the amount and quality of soil organic matter (SOM) and the size and activity of soil microbial biomass. However, when altitude and vegetation changes are combined, it is still unclear which one has a greater effect on soil chemical and biochemical properties. With the aim of clarifying this, we tested the effect of altitude (and hence temperature) and vegetation (broadleaf vs pine forests) on soil organic carbon (SOC) and soil microbial biomass and its activity. Soil sampling was carried out in two adjacent toposequences ranging from 500 to 1000 m a.s.l. on a calcareous massif in central Italy: one covered only by Pinus nigra J.F. Arnold forests, while the other covered by Quercus pubescens Willd., Ostrya carpinifolia Scop. and Fagus sylvatica L. forests, at 500, 700 and 1000 m a.s.l., respectively. The content of SOC and water-extractable organic carbon (WEOC) increased with altitude for the pine forests, while for the broadleaf forests no trend along the slope occurred, and the highest SOC and WEOC contents were observed in the soil at 700 m under the Ostrya carpinifolia forest. With regard to the soil microbial community, although the size of the soil microbial biomass (Cmic) generally followed the SOC contents along the slope, both broadleaf and pine forest soils showed similar diminishing trends with altitude of soil respiration (ΣCO2-C), and ΣCO2-C:WEOC and ΣCO2-C:Cmic ratios. The results pointed out that, although under the pine forests’ altitude was effective in affecting WEOC and SOC contents, in the soils along the broadleaf forest toposequence this effect was absent, indicating a greater impact of vegetation than temperature on SOC amount and pool distribution. Conversely, the similar trend with altitude of the microbial activity indexes would indicate temperature to be crucial for the activity of the soil microbial community.

1. Introduction

Soil comprises the largest pool of terrestrial carbon (C) and, through the soil organic matter (SOM) cycling, it represents either an important sink of C or a possible source of CO2 [1]. SOM includes a wide range of compounds at different stages of decomposition derived from litter, root turnover, and microorganisms, and its dynamics are controlled by the quality of the substrate, the activity of the organisms, and the environmental conditions [2]. Among the environmental factors, climate (temperature and precipitation), is considered the most important factor regulating the soil organic C (SOC) turnover [3] by directly affecting the microbial activity [3,4,5] and by constantly influencing the soil weathering processes [6] and nutrient cycles [7,8,9]. Since air and soil temperature are controlled by physiographic factors, such as latitude, altitude, and exposure [10,11,12], altitude has been often used as a proxy for temperature change to assess the effect of temperature on SOC content and dynamics. Among others, Gutiérrez-Girón et al. [13] studied the influence of temperature on SOC and microbial activity of shrubland and grassland soils in Central Spain along an altitudinal gradient ranging from 2100 to 2800 m a.s.l. They found a high temperature susceptibility of SOM decomposition in the areas at higher altitude. Chang et al. [14], investigating vertical distribution of SOC and soil total N in soils of three Tibetan montane forests along a wide altitudinal and thermal gradient (from 1700 to 4300 m a.s.l. and from 15.5 to 1.7 °C, respectively), reported that the shift of plant species with altitude had a greater role than temperature in affecting SOC distribution throughout the soil profile. Tsozué et al. [15] attributed the greater SOC content of the Andosols in the upper part of an altitudinal gradient (1400–2740 m a.s.l.) on the Bambouto Mountains (Cameroon), other than to the soil properties, to the lower temperature which limited the decomposition of the plant litter. However, the effect of temperature changes on SOC dynamics and content in forest ecosystems is still poorly known because of the scarce information on how, and how fast, changes affect the balance among input, degradation and stabilization mechanisms [16,17,18,19,20]. Other than climate, vegetation is also considered to affect the SOC cycle through the quality and quantity of both litters and root exudates that, in turn, can influence the soil fauna and microbial processes [11]. For example, Quideau et al. [21] in the San Dimas Experimental Forest (U.S.A.) found a better efficiency in incorporating the litter and its degradation products into the A horizon under oak than under pine forest, suggesting a greater activity of the soil organisms under oak forest. Vegetation can also affect SOC quality through the relative abundance of labile and recalcitrant C compounds returned to soil as a function of the specific composition of the living tissues [22]. Although clear differences in litter composition occur between plant species (e.g., broadleaves vs pine), the effect of vegetation type on SOC quality and abundance, specifically in relation to temperature, has been scarcely investigated e.g., [23,24,25,26,27].
With the aim to contribute to the knowledge of the role of vegetation and altitude, and hence temperature, on the organic C accumulation in forest soils, we considered two adjacent toposequences ranging from 500 to 1000 m a.s.l. along the west flanks of a calcareous massif in Central Italy: one covered only by pine (Pinus nigra J.F. Arnold) reforestations, the other covered by autochthonous forests (mixed wood dominated by Quercus pubescens Willd. at 500 m a.s.l.; Ostrya carpinifolia Scop. at 700 m a.s.l.; Fagus sylvatica L. at 1000 a.s.l.). The objective of this research was to assess the combined effect of the altitude-dependent temperature and the vegetations (broadleaf vs pine forests) on (1) SOC pools and (2) soil microbial biomass and its activity. We hypothesized that: (i) SOC contents increase with altitude; (ii) SOC stocks are greater under pine than broadleaf forests; (iii) the activity of the soil microbial community declines with altitude.

2. Materials and Methods
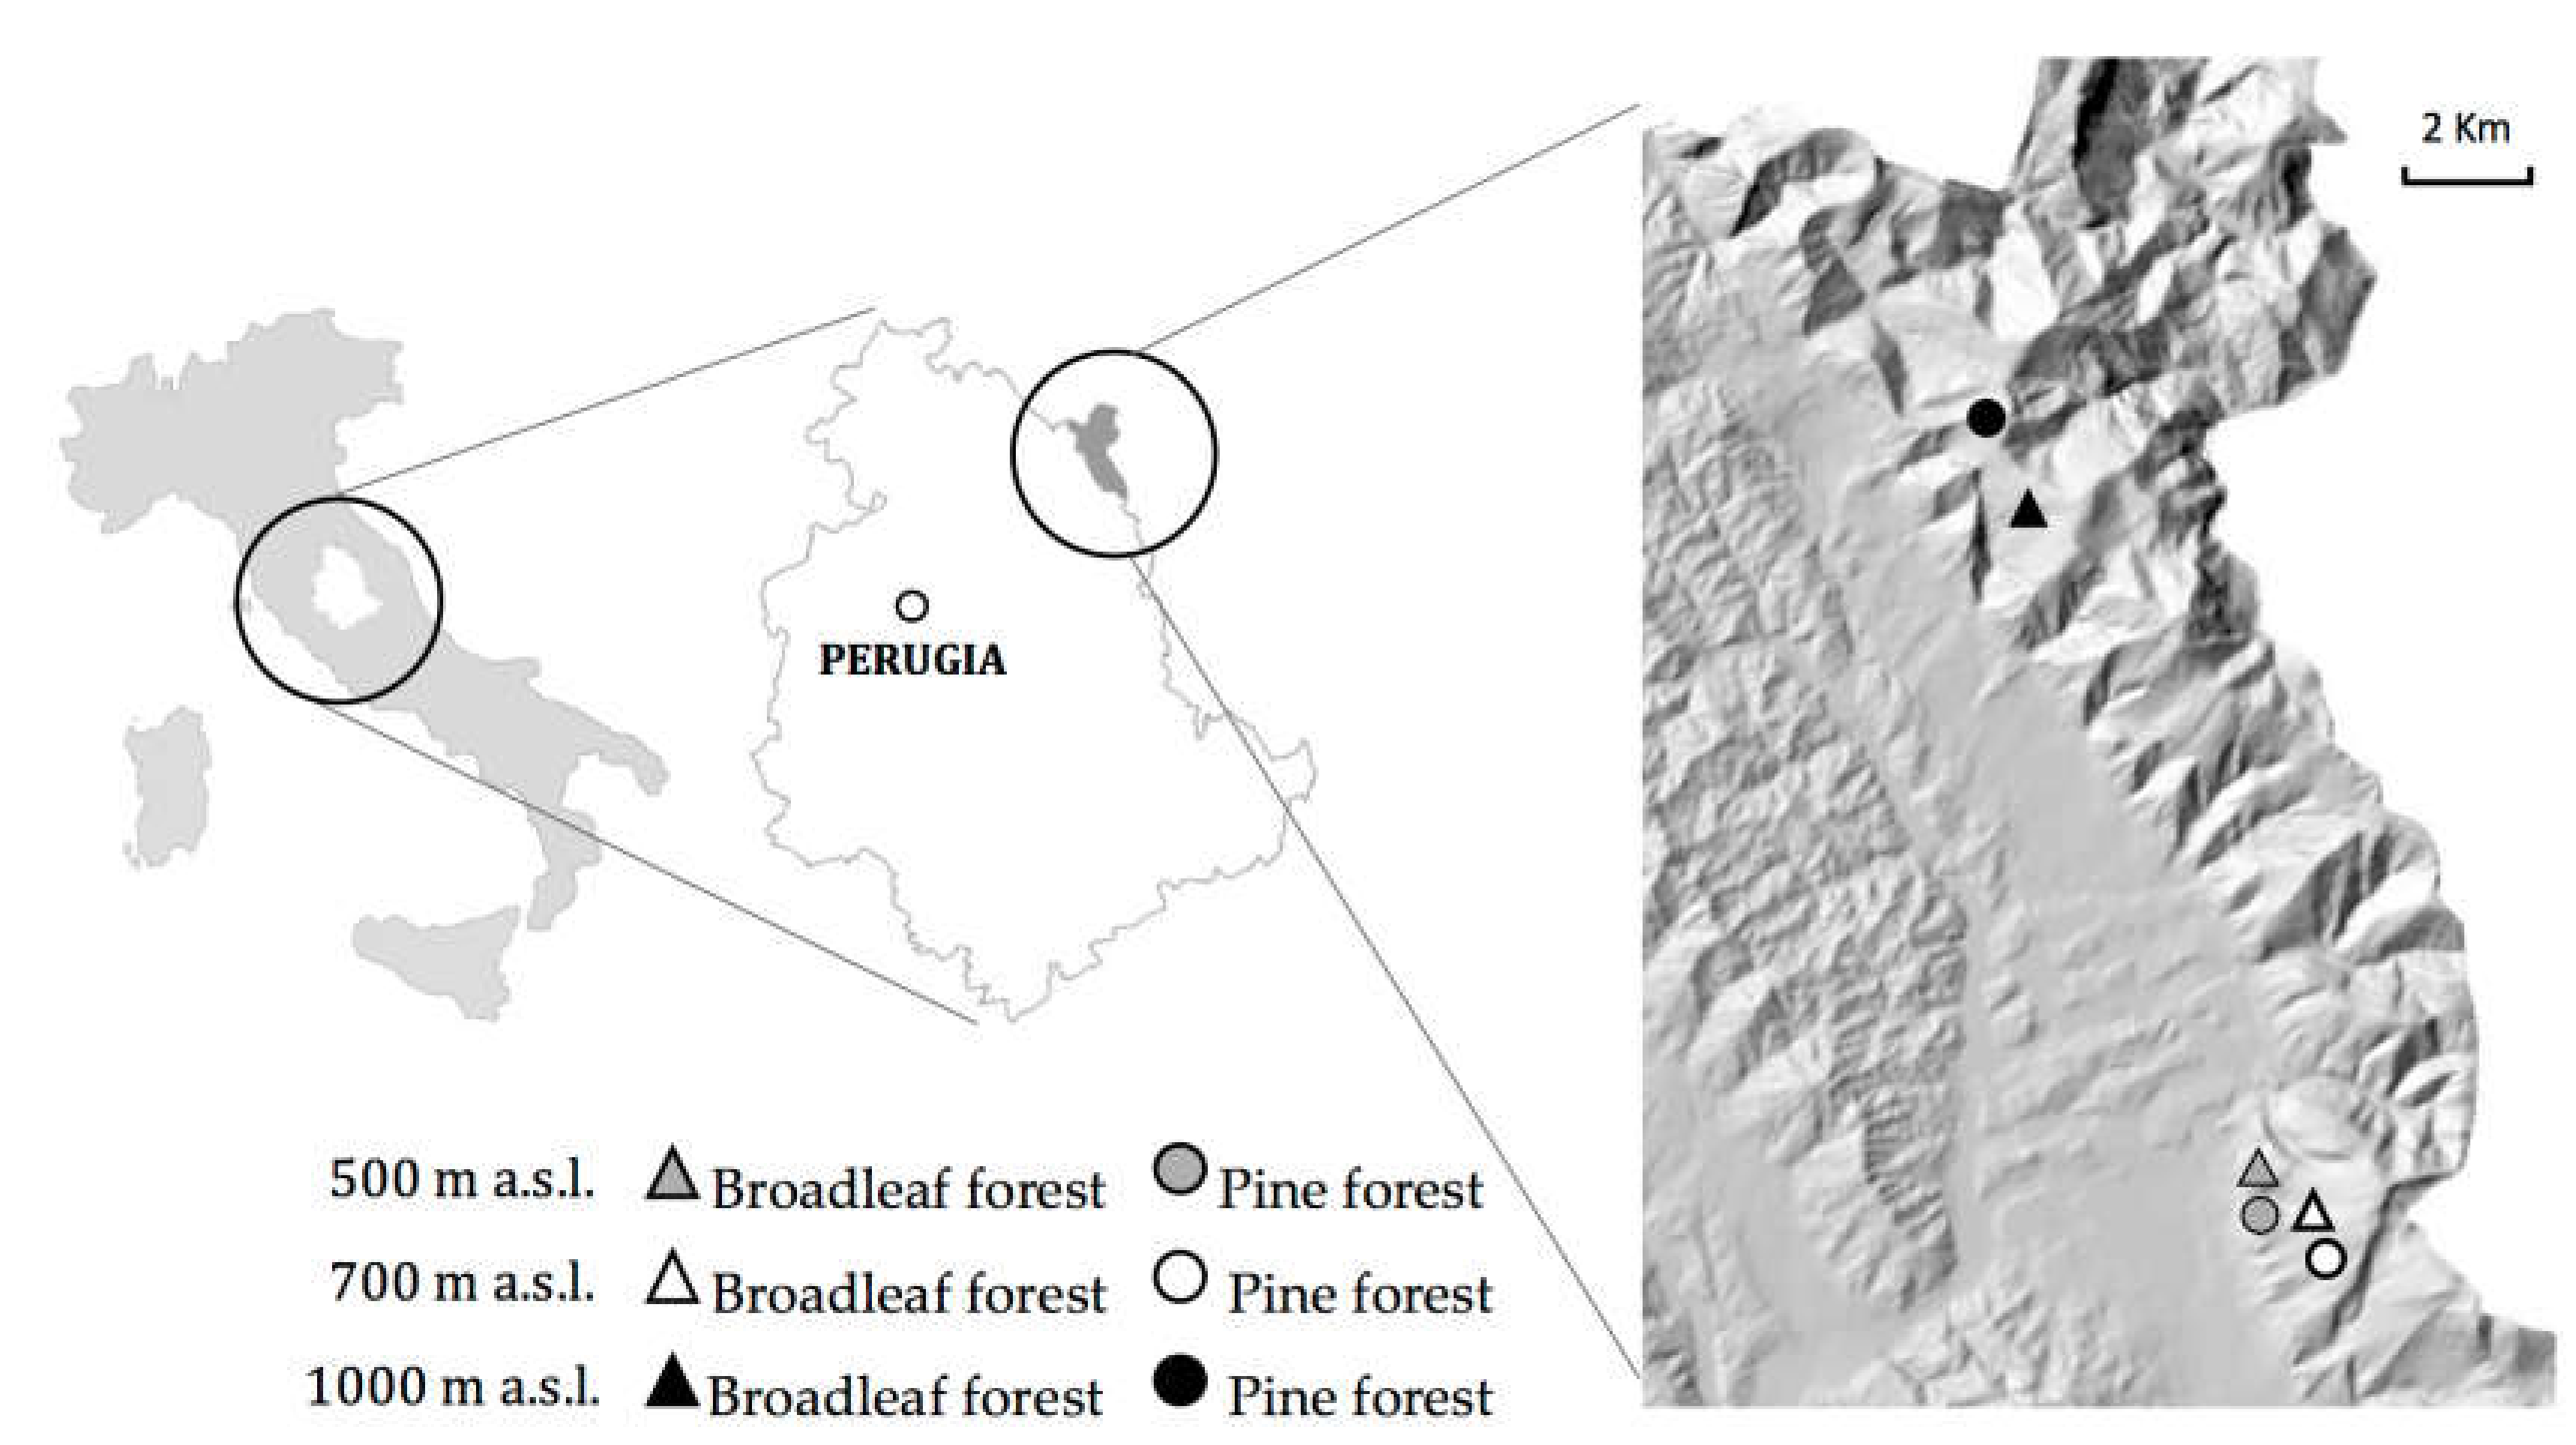
2.1. Study Sites

We selected three sites at about 500, 700 and 1000 m a.s.l. along the northwest-facing slope of Mount Cucco (Figure 1), a calcareous massif on the Apennines chain (Umbria region, Central Italy). At each site, two adjacent forests were chosen, one comprised of a pine (Pinus nigra J.F. Arnold) reforestation established during the late 1970s, and the other by authoctonous broadleaf species [(mixed wood dominated by downy oak (Quercus pubescens Willd.) at 500 m a.s.l., European hop-hornbeam (Ostrya carpinifolia Scop.) at 700 m a.s.l., and beech (Fagus sylvatica L.) at 1000 a.s.l.].
All the broadleaf forests were coppices, although they were no longer managed for at least two decades. The air and soil (at 10 cm depth) temperatures were measured from October 2017 to November 2018 by means of iButton DS 1922L-F5# temperature loggers (iButtonLink, USA). The mean soil temperatures were 12.5 °C at 500 m, 12.1 °C at 700 m, and 10.0 °C at 1000 m a.s.l., with a mean difference with the air temperature of about 2 °C in all sites. The mean annual precipitation usually ranges from about 1100 mm at 500 m to about 2000 mm at 1000 m, the latter mostly in form of snow [28].

2.2. Soil Sampling

During autumn 2017, three profiles were dug within an area of 400 m2 at each altitude and forest type, for a total of 18 profiles (3 profiles × 2 forest types × 3 altitudes). All the soils developed from limestone and their morphology, which was described per Schoeneberger et al. [29], is reported in Table A1. In all sites the topsoil was characterized by well-developed Oi (3–4 cm) and Oe (1–3 cm) horizons (a thin Oa horizon was present only in the soil under broadleaf forest at 700 m and under pine forest at 1000 m) resting on an A horizon with a moderately developed crumb structure at 500 m and sub-angular blocky structure at 700 and 1000 m. Most of the soils showed a sandy loam/loamy sand texture, even though a slightly higher clay content was observed in the soil under the beech forest. In all soils the amount of rock fragments increased with depth and ranged between 30% and 60% with the exception of the beech forest, where the rock fragments were absent in A and AB horizons and reached 20% in the deepest horizon. Roots were abundant in A and AB horizons and decreased with depth, where we observed a reduction of the very fine and fine roots. As seen for rock fragments, beech forests showed the lowest number of roots. According to Soil Taxonomy [30], all the soils were classified as Typic Humustepts.
From every profile, an abundant amount of sample (about 2–3 kg) was collected from each mineral horizon constituting the solum and was stored in a portable fridge. Once in the laboratory, the soil was isolated from the roots and sieved through a 2 mm-mesh. An aliquot of each sample was stored at 4 °C for the biochemical analyses, while the rest were air-dried at room temperature. Other than mineral samples, from each profile, aliquots of leaves or needles that comprised the most part of the Oi horizons were also collected. Once twigs and coarser plant fragments were eliminated, this organic material was air-dried and then milled until it passed through a 1 mm sieve.

2.3. Chemical and Biochemical Analyses

The soil pH was determined by a combined glass-calomel electrode in water (solid: liquid ratio of 1:2.5). Total soil organic C (SOC) content was assessed by K-dichromate digestion, heating the suspension at 180 °C for 30 min [31], and total N content was determined by a Carlo Erba EA1110 dry combustion analyzer (Carlo Erba Instruments, Milan, Italy). For the organic material (leaves and needles from Oi horizon), both C and N contents were determined using a dry combustion analyzer.
The SOC of the samples were fractionated in the following fractions: water-extractable organic C (WEOC), fulvic (FA-C) and humic (HA-C) acids, and not-extractable organic C (NEOC). WEOC was extracted by submerging an aliquot of each sample with distilled water (solid:liquid ratio of 1:10) and shaking for 12 h with an orbital shaker (140 rpm). The mixture was centrifuged at 1400× g for 10 min and then filtered at 0.45 µm by cellulose ester membranes. The obtained solution was analyzed for its C content by K-dichromate digestion. To evaluate the content of FA-C and HA-C of each sample, the solid residue of the WEOC extraction was extracted and fractionated [32] by 0.1M NaOH (solid:liquid ratio of 1:10) under N2 atmosphere and shaking the slurry for 12 h. The suspension was allowed to settle and the supernatant was collected after centrifugation (15,000× g). The supernatant was acidified under continuous stirring with 9M H2SO4 solution to pH 1, left to stand overnight and then centrifuged (15,000× g). The obtained raw humic and fulvic fractions were analyzed for their C content by K-dichromate digestion. The amount of unextractable C (NEOC) was calculated by subtracting the WEOC, HA-C and FA-C from the SOC content of the sample. To better assess the proportion of each fraction (WEOC, HA-C, FA-C and NEOC) to SOC for every altitude and forest type, they were expressed as percentages over SOC.
The amount of soil microbial biomass–C (Cmic) was estimated according to the fumigation–extraction protocol [33], after the samples had been incubated in glass jars for 21 days at 25 °C and at 50% of the total water holding capacity. Briefly, aliquots of each sample were fumigated by alcohol-free chloroform (CHCl3) vapors at 25 °C inside a glass desiccator. After 24 h of fumigation, CHCl3 was removed from the samples by several evacuations. Fumigated and non-fumigated aliquots of each sample were treated with a 0.5 M K2SO4 solution (solid:liquid ratio of 1:4), shaken for 30 min and centrifuged. The organic C in the obtained solution was determined by K-dichromate wet oxidation and back-titration of the unreduced K-dichromate [15,18]. During the incubation period, the basal respiration was regularly measured through alkali (1 M NaOH solution) reaction with CO2 released from each sample and following titration with a standardized HCl solution after the addition of 0.5 M BaCl2 solution. Basal respiration values were reported as the whole CO2–C released throughout the incubation period (ΣCO2–C). Then, in order to obtain a clearer view of soil microbial biomass and its activity, the ΣCO2–C: WEOC, ΣCO2–C:Cmic and Cmic:SOC ratios were calculated.

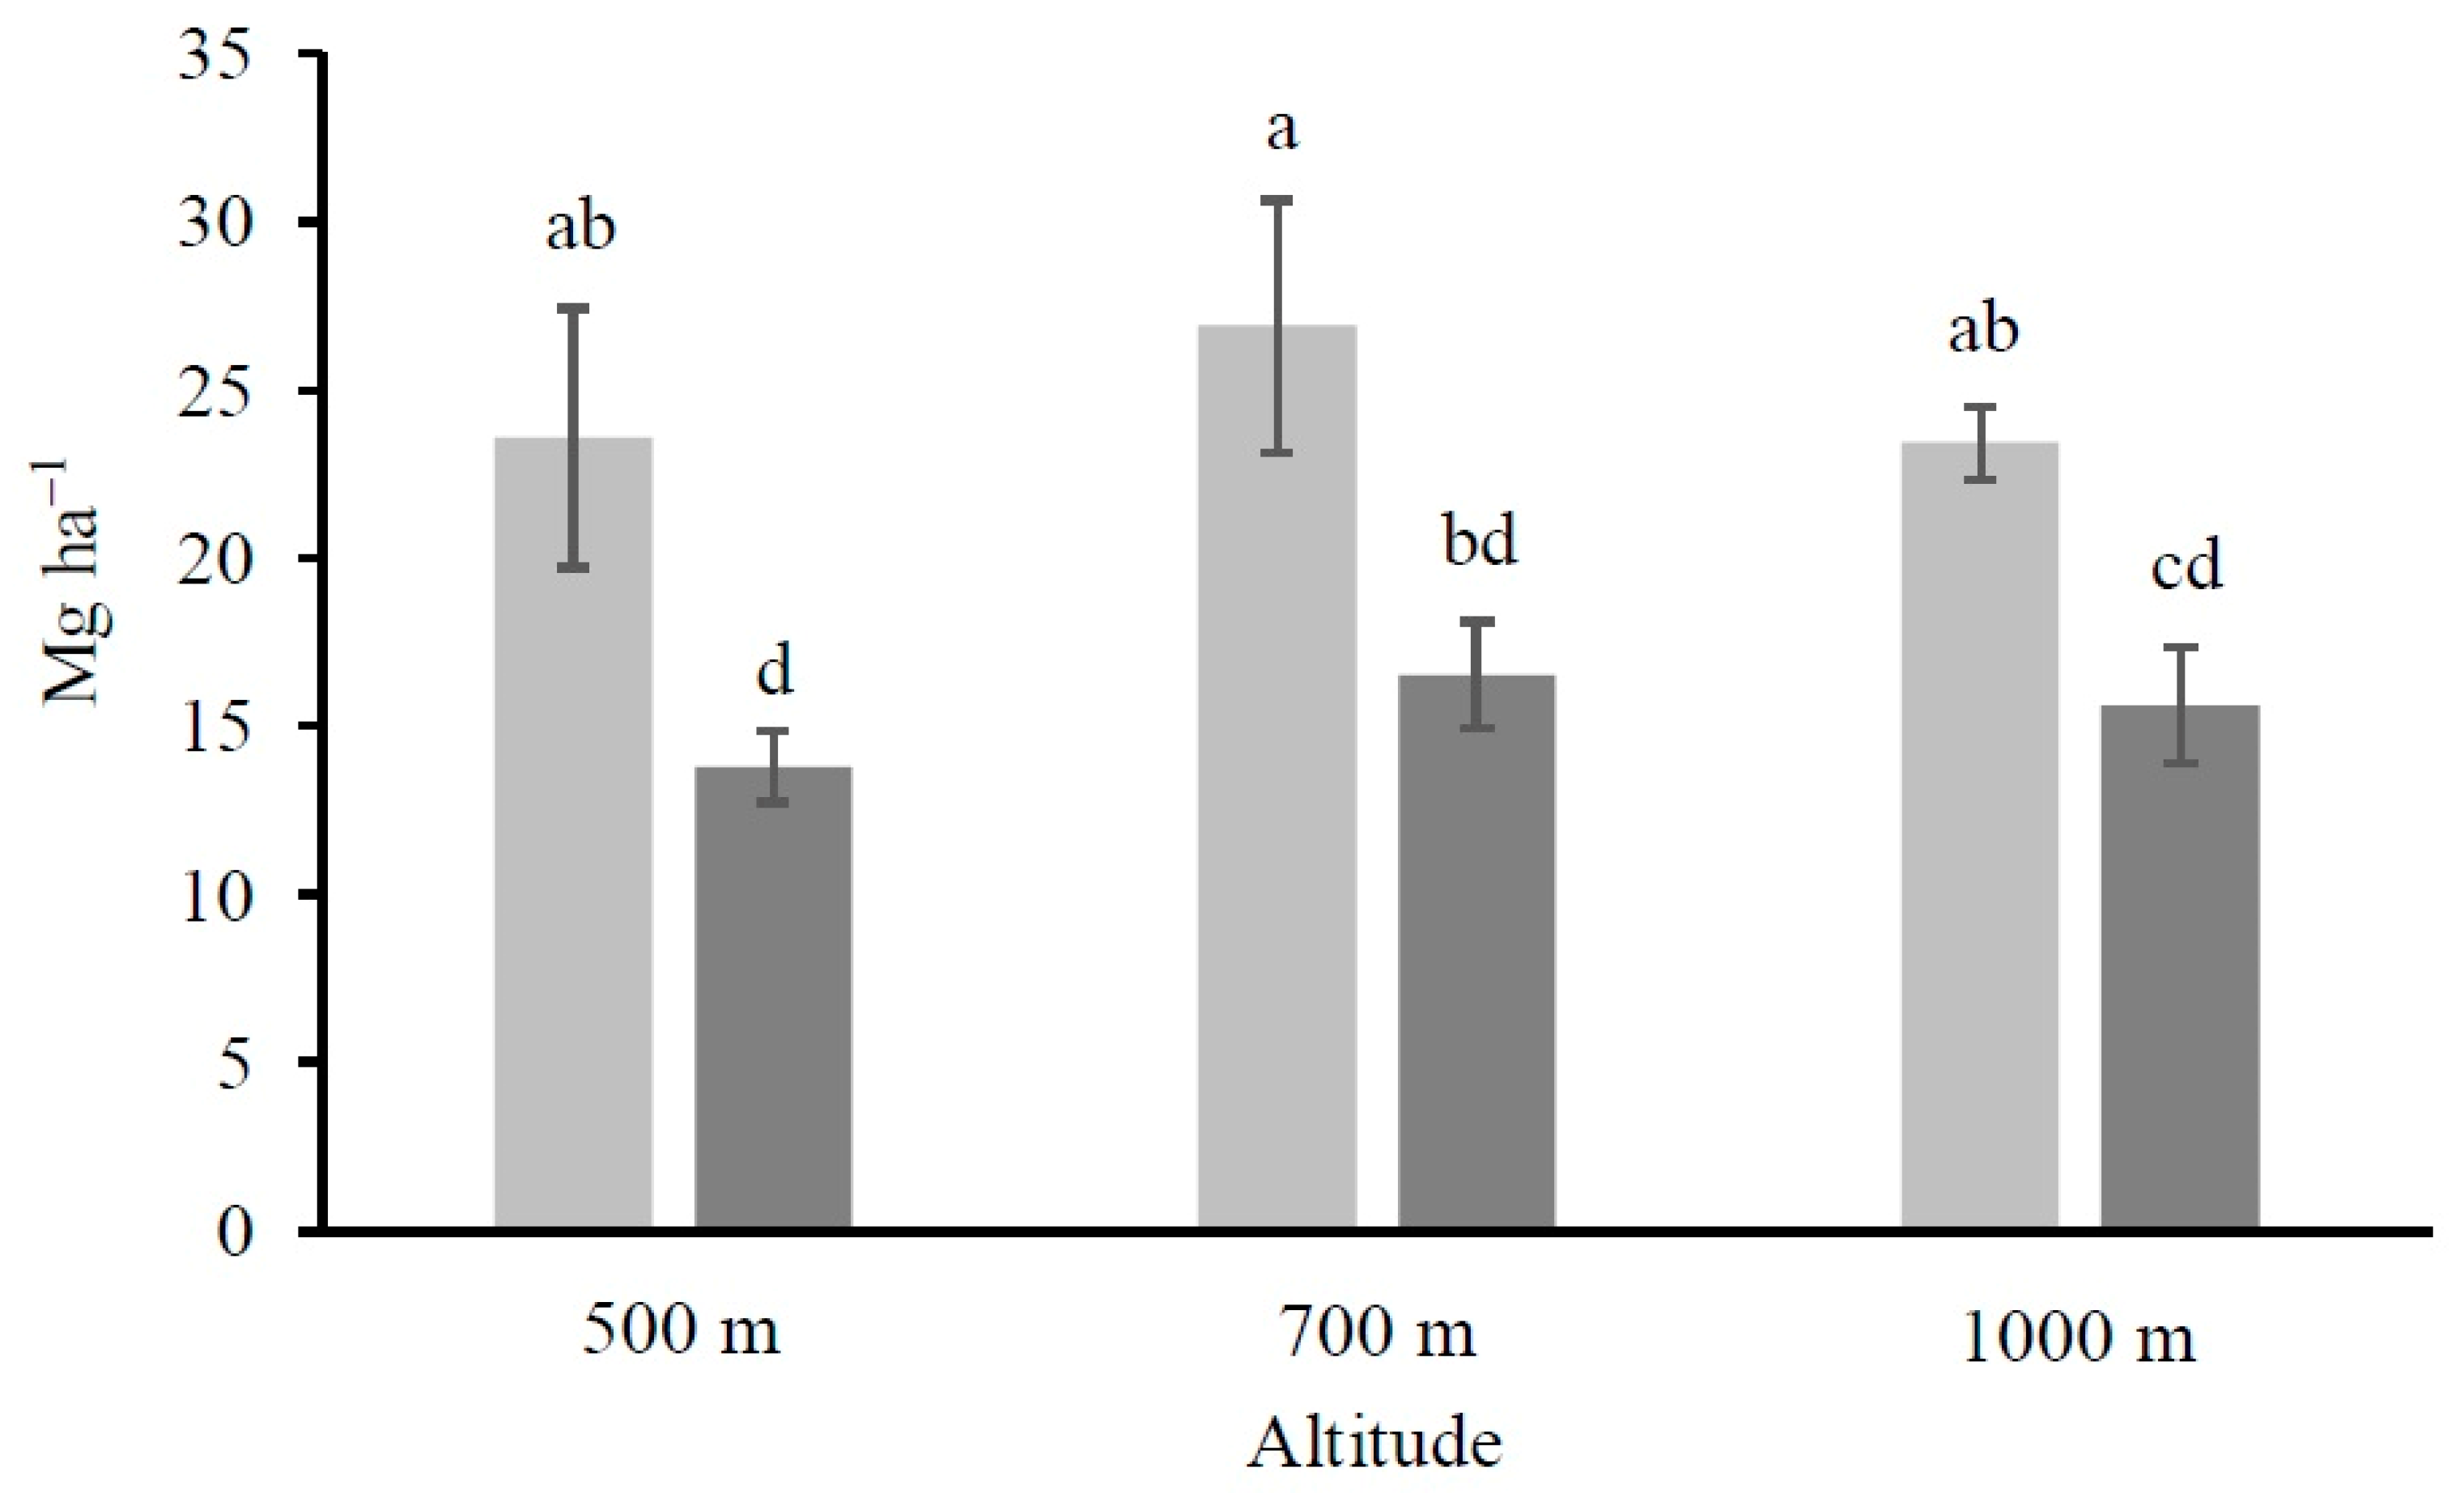
2.4. Calculation of the Organic Carbon Stocks

The stocks of organic C accumulated in the upper 20 cm of the mineral soil for each altitude and forest type were calculated by adding the stocks of the various horizons (or a portion of them when the horizon depth crossed 20 cm). The C stock of each horizon was calculated by multiplying C concentration, bulk density, and thickness. The bulk density was determined by the core method using steel cylinders of 493 cm3 (height: 10.8 cm; diameter: 7.7 cm). The samples collected by cylinders were dried at 105 °C until they reached a constant weight. The bulk density was calculated from the ratio of the dried mass and volume of the soil core and corrected for the rock fragments content. Specifically, the corrected bulk density was obtained through the following calculation:
BD   [ kg   dm 3 ] = ( m t   [ kg ]     m r   [ kg ] ) / ( V t   [ dm 3 ]     V r   [ dm 3 ] )
where BD is the bulk density, Vt and mt are the volume and mass, respectively, of the sample collected through the steel cylinder, and Vr and mr are the volume and the mass, respectively, of the rock fragments contained inside the dried soil sample.
Therefore, the stock of organic C was calculated by the following equation:
Stock   [ Mg   ha 1 ] = concentration   [ g   kg 1 ]   ×   BD   [ kg   dm 3 ]   ×   ( 1     Vg )   ×   thickness   [ m ]   ×   10
where Vg is the volume proportion occupied by gravels in the considered horizon.

2.5. Statistical Analysis

According to soil horizons, two–way analysis of variance (ANOVA) was applied to analyze the effects of altitude and forest type on the measured variables. The multiple comparison tests were performed with Tukey’s honest significant differences with a significance level of 0.05. For the graphical representation of the effect of altitude and forest type on some of the measured variables, non-metric multidimensional scaling (NMDS) analyses were performed by the R package “vegan” with the dissimilarity matrix calculated by the Gower’s distance. In particular, for each forest type (pine and broadleaf forests), the NMDS analysis was run on two groups of soil parameters: one composed by the data related to SOM (SOC content and its distribution in WEOC, FA-C, HA-C, and NEOC) and the other one composed by the biochemical data (Cmic, ΣCO2–C, and ΣCO2–C:Cmic, ΣCO2–C:WEOC and Cmic:SOC ratios). Before the NMDS analysis, the data were standardized by subtracting the mean and dividing by the standard deviation. The statistical analyses were performed using the R 3.5.0 statistical software [34].

3. Results

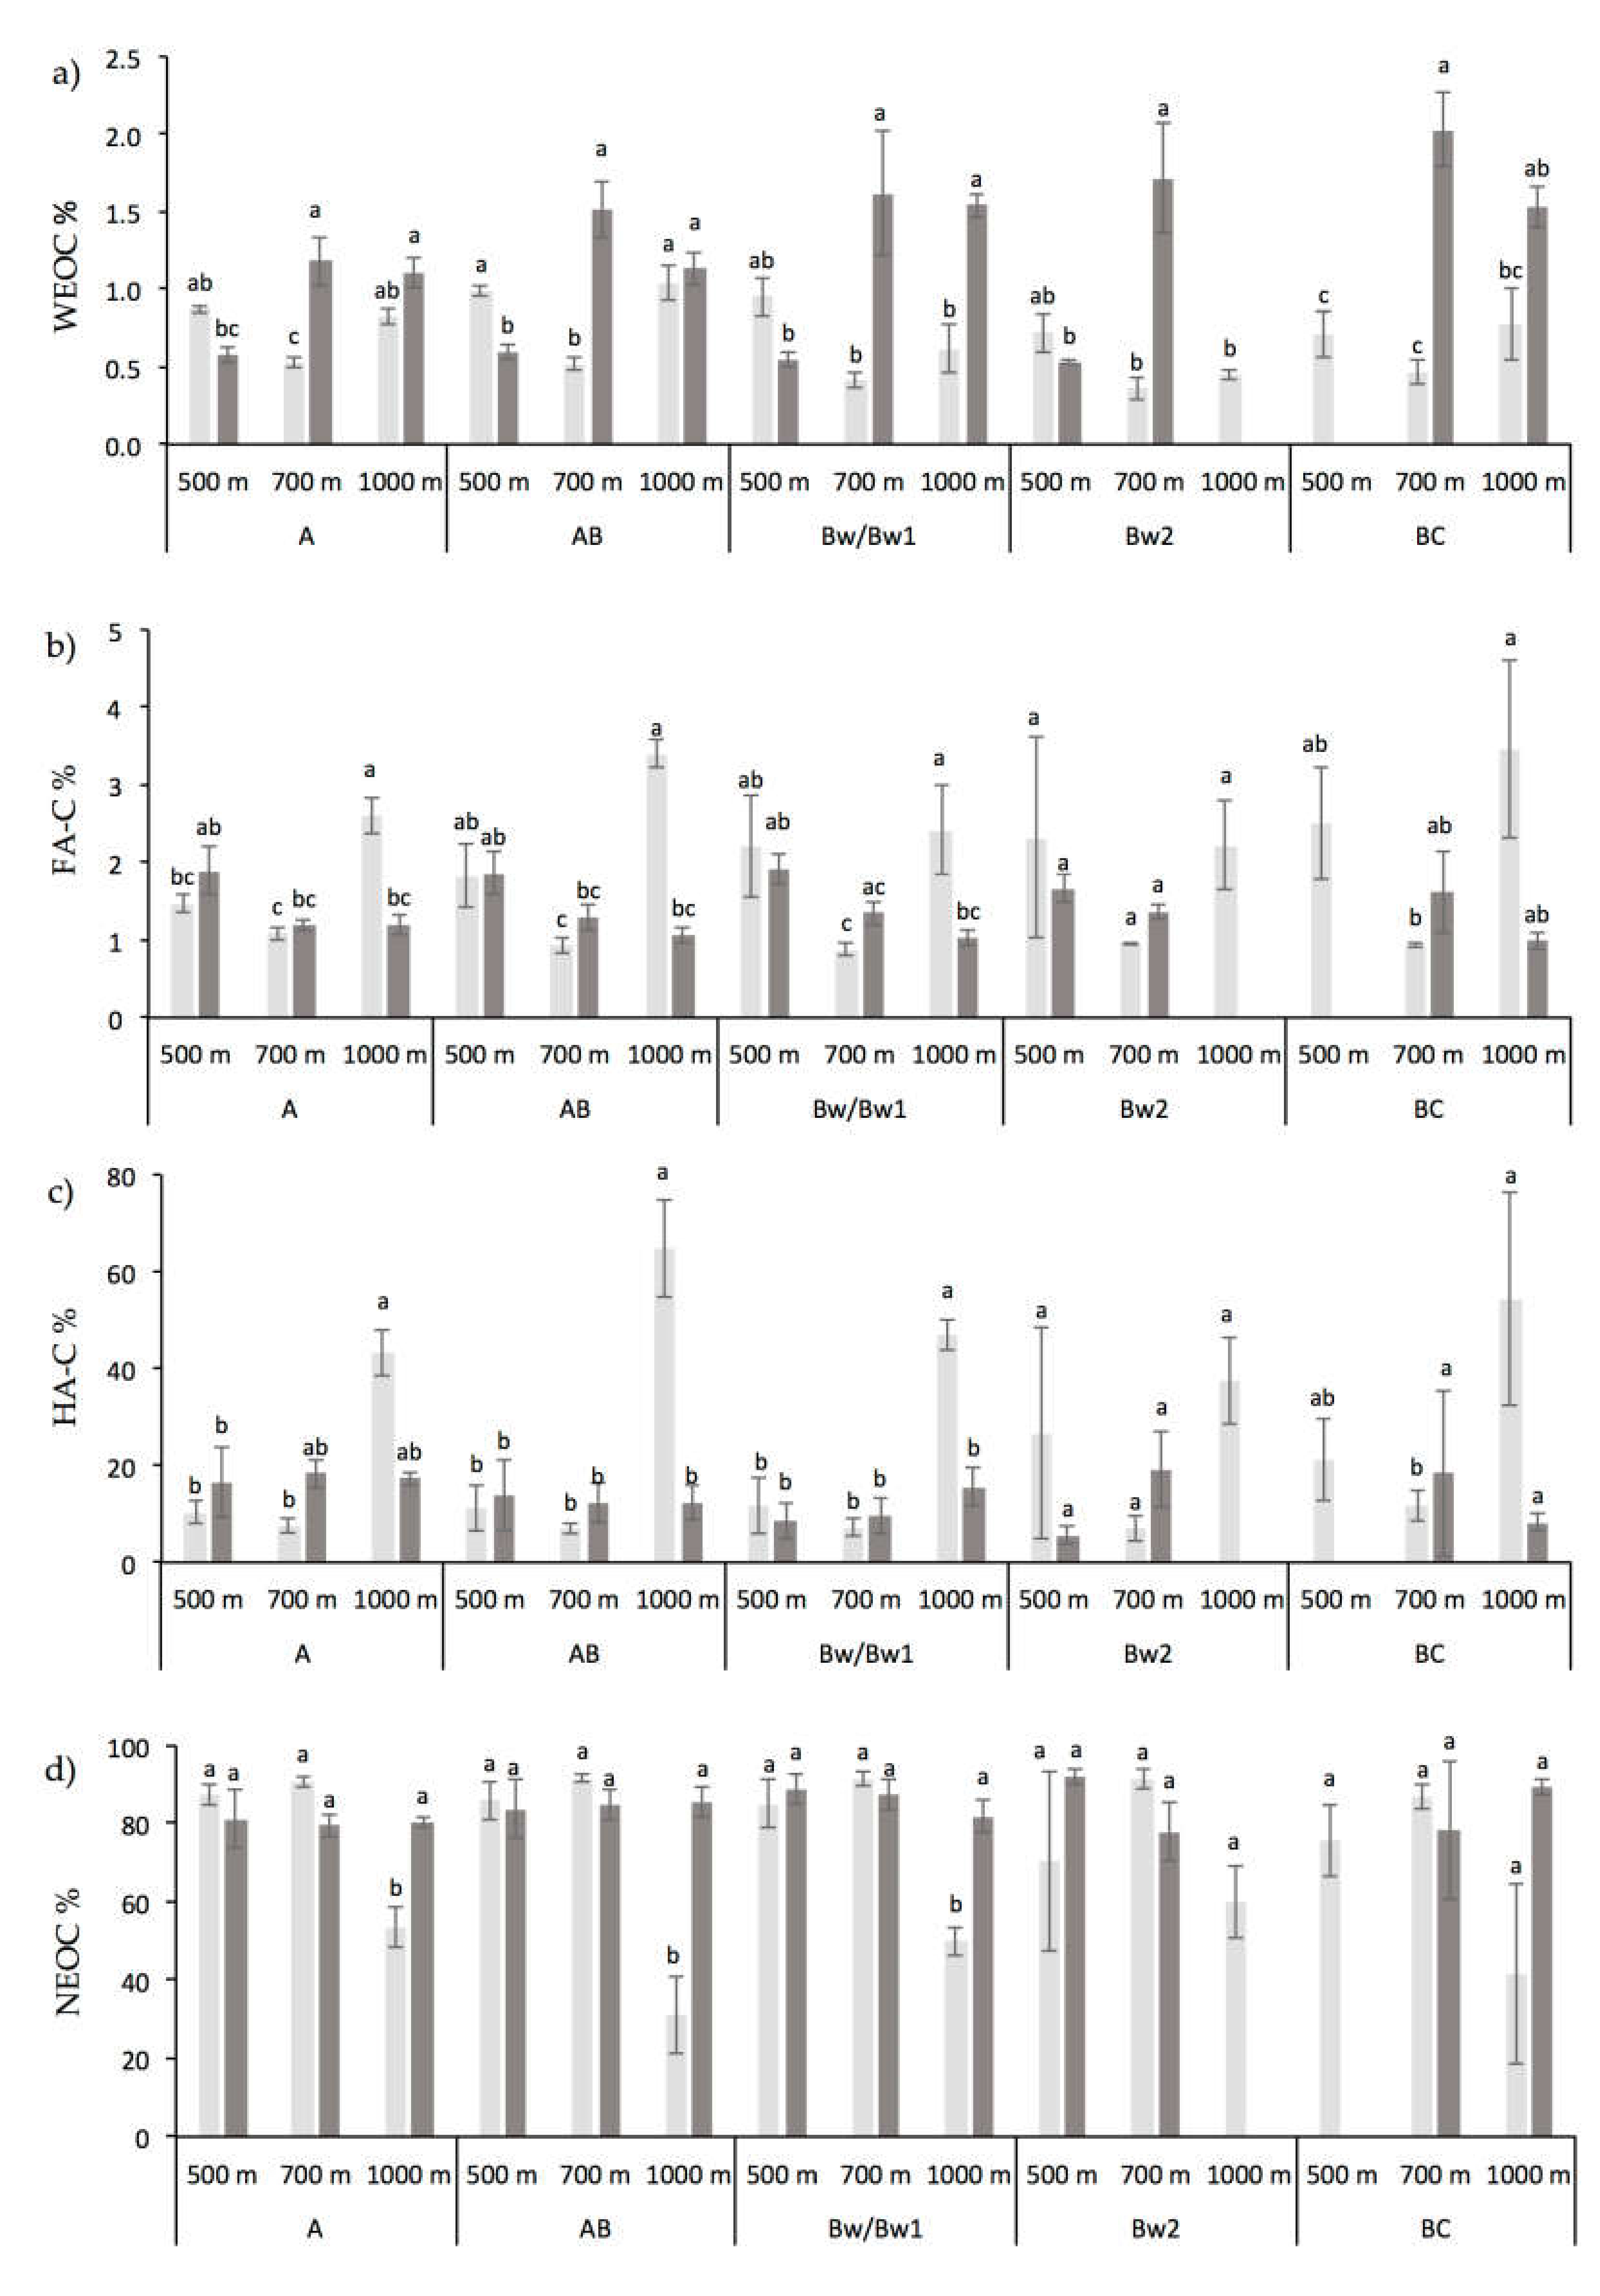
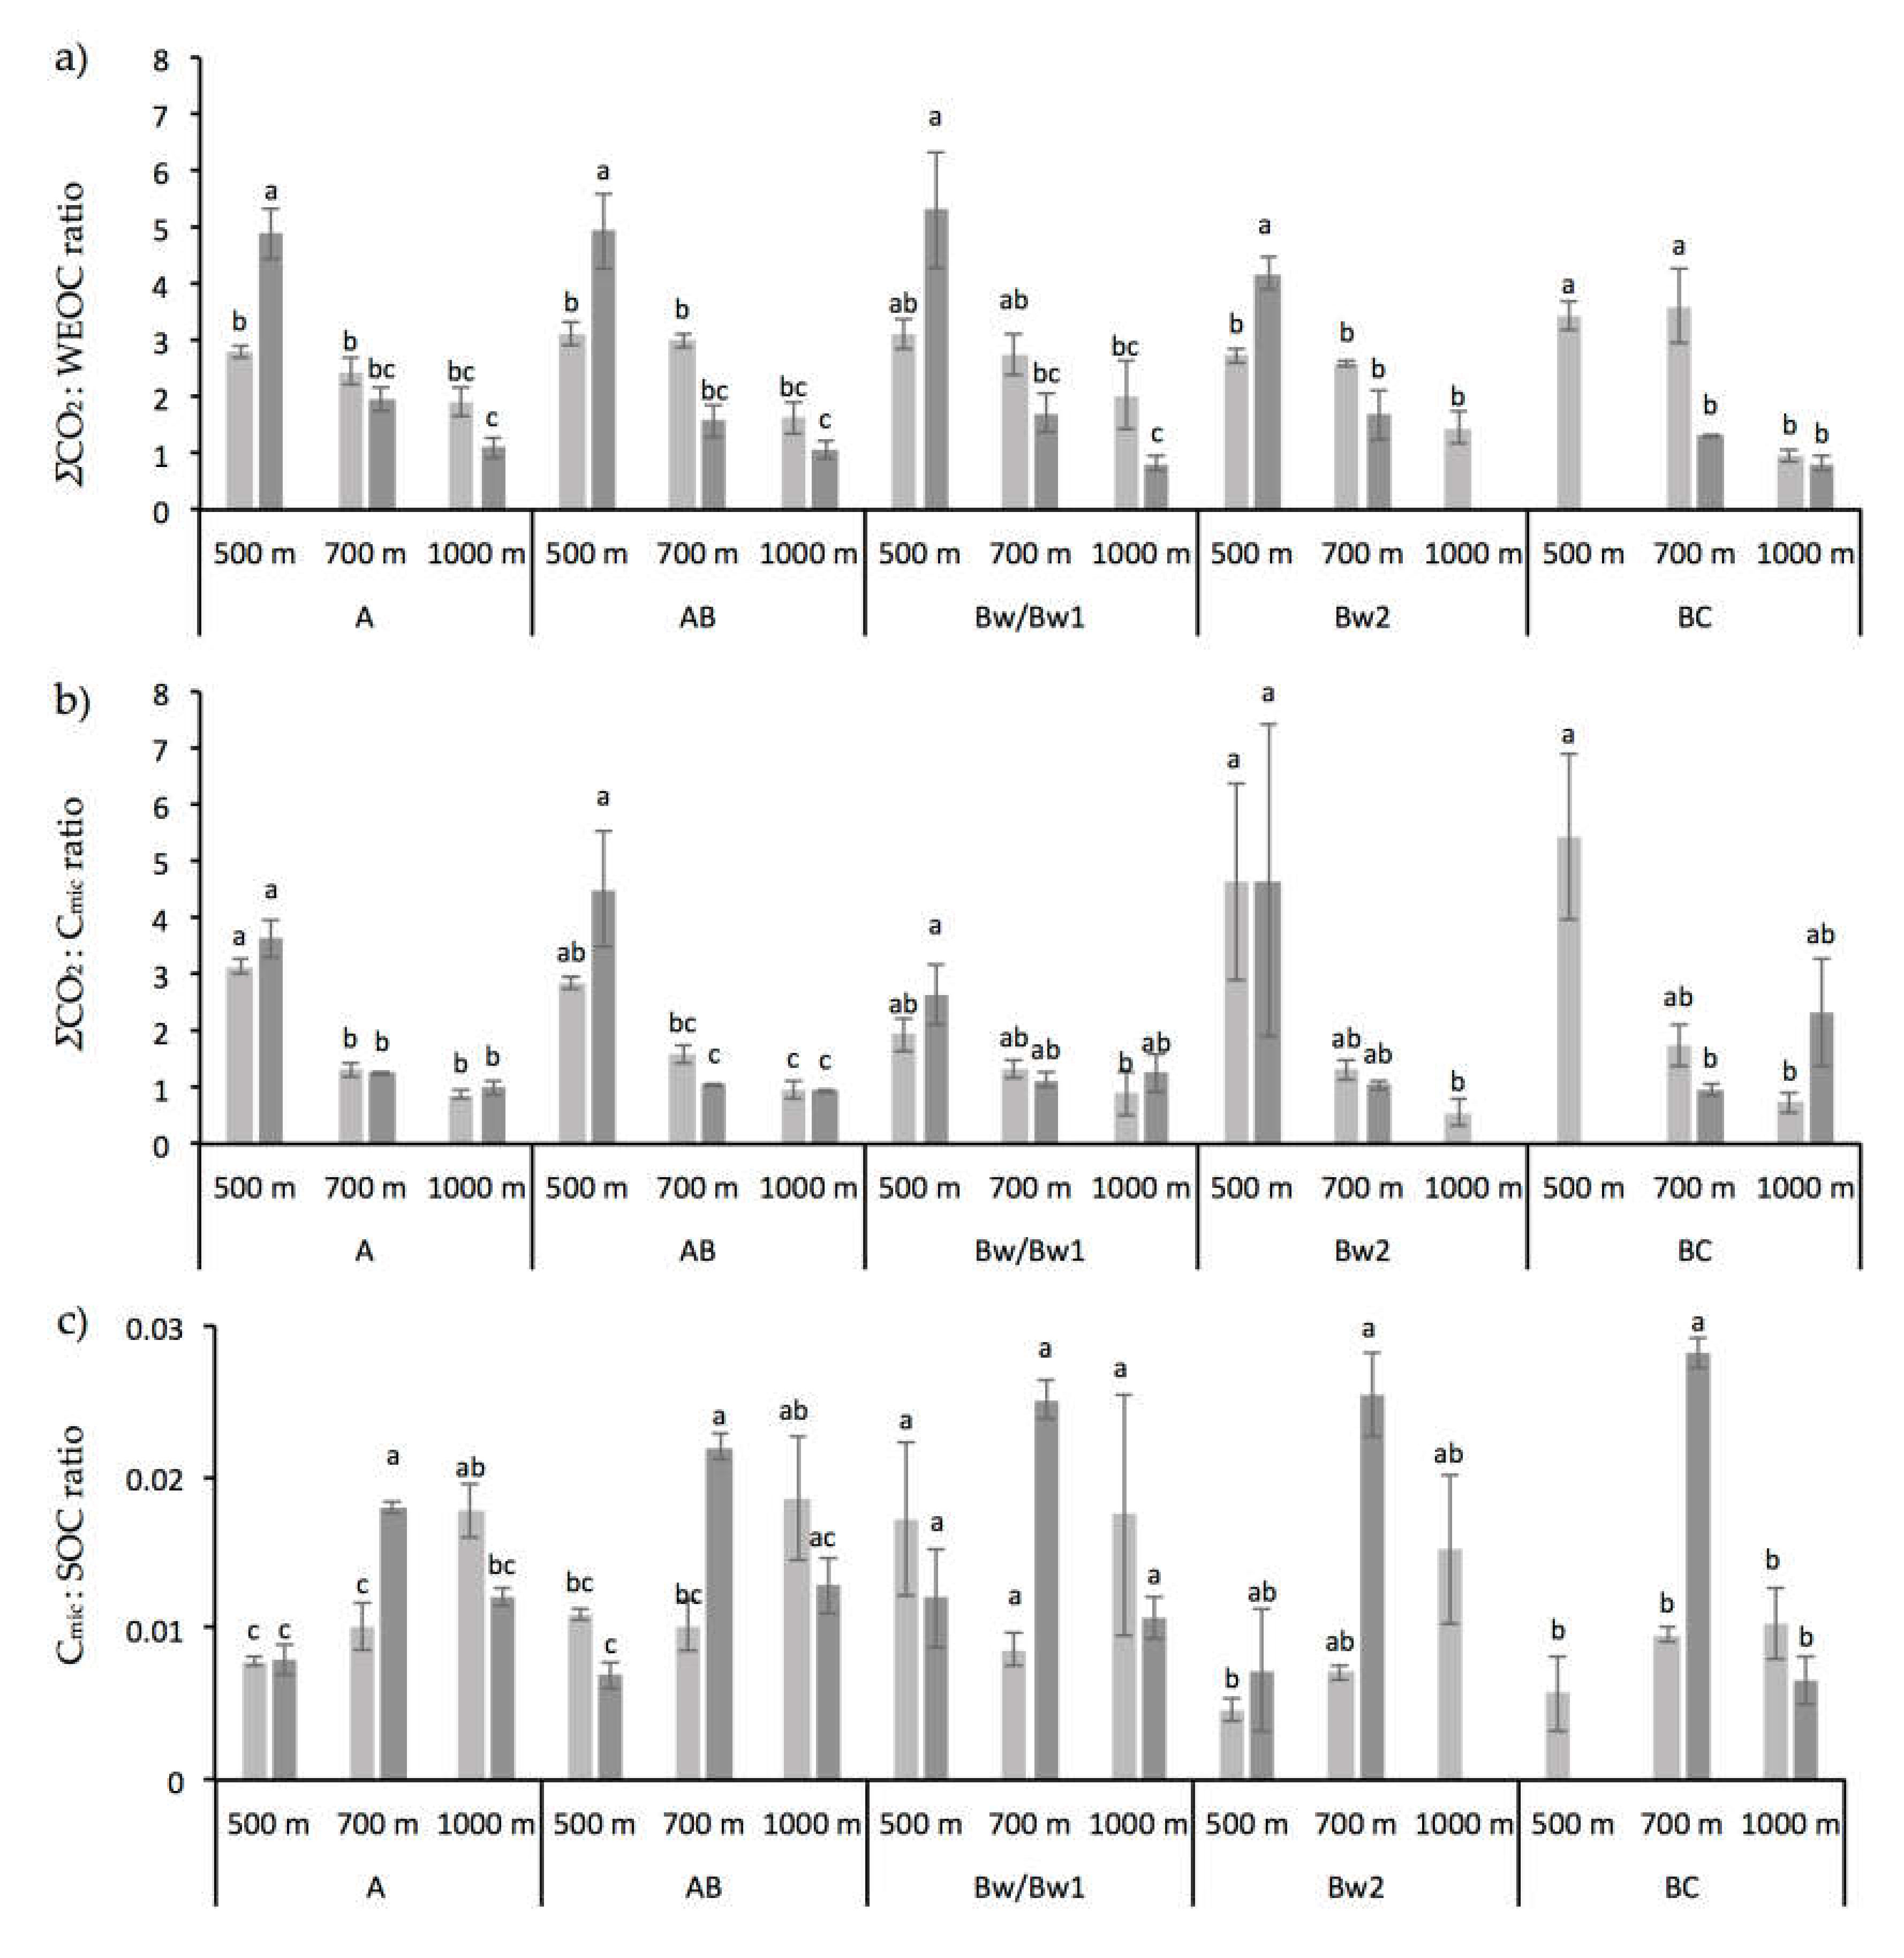
3.1. Chemical and Biochemical Soil Properties

The values of pHH2O were slightly alkaline in all sites with the exception of the soil located at 1000 m altitude under the beech forest, where the pH values were in the acidic field (Table 1) because of the presence of flint layers in the limestone from which the soil developed [35]. At the altitudes of 500 and 700 m, the soil under broadleaf woods had a greater concentration of SOC compared to the soil under the pine forests, whereas the opposite occurred at 1000 m a.s.l. The largest contents of total N were under hop-hornbeam at 700 m and under pine at 1000 m and the C:N ratios were generally lower in the pine forest soils than under the broadleaves (Table 1).
The soils under broadleaf forests did not display a clear SOC or total N trend with altitude, showing the greatest SOC and total N concentration in the soil under hop-hornbeam forest at 700 m. Conversely to the broadleaf forests, SOC and, less significantly, total N contents increased with altitude in the soils under the pine forests. The C contents of decaying leaves and needles from Oi horizon did not change with altitude and were greater in the pine needles than in the leaves of the broadleaf forests (Table 2). Conversely, the N concentrations were greater in the leaves than in the needles and increased with altitude in both broadleaf and pine forests. Specifically, the N contents ranged from 13.08 g kg−1 to 17.37 g kg−1 in the leaves of the broadleaf forests, with similar values at 700 and 1000 m, and linearly raised with altitude from 7.26 g kg−1 at 500 m to 12.31 g kg−1 at 1000 m in the pine needles (Table 2). Accordingly, the C:N ratios of the pine needles were greater than that of the leaves at each altitude along the slope.
With regard to the distribution of the different organic C fractions, some changes occurred in the proportion of WEOC, FA-C, HA-C and NEOC between broadleaves and pine forests at the different altitudes (Figure 2). WEOC, which ranges from about 0.5% to 2% of SOC, had the largest proportions at 700 and, to a lesser extent, at 1000 m in the soil under pine forest, and was not statistically different in the soil under the broadleaf forests at 500 m and 1000 m. The FA-C, HA-C and NEOC fractions did not show any significant differences between broadleaf and pine forest soils at 500 and 700 m. The soil under the beech ecosystem at 1000 m had a greater proportion of FA-C and HA-C compared with that of the broadleaf forests at 500 and 700 m. In addition to this, the proportion of FA-C and HA-C in the soil under the beech forest was two- to three-fold greater than under pine forest. Consequently, at the highest altitude the proportion of NEOC over SOC was statistically lower in the soil under beech than under pine forests, at least until Bw1 horizon.
The stock of organic C accumulated in the upper 20 cm of the mineral soil was greater under broadleaf than pine forests all along the altitudinal gradient (Figure 3).
As seen for SOC and total N, Cmic also did not show a trend with altitude for the soil under broadleaves, whereas an increase from 500 m to higher altitudes was evident for the soils under the pine forests (Table 3). It is worth noting that, considering only the upper soil horizons (A and AB), at 500 m altitude, there was a greater concentration of Cmic in the soil under downy oak than in the soil under pine forests. At 700 and 1000 m, the soil under the two forests did not show different Cmic contents in the upper horizons.
The amount of CO2-C released during the basal respiration experiment (ΣCO2-C) differed only in the upper A and AB horizons for the soils at 500 and 700 m and, specifically, ΣCO2-C values were higher for the downy oak and hop-hornbeam than for the pine forests (Table 3). At 1000 m, a larger respiration was generally assessed for the soil under pine forests compared to that under beech forests. The ΣCO2-C:WEOC ratio (Figure 4) showed a significant difference between the soil under the two forest types only at 500 m altitude, where the soil under pine forests had values greater than that under downy oaks. The ΣCO2-C:WEOC ratio tended to decrease with altitude for all the soils and reached the lowest values at 1000 m. At every selected altitude, the ΣCO2-C:Cmic ratio (Figure 4) did not show differences between the two forest soils, but it decreased sharply from 500 m to 700 and 1000 m altitude. The Cmic:SOC ratio (Figure 4) was similar for the soil under broadleaves and pine forests at 500 and 1000 m, but it was higher under pine than under hop-hornbeam forests at 700 m.

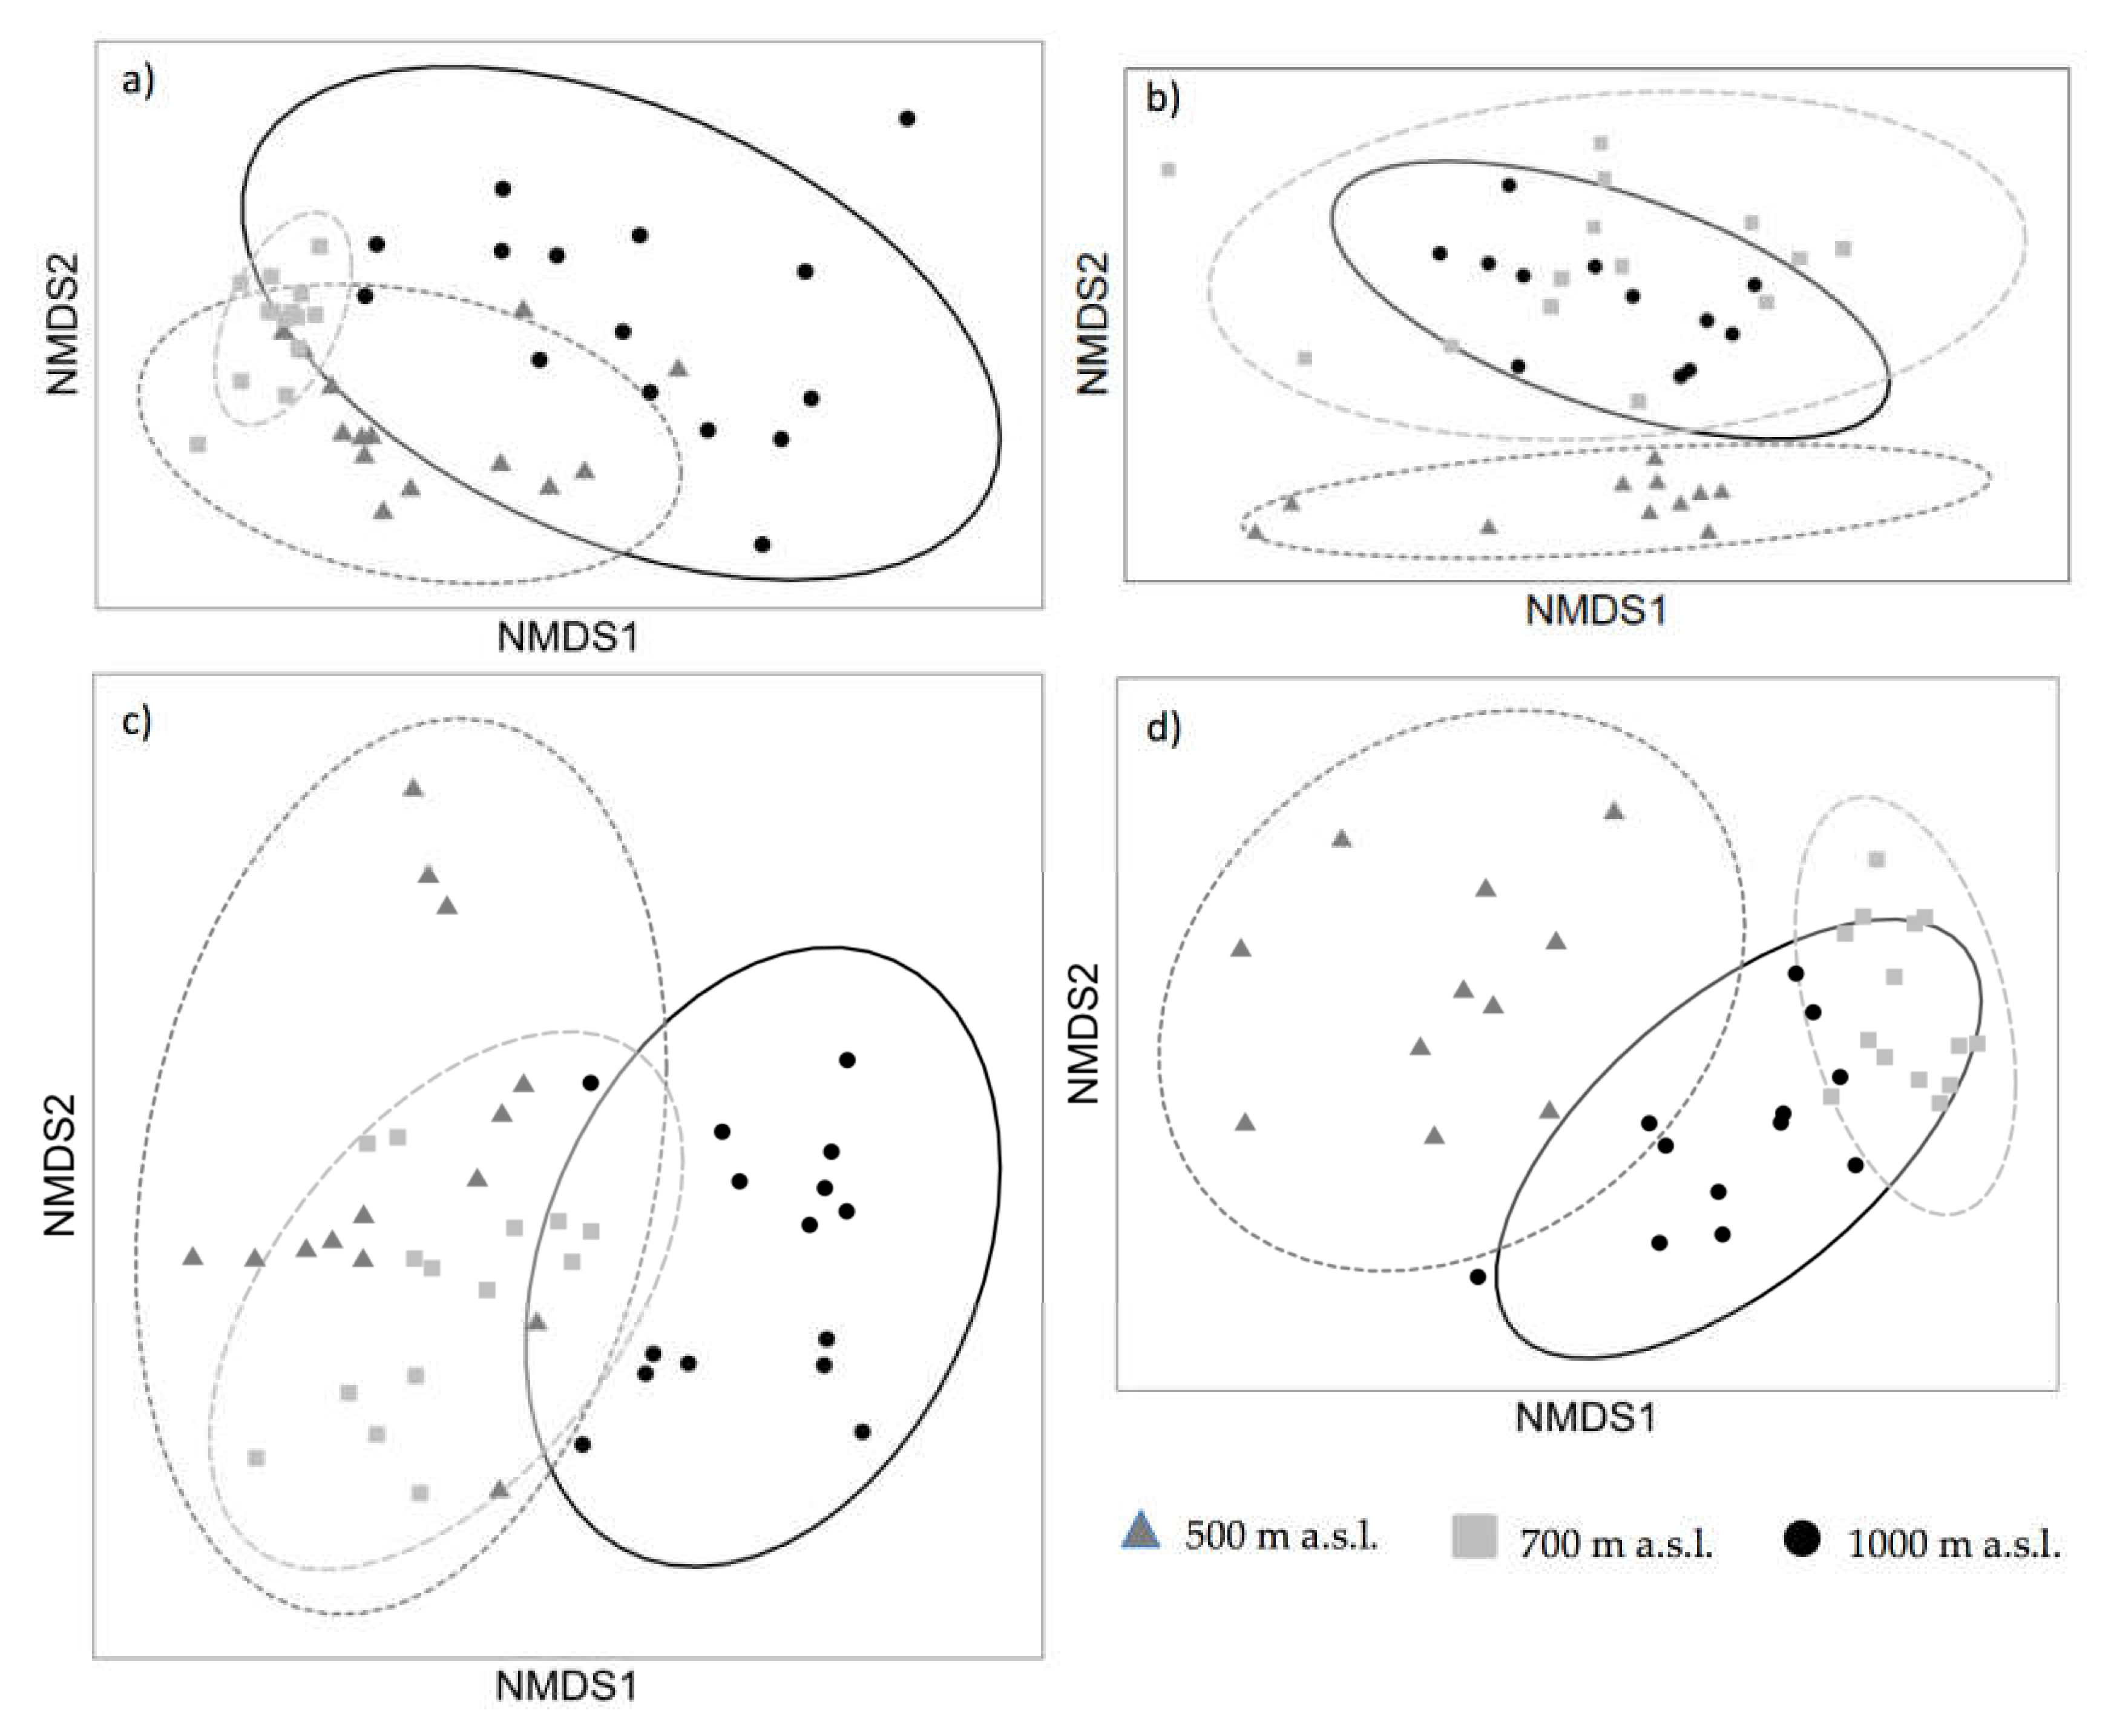
3.2. Non-Metric Multidimensional Scaling (NMDS) Analyses

The plots of the NMDS analyses performed on SOC content and on percentage distribution of the soil organic matter fractions showed a different behavior between broadleaf and pine forest soils (Figure 5a,b). While the NMDS plot of the broadleaf forests (stress = 0.118) showed a rather complete overlapping of the ellipses relative to the three altitudes (Figure 5a), for the soils under pine an evident dissimilarity occurred between the forests at low altitude (500 m) and those at mid (700 m) and high (1000 m) altitude (stress = 0.157) (Figure 5b). This dissimilarity between sites at 500 m and sites at 700 and 1000 m occurred along the NMDS2 axis and this separation appeared to be driven mainly by the WEOC component whose vector was aligned with the NMDS2 axis and had the highest value in the NMDS2 axis (Figure S1 of Supplementary Materials).
The NMDS analysis performed on the soil biochemical data (Figure 5c,d) (stress = 0.069 and 0.105, respectively) showed a fairly good dissimilarity among the altitudes for both broadleaf and pine forests, as only a slight overlapping of the ellipses relative to the forests at 500 m and those at 1000 m was observed. In addition, the sites at 700 m had a similar behavior to that at 1000 m and at 500 m for the pine and the broadleaf forests, respectively. These similarities and dissimilarities occurred along the NMDS1 axis and they were mainly driven by Cmic and Cmic:SOC ratios for the pine forest, and by ΣCO2–C and ΣCO2–C:WEOC ratios for the broadleaf forests (Figure S1 of Supplementary Materials). In particular, the contribution of these variables to the dissimilarities occurring along altitude in both forest ecosystems were indicated by the high values and alignment of their vector with NMDS1 axis (Figure S1 of Supplementary Materials).

4. Discussion

4.1. Altitude and Vegetation Effects on Soil Organic Carbon and Its Fractions Distribution

As displayed by the NMDS analysis (Figure 5a,b), the behavior showed by the soil under the pine ecosystem along the altitudinal gradient was different from that under the broadleaf forests, confirming the important role played by vegetation on the SOC and on its fractions distribution [36]. Our results showed that the SOC content along the slope, from 500 to 1000 m, did not follow the same trend for both broadleaf and pine forests. The content of SOC of the soils covered by broadleaves did not show a clear increasing trend with altitude, indicating that vegetation traits strongly influence belowground processes [21,37,38]. In particular, it has been reported that leaf stoichiometry affects litter decomposability, e.g., [39]. To this regard, because of the higher degradability of the organic tissues with a low C:N ratio, the lower C:N ratio of the European hop-hornbeam leaves than that of the downy oak could explain the greater SOC concentration that occurred at 700 m compared to that at 500 m. However, the vegetation effect is not sufficient to explain the lowest amount of SOC found in the soil under the beech forest. At this site, the SOC content can be affected, other than by a decline in plant productivity due to the low temperature, by the acidic soil pH which reduces the surface charge of minerals [40] and limits the organo-mineral interactions. This fact was supported by the lowest proportion of NEOC, mostly comprised of the mineral-associated organic matter [39,41], and the largest humic component in the soil under beech forests (Figure 1), indicating a low capacity of the minerals to strongly adsorb organic molecules. The lower SOC content of the soil under pine forests compared to that under the broadleaf forests, at least at 500 and 700 m, was attributed to the slow decay rate of the pine needles due to their sclerophyllous trait and higher C:N ratio [25].
Conversely to the soils under broadleaf forests, the soils of the pine forests showed an increase of SOC concentrations with increasing altitude. Since the plant species is the same along the altitudinal gradient, the rising of SOC contents with altitude was mostly attributed to the lowering of soil microbial activity (as indicated also by the decreasing trend of ΣCO2-C:WEOC and ΣCO2-C:Cmic ratios). In particular, the low air and soil temperatures at higher altitudes (the soil temperature decreased by about 2.5 °C from 500 to 1000 m a.s.l.), although diminishing the plant productivity [42], reduce the activity of the soil microbial community [3,4,11] and therefore promote SOC accumulation. The increase of SOC in the mineral soil could also be favoured by the reduction of the C:N ratio of the pine needles along the slope (from 68.91 at 500 m to 40.28 at 1000 m). The marked increase of the N concentration of the needles (Table 2), according to Gebauer et al., [43] and Liu et al. [44], was ascribed to a greater N assimilation efficiency of the plants at a higher altitude as a response to the short growing season and to the adverse environmental conditions. As a consequence of the increasing SOC concentration with altitude occurring in the soils under the pine ecosystem, and the low SOC concentration in the soil under beech forests, the organic C stocks in the upper 20 cm were greater under broadleaves than under the pine ecosystem at 500 and 700 m, whereas a similar amount of C was stored in the soils covered by beech and pine forests at 1000 m altitude. However, the organic C stock in the upper 20 cm was greater in broadleaf than in pine ecosystems all along the slope. At 500 and 700 m, this was due to the higher SOC concentration of the soils under the broadleaf compared to that under pine forests. At 1000 m, the absence of rock fragments in the upper horizons of the soil under beech forests (Table A1) had a greater weight than the SOC concentration, which was lower compared to that of the soil under pine forests, in the calculation of the organic C stock.
With the exception of NEOC and humic substance distributions occurring in the soil under beech forests, few significant changes with altitude and vegetation occurred for FA-C, HA-C and NEOC proportions over SOC. Conversely, WEOC, which is the most mobile and labile SOC fraction, had different behaviors in the broadleaf and pine forest soils along the slope. In particular, the absence of an altitudinal trend in the soils under broadleaf ecosystems can be explained again by the traits of the forest floor produced by the different plant species at each altitude. Indeed, the characteristics of the litter, which is considered the principal source of WEOC [45] together with rhizodepositions [18], can affect the forest floor decomposability and the quality of the degradation products at the different altitudes [46]. In the soils under pine forests the impact of altitude/temperature would not be masked by the plant species effect (which was specific at each altitude for the broadleaves), and the WEOC proportion tended to rise with altitude according to many papers, e.g., [18,47,48] that reported an increase of soluble organic matter with increasing altitude. Specifically, in our case, WEOC increased from 500 to greater altitude (no difference was observed between 700 and 1000 m) likely due to the lower soil microbial activity (lower ΣCO2-C:WEOC and ΣCO2-C:Cmic ratios) occurring at 700 and 1000 m compared to 500 m. Since WEOC represents the most labile and readily available C source for the soil microbial community [49], the lower microbial activity, and therefore the lesser amount of WEOC used by microorganisms for their own maintenance, at 700 and 1000 m compared to 500 m might explain the observed WEOC trend.

4.2. Altitude and Vegetation Effects on Biochemical Soil Properties

The key role of altitude, and therefore the related soil and air temperature, on the main biochemical soil properties measured in the present study was supported by the NMDS analysis (Figure 5c,d) which showed a similar altitudinal differentiation for both broadleaf and pine forests. The only exception were the different trends of Cmic content showed by the two forest types that were likely due to a vegetation effect [50], since the quantity and quality of forest floor are crucial drivers that affect the soil microbial biomass [51]. Further, previous studies indicate that Cmic is positively related to soil organic C content [52] and pH [53], and negatively related to soil C:N ratio [53]. In our case, Cmic content of the soils under pine forests mirrored the trend of WEOC (Figure 2), which is the most bioavailable source of energy for soil microorganisms [54,55]. In the broadleaf forests, the Cmic content mostly followed the SOC contents along the slope. For the soil under beech forests, however, the low Cmic value was attributed, other than to the low SOC content, to the acidic pH of the soil that ranged from about 5.0 to 6.2 along the profile. A pH value less than 6.2 leads to a reduction of the microbial growth and turnover rates [56], whereas when pH reaches values less than 5.2, it even limits the use of labile organics by soil microbes [57,58]. The depressing effect of soil acidity on the use of labile organics by the microbial community, and the reduced WEOC availability due to both low soil pH and limited root abundance [59,60] might also explain the lack of differences in the WEOC proportions between the beech and the other broadleaf forests along the altitudinal gradient.
The general decrease of ΣCO2-C with altitude was attributed, according to several studies (e.g., [56,57]), to a lower activity of the microbial community with decreasing soil temperature. However, ΣCO2-C:WEOC and ΣCO2-C:Cmic ratios (Figure 3) can better describe the activity of the soil microbial community than Cmic and ΣCO2-C values. Although some differences between the forest soils at each altitude occurred, there is evidence of similar general diminishing trends of the ratios with altitude for both broadleaf and pine forests. In particular, the lower ΣCO2-C:WEOC and ΣCO2-C:Cmic ratios at 700 and 1000 m, compared to that of the sites at 500 m, suggested a better substrate use efficiency of the microbial community harboring the soils at high altitude [61]. Specifically, the limited respiration per unit of WEOC, and therefore the greater conversion of the labile organic substrates into new biomass, can be considered the result of a greater C sequestration by the soil microbial community at higher altitudes. The similar trend of ΣCO2-C, d ΣCO2-C:WEOC and ΣCO2-C:Cmic ratios for both broadleaf and pine forests along the studied altitudinal gradient suggests that the temperature drives the microbial activity more than the vegetation.

5. Conclusions

This study aimed to assess the relative effects of multiple environmental factors (altitude-dependent temperature and vegetation) on SOC and soil microbial biomass and activity, along two contiguous toposequences ranging from 500 to 1000 m on a calcareous massif (Mount Cucco, Apennines chain, central Italy) and covered by broadleaf forests and pine reforestation, respectively.
The absence of an altitudinal/thermal trend for SOC contents and stocks under broadleaf forests, where a specific dominant species occurred at each altitude, indicates that plant cover and the resulting forest floor traits affect the degradation processes and the organic C accumulation into the mineral soil of the Mount Cucco massif. Conversely, along the toposequence covered by the pine forests, where the plant species effect was absent, the climatic impact induced by the altitude on SOC was evident. With regard to the soil microbial community, although the size of the soil microbial biomass followed the SOC contents along the slope, both broadleaf and pine forest soils showed a similar diminishing trend with altitude of ΣCO2-C, ΣCO2-C:WEOC and ΣCO2-C:Cmic ratios, suggesting the substrate use efficiency of the microbial community improved at high altitudes, where the demand of energy and available substrates for the soil microbes maintenance is low. From an ecological point of view, our findings suggest a high potential of the soils at higher altitudes, compared to those at lower ones, to favor the incorporation of the labile form of C into the soil microbial biomass.
In conclusion, though also edaphic (e.g., soil pH) and site-specific microclimatic conditions may play a role, our findings indicate that the altitude-dependent soil temperature and vegetation have a distinct effect on SOC and soil microbes. Specifically, while vegetation controls more than temperature the SOC amount and pool distribution, the temperature appears to be the main driver on the activity of the soil microbial community.

Supplementary Materials

The following are available online at https://www.mdpi.com/1999-4907/11/6/710/s1, Figure S1: Representation of variable scores, as vectors, obtained from the non-metric multidimensional scaling (NMDS) analyses performed on SOC and its distribution in WEOC, FA-C, HA-C and NEOC fractions for the soils under broadleaf (a) and pine (b) forests, and on ΣCO2-C, Cmic, ΣCO2-C:WEOC ratio, ΣCO2-C:Cmic ratio and Cmic:SOC ratio for the soils under broadleaf (c) and pine (d) forests, respectively, at 500, 700 and 1000 m a.s.l., Mount Cucco massif (Central Apennines, Italy). SOC: soil organic carbon; WEOC: water-extractable organic carbon; FA-C: fulvic acid carbon; HA-C: humic acid carbon; NEOC: non-extractable organic carbon; ΣCO2-C: cumulative basal respiration; Cmic: microbial biomass carbon.

Author Contributions

Conceptualization, L.M.; formal analysis, L.M. and M.D.F.; investigation, L.M., M.D.F. and A.L.; writing—original draft preparation, L.M. and M.D.F.; writing—review and editing, L.M., M.D.F. and A.A.; visualization, L.M. and M.D.F.; supervision, A.A.; Project administration, A.A. All authors have read and agreed to the published version of the manuscript.

Acknowledgments

We are grateful to Daniela Gigante for her help in the vegetation survey of the study areas and we thank Emanuela Grima for the English language editing.

Conflicts of Interest

The authors declare no conflict of interest.

Appendix A

Table A1. Main descriptive elements of soil profiles developed under the broadleaf forests and the areas reforested with black pine (Pinus nigra J.F. Arnold) at 500, 700 and 1000 m a.s.l., Mount Cucco massif (Central Apennines, Italy). For symbols see legend.
HorizonDepthColour aStructure bConsistence cTexture dRoots eThicknessBoundary fRock Fragments gOther Observations
cmcm
Altitude ≈500 m a.s.l. (43°16′57″ N, 12°45′39″ E); exposure: W; slope: ≈20%. Soil: loamy-skeletal, mixed, mesic, Typic Humustepts [30] Vegetation: Upper stratum: Quercus pubescens Willd.—Lower stratum: Fraxinus ornus L., Ostrya carpinifolia Scop.—Understory: Brachypodium rupestre (Host) Roem. & Schult, Lonicera caprifolium L, Cotynus cogygria Scop., Citisus sessilifolius L. 1753, Asparagus acutifolius L., Carex flacca Schreb. seedlings.
Oi5–2Quercus leafs with twigs and cupules
Oe2–0
A0–125YR 4/42 f crs, pssl3mi,vf,f,m5–12cw40% Mgr
AB12–245YR 4/62 f sbkss, pssl3mi,vf,f,m7–12cw50% Mgr
Bw124–352.5YR4/62 fm sbkso, posl3mi,vf,f,1m11cs50% Cgr,
Bw235–482.5YR4/61 fm sbkss, pssl2vf,f,1m13cs60% VCgr
BC48–61+5YR4/81 fm sbkss, pssl1f,m--60% VCgr
Altitude ≈500 m a.s.l. (43°16′58″ N, 12°45′38″ E); exposure: W; slope: ≈20%. Soil: loamy-skeletal, mixed, mesic, Typic Humustepts [30] Vegetation: Upper stratum: Pinus nigra J.F. Arnold—Lower stratum: Fraxinus ornus L., Quercus pubescens L.—Understory: Brachypodium rupestre (Host) Roem. & Schult, Spartium junceum L., seedlings.
Oi5–2Pinus needles, with twigs and cones
Oe2–0
A0–97,5YR5/42 f, m crss, posl3mi,vf,f,2m8–12cw30% Mgr
AB9–1710YR4/32 f, m sbkss, pssl3vf,f,m7–10cw40% Mgr
Bw117–267.5YR4/41 f, m sbkss, pssl2vf,f,m,v1c9cs40% Mgr
Bw226–3710YR3/41f, m sbkso,pssl2f,1m8–12cw60% Mgr
Cr37–46+Not described and not sampled
Altitude ≈700 m a.s.l. (43°16′26″ N, 12°46′27″ E); exposure: W; slope: ≈35%. Soil: loamy-skeletal, mixed, mesic, Typic Humustepts [30] Vegetation: Upper stratum: Ostrya Carpinifolia Scop.—Lower stratum: Fraxinus ornus L., Quercus pubescens L., Acer opalus subsp. obtusatum (Waldst. & Kit. ex Willd.) Gams, Sorbus aria (L.) Crantz, Acer monspessulanum L.—Understory: Sesleria nitida Ten., Citisus sessilifolius L. 1753, Brachypodium rupestre (Host) Roem. & Schult
Oi9–5Ostrya leafs with twigs and cupules
Oe5–2
Oa2–0
A0–1810YR3/22 f, m sbkss, psls3vf,f,m v1c14–18cw35% Mgr, 25% Cgr
AB18–2910YR3/32 f, m sbkss, pls3vf,f 2m,1c8–12cw40% VCgr
Bw129–507.5YR3/22 f, m sbkss, pssl3vf,f 2m18–22cw40% VCgr
Bw250–627.5YR4/31 f, m sbks, psl3vf,f 2m9–14cw30% Mgr
BC62–80+7.5YR4/41 f sbks, psl3f, 2m--60% VCgr
Altitude ≈700 m a.s.l. (43°16′37″ N, 12°46′15″ E); exposure: W; slope: ≈25%. Soil: loamy-skeletal, mixed, mesic, Typic Humustepts [30] Vegetation: Upper stratum: Pinus nigra J.F. Arnold—Lower stratum: Fraxinus ornus L., Ostrya carpinifolia Scop., Sorbus aria (L.) Crantz—Understory: Brachypodium rupestre (Host) Roem. & Schult, Rubus ulmifolius Schott, 1818
Oi5–2Pinus needles, with twigs and cones
Oe2–0
A0–97.5YR3/22 f sbkso, pls3mi,vf,f,1m5–10cw30% Mgr
AB9–177.5YR4/22 f, m sbkso, psscl3vf,f,1m6–9cw40% Mgr
Bw117–305YR3/32 f, m,sbkso, psscl3vf,f,1m,v1c16cs40% Cgr
Bw230–465YR3/41 f, m sbkso, pssl2vf,3f,1m,c12–18cw40% Cgr, 10% VCgr
BC46–60+5YR3/41 f, m sbkso, pssl2f,m,1c--55% Cgr, 10% VCgr
Altitude ≈1000 m a.s.l. (43°23′36″ N, 12°42′31″ E); exposure: W; slope: ≈25%. Soil: loamy, mixed, mesic, Typic Humustepts [30] Vegetation: Upper stratum: Fagus sylvatica L.—Lower stratum: Acer campestre L., Quercus cerris L., Prunus avium L.—Understory: Aegopodium podagraria L., Arctium lappa L., 1753
Oi5–1Fagus leafs with twigs, and cupules
Oe1–0
A0–77.5YR3/22 f sbkso, psl1vf, 2f4–8cw0%
AB7–1510YR4/22 f sbkso, pl1vf,f,m7–11cw0%
Bw115–2810YR4/32 f sbkso, pl2vf,f 1m9–14cw3% Fgr
Bw228–4210YR4/32 f, m sbkss, pcl2vf,f 1m,c14cs10% Fgr
BC42–55+10YR4/21 f, m sbks, pscl2f 1m--20% Mgr
Altitude ≈1000 m a.s.l. (43°22′53″ N, 12°42′48″ E); exposure: W; Slope: ≈30%. Soil: loamy-skeletal, mixed, mesic, Typic Humustepts [30] Vegetation: Upper stratum: Pinus nigra J.F. Arnold—Lower stratus: Acer opalus subsp. obtusatum (Waldst. & Kit. ex Willd.) Gams, Acer pseudoplatanus L., 1753, Sorbus aria (L.) Crantz, Quercus spp.—Understory: Brachypodium rupestre (Host) Roem. & Schult, Lonicera xylosteum L., Viola alba subsp. dehnhardtii (Ten.) W. Becker, Daphne laureola L.
Oi7–4Pinus needles, with twigs and cones
Oe4–1
Oa1–0
A0–85YR3/23 f sbkso, psls3 vf,f7–9cw40% Cgr
AB8–135YR3/33 f sbkso, pssl3vf,f,m 1c5–9cw40% Cgr
Bw13–267.5YR3/22 f sbkso, pssl2vf,f 1m,c13cs60% Cgr
BC26–47+7.5YR3/32 f sbkso, pssl2vf,f,m--90% VCgr
a moist and crushed, according to the Munsell Soil Color Chart (1954 edition). b v1 = very weak, 1 = weak, 2 = moderate, 3 = strong; f = fine, m = medium, fm = fine-to-medium, cr = crumb, sbk = subangular blocky. c s = sticky, ss = slightly sticky, so = non-sticky; p = plastic, ps = slightly plastic, po = non-plastic. d ls = loamy sand, sl = sandy loam, l = loam, scl = sandy clay loam, cl = clay loam. e 0 = absent, 1 = few, 2 = plentiful, 3 = abundant; mi = micro, vf = very fine, f = fine, m = medium, c=coarse. f c = clear; w = wavy, s = smooth. g on a volume basis, by sight. Fgr = fine gravelly (2–5 mm); Mgr = medium gravelly (5–20 mm), Cgr = coarse gravelly (20–76 mm), VCgr = very coarse gravelly (>76 mm).

References

  1. Bispo, A.; Andersen, L.; Angers, D.A.; Bernoux, M.; Brossard, M.; Cécillon, L.; Comans, R.N.J.; Harmsen, J.; Jonassen, K.; Lamé, F.; et al. Accounting for carbon stocks in soils and measuring GHGs emission fluxes from soils: Do we have the necessary standards? Front. Environ. Sci. 2017, 5. [Google Scholar] [CrossRef] [Green Version]
  2. Dungait, J.A.J.; Hopkins, D.W.; Gregory, A.S.; Whitmore, A.P. Soil organic matter turnover is governed by accessibility not recalcitrance. Glob. Chang. Biol. 2012, 18, 1781–1796. [Google Scholar] [CrossRef]
  3. Xu, M.; Li, X.; Cai, X.; Gai, J.; Li, X.; Christie, P.; Zhang, J. Soil microbial community structure and activity along a montane elevational gradient on the Tibetan Plateau. Eur. J. Soil Biol. 2014, 64, 6–14. [Google Scholar] [CrossRef]
  4. Blume, E.; Bischoff, M.; Reichert, J.M.; Moorman, T.; Konopka, A.; Turco, R.F. Surface and subsurface microbial biomass, community structure and metabolic activity as a function of soil depth and season. Appl. Soil Ecol. 2002, 20, 171–181. [Google Scholar] [CrossRef]
  5. Chen, L.F.; He, Z.B.; Du, J.; Yang, J.J.; Zhu, X. Patterns and environmental controls of soil organic carbon and total nitrogen in alpine ecosystems of northwestern China. Catena 2016, 137, 37–43. [Google Scholar] [CrossRef]
  6. Buchan, G.D. Temperature effects in soil. In Encyclopedia of Earth Sciences Series; Springer: Berlin, Germany, 2011; Volume 4, pp. 891–895. [Google Scholar]
  7. Zhang, G.N.; Chen, Z.H.; Zhang, A.M.; Chen, L.J.; Wu, Z.J. Influence of climate warming and nitrogen deposition on soil phosphorus composition and phosphorus availability in a temperate grassland, China. J. Arid Land 2014, 6, 156–163. [Google Scholar] [CrossRef] [Green Version]
  8. Butler, S.M.; Melillo, J.M.; Johnson, J.E.; Mohan, J.; Steudler, P.A.; Lux, H.; Burrows, E.; Smith, R.M.; Vario, C.L.; Scott, L.; et al. Soil warming alters nitrogen cycling in a New England forest: Implications for ecosystem function and structure. Oecologia 2012, 168, 819–828. [Google Scholar] [CrossRef] [Green Version]
  9. Vincent, A.G.; Sundqvist, M.K.; Wardle, D.A.; Giesler, R. Bioavailable soil phosphorus decreases with increasing elevation in a subarctic tundra landscape. PLoS ONE 2014, 9, e92942. [Google Scholar] [CrossRef] [Green Version]
  10. Schindlbacher, A.; De Gonzalo, C.; Díaz-Pinés, E.; Gíorra, P.; Matthews, B.; Inclán, R.; Zechmeister-Boltenstern, S.; Rubio, A.; Jandl, R. Temperature sensitivity of forest soil organic matter decomposition along two elevation gradients. J. Geophys. Res. Biogeosci. 2010, 115. [Google Scholar] [CrossRef]
  11. Cardelli, V.; De Feudis, M.; Fornasier, F.; Massaccesi, L.; Cocco, S.; Agnelli, A.; Weindorf, D.C.; Corti, G. Changes of topsoil under Fagus sylvatica along a small latitudinal-altitudinal gradient. Geoderma 2019, 344, 164–178. [Google Scholar] [CrossRef]
  12. Kobler, J.; Zehetgruber, B.; Dirnböck, T.; Jandl, R.; Mirtl, M.; Schindlbacher, A. Effects of aspect and altitude on carbon cycling processes in a temperate mountain forest catchment. Landsc. Ecol. 2019, 34, 325–340. [Google Scholar] [CrossRef] [Green Version]
  13. Gutiérrez-Girón, A.; Díaz-Pinés, E.; Rubio, A.; Gavilán, R.G. Both altitude and vegetation affect temperature sensitivity of soil organic matter decomposition in Mediterranean high mountain soils. Geoderma 2015, 237–238, 1–8. [Google Scholar] [CrossRef]
  14. Chang, R.; Wang, G.; Fei, R.; Yang, Y.; Luo, J.; Fan, J. Altitudinal Change in Distribution of Soil Carbon and Nitrogen in Tibetan Montane Forests. Soil Sci. Soc. Am. J. 2015, 79, 1455–1469. [Google Scholar] [CrossRef]
  15. Tsozué, D.; Nghonda, J.P.; Tematio, P.; Basga, S.D. Changes in soil properties and soil organic carbon stocks along an elevation gradient at Mount Bambouto, Central Africa. Catena 2019, 175, 251–262. [Google Scholar] [CrossRef]
  16. De Feudis, M.; Cardelli, V.; Massaccesi, L.; Trumbore, S.E.; Vittori Antisari, L.; Cocco, S.; Corti, G.; Agnelli, A. Small altitudinal change and rhizosphere affect the SOM light fractions but not the heavy fraction in European beech forest soil. Catena 2019, 181, 104091. [Google Scholar] [CrossRef]
  17. De Feudis, M.; Cardelli, V.; Massaccesi, L.; Lagomarsino, A.; Fornasier, F.; Westphalen, D.J.; Cocco, S.; Corti, G.; Agnelli, A. Influence of altitude on biochemical properties of European Beech (Fagus sylvatica L.) forest soils. Forests 2017, 8, 213. [Google Scholar] [CrossRef]
  18. De Feudis, M.; Cardelli, V.; Massaccesi, L.; Hofmann, D.; Berns, A.E.; Bol, R.; Cocco, S.; Corti, G.; Agnelli, A. Altitude affects the quality of the water-extractable organic matter (WEOM) from rhizosphere and bulk soil in European beech forests. Geoderma 2017, 302, 6–13. [Google Scholar] [CrossRef]
  19. Von Lützow, M.; Kögel-Knabner, I. Temperature sensitivity of soil organic matter decomposition-what do we know? Biol. Fertil. Soils 2009, 46, 1–15. [Google Scholar] [CrossRef]
  20. Paul, E.A. The nature and dynamics of soil organic matter: Plant inputs, microbial transformations, and organic matter stabilization. Soil Biol. Biochem. 2016, 98, 109–126. [Google Scholar] [CrossRef] [Green Version]
  21. Quideau, S.A.; Chadwick, O.A.; Benesi, A.; Graham, R.C.; Anderson, M.A. A direct link between forest vegetation type and soil organic matter composition. Geoderma 2001, 104, 41–60. [Google Scholar] [CrossRef]
  22. Ayres, E.; Steltzer, H.; Berg, S.; Wallenstein, M.D.; Simmons, B.L.; Wall, D.H. Tree species traits influence soil physical, chemical, and biological properties in high elevation forests. PLoS ONE 2009, 4. [Google Scholar] [CrossRef] [PubMed]
  23. Smolander, A.; Loponen, J.; Suominen, K.; Kitunen, V. Organic matter characteristics and C and N transformations in the humus layer under two tree species, Betula pendula and Picea abies. Soil Biol. Biochem. 2005, 37, 1309–1318. [Google Scholar] [CrossRef]
  24. Aponte, C.; García, L.V.; Marañón, T. Tree species effect on litter decomposition and nutrient release in Mediterranean oak Fforests changes over time. Ecosystems 2012, 15, 1204–1218. [Google Scholar] [CrossRef] [Green Version]
  25. Berger, T.W.; Duboc, O.; Djukic, I.; Tatzber, M.; Gerzabek, M.H.; Zehetner, F. Decomposition of beech (Fagus sylvatica) and pine (Pinus nigra) litter along an Alpine elevation gradient: Decay and nutrient release. Geoderma 2015, 251–252, 92–104. [Google Scholar] [CrossRef] [Green Version]
  26. Badalamenti, E.; Battipaglia, G.; Gristina, L.; Novara, A.; Ruhl, J.; Sala, G.; Sapienza, L.; Valentini, R.; La Mantia, T. Carbon stock increases up to old growth forest along a secondary succession in Mediterranean island ecosystems. PLoS ONE 2019, 14. [Google Scholar] [CrossRef]
  27. Wan, Q.; Zhu, G.; Guo, H.; Zhang, Y.; Pan, H.; Yong, L.; Ma, H. Influence of Vegetation Coverage and Climate Environment on Soil Organic Carbon in the Qilian Mountains. Sci. Rep. 2019, 9, 17623. [Google Scholar] [CrossRef]
  28. Regione Umbria. Parco del Monte Cucco—Aspetti Vegetazionali, Botanici e Forestali. Piani dei Parchi Regionali dell’Umbria. Available online: http://www.regione.umbria.it/documents/18/2512711/Cucco_vegetazione_ott_15.pdf/0fd79a30-6fea-4acd-9dac-5917c2a86a20 (accessed on 15 June 2020).
  29. Schoeneberger, P.J.; Wysocki, D.A.; Benham, E.C. Soil Survey Staff Field Book for Describing and Sampling Soils; Version 3.0; Natural Resources Conservation Service, National Soil Survey Center: Lincoln, NE, USA, 2012.
  30. Soil Survey Staff. Keys to Soil Taxonomy, 12th ed.; USDA—Natural Resources Conservation Service: Washington, DC, USA, 2014.
  31. Sparks, D.L.; Page, A.L.; Helmke, P.A.; Loeppert, R.H.; Nelson, D.W.; Sommers, L.E. Total Carbon, Organic Carbon, and Organic Matter. In Methods of Soil Analysis; American Society of Agronomy, Inc.: Madison, WI, USA; Soil Science Society of America, Inc.: Madison, WI, USA, 1996. [Google Scholar]
  32. Swift, R.S. Organic Matter Characterization. In Methods of Soil Analysis; American Society of Agronomy, Inc.: Madison, WI, USA; Soil Science Society of America, Inc.: Madison, WI, USA, 2018; pp. 1011–1069. [Google Scholar]
  33. Vance, E.D.; Brookes, P.C.; Jenkinson, D.S. An extraction method for measuring soil microbial biomass C. Soil Biol. Biochem. 1987, 19, 703–707. [Google Scholar] [CrossRef]
  34. R Core Team. R: A Language and Environment for Statistical Computing; R Foundation for Statistical Computing: Vienna, Austria, 2018. [Google Scholar]
  35. Bonarelli, G.; Principi, P.; Pilotti, C.; Scarsella, F.; Lipparini, T.; Moretti, A.; Selli, R. Carta Geologica d’Italia Alla Scala 1:100,000; Foglio 116; Servizio Geologico D’Italia: Gubbio, Italy, 1952. [Google Scholar]
  36. Jobbágy, E.; Jackson, R. The vertical distribution of soil organic carbon and its relation to climate and vegetation. Ecol. Appl. 2000, 10, 423–436. [Google Scholar] [CrossRef]
  37. Massaccesi, L.; Bardgett, R.D.; Agnelli, A.; Ostle, N.; Wilby, A.; Orwin, K.H. Impact of plant species evenness, dominant species identity and spatial arrangement on the structure and functioning of soil microbial communities in a model grassland. Oecologia 2015, 177, 747–759. [Google Scholar] [CrossRef]
  38. Bardgett, R.D.; Mommer, L.; De Vries, F.T. Going underground: Root traits as drivers of ecosystem processes. Trends Ecol. Evol. 2014, 29, 692–699. [Google Scholar] [CrossRef]
  39. Newcomb, C.J.; Qafoku, N.P.; Grate, J.W.; Bailey, V.L.; De Yoreo, J.J. Developing a molecular picture of soil organic matter-mineral interactions by quantifying organo-mineral binding. Nat. Commun. 2017, 8. [Google Scholar]
  40. Fissore, C.; Giardina, C.P.; Kolka, R.K.; Trettin, C.C.; King, G.M.; Jurgensen, M.F.; Barton, C.D.; Mcdowell, S.D. Temperature and vegetation effects on soil organic carbon quality along a forested mean annual temperature gradient in North America. Glob. Chang. Biol. 2008, 14, 193–205. [Google Scholar] [CrossRef] [Green Version]
  41. Eusterhues, K.; Rumpel, C.; Kleber, M.; Kögel-Knabner, I. Stabilisation of soil organic matter by interactions with minerals as revealed by mineral dissolution and oxidative degradation. Org. Geochem. 2003, 34, 1591–1600. [Google Scholar] [CrossRef]
  42. Zianis, D.; Mencuccini, M. Aboveground net primary productivity of a beech (Fagus moesiaca) forest: A case study of Naousa forest, northern Greece. Tree Physiol. 2005, 25, 713–722. [Google Scholar] [CrossRef] [PubMed] [Green Version]
  43. Gebauer, R.; Volařík, D.; Funda, T.; Fundová, I.; Kohutka, A.; Klapetek, V.; Martinková, M.; Anenkhonov, O.A.; Razuvaev, A. Pinus pumila growth at different altitudes in the Svyatoi Nos Peninsula (Russia). J. For. Sci. 2010, 56, 101–111. [Google Scholar] [CrossRef] [Green Version]
  44. Liu, X.Z.; Gao, C.C.; Su, Q.; Zhang, Y.; Song, Y. Altitudinal trends in δ13C value, stomatal density and nitrogen content of Pinus tabuliformis needles on the southern slope of the middle Qinling Mountains, China. J. Mt. Sci. 2016, 13, 1066–1077. [Google Scholar] [CrossRef]
  45. Kalbitz, K.; Kaiser, K. Contribution of dissolved organic matter to carbon storage in forest mineral soils. J. Plant. Nutr. Soil Sci. 2008, 171, 52–60. [Google Scholar] [CrossRef]
  46. Zhu, J.; Yang, W.; He, X. Temporal dynamics of abiotic and biotic factors on leaf litter of three plant species in relation to decomposition rate along a subalpine elevation gradient. PLoS ONE 2013, 8. [Google Scholar] [CrossRef] [Green Version]
  47. Xu, G.; Chen, J.; Berninger, F.; Pumpanen, J.; Bai, J.; Yu, L.; Duan, B. Labile, recalcitrant, microbial carbon and nitrogen and the microbial community composition at two Abies faxoniana forest elevations under elevated temperatures. Soil Biol. Biochem. 2015, 91, 1–13. [Google Scholar] [CrossRef]
  48. Fernández Sanjurjo, M.J.; Corti, G.; Certini, G.; Ugolini, F.C. Pedogenesis induced by Genista aetnensis (Biv.) DC. on basaltic pyroclastic deposits at different altitudes, Mt. Etna, Italy. Geoderma 2003, 115, 223–243. [Google Scholar] [CrossRef]
  49. Paolo Di Lonardo, D.; De Boer, W.; Zweers, H.; van der Wal, A. Effect of the amount of organic trigger compounds, nitrogen and soil microbial biomass on the magnitude of priming of soil organic matter. PLoS ONE 2019, 14, e0216730. [Google Scholar] [CrossRef] [PubMed]
  50. Thakur, M.P.; Milcu, A.; Manning, P.; Niklaus, P.A.; Roscher, C.; Power, S.; Reich, P.B.; Scheu, S.; Tilman, D.; Ai, F.; et al. Plant diversity drives soil microbial biomass carbon in grasslands irrespective of global environmental change factors. Glob. Chang. Biol. 2015, 21, 4076–4085. [Google Scholar] [CrossRef] [PubMed] [Green Version]
  51. Fanin, N.; Hättenschwiler, S.; Fromin, N. Litter fingerprint on microbial biomass, activity, and community structure in the underlying soil. Plant. Soil 2014, 379, 79–91. [Google Scholar] [CrossRef]
  52. Li, W.; Yang, G.; Chen, H.; Tian, J.; Zhang, Y.; Zhu, Q.; Peng, C.; Yang, J. Soil available nitrogen, dissolved organic carbon and microbial biomass content along altitudinal gradient of the eastern slope of Gongga Mountain. Acta Ecol. Sin. 2013, 33, 266–271. [Google Scholar] [CrossRef]
  53. Djukic, I.; Zehetner, F.; Mentler, A.; Gerzabek, M.H. Microbial community composition and activity in different Alpine vegetation zones. Soil Biol. Biochem. 2010, 42, 155–161. [Google Scholar] [CrossRef]
  54. Kaiser, K.; Kalbitz, K. Cycling downwards—Dissolved organic matter in soils. Soil Biol. Biochem. 2012, 52, 29–32. [Google Scholar] [CrossRef]
  55. Smolander, A.; Kitunen, V. Soil microbial activities and characteristics of dissolved organic C and N in relation to tree species. Soil Biol. Biochem. 2002, 34, 651–660. [Google Scholar] [CrossRef]
  56. Malik, A.A.; Puissant, J.; Buckeridge, K.M.; Goodall, T.; Jehmlich, N.; Chowdhury, S.; Gweon, H.S.; Peyton, J.M.; Mason, K.E.; van Agtmaal, M.; et al. Land use driven change in soil pH affects microbial carbon cycling processes. Nat. Commun. 2018, 9, 3591. [Google Scholar] [CrossRef]
  57. Motavalli, P.P.; Palm, C.A.; Parton, W.J.; Elliott, E.T.; Frey, S.D. Soil pH and organic C dynamics in tropical forest soils: Evidence from laboratory and simulation studies. Soil Biol. Biochem. 1995, 27, 1589–1599. [Google Scholar] [CrossRef]
  58. Cerri, C.C.; Jenkinson, D.S. Formation of Microbial Biomass During the Decomposition of 14C Labelled Ryegrass in Soil. J. Soil Sci. 1981, 32, 619–626. [Google Scholar] [CrossRef]
  59. Curtin, D.; Peterson, M.E.; Anderson, C.R. pH-dependence of organic matter solubility: Base type effects on dissolved organic C, N, P, and S in soils with contrasting mineralogy. Geoderma 2016, 271, 161–172. [Google Scholar] [CrossRef]
  60. Agnelli, A.; Massaccesi, L.; De Feudis, M.; Cocco, S.; Courchesne, F.; Corti, G. Holm oak (Quercus ilex L.) rhizosphere affects limestone-derived soil under a multi-centennial forest. Plant. Soil 2016, 400, 297–314. [Google Scholar] [CrossRef]
  61. Bölscher, T.; Wadsö, L.; Börjesson, G.; Herrmann, A.M. Differences in substrate use efficiency: Impacts of microbial community composition, land use management, and substrate complexity. Biol. Fertil. Soils 2016, 52, 547–559. [Google Scholar] [CrossRef]
Figure 1. Map of Italy with magnification of the Umbria region and indication of the study sites.
Forests 11 00710 g001
Figure 2. Percentage distribution of the soil organic carbon as (a) water-extractable organic carbon (WEOC), (b) fulvic acid carbon (FA-C), (c) humic acid carbon (HA-C) and (d) non-extractable organic carbon (NEOC) for the soils under broadleaf (light bars) and pine (dark bars) forests at 500, 700 and 1000 m a.s.l., Mount Cucco massif (Central Apennines, Italy). Error bars are the standard errors (n = 3). For each soil parameter and horizon, different letters indicate significant differences among vegetation types and altitudes according to Tukey’s test (p < 0.05).
Forests 11 00710 g002
Figure 3. Organic carbon stock at the 0–20 cm depth interval of the soils under the broadleaf (light bars) and pine (dark bars) forests at 500, 700 and 1000 m a.s.l., Mount Cucco massif (Central Apennines, Italy). Error bars are the standard errors (n = 3). Different letters indicate significant differences among vegetation types and altitudes according to Tukey’s test (p < 0.05).
Forests 11 00710 g003
Figure 4. (a) Cumulative basal respiration (ΣCO2-C) to water-extractable organic carbon ratio (ΣCO2-C:WEOC ratio), (b) ΣCO2-C to microbial biomass carbon (Cmic) ratio (ΣCO2-C:Cmic ratio), and (c) Cmic to soil organic carbon ratio (Cmic:SOC ratio) for the soils under broadleaf (light bars) and pine (dark bars) forests at 500, 700 and 1000 m a.s.l., Mount Cucco massif (Central Apennines, Italy). Error bars are the standard errors (n = 3). For each soil parameter and horizon, different letters indicate significant differences among vegetation types and altitudes according to Tukey’s test (p < 0.05).
Forests 11 00710 g004
Figure 5. Two-dimensional non-metric multidimensional scaling (NMDS) plots of SOC and its distribution in WEOC, FA-C, HA-C and NEOC fractions for the soils under broadleaf (a) and pine (b) forests, and NMDS plots of ΣCO2-C, Cmic, ΣCO2-C:WEOC ratio, ΣCO2-C:Cmic ratio and Cmic:SOC ratio for the soils under broadleaf (c) and pine (d) forests, respectively, at 500, 700 and 1000 m a.s.l., Mount Cucco massif (Central Apennines, Italy). Circle lines in NMDS plot are 95% confidence ellipses. SOC: soil organic carbon; WEOC: water-extractable organic carbon; FA-C: fulvic acid carbon; HA-C: humic acid carbon; NEOC: non-extractable organic carbon; ΣCO2-C: cumulative basal respiration; Cmic: microbial biomass carbon.
Forests 11 00710 g005
Table 1. Values of pH (in water), soil organic carbon (SOC) content, total nitrogen (TN) content and C:N ratio of the soils under the broadleaf and pine forests at 500, 700 and 1000 m a.s.l., Mount Cucco massif (Central Apennines, Italy). For each soil parameter and horizon, different letters indicate significant differences among vegetation types and altitudes according to Tukey’s test (p < 0.05). Numbers in parentheses are the standard errors (n = 3).
HorizonAltitude (m a.s.l.)pHH2OSOC (g kg−1)TN (g kg−1)C:N ratio
BroadleafPineBroadleafPineBroadleafPineBroadleafPine
A5007.19 (0.19) a7.44 (0.04) a74.8 (7.6) a39.7 (4.7) c4.47 (0.51) ab3.40 (0.24) bc16.8 (0.3) a11.6 (0.7) b
7007.45 (0.02) a7.42 (0.06) a108.7 (12.2) a46.2 (2.2) bc6.00 (0.32) a3.51 (0.41) bc18.0 (1.2) a13.4 (0.9) ab
10005.02 (0.09) b7.46 (0.03) a39.0 (2.1) c69.5 (6.5) ab2.25 (0.30) c6.70 (0.75) a18.1 (3.1) a10.4 (0.3) b
AB5007.63 (0.07) a7.60 (0.06) a44.8 (3.1) b28.5 (2.1) c3.67 (0.58) ab2.50 (0.18) bc12.6 (1.5) ab11.4 (0.1) ab
7007.70 (0.04) a7.55 (0.03) a75.5 (5.9) a34.1 (1.9) bc4.58 (0.24) a2.76 (0.16) b16.5 (1.6) a12.4 (0.7) ab
10005.05 (0.08) b7.58 (0.05) a19.8 (1.6) d47.0 (5.2) b1.66 (0.16) c4.81 (0.36) a12.1 (1.5) ab9.7 (0.3) b
Bw1/Bw5007.75 (0.06) a7.64 (0.03) a32.0 (8.3) bc25.6 (2.1) bc2.26 (0.29) b2.43 (0.09) b13.9 (2.4) ab10.5 (0.6) ab
7007.78 (0.05) a7.55 (0.06) a67.8 (7.0) a30.6 (2.2) bc3.63 (0.04) a2.40 (0.16) b18.2 (2.1) ab12.7 (0.1) ab
10005.31 (0.01) b7.62 (0.07) a20.4 (4.2) c41.8 (1.7) ab1.26 (0.05) c4.35 (0.23) a16.0 (2.9) ab9.6 (0.4) b
Bw25007.80 (0.06) a7.67 (0.04) a34.2 (6.2) b25.5 (3.4) bc1.95 (0.37) a2.34 (0.31) a18.8 (6.7) ac10.9 (0.0) bc
7007.88 (0.04) a7.58 (0.05) a66.8 (4.5) a24.8 (1.6) bc3.75 (0.69) a2.32 (0.22) a18.2 (2.1) ab10.8 (0.4) c
10005.84 (0.19) b19.2 (1.4) c0.86 (0.06) b22.6 (2.1) a
BC5007.93 (0.07) a26.4 (3.0) bc1.47 (0.33) bc20.6 (6.5) a
7007.86 (0.04) a7.57 (0.07) a49.6 (5.4) a23.3 (1.3) bc3.67 (0.25) a2.53 (0.65) ab13.6 (1.6) a9.7 (2.0) a
10006.20 (0.22) b7.76 (0.07) a12.0 (3.5) c38.4 (3.7) ab0.68 (0.04) c4.76 (0.81) a18.0 (5.9) a8.4 (0.9) a
Table 2. Carbon (C) and nitrogen (N) contents and C:N ratio of the decaying leaves and needles collected from the Oi horizons of the broadleaf and pine forests, respectively, at 500, 700 and 1000 m a.s.l., Mount Cucco massif (Central Apennines, Italy). Different letters indicate significant differences according to Tukey’s test (p < 0.05). Numbers in parentheses are the standard errors (n = 3).
Altitude
(m a.s.l.)
C (g kg−1)N (g kg−1)C:N ratio
BroadleafPineBroadleafPineBroadleafPine
500436.50
(1.76) b
500.23
(0.99) a
13.08
(0.14) b
7.26
(0.08) e
33.38
(0.50) d
68.91
(0.82) a
700430.34
(10.17) b
490.01
(2.22) a
16.41
(0.16) a
9.38
(0.09) d
26.23
(0.39) e
52.23
(0.31) b
1000360.40
(12.90) b
495.89
(2.68) a
17.37
(0.40) a
12.31
(0.20) c
20.75
(0.66) f
40.28
(0.82) c
Table 3. Content of microbial biomass carbon (Cmic) and cumulative amount of CO2-C evolved during 21 days of incubation (ΣCO2-C) of the soils under the broadleaf and pine forests at 500, 700 and 1000 m a.s.l., Mount Cucco massif (Central Apennines, Italy). For each soil parameter and horizon, different letters indicate significant differences among vegetation types and altitudes according to Tukey’s test (p < 0.05). Numbers in parentheses are the standard errors (n = 3).
HorizonAltitude (m a.s.l.)Cmic (mg kg−1)ΣCO2-C (mg kg−1)
BroadleafPineBroadleafPine
A500579 (37) c308 (31) d1819 (179) a1111 (124) bc
7001059 (65) a831(39) ab1385 (134) ab1037 (36) bc
1000688 (35) bc836 (49) ab607 (81) d826 (73) c
AB500488 (19) ab199 (38) c1387 (93) a825 (58) bc
700750 (93) a752 (66) a1169 (49) ab788 (79) c
1000363 (77) bc597 (86) ab349 (105) d550 (62) cd
Bw1/Bw500474 (82) ab310 (86) b875 (62) a726 (103) a
700568 (58) ab766 (48) a754 (107) a849 (68) a
1000290 (68) b449 (72) b210 (33) b530 (90) a
Bw2500162 (53) b169 (79) b657 (33) a570 (102) a
700470 (0) ab625 (51) a621 (87) a644 (14) a
1000287 (82) b125 (23) b
BC500134 (42) c612 (12) ab
700470 (37) b655 (16) a788 (114) a630 (54) ab
1000127 (54) c262 (76) b76 (14) c466 (54) b

