Article

Bird Assemblage Recovery in a Chronosequence of Tropical Dry Forests in Costa Rica

by
Branko Hilje
1,*,
Natalie V. Sánchez
2,
Erin M. Bayne
2 and
Arturo Sánchez-Azofeifa
3
1
Council on International Educational Exchange, Monteverde 60109, Costa Rica
2
Department of Biological Sciences, University of Alberta, Edmonton, AB T6G 2R3, Canada
3
Center for Earth Observation Sciences (CEOS), Department of Earth and Atmospheric Sciences, University of Alberta, Edmonton, AB T6G 2E3, Canada
*
Author to whom correspondence should be addressed.
Forests 2020, 11(6), 629; https://doi.org/10.3390/f11060629
Submission received: 7 April 2020 / Revised: 25 May 2020 / Accepted: 26 May 2020 / Published: 2 June 2020
(This article belongs to the Section Forest Ecology and Management)

Abstract

:
Research Highlights: While forest structure recovery in successional tropical forests is well studied, the recovery of fauna and changes in species composition and assemblage along forests succession is not well understood in many areas of the Neotropics like tropical dry forests (TDFs). Background and Objectives: To compare bird species richness and assemblage in tropical dry forests (TDFs) of different ages of recovery from cattle ranching and relate both to forest structural characteristics. Materials and Methods: To sample bird species richness and assemblage in 16 successional forest of different ages (i.e., 20, 30, 40, and 60 years old) using autonomous sound recording units in the TDFs in Costa Rica. Results: A total of 64 species of birds was detected across all forest age classes. The highest species richness was found in the 20-year-old class. Species richness decreased as canopy openness increased, suggesting low forest structural complexity and low availability of perches, nesting sites and food sources. However, bird assemblages were similar among the different forest age classes, suggesting that age itself was not a strong predictor, likely because of high variation in structure within age classes. Conclusions: TDFs can recover structural characteristics important to birds in only a few decades, supporting a rapid bird species assemblage recovery. However, this seems to depend on the starting conditions of the site prior to being recovered. Young TDFs, 20 years old, provide similar habitats for birds as 60-year-old forests do. These findings provide relevant information on the influence of TDF recovery after severe human impact on a highly threatened ecosystem.

1. Introduction

Successional forests are becoming more abundant in the tropics due to the abandonment of lands previously used for crop production and cattle ranching [1]. Economic policies toward industry and services have reduced the number of farmers in some areas. Reduced agricultural intensity is allowing some forests to recover, creating a mix of successional forests of different ages [1]. Forest structural recovery across successional stages will vary in rate and time depending on the degree of human disturbance before and during the recovery phase [2,3]. For example, disturbances that harvest trees are less likely to have as long-lasting an effect on forest structure and composition as disturbances that impact soils (e.g., agricultural conversion vs. single tree extraction) [2]. Recovery of plant species also depends on the proximity to forest patches and remnants, as well as the nature of the landscape matrix [2,4].
In general, forest structure recovers gradually during succession, which means that forests of different ages should have different structures that animal species will respond to [5]. Typically, young forests have lower basal area (BA), higher density of stems, more open canopies, even canopy heights, and lack tall trees [6,7,8,9]. On the other hand, when forests become older, larger trees become more common and the canopies show variable heights [6,7,8,9]. Consequently, the variation in forest structure observed across a gradient of forest ages should affect the richness and composition of the forest fauna [10].
While the study of forest structure post-abandonment from human disturbance is relatively common, the recovery of fauna, specifically the change in species composition across a succession (from early stages until the forests reach old growth features) is unclear in many areas of the Neotropics. Bird species assessments in successional forests have provided valuable information on the level of forest recovery [11], since birds provide information on the functioning of various ecosystem processes (e.g., pollinators, seed dispersers, and arthropod population controllers) [12]. For example, some insectivorous bird species are not able to use deforested habitats because of a lack of forest structure to disperse [13]. In general, older tropical forests provide a greater availability of sites for nesting [14], perching and roosting [15,16,17], more stable microclimatic environments (e.g., temperature and relative humidity) due to canopy closure [18,19,20], and greater food availability (e.g., arthropods) [21]. Thus, greater species richness should be expected as succession of the forest occurs because more niches become available. However, most research into bird species richness and assemblage in tropical forests succession been carried out in wet forests, with little attention to patterns in tropical dry forests (TDFs) that also hold high bird diversity [16,22,23].
This study has two main objectives: (1) to compare bird species richness and assemblage in TDFs of different ages (i.e., 20, 30, 40, and 60 years old), and (2) to establish the relationship between bird species richness, assemblage, and forest structural characteristics. This study was conducted using autonomous recording units (ARUs) to estimate bird species richness and assemblage in successional forests, and remote sensing techniques to assess forest age and structural characteristics. Based on forest recovery evidence reported in the literature and its relationship with bird responses, bird species richness is expected to increase as forest structure becomes more complex along a successional gradient. Older successional forests will provide a higher structural complexity (e.g., nesting sites, breeding and roosting perches, and protection from predators) than young successional forests [11,14,23,24]. Additionally, the biggest difference in bird assemblage is expected between the early (20 years) and late forest ages (60 year) as the early stages are expected to have the least complex forest structure. This study provides evidence of forest recovery and its effects on the local avifauna after severe human impacts in the dry forest, a highly threatened habitat in the Neotropics.

2. Materials and Methods
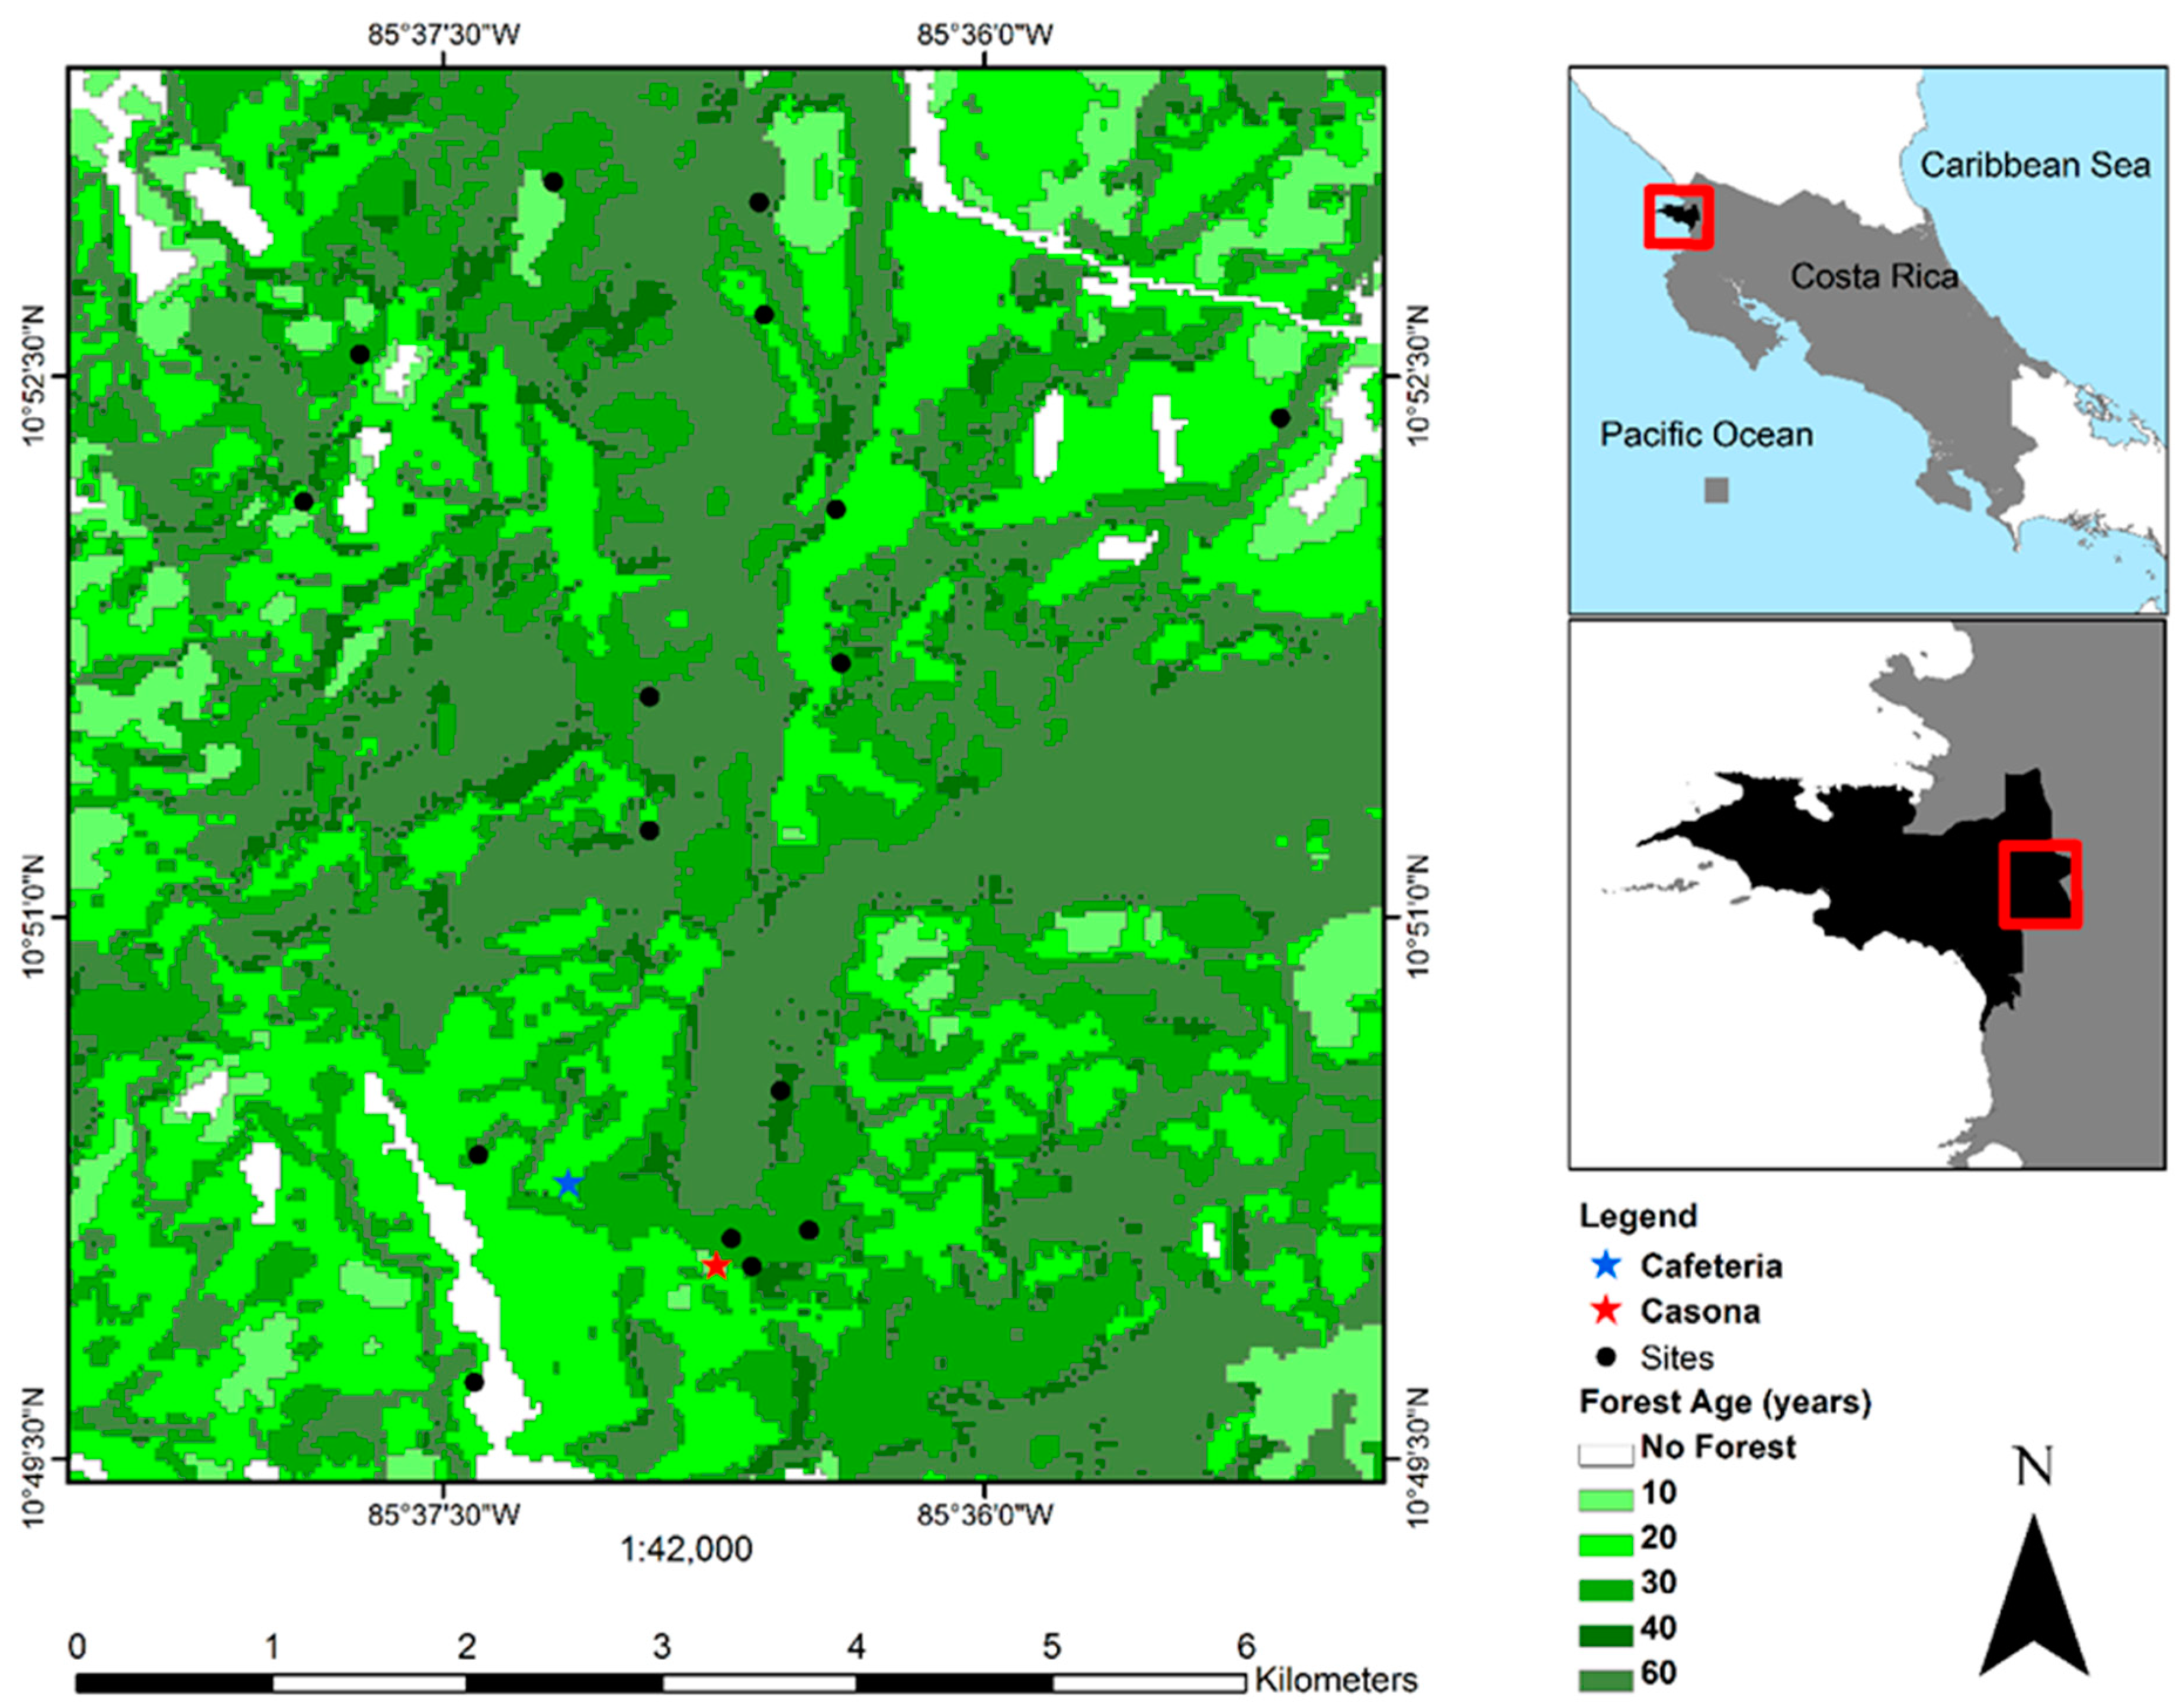
2.1. Study Site

This study was carried out in the Área de Conservación Guanacaste (ACG), which contains more dry forest than any other protected area in Central America. Specifically, the study was carried out in Sector Santa Rosa (SSR), located in the province of Guanacaste, Costa Rica (10°48′53″ N & 85°36′54″ W) (Figure 1). The SSR covers an area of 390 km2, and the climate has a dry season of six months (December–May) with a mean annual precipitation of 1700 mm and a mean annual temperature of 25 °C [25]. The SSR current land cover is a mixture of forest successional stages that recovered from intense deforestation in the past 200 years due to human activities such as pasturelands for cattle ranching [26]. Current secondary forests are dominated by insect-pollinated and wind-dispersed tree species [27]. The SSR has a very heterogeneous forest that holds a high diversity of habitats and biotic communities [28].

2.2. Dry Forest Structural Characteristics and Forest Age

Sixteen forest sites at different ages of successional recovery were selected. Each site consists of a point located within a forest of a particular age. The sites were located in an area of 40 km2, where the largest section of continuous forests is found at the SSR. This is a flat area where bird acoustic data collection is not affected by hills, edges, and canyons, and this is also the area where the most intensive cattle ranching activities occurred in the past within SSR. Forests were categorized in age classes of 20 (four sites), 30 (four sites), 40 (five sites), and 60 (three sites) years old on the basis of the date on which they were detected and, therefore, considered forests (i.e., 10 years old) in aerial photographs and satellite images [29]. The minimum area of a forest was 0.2 ha and the maximum area was 432 ha. The minimum distance between the two closest sites was 250 m and the maximum distance was 6000 m (Figure 1). However, these two sites were within the same age class. Aside from these sites, 500 m is the minimum distance between two other sites. Forests were further characterized using forest structural characteristics previously measured in standardized 0.1-ha radial plots in each site based on Gentry’s dataset [29,30]. These included the percentage of canopy openness (CO) extracted from hemispherical photos; the plant area index (PAI) which is the area of foliage and wood (i.e., stems, twigs, lianas) present in a hemispherical photo; canopy height (CH) measured with a terrestrial laser scanner; tree basal area (BA) calculated from measurements of tree diameter at breast height (DBH) for all the trees observed in each plot (>5 cm of DBH); and the liana-to-tree ratio (LR) (i.e., the total number of lianas in a plot divided by the total number of trees) [29]. A vegetation greenness index was used to collect information on the presence of green leaves on trees surrounding each site (i.e., the Normalized Difference Vegetation Index (NDVI)). NDVI values were extracted from satellite images from MODIS collection 6 MOD13Q1 and MYD13Q1 from the Aqua (AM collection) and Terra (PM collection) instruments, respectively, which overpassed the SSR [31]. The spatial resolution for NDVI product is 250 m. NDVI values were collected in each site encompassed in a unique pixel for the same dates where the acoustic data collection was carried out.

2.3. Acoustic Data Collection

2.3.1. Acoustic Detection Extent

Autonomous recording units (ARUs) (SM3 Songmeters) [32] were used for bird sound data collection. The recording distance for ARUs in forests from different ages was established by performing a sound attenuation experiment. Six 90-m length transects were established in each of three age classes: early (i.e., 20–30 years old), intermediate (i.e., 30–40 years old), and late (>60 years old) at SSR [27]. We established this distance based on a test showing that playbacks at a 120-m distance from the sound source were completely attenuated. At the beginning of each transect, a low-frequency call (i.e., 900–1600 Hz) from a Thicket Tinamou (Crypturellus cinnamomeus, Tinamidae) was played back and recorded by ARUs located at 30 m, 60 m, and 90 m along the transect. Both the sound source and the recorders were placed at 1.5 m height. The sound pressure level (SPL) of the playback was set up at 100.1 decibels at 1 m from the sound source. This SPL is within the normal range for several bird species calls [33]. A low-frequency bird call was selected since low-frequency sounds with long wavelengths transmit better than high-frequency sounds in forests [34,35]. This will provide information about the distance ARUs can record bird sounds, but also to establish the proper distance between ARUs to avoid recording the same birds. Raven Pro 1.5 was used to determine SPL from oscillograms extracted from the playbacks recorded at different distances from the sound source [36].
The SPL from the playback decreased as the distance increased from the sound source, following the inverse distance law equation [37]: (Excess)SPL = (SPL1 − SPLi) − [20 × Log 10 (di/1)], where SPL1 is the SPL of the playback measured at 1 m used as a reference value, SPLi is the SPL recorded and measured at four distances from the sound source (i.e., 30 m, 60 m, and 90 m), and d is the distance in meters to the sound source (Figure 2). The sound attenuation showed a similar pattern for the three forest age classes, having close SPL values at 90 m that ranged from 50.1–53.9 dB. Based on these observations and in results from an initial test, ARUs are not able to collect sounds from birds calling at a 120-m radius in TDFs of the age classes analyzed. Since sound attenuation is similar among age classes, the probability of recording sounds from a bird is the same for the different classes. Lastly, ARUs should be deployed at least 120 m apart from each other to avoid recording the sounds from the same individual bird.

2.3.2. Bird Acoustic Data Collection and Analysis

An ARU was deployed in each exact site where forest structural characteristics were previously measured by Sánchez-Azofeifa et al. [29] to obtain information on forest structure to relate to bird species richness. Based on this, some of the sampling sites were not located in the center of each forest age patch (Figure 1). The ARUs were deployed for three consecutive days in May 2017, which is during the breeding period for most TDF bird species [38]. This sampling design is widely used in bird species surveys to collect reliable data on species presence for occupancy modelling analysis [39,40]. It also allows for similar meteorological conditions and, therefore, the same plant phenological characteristics that are considered important forest structural characteristics as resources for birds, when sampling. Migrant species from North America are not expected in recordings by this time of the year. ARUs recorded for one full minute every 10 min during the peak period of avian acoustic activity at the SSR (05:30–06:40 h) [41]. The file format used for recording was “wav” at 16 bits per file, with a minimum noise gain of −88 decibels (dB), and a sampling rate of 44.1 kHz. Recordings from 05:30–06:40 h were selected for three consecutive days and listened to in order to determine the species present at each site for this period. The software Songscope [32] was used for both aural and sound bird species identifications from spectrograms. Eight one-minute-long recordings per day for three consecutive days were analyzed per forest site for a total of 384 min for the whole study area. Wind and rainfall were not present in recording files.

2.4. Data Analysis

A Linear Discriminant Analysis (LDA) was performed to determine which forest structural characteristics best described forest based on age classes [42]. A permutational multivariate analysis of variance (PERMANOVA) test with 999 permutations was subsequently performed to determine differences in forest structural characteristics between the age classes. Both analyses were performed using MASS [43] and vegan [44] packages from R statistical software version 3.6.1 [45].
Bird species richness variation explained by forest structural characteristics and the area of each of the 16 sites was analyzed using Generalized Linear Mixed Models (GLMM), using a Poisson error family and forest site as a random factor [46]. We log-transformed the forest structural characteristics to improve normality of the residuals and models’ prediction. The best model was determined using the Akaike information criterion for small samples size (AICc) [47]. The best model was the one with the highest AICc weight (wi) and the lowest ΔAICc value [48,49]. If the ΔAICc value between the best model and the next best model was less than two units, we averaged the two models for parameter estimation [50]. We used R statistical software version 3.6.1 [45] for all statistical analyses. In addition, we performed accumulation species curves for each age class.
To compare species assemblages in forests with different ages, we performed a Nonmetric Multidimensional Scaling (NMDS), using the R package “vegan” [44]. A Bray–Curtis dissimilarity matrix was used for this test. We plotted the NMDS scores for two dimensions and added 95% CI ordiellipses.

3. Results

3.1. Dry Forest Structural Characteristics and Forest Age

Results from the LDA showed that forest structural characteristics were similar between forest ages (F(3,5) = 0.71, p > 0.05). Higher values of NDVI, PAI, and BA were observed in older forests (60 years), higher CH in forests 40 years old, and the highest CO in forests 20 years old (Figure 3). Therefore, the forest age classes evaluated were not completely distinct and had a similarity in forest structural characteristics, suggesting high variation within each class for the variables measured (Table 1). From the LDA, the first axis explains 74.5% of the total variance between forest age for the structural characteristics evaluated, while the second axis explained 21.5%. Since age classes are not distinct, age was not included in the GLMM analysis.

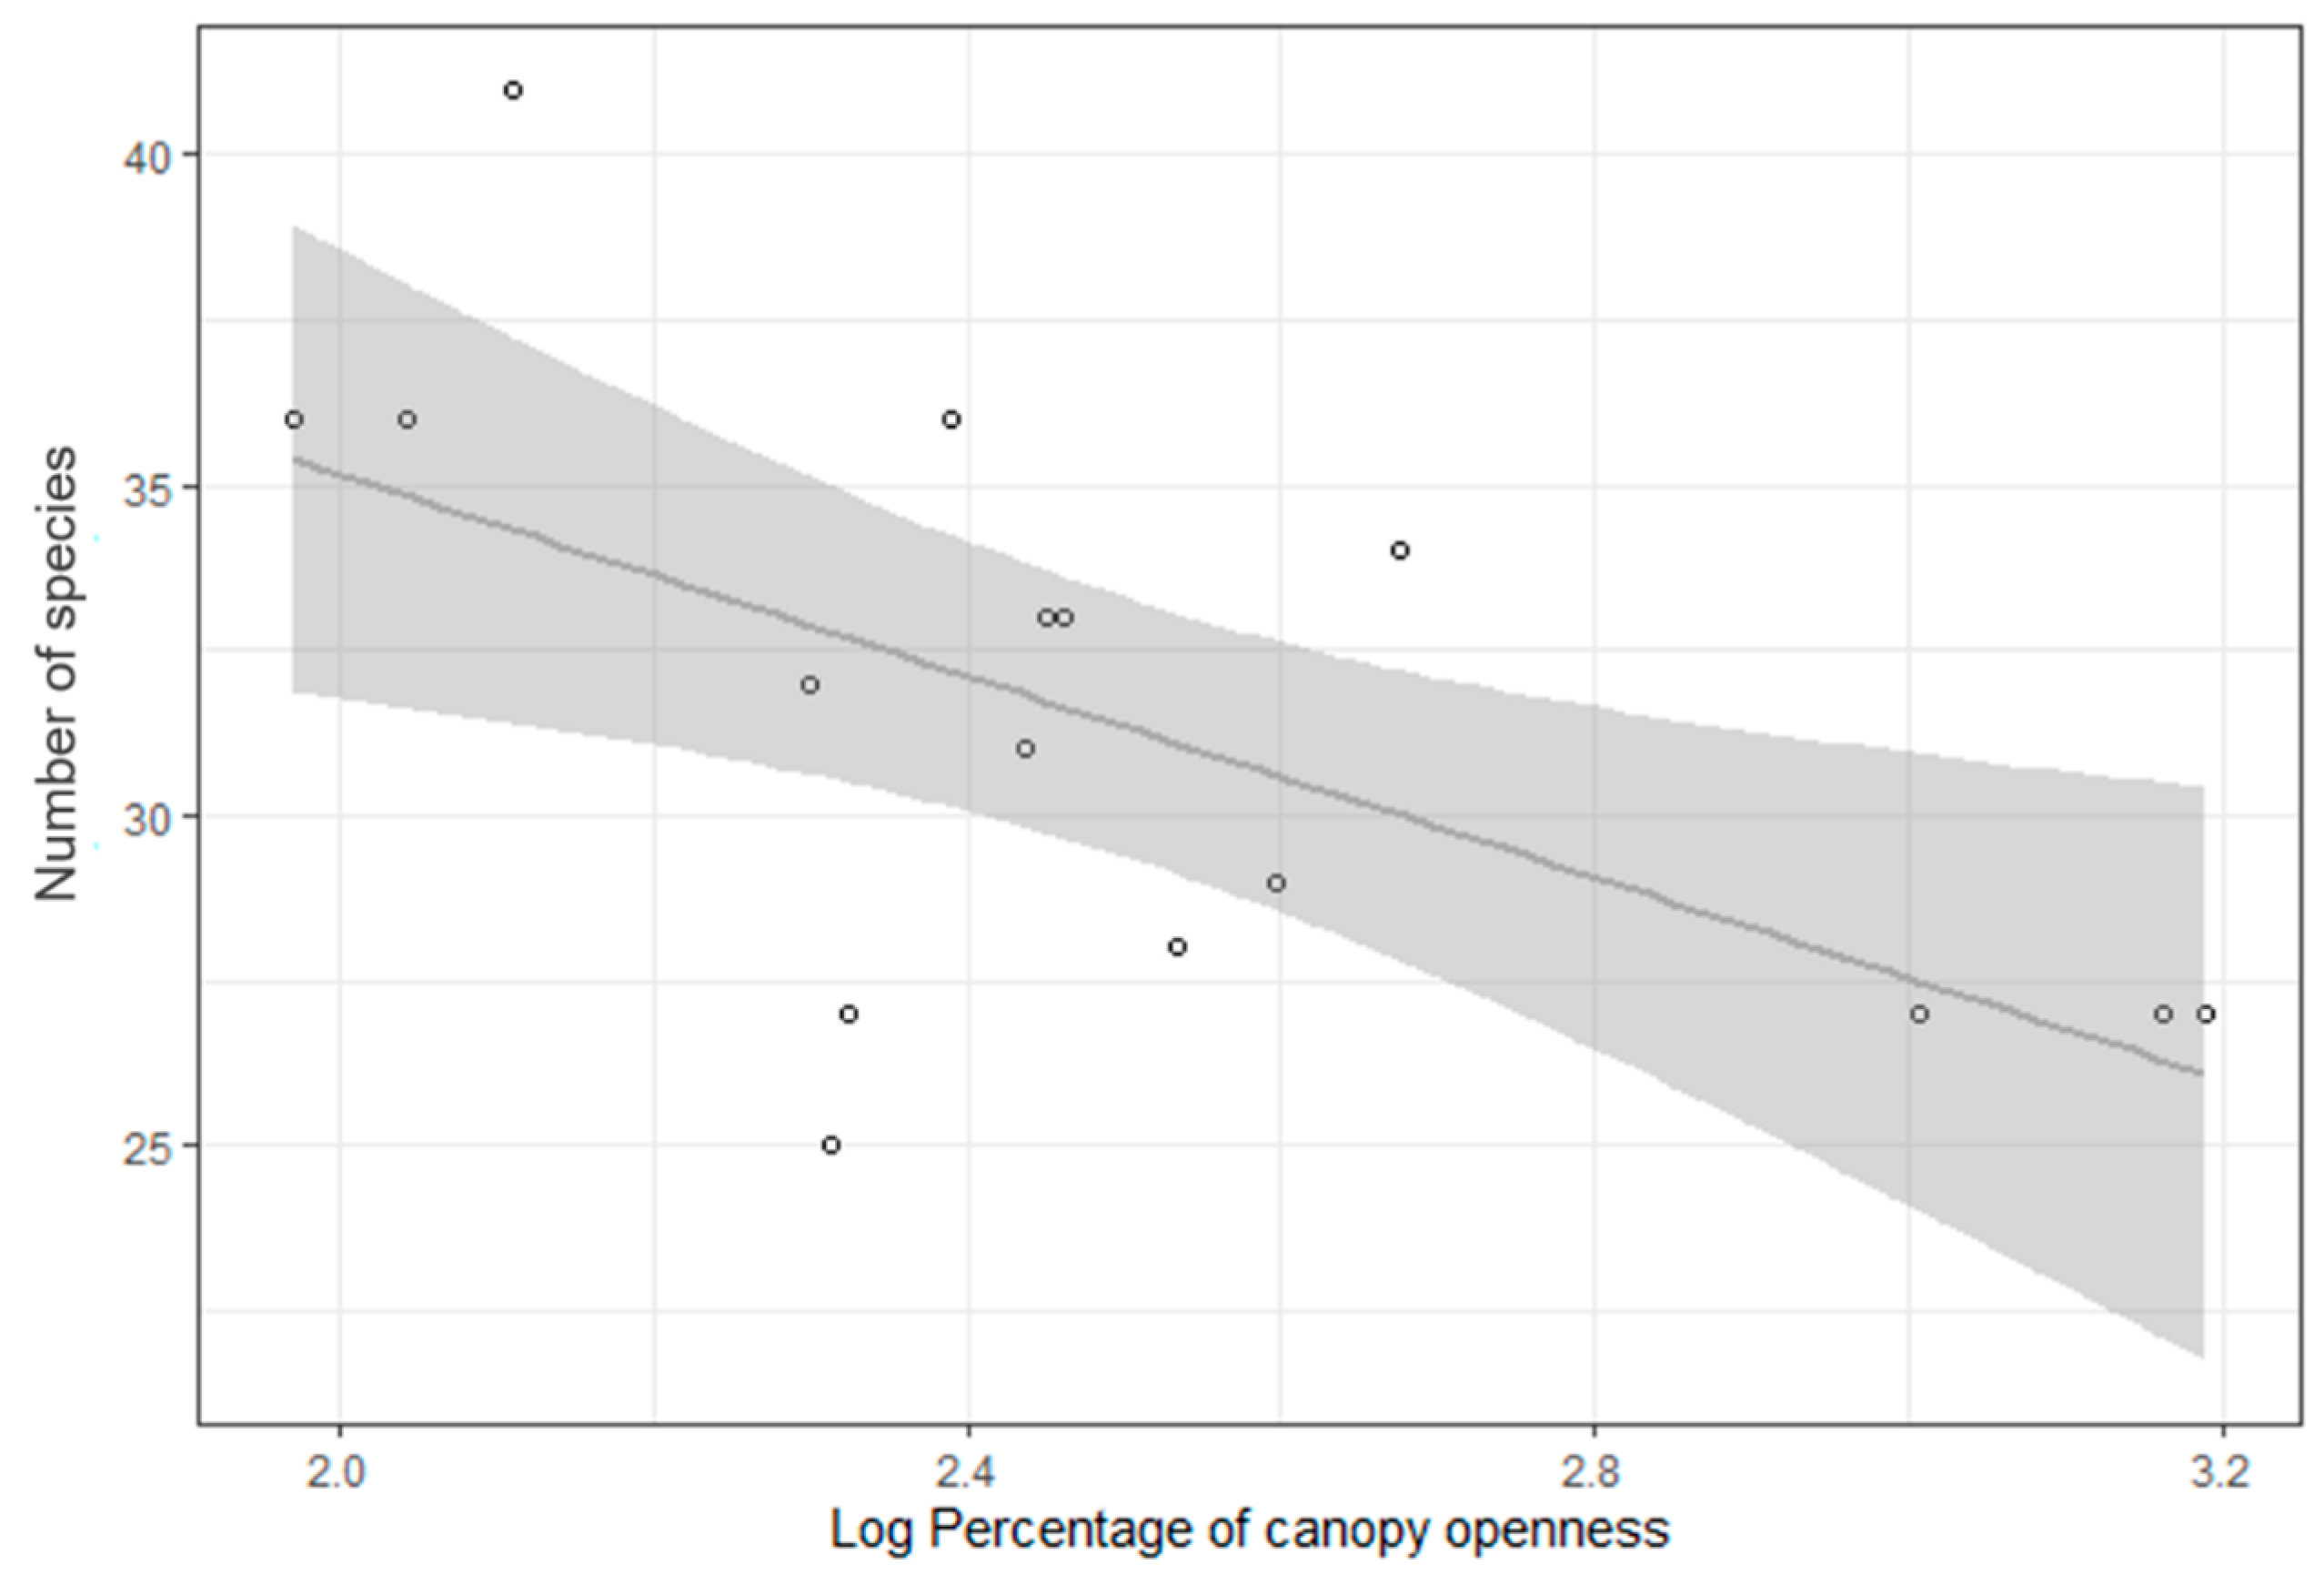
3.2. Bird Species Richness and Forest Age and Structural Characteristics

A total of 64 species of bird were detected in the recordings from all forest age classes, with a range of 25–41 species at each site (Table 2). This represents 60% of the total bird species that communicate by sound in the forests at SSR (i.e., 110 species) [38]. In addition, 41 passerine species were detected, corresponding to 79% of the passerine species reported for the SSR forests (i.e., 52 species) [38,51]. Half of the total species detected were shared among the four age classes (Table 2).
Forests aged 20 years had the highest species richness (56 species), followed by the 40 years class (52 species), 30 years (48 species), and 60 years (44 species). The only age class that reached the asymptote when analyzing species accumulation curves was 20 years (Figure 4).
When evaluating species richness at a finer scale by regressing forest structural characteristics (i.e., BA, PAI, CO, CH, LR, and NDVI) and the area of the sites within each age class against bird richness for each site using GLMM, CO explained 50% of the variation associated with bird species richness (AICc wi = 0.498; Table 3, Figure 5). As CO increased in forests, the number of bird species decreased (Figure 5). The other forest structural characteristics, such as LAI, BA, CH, NDVI, liana ratio, and forest site area, were not important predictors of bird species richness (Table 3). None of the models, including additive effects or interactions, were important to explain variation in species richness (Table 3).

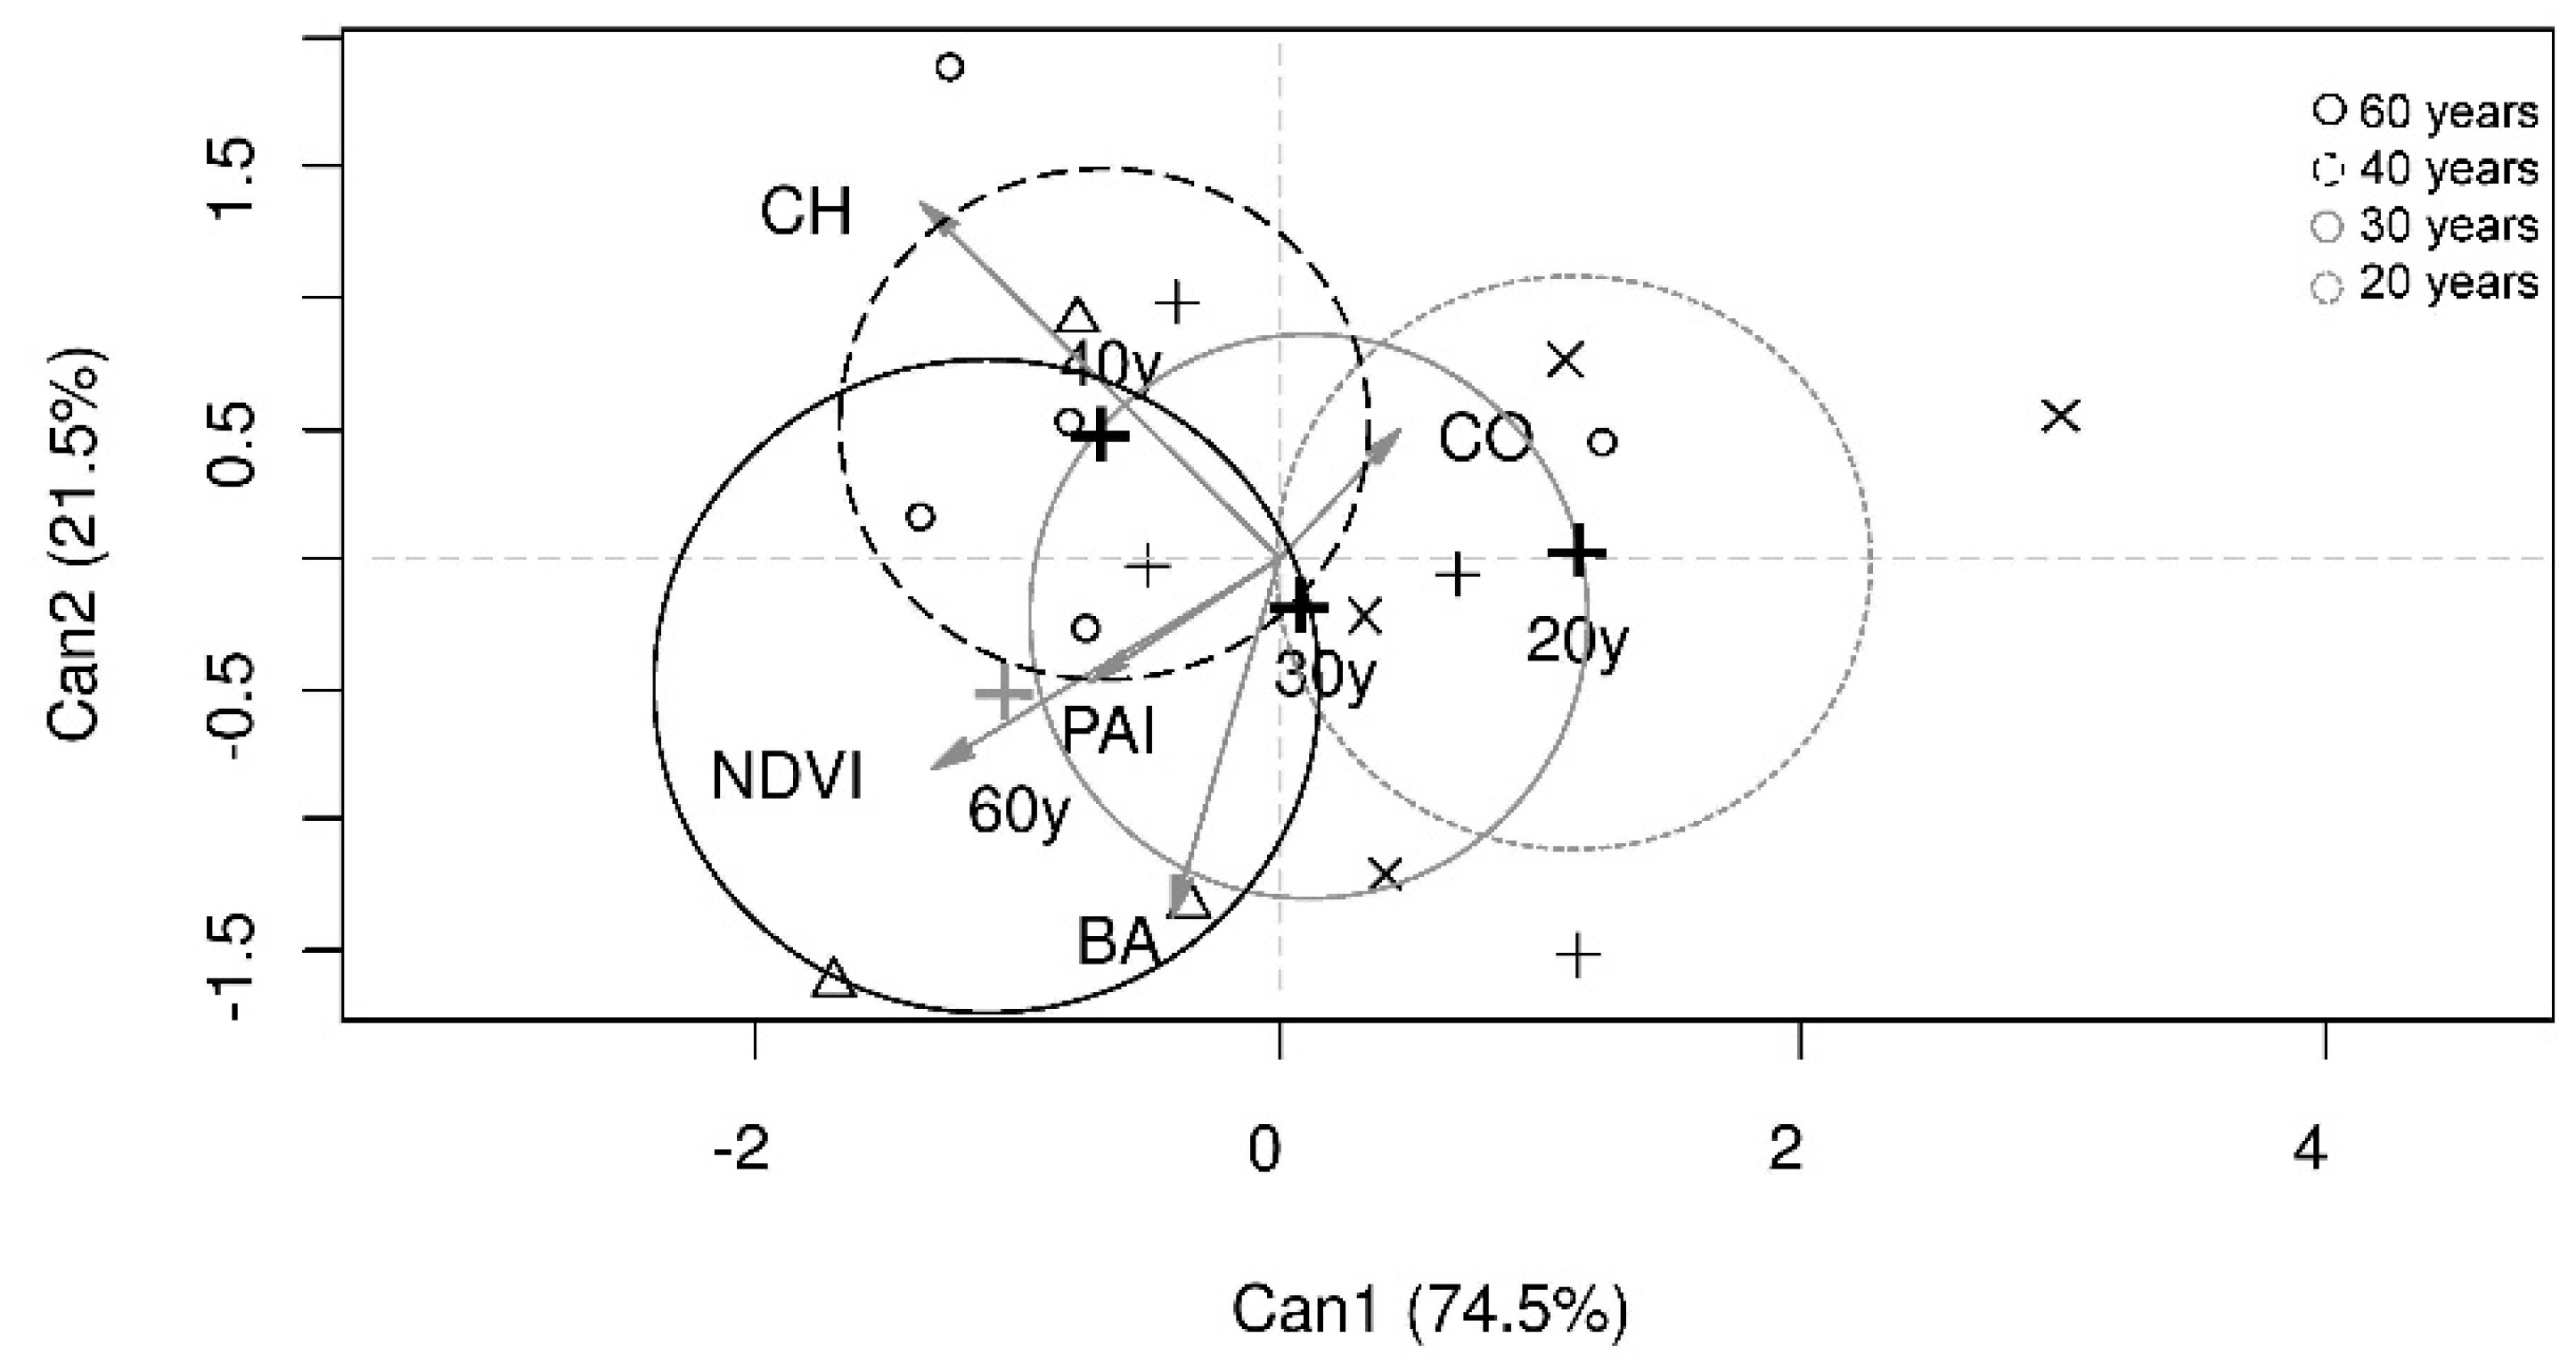
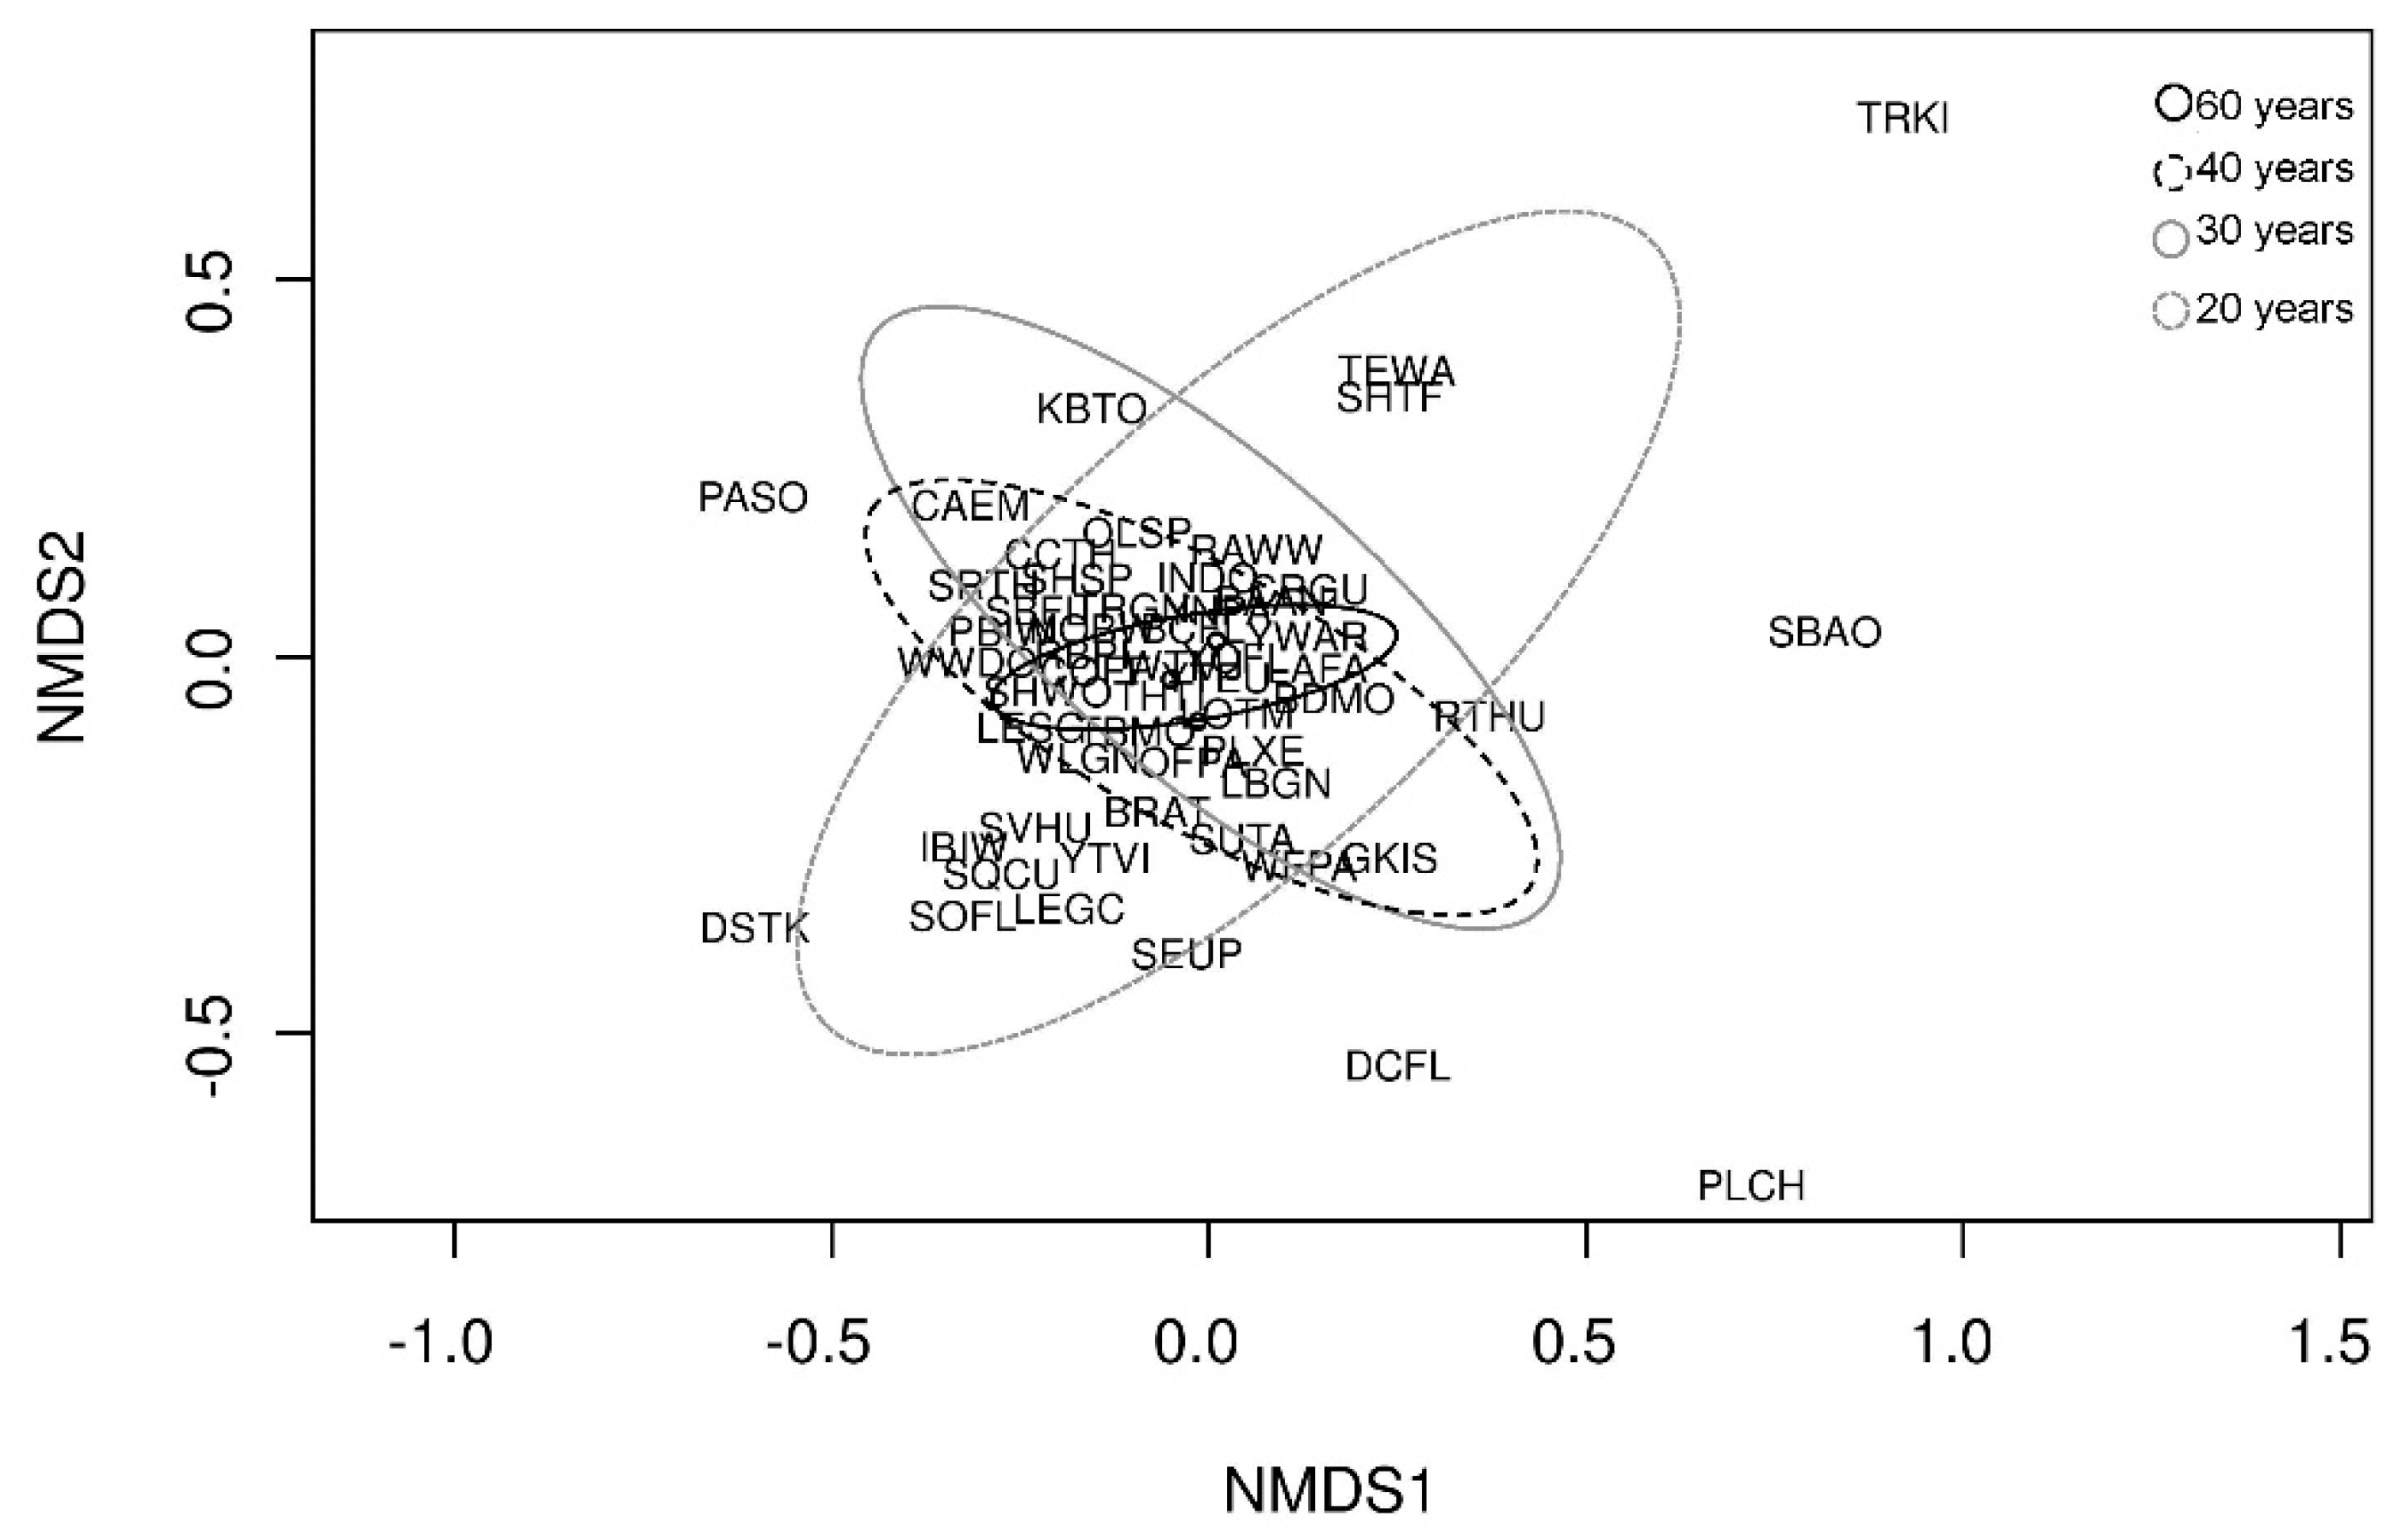
3.3. Bird Species Assemblage and Forest Age Class

Forest age was not a force driving bird species assemblage; instead, we observed a high overlap of species among different age classes (Figure 6). Several species that were present in young forests were also present in older successional stages (Figure 6). Still, some species showed a preference for a particular age class. For example, Oreothlypis peregrina (Wilson) (Tennessee warbler) was absent in old-growth forest (60 years) and Tyrannus melancholicus (Vieillot) (tropical kingbird) was only present in young forests (20 years). Four bird species only occurred in older secondary forests such as Micrastur semitorquatus (Vieillot) (collared forest-falcon) and Amazilia saucerrottei (Delattre & Bourcier) (steely-vented hummingbird) in 40–60-year-old forest sites, Ortalis vetula (Wagler) (plain chachalaca) in 40 year old sites, and Myiodynastes luteiventris (Sclater) (sulphur-bellied flycatcher) in 60 year old sites.

4. Discussion

4.1. Dry Forest Structural Characteristics and Forest Age

Similar structural characteristics were found among the different forest age classes, indicating high variation in structure within forests of a similar age. Similarities in forest structure among forests age classes could be for two reasons. First, forest regeneration processes at the SSR may not be a deterministic phenomenon, and they showed a continuous re-growth instead [52]. As a result, a continuous transition is observed between age classes in a successional gradient. The intensity of cattle ranching can influence the successional process and the forest recovery [2,3]. Hence, forest recovery for sites under intense cattle ranching in the past can take longer than forests with moderate use. However, young forests of 20 years old tend to have sites with more open canopies, and the oldest age class of 60 years tend to have closed canopies and high values of NDVI and PAI (Figure 3). Second, tree phenology and the presence of leaves on trees as the proportion of deciduous trees decreases when TDFs become older [25]. Since this study was conducted during the peak of leafing intensity, where trees have full leaves at the SSR [53], values of PAI and NDVI were high. Consequently, clearer differences in PAI and NDVI values among forest classes may not be as noticeable during this time of the year as they are observed during the peak of deciduousness, particularly between young and old age classes. In addition, since this study addressed for differences in forest structural characteristics among forests that have recovered from cattle ranching, the number of forest sites per class was limited (i.e., small sample size) to a section of SSR where this activity intensively occurred in the past.

4.2. Bird Species Richness and Forest Age and Structural Characteristics

Avian species richness was expected to increase as stands aged [11,14,23,24], since older forests offer a higher forest structural complexity to birds that would support more species. Instead, results showed that 20-year-old forests had the highest richness. Since forest age classes were poorly described by forest structure, 20-year-old stands presumably provide at least some of the resources needed by most species of birds. On the other hand, the species richness accumulation curve for this age class was the only one reaching an asymptote, suggesting that more bird species could be detected in the other age classes.
When analyzing avian species richness and forest structure, a negative relationship was established between CO and bird species richness. High values of CO indicate forest sites with larger open canopies, and, therefore, with a low forest structural complexity (e.g., fewer or none nesting sites, breeding and roosting perches). We argue this translates into little or no availability of stems, twigs, and branches that birds use as perches, nesting and roosting sites, and structure for protection [54]. In addition, open habitats tend to have a lower richness and abundance of prey (e.g., arthropods), an important food source for insectivore species that inhabit the understory, than more structurally complex TDFs along a succession [55,56]. However, forest sites with open canopies were observed in each age class, indicating that openness is not necessarily driven by age.

4.3. Bird Assemblage, Forest Age and Forest Structural Characteristics

Although noticeable differences in bird assemblage between forests 20 and 60 years old were expected due to bird species that specialize in conditions with different structural complexity, our results did not show this. The bird assemblage was similar among the different forest age classes, indicating that none of the classes host a specific assemblage of birds. The high variability in forest structural characteristics within each age class has contributed to increase the variance, causing an overlap in structure between ages that may have contributed to the similarity between ages in bird assemblage. Thus, using age to understand biodiversity recovery in TDFs may not be the best approach. Bird habitat models used in much of North America for forestry planning often utilize age as a key predictor for understanding changes in bird populations caused by different land-use strategies. Our results suggest this approach should be used cautiously in TDFs where the sources of human disturbance are quite different. This finding also suggests that young forests of 20 years old have reached similar species composition to 60-year-old forests at the SSR. This can be explained by both the proximity to and the transition between ages classes that allow birds to move easily between differently aged forest patches to look for different resources (e.g., perches, nesting sites, and food) [13,52]. Even though some species were associated with forests of a specific age, it is difficult to determine whether there is a real preference for these, since forests of different ages have quite similar structures that vary significantly within and between forests of the same age. However, given the limitations of the sampling design, such as a limited number of forest sites, the proximity between some sites, and to some sampling sites not located in the center of each forest age patch, these results should be taken with caution.

5. Conclusions

TDFs can recover forest structural characteristics in a few decades, a similar pattern shown by other forests in the tropics, such as wet forests [6,56,57,58]. TDFs bird species assemblage recovery showed a similar pattern found for tropical wet forests, where several studies reported similar bird assemblages between 20–40 years old forests and older secondary forests [59]. Forest structural recovery is key for fauna recovery, and this study found that 20-year-old TDFs provide equally suitable habitat for birds as 60-year-old forests, suggesting a rapid recovery of bird species assemblage. The structural characteristics of forests are similar across all forest ages, suggesting that forests of all ages are an important source of perches for roosting and mating displays, material for nesting, and a direct or indirect source of food. Having a similar forest structure among age classes is critical to achieving similar species composition. This study provides key information on the influence of TDF recovery after severe human impact on the local avifauna. This is relevant information for a highly threatened habitat that should be considered in bird conservation efforts for neotropical dry forests.

Author Contributions

Conceptualization, B.H. and A.S.-A.; Methodology, B.H., N.V.S.; Validation, B.H., N.V.S., E.M.B. and A.S.-A.; Formal Analysis, B.H. and N.V.S.; Investigation, B.H. and N.V.S.; Writing—Original Draft Preparation, B.H.; Writing—Review and Editing, B.H., N.V.S., E.M.B. and A.S.-A.; Funding Acquisition, B.H. and A.S.-A. All authors have read and agreed to the published version of the manuscript.

Funding

This research was funded by the National Science and Engineering Research Council of Canada (NSERC). This work was part of the research project TROPI-DRY (Human, Ecological and Biophysical Dimensions of Tropical Dry Forests), which is a collaborative research network funded by the Inter-American Institute for Global Change Research (IAI) Collaborative Research Network Program (CRN3-025) and supported by the US National Science Foundation (grant GEO 0452325). B.H. was funded by Ministerio de Ciencia, Tecnología y Telecomunicaciones (MICITT) Costa Rica, and Consejo Nacional para Investigaciones Científicas y Tecnológicas (CONICIT) Costa Rica. N.V.S. was funded by McAfee Estate Scholarship in Zoology.

Acknowledgments

We thank three anonymous reviewers for comments and suggestions that greatly improved the manuscript. We thank Wendy Boone for her comments on the manuscript and language editing. We thank the personnel from SSR at ACG, the Center for Earth Observation Sciences (CEOS), Department of Earth and Atmospheric Sciences, University of Alberta, and the University of Alberta for logistical support.

Conflicts of Interest

The authors declare no conflicts of interest.

References

  1. Aide, T.M.; Clark, M.L.; Grau, H.R.; López-Carr, D.; Levy, M.A.; Redo, D.; Bonilla-Moheno, M.; Riner, G.; Andrade-Núñez, M.J.; Muñiz, M. Deforestation and Reforestation of Latin America and the Caribbean (2001–2010). Biotropica 2013, 45, 262–271. [Google Scholar] [CrossRef]
  2. Chazdon, R. Tropical forest recovery: Legacies of human impact and natural disturbances. Perspect. Plant Ecol. Evol. Syst. 2003, 6, 51–71. [Google Scholar] [CrossRef] [Green Version]
  3. Crouzeilles, R.; Curran, M.; Ferreira, M.S.; Lindenmayer, D.; Grelle, C.E.V.; Benayas, J.M.R. A global meta-analysis on the ecological drivers of forest restoration success. Nat. Commun. 2016, 7, 11666. [Google Scholar] [CrossRef] [PubMed]
  4. Boukili, V.K.; Chazdon, R. Environmental filtering, local site factors and landscape context drive changes in functional trait composition during tropical forest succession. Perspect. Plant Ecol. Evol. Syst. 2017, 24, 37–47. [Google Scholar] [CrossRef]
  5. Finegan, B. Pattern and process in neotropical secondary rain forests: The first 100 years of succession. Trends Ecol. Evol. 1996, 11, 119–124. [Google Scholar] [CrossRef]
  6. Aide, T.M.; Zimmerman, J.K.; Rosario, M.; Marcano, H. Forest Recovery in Abandoned Cattle Pastures Along an Elevational Gradient in Northeastern Puerto Rico. Biotropica 1996, 28, 537. [Google Scholar] [CrossRef]
  7. Clark, D.B. Abolishing virginity. J. Trop. Ecol. 1996, 12, 735–739. [Google Scholar] [CrossRef]
  8. Guariguata, M.R.; Chazdon, R.; Denslow, J.S.; Dupuy, J.M.; Anderson, L. Structure and floristics of secondary and old-growth forest stands in lowland Costa Rica. Plant Ecol. 1997, 132, 107–120. [Google Scholar] [CrossRef]
  9. Montgomery, R.A.; Chazdon, R.L. Forest structure, canopy architecture, and light transmittance in tropical wet forests. Ecology 2001, 82, 2707–2718. [Google Scholar] [CrossRef]
  10. Wiens, J.A. The Ecology of Bird Communities. Ecol. Bird Communities 1989, 1, 340. [Google Scholar]
  11. Acevedo-Charry, O.; Aide, T.M. Recovery of amphibian, reptile, bird, and mammal diversity during secondary forest succession in the tropics. Oikos 2019, 128, 1065–1078. [Google Scholar] [CrossRef] [Green Version]
  12. Şekercioğlu-Çağan, H.; Daily, G.C.; Ehrlich, P.R. Ecosystem consequences of bird declines. Proc. Natl. Acad. Sci. USA 2004, 101, 18042–18047. [Google Scholar] [CrossRef] [PubMed] [Green Version]
  13. Şekercioğlu-Çağan, H.; Ehrlich, P.R.; Daily, G.C.; Aygen, D.; Goehring, D.; Sandí, R.F.; Şekercioḡlu, Çaḡan H. Disappearance of insectivorous birds from tropical forest fragments. Proc. Natl. Acad. Sci. USA 2002, 99, 263–267. [Google Scholar] [CrossRef] [PubMed] [Green Version]
  14. Thompson, F.R., III; Probst, J.R.; Raphael, M.G. Impacts of silviculture: Overview and management. In Ecology and Management of Neotropical Migratory Birds: A Synthesis and Review of Critical Issues; Martin, T.E., Finch, D.M., Eds.; Oxford University Press: New York, NY, USA, 1995; pp. 201–219. [Google Scholar]
  15. McClanahan, T.R.; Wolfe, R. Accelerating Forest Succession in a Fragmented Landscape: The Role of Birds and Perches. Conserv. Boil. 1993, 7, 279–288. [Google Scholar] [CrossRef]
  16. Barlow, J.; Gardner, T.A.; Araujo, I.S.; Avila-Pires, T.C.; Bonaldo, A.B.; Costa, J.E.; Esposito, M.C.; Ferreira, L.V.; Hawes, J.; Hernández, M.I.M.; et al. Quantifying the biodiversity value of tropical primary, secondary, and plantation forests. Proc. Natl. Acad. Sci. USA 2007, 104, 18555–18560. [Google Scholar] [CrossRef] [Green Version]
  17. Michel, N.L.; Robinson, W.D.; Sherry, T.W. Liana-bird relationships: A review. In Ecology of Lianas; Wiley: Hoboken, NJ, USA, 2014; pp. 362–397. [Google Scholar]
  18. Muscolo, A.; Bagnato, S.; Sidari, M.; Mercurio, R. A review of the roles of forest canopy gaps. J. For. Res. 2014, 25, 725–736. [Google Scholar] [CrossRef]
  19. Fetcher, N.; Oberbauer, S.F.; Strain, B.R. Vegetation effects on microclimate in lowland tropical forest in Costa Rica. Int. J. Biometeorol. 1985, 29, 145–155. [Google Scholar] [CrossRef]
  20. Laurance, W.F.; Bierregaard, R.O. Tropical Forest Remnants: Ecology, Management, and Conservation of Fragmented Communitie; University of Chicago Press: Chicago, IL, USA, 1997; p. 616. [Google Scholar]
  21. Kato, M.; Inoue, T.; Hamid, A.A.; Nagamitsu, T.; Merdek, M.B.; Nona, A.R.; Itino, T.; Yamane, S.; Yumoto, T. Seasonality and vertical structure of ligh-attracted insect communities in a dipterocarp forest in Sarawak. Popul. Ecol. 1995, 37, 59–79. [Google Scholar] [CrossRef]
  22. Andrade, G.I.; Rubio-Torgler, H. Sustainable Use of the Tropical Rain Forest: Evidence from the Avifauna in a Shifting?Cultivation Habitat Mosaic in the Colombian Amazon. Conserv. Boil. 1994, 8, 545–554. [Google Scholar] [CrossRef]
  23. Bu, W.; Zang, R.; Ding, Y. Functional diversity increases with species diversity along successional gradient in a secondary tropical lowland rainforest. Trop. Ecol. 2014, 55, 393–401. [Google Scholar]
  24. Santamaria-Rivero, W.; Leyequien, E.; Hernandez-Stefanoni, J.L.; Wood, P. Influence of landscape structure and forest age on the richness and abundance of different bird feeding guilds and forest-dependent birds in a seasonal dry tropical forest of Yucatan, Mexico. Trop. Ecol. 2016, 57, 313–332. [Google Scholar]
  25. Kalacska, M.; Sanchez-Azofeifa, G.; Calvo-Alvarado, J.C.; Quesada, M.; Rivard, B.; Janzen, D.; Sánchez-Azofeifa, G.A. Species composition, similarity, and diversity in three successional stages of a seasonally dry tropical forest. For. Ecol. Manag. 2004, 200, 227–247. [Google Scholar] [CrossRef]
  26. Janzen, D.H. Management of Habitat Fragments in a Tropical Dry Forest: Growth. Ann. Mo. Bot. Gard. 1988, 75, 105. [Google Scholar] [CrossRef]
  27. Hilje, B.; Calvo-Alvarado, J.C.; Jiménez-Rodríguez, C.D.; Sánchez-Azofeifa, G.A. Tree Species Composition, Breeding Systems, and Pollination and Dispersal Syndromes in Three Forest Successional Stages in a Tropical Dry Forest in Mesoamerica. Trop. Conserv. Sci. 2015, 8, 76–94. [Google Scholar] [CrossRef]
  28. Janzen, D.H. Costa Rican Natural History; University of Chicago Press: Chicago, IL, USA, 1983; p. 823. [Google Scholar]
  29. Sánchez-Azofeifa, G.A.; Vega-Araya, M.; Campos-Vargas, C.; Durán, S.M.; Gianoli, T.; Portillo-Quintero, C.; Sharp, I.; D’Souza, N. Can terrestrial laser scanners (TLSs) and hemispherical photographs predict tropical dry forest succession with liana abundance? Biogeosciences 2017, 14, 977–988. [Google Scholar] [CrossRef] [Green Version]
  30. Phillips, O.; Miller, J.S. Global Patterns of Plant Diversity: Alwyn H. Gentry’s Forest Transect Data Set; Missouri Botanical Press: St. Louis, MO, USA, 2002; p. 319. [Google Scholar]
  31. Ornl Daac. Modis Collection 6 Land Products Global Subsetting and Visualization Tool. Available online: https://daac.ornl.gov/LAND_VAL/guides/MODIS_Global_C6.html/ (accessed on 25 October 2018).
  32. Wildlife Acoustics. Songscope: Bioacoustics Software, Version 4.0; Wildlife Acoustics Inc.: Maynard, MA, USA, 2011; p. 44. [Google Scholar]
  33. Brackenbury, J.H. Power capabilities of the avian sound-producing system. J. Exp. Biol. 1979, 78, 163–166. [Google Scholar]
  34. Nicholls, J.A.; Goldizen, A. Habitat type and density influence vocal signal design in satin bowerbirds. J. Anim. Ecol. 2006, 75, 549–558. [Google Scholar] [CrossRef]
  35. Swearingen, M.E.; White, M.J.; Guertin, P.J.; Albert, D.G.; Tunick, A. Influence of a forest edge on acoustical propagation: Experimental results. J. Acoust. Soc. Am. 2013, 133, 2566–2575. [Google Scholar] [CrossRef]
  36. Center for Conservation Bioacoustics. Raven Pro: Interactive Sound Analysis Software (Version 1.5) [Computer software]. The Cornell Lab of Ornithology. Available online: http://ravensoundsoftware.com/ (accessed on 11 May 2018).
  37. Berg, R.E. The Physics of Sound. Am. J. Phys. 1982, 50, 953. [Google Scholar] [CrossRef]
  38. Barrantes, G.; Ocampo, D.; Ramírez-Fernández, J.D.; Fuchs, E.J. Effect of fragmentation on the Costa Rican dry forest avifauna. Peer J. 2016, 4, 2422. [Google Scholar] [CrossRef] [Green Version]
  39. Ruiz-Gutiérrez, V.; Zipkin, E.F.; Dhondt, A.A. Occupancy dynamics in a tropical bird community: Unexpectedly high forest use by birds classified as non-forest species. J. Appl. Ecol. 2010, 47, 621–630. [Google Scholar] [CrossRef]
  40. Furnas, B.J.; Callas, R.L. Using automated recorders and occupancy models to monitor common forest birds across a large geographic region. J. Wildl. Manag. 2015, 79, 325–337. [Google Scholar] [CrossRef]
  41. Hilje, B.; Stack, S.; Sánchez-Azofeifa, G.A. Lianas Abundance is Positively Related with the Avian Acoustic Community in Tropical Dry Forests. Forests 2017, 8, 311. [Google Scholar] [CrossRef] [Green Version]
  42. Izenman, A.J. Modern Multivariate Statistical Techniques; Springer Science and Business Media LLC: Berlin/Heidelberg, Germany, 2008; p. 758. [Google Scholar]
  43. Venables, W.N.; Ripley, B.D. Modern Applied Statistics with S-PLUS; Springer: New York, NY, USA, 2013; p. 447. [Google Scholar]
  44. Oksanen, J.; Blanchet, F.G.; Kindt, R.; Legendre, P.; Minchin, P.R.; O’hara, R.B.; Simpson, G.L.; Solymos, P.; Stevens, M.H.H.; Wagner, H.; et al. Package ‘vegan’. Community Ecol. Pack. 2013, 2, 1–295. [Google Scholar]
  45. Core-Team. R. A Language and Environment for Statistical Computing; Foundation for Statistical Computing: Vienna, Austria, 2019. [Google Scholar]
  46. Bates, D.; Mächler, M.; Bolker, B.; Walker, S. Fitting Linear Mixed-Effects Models Using lme4. J. Stat. Softw. 2015, 67. [Google Scholar] [CrossRef]
  47. Burham, K.P.; Anderson, D.R. Model Selection and Multimodel Inference, a Practical Information-Theoretic Approach; Springer: New York, NY, USA, 2002; p. 488. [Google Scholar]
  48. Burnham, K.P.; Anderson, D.R. Multimodel inference: Understanding AIC and BIC in model selection. Sociol. Methods Res. 2004, 33, 261–304. [Google Scholar] [CrossRef]
  49. Richards, S.A. Testing Ecological Theoty Using the Information-Theoretic Approach: Examples and Cautionary Results. Ecology 2005, 86, 2805–2814. [Google Scholar] [CrossRef]
  50. Symonds, M.R.E.; Moussalli, A. A brief guide to model selection, multimodel inference and model averaging in behavioural ecology using Akaike’s information criterion. Behav. Ecol. Sociobiol. 2010, 65, 13–21. [Google Scholar] [CrossRef]
  51. Stiles, F.G.; Skutch, A.F. Guide to the Birds of Costa Rica; Cornell University Press: Ithaca, NY, USA, 1989; p. 511. [Google Scholar]
  52. Li, W.; Cao, S.; Campos-Vargas, C.; Sánchez-Azofeifa, G.A. Identifying tropical dry forests extent and succession via the use of machine learning techniques. Int. J. Appl. Earth Obs. Geoinf. 2017, 63, 196–205. [Google Scholar] [CrossRef]
  53. Lopezaraiza-Mikel, M.; Alvarez-Añorve, M.; Avila-Cabadilla, L.; Marten-Rodriguez, S.; Calvo-Alvarado, J.C.; Espírito-Santo, M.M.D.; Fernandes, G.; Sánchez-Azofeifa, G.A.; Aguilar-Aguilar, M.; Balvino-Olvera, F.; et al. Phenological Patterns of Tropical Dry Forests along Latitudinal and Successional Gradients in the Neotropics. In Tropical Dry Forests in the Americas; Informa UK Limited: London, UK, 2013; pp. 101–128. [Google Scholar]
  54. Levey, D.J. Tropical Wet Forest Treefall Gaps and Distributions of Understory Birds and Plants. Ecology 1988, 69, 1076–1089. [Google Scholar] [CrossRef]
  55. Sánchez, N.V.; Vargas-Castro, L.E.; Avalos, G.; Paniagua, F. Effect of prey availability on the abundance of White-breasted Wood-Wrens, insectivorous birds of tropical lowland forests. J. Field Ornithol. 2014, 85, 347–354. [Google Scholar] [CrossRef]
  56. Neves, F.D.S.; Silva, J.; Marques, T.; Mota-Souza, J.; Madeira, B.; Espírito-Santo, M.D.; Fernandes, G. Spatiotemporal Dynamics of Insects in a Brazilian Tropical Dry Forest. In Tropical Dry Forests in the Americas; Informa UK Limited: London, UK, 2013; pp. 221–235. [Google Scholar]
  57. Martin, P.H.; Sherman, R.E.; Fahey, T.J. Forty years of tropical forest recovery from agriculture: Structure and floristics of secondary and old-growth riparian forests in the Dominican Republic. Biotropica 2004, 36, 297–317. [Google Scholar]
  58. Letcher, S.G.; Chazdon, R. Rapid Recovery of Biomass, Species Richness, and Species Composition in a Forest Chronosequence in Northeastern Costa Rica. Biotropica 2009, 41, 608–617. [Google Scholar] [CrossRef] [Green Version]
  59. Dunn, R.R. Recovery of Faunal Communities during Tropical Forest Regeneration. Conserv. Boil. 2004, 18, 302–309. [Google Scholar] [CrossRef]
Figure 1. Location of the 16 dry forest study sites at the Sector Santa Rosa within the Area de Conservación Guanacaste (ACG) (black section), Guanacaste, Costa Rica (modified from [29]).
Forests 11 00629 g001
Figure 2. Low-frequency bird call playback attenuation in decibels related to distance from the sound source at three different forest age classes. The logarithmic curves generated from the inverse distance law equation are shown for each age class (dotted lines).
Forests 11 00629 g002
Figure 3. Linear Discriminant Analysis (LDA) for the different forest age classes (i.e., 20, 30, 40, and 60 years old) and forest structural characteristics (tree basal area: BA; percentage of canopy openness; CO; plant area index (PAI); canopy height: CH; and Normalized Difference Vegetation Index: NDVI). Axis 1 (Can1) explains 74.5% of the variance and Axis 2 (Can2) explains 21.5%.
Forests 11 00629 g003
Figure 4. Bird species accumulation curves for the forest age classes.
Forests 11 00629 g004
Figure 5. Percentage of canopy openness (log) explaining variation in bird species richness. Confidence intervals at 95% shaded area, R2 = 0.38.
Forests 11 00629 g005
Figure 6. Nonmetric Multidimensional Scaling (NMSD) of bird species presence at the different forest age classes (20, 30, 40, 60 years old). n = 16 sites. Forest age ordiellipses represent 95% CI. Ordiellipses overlapping show non-differences on species compositions at different forest ages. Species names are represented by four letters code (see Table 1 for full scientific names).
Forests 11 00629 g006
Table 1. Mean (SD) forest structural characteristics recorded for the forest age classes by [29]. CO: the percentage of canopy openness, PAI: plant area index, CH: canopy height, BA: tree basal area, LR: the liana-to-tree ratio, and the Normalized Difference Vegetation Index (NDVI).
Age ClassBAPAINDVICHLRCO
20 years16.75 (13.19)2.26 (0.31)0.83 (0.03)15.38 (3.85)0.03 (0.04)14.11 (4.91)
30 years22.40 (11.09)2.38 (0.71)0.84 (0.02)18.98 (5.78)0.17 (0.13)13.08 (7.55)
40 years16.62 (8.07)2.47 (0.77)0.85 (0.02)24.86 (6.97)0.18 (0.13)13.12 (6.19)
60 years25.00 (9.40)2.71 (0.48)0.88 (0.07)20.43 (7.85)0.07 (0.04)11.16 (1.33)
Table 2. Total bird species detected from recordings in all the forest age classes evaluated. IUCN’s Red List conservation categories shown.
SpeciesLatin NameSpecies Code20304060 yearsRed List
Banded WrenThryothorus pleurostictusBANW××××LC
Barred AntshrikeThamnophilus doliatusBAAN××××LC
Black-headed TrogonTrogon melanocephalusBHTR××××LC
Boat-billed FlycatcherMegarynchus pitanguaBOBF××××LC
Bright-rumped AttilaAttila spadiceusBRAT× ××LC
Brown-crested FlycatcherMyiarchus tyrannulusBCFL××××LC
Canivet’s EmeraldChlorostilbon canivetiiCAEM ×× LC
Clay-colored ThrushTurdus grayiCCTH×× ×LC
Collared Forest-FalconMicrastur semitorquatusCOFF ××LC
Crested GuanPenelope purpurascensCRGU× ××LC
Double-striped Thick-kneeBurhinus bistriatusDSTK× LC
Dusky-capped FlycatcherMyiarchus tuberculiferDCFL××× LC
Elegant TrogonTrogon elegansELTR××××LC
Ferruginous Pygmy-OwlGlaucidium brasilianumFEPO× LC
Great CurassowCrax rubraGRCU× VU
Great KiskadeePitangus sulphuratusGKIS ××LC
Inca DoveColumbina incaINDO× × LC
Ivory-billed WoodcreeperXiphorhynchus flavigasterIBIW× × LC
Keel-billed ToucanRamphastos sulfuratusKBTO × LC
Laughing FalconHerpetotheres cachinnansLAFA××××LC
Lesser GreenletHylophilus decurtatusLESG×× ×LC
Lesser Ground-CuckooMorococcyx erythropygusLEGC× × LC
Lesson’s MotmotMomotus lessoniiLEMO××××LC
Long-billed GnatwrenRamphocaenus melanurusLBGN××××LC
Long-tailed ManakinChiroxiphia linearisLOTM××××LC
Northern Barred-WoodcreeperDendrocolaptes sanctithomaeNOBW××××LC
Olive SparrowArremonops rufivirgatusOLSP××××LC
Orange-fronted ParakeetAratinga canicularisOFPA××××LC
Pacific Screech-OwlMegascops cooperiPASO×× LC
Pale-billed WoodpeckerCampephilus guatemalensisPBIW××× LC
Plain ChachalacaOrtalis vetulaPLCH × LC
Plain XenopsXenops minutusPLXE ×× LC
Red-billed PigeonPatagioenas flavirostrisRBPI××××LC
Ruby-throated HummingbirdArchilochus colubrisRTHU××× LC
Rufous-and-white WrenThryothorus rufalbusRAWW××××LC
Rufous-capped WarblerBasileuterus rufifronsRCWA××××LC
Rufous-naped WrenCampylorhynchus rufinuchaRNAW××××LC
Scrub EuphoniaEuphonia affinisSEUP××× LC
Slate-headed Tody-FlycatcherPoecilotriccus sylviaSHTF×× LC
Social FlycatcherMyiozetetes similisSOFL× ×LC
Squirrel CuckooPiaya cayanaSQCU××× LC
Steely-vented HummingbirdAmazilia saucerrotteiSVHU ××LC
Streak-backed OrioleIcterus pustulatusSBAO× × LC
Streak-headed WoodcreeperLepidocolaptes souleyetiiSHWO××××LC
Stripe-headed SparrowPeucaea ruficaudaSHSP××× LC
Stripe-throated HermitPhaethornis striigularisSRTH××××LC
Sulphur-bellied FlycatcherMyiodynastes luteiventrisSBFL ×××LC
Summer TanagerPiranga rubraSUTA××××LC
Tennessee WarblerOreothlypis peregrinaTEWA××× LC
Thicket TinamouCrypturellus cinnamomeusTHTI××××LC
Tropical GnatcatcherPolioptila plumbeaTRGN××××LC
Tropical KingbirdTyrannus melancholicusTRKI× LC
Turquoise-browed MotmotEumomota superciliosaTBMO××××LC
White-fronted ParrotAmazona albifronsWFPA××××LC
White-lored GnatcatcherPolioptila albilorisWLGN××××LC
White-throated Magpie-JayCalocitta formosaWTMJ××××LC
White-tipped DoveLeptotila verreauxiWTDO××××LC
White-winged DoveZenaida asiaticaWWDO××××LC
Yellow WarblerDendroica petechiaYWAR××××LC
Yellow-green VireoVireo flavoviridisYGVI××××LC
Yellow-naped ParrotAmazona auropalliataYNPA××××EN
Yellow-olive FlycatcherTolmomyias sulphurescensYOFL××××LC
Yellow-throated EuphoniaEuphonia hirundinaceaYTEU××××LC
Yellow-throated VireoVireo flavifronsYTVI××××LC
Table 3. Generalized linear mixed models (Poisson error family) ranked according to the lowest AICc value explaining variation in bird species richness by forest structural characteristics.
ModelskAICcΔAICcw
species~CO295.2030.0000.498
species~1 (null)198.3163.1130.105
species~LAI298.8833.6800.079
species~area298.9303.7270.077
species~CO + BA399.7804.5770.050
species~BA2100.1834.9800.041
species~CO + LAI3100.2205.0170.041
species~NDVIm2100.2735.0700.039
species~CH2100.2835.0800.039
species~NDVIm + CO3100.5505.3470.034
species~liana2100.9335.7300.028
species~CO*BA3100.9405.7370.028
species~CO*LAI3102.0806.8770.016
species~CO + LAI + BA + CH + NDVIm + liana7119.09023.8870.000

