Article

Genetic Diversity and Range Dynamics of Helleborus odorus subsp. cyclophyllus under Different Climate Change Scenarios

by
Georgia Fassou
1,†,
Konstantinos Kougioumoutzis
1,2,†,
Gregoris Iatrou
1,
Panayiotis Trigas
3 and
Vasileios Papasotiropoulos
4,*
1
Division of Plant Biology, Laboratory of Botany, Department of Biology, University of Patras, 26504 Patras, Greece
2
Department of Ecology and Systematics, Faculty of Biology, National and Kapodistrian University of Athens, Panepistimiopolis, 15701 Athens, Greece
3
Laboratory of Systematic Botany, Department of Crop Science, Agricultural University of Athens, Iera Odos 75, 11855 Athens, Greece
4
Laboratory of Agricultural Genetics and Breeding, Department of Agriculture, University of Patras, Theodoropoulou Str, 27200 Amaliada, Greece
*
Author to whom correspondence should be addressed.
These authors contributed equally to this work.
Forests 2020, 11(6), 620; https://doi.org/10.3390/f11060620
Submission received: 9 May 2020 / Revised: 26 May 2020 / Accepted: 27 May 2020 / Published: 1 June 2020

Abstract

:
Research Highlights: The effects of climate change on habitat loss, range shift and/or genetic impoverishment of mid-elevation plants has received less attention compared to alpine species. Moreover, genetic diversity patterns of mountain forest herbaceous species have scarcely been explored in the Balkans. In this context, our study is the first that aims to examine Helleborus odorus subsp. cyclophyllus, a medicinal plant endemic to the southern part of the Balkan Peninsula. Background and Objectives: We compare its genetic diversity and structure along the continuous mountain range of western Greece with the topographically less structured mountains of eastern Greece, and predict its present and future habitat suitability, using several environmental variables. Materials and Methods: Inter Simple Sequence Repeat (ISSR) markers were used to genotype 80 individuals from 8 populations, covering almost the species’ entire distribution range in Greece. We investigated the factors shaping its genetic composition and driving its current and future distribution. Results: High gene diversity (0.2239–0.3319), moderate population differentiation (0.0317–0.3316) and increased gene flow (Nm = 1.3098) was detected. According to any GCM/RCP/climate database combination, Helleborus odorus subsp. cyclophyllus is projected to lose a significant portion of its current distribution by 2070 and follow a trend towards genetic homogenization. Conclusions: Populations exhibit in terms of genetic structure a west–east genetic split, which becomes more evident southwards. This is mainly due to geographic/topographic factors and their interplay with Quaternary climatic oscillations, and to environmental constraints, which may have a negative impact on the species’ future distribution and genetic composition. Pindos mountain range seems to buffer climate change effects and will probably continue to host several populations. On the other hand, peripheral populations have lower genetic diversity compared to central populations, but still hold significant evolutionary potential due to the private alleles they maintain.

1. Introduction

Mountains are topographically complex regions undergoing substantial changes over geologically short time scales [1]. Topographic complexity and elevation per se create a large variety of habitats and promote speciation processes, resulting in the exceptionally high biodiversity of mountain systems. Moreover, mountains often harbour aggregations of small-ranged species forming highly diverse endemism centres [1,2,3]. Mediterranean mountains, a globally important biodiversity hotspot for plant species richness and endemism, are expected to experience a severe species loss and turnover in the near future due to climate warming [4]. Understanding the fluctuating impacts of mountains on the distribution, diversification and ecological adaptation of individual species is crucial for managing mountain biodiversity in the face of the impending climate change.
The Balkan Peninsula is a highly important region for European and Mediterranean plant diversity and endemism [5]. Topographic heterogeneity, climatic diversity and long-term environmental stability have been proposed as the underlying factors influencing the exceptionally high plant diversity of the Balkans [6,7]. Divergence in the multiple Pleistocene refugia of the Balkan Mountains has been highlighted as a key factor generating intraspecific plant diversity [8,9,10]. Despite the importance of Balkan plant diversity for plant conservation in Europe and the Mediterranean, the patterns of intraspecific variability across the Balkan Mountains remain poorly understood. This knowledge gap becomes even more crucial when considering the large number of socio-economically important plant species distributed in the Balkans, like crop wild relatives, ornamental and medicinal plants.
The effects of the current climate warming are anticipated to have the strongest deleterious effects for the cold adapted plants distributed on mountain summits [1,11]. In this respect, the effects of climate change on habitat loss, range shift and/or genetic impoverishment of mid-elevation plants has received much less attention compared to the alpine species. Moreover, the influence of topographical mountain setting in migration corridors of mountain plants, and its fingerprint to species genetic variability has been largely overlooked. Possibly, the north-south directed Pindos mountain range that dominates western Greece has acted as a corridor for mountain species migration during Quaternary climatic oscillations, leading to increased population genetic homogenization. Mountain plants distributed in the more isolated mountain massifs of the eastern Greek mainland facing the Aegean archipelago, especially in the south, most likely responded with elevational range shifts in small geographical scales, resulting in stronger genetic differentiation of eastern-south-eastern populations compared to western ones. Current climate warming could also strongly affect habitat suitability for mountain species distributed in small isolated mountains with limited or no chance for upslope range shifts. In many cases, these changes will probably reduce genetic diversity in populations and species, in extreme situations to the point where genetic impoverishment will contribute to the diminishment of population viability [12].
Helleborus L. (Ranunculaceae) is a small genus comprising 22 species, distributed in Europe and Asia [13], with the Balkan Peninsula being the genus’ diversity centre. Helleborus odorus Willd. is an outcrossing, insect-pollinated, Balkan species also reaching northern Italy and Hungary, with three subspecies; among them, subsp. cyclophyllus (A. Braun) Maire & Petitm. is endemic to the southern Balkan Peninsula [14] and mainly distributed in Greece. The Northern Peloponnese constitutes the southern edge of this subspecies’ range, which is locally common in Greece in mid-elevation woodlands, scrubs, and meadows.
Helleborus spp. have been recognized as important herbs for their therapeutic use since antiquity, e.g., as a cure for mania and depression or as a painkiller and emetic [15]. Recently, some hellebore compounds, like hellebrin and hellebrigenin seem promising remedies for severe diseases such as cancer, ulcer, and diabetes [16,17].
The global increase on the demand of medicinal plant species has led to over-exploitation of natural populations. Understanding the patterns and distribution of genetic variation within and among populations is essential to ensure efficient conservation management and sustainable use of medicinal plants’ genetic resources. Moreover, maintenance of sufficient genetic diversity is an important consideration in species conservation, because genetic diversity is required for populations to evolve in response to environmental changes [18]. When the amount of diversity is reduced, inbreeding depression and higher homozygosity appear, undermining the adaptive potential of populations [19]. Genetic characterization is essential to understand the relationships and assess diversity within and among species. Molecular marker technologies, which rely on DNA analysis provide powerful tools to examine biodiversity at different levels. One of the biggest advantages is that they are unaffected by the environment and the developmental stages of the plants and free of pleiotropic or epistatic effects. Among them, Inter Simple Sequence Repeats (ISSRs) is a dominant marker system, not influenced by the presence of organellar DNA, often used in plant conservation genetics and diversity studies, due to high reproducibility, low cost and universality they exhibit [20,21].
Herein, we examine the genetic structure and variability of Helleborus odorus subsp. cyclophyllus populations across the Greek mountains, using ISSR markers, and assess climate change impacts on its current and future distribution and genetic composition. By doing so, we aim to contribute to the better understanding of the processes shaping mountain biodiversity patterns and to provide new insights into the range dynamics of mid-elevation mountain species influenced by global warming.

2. Materials and Methods
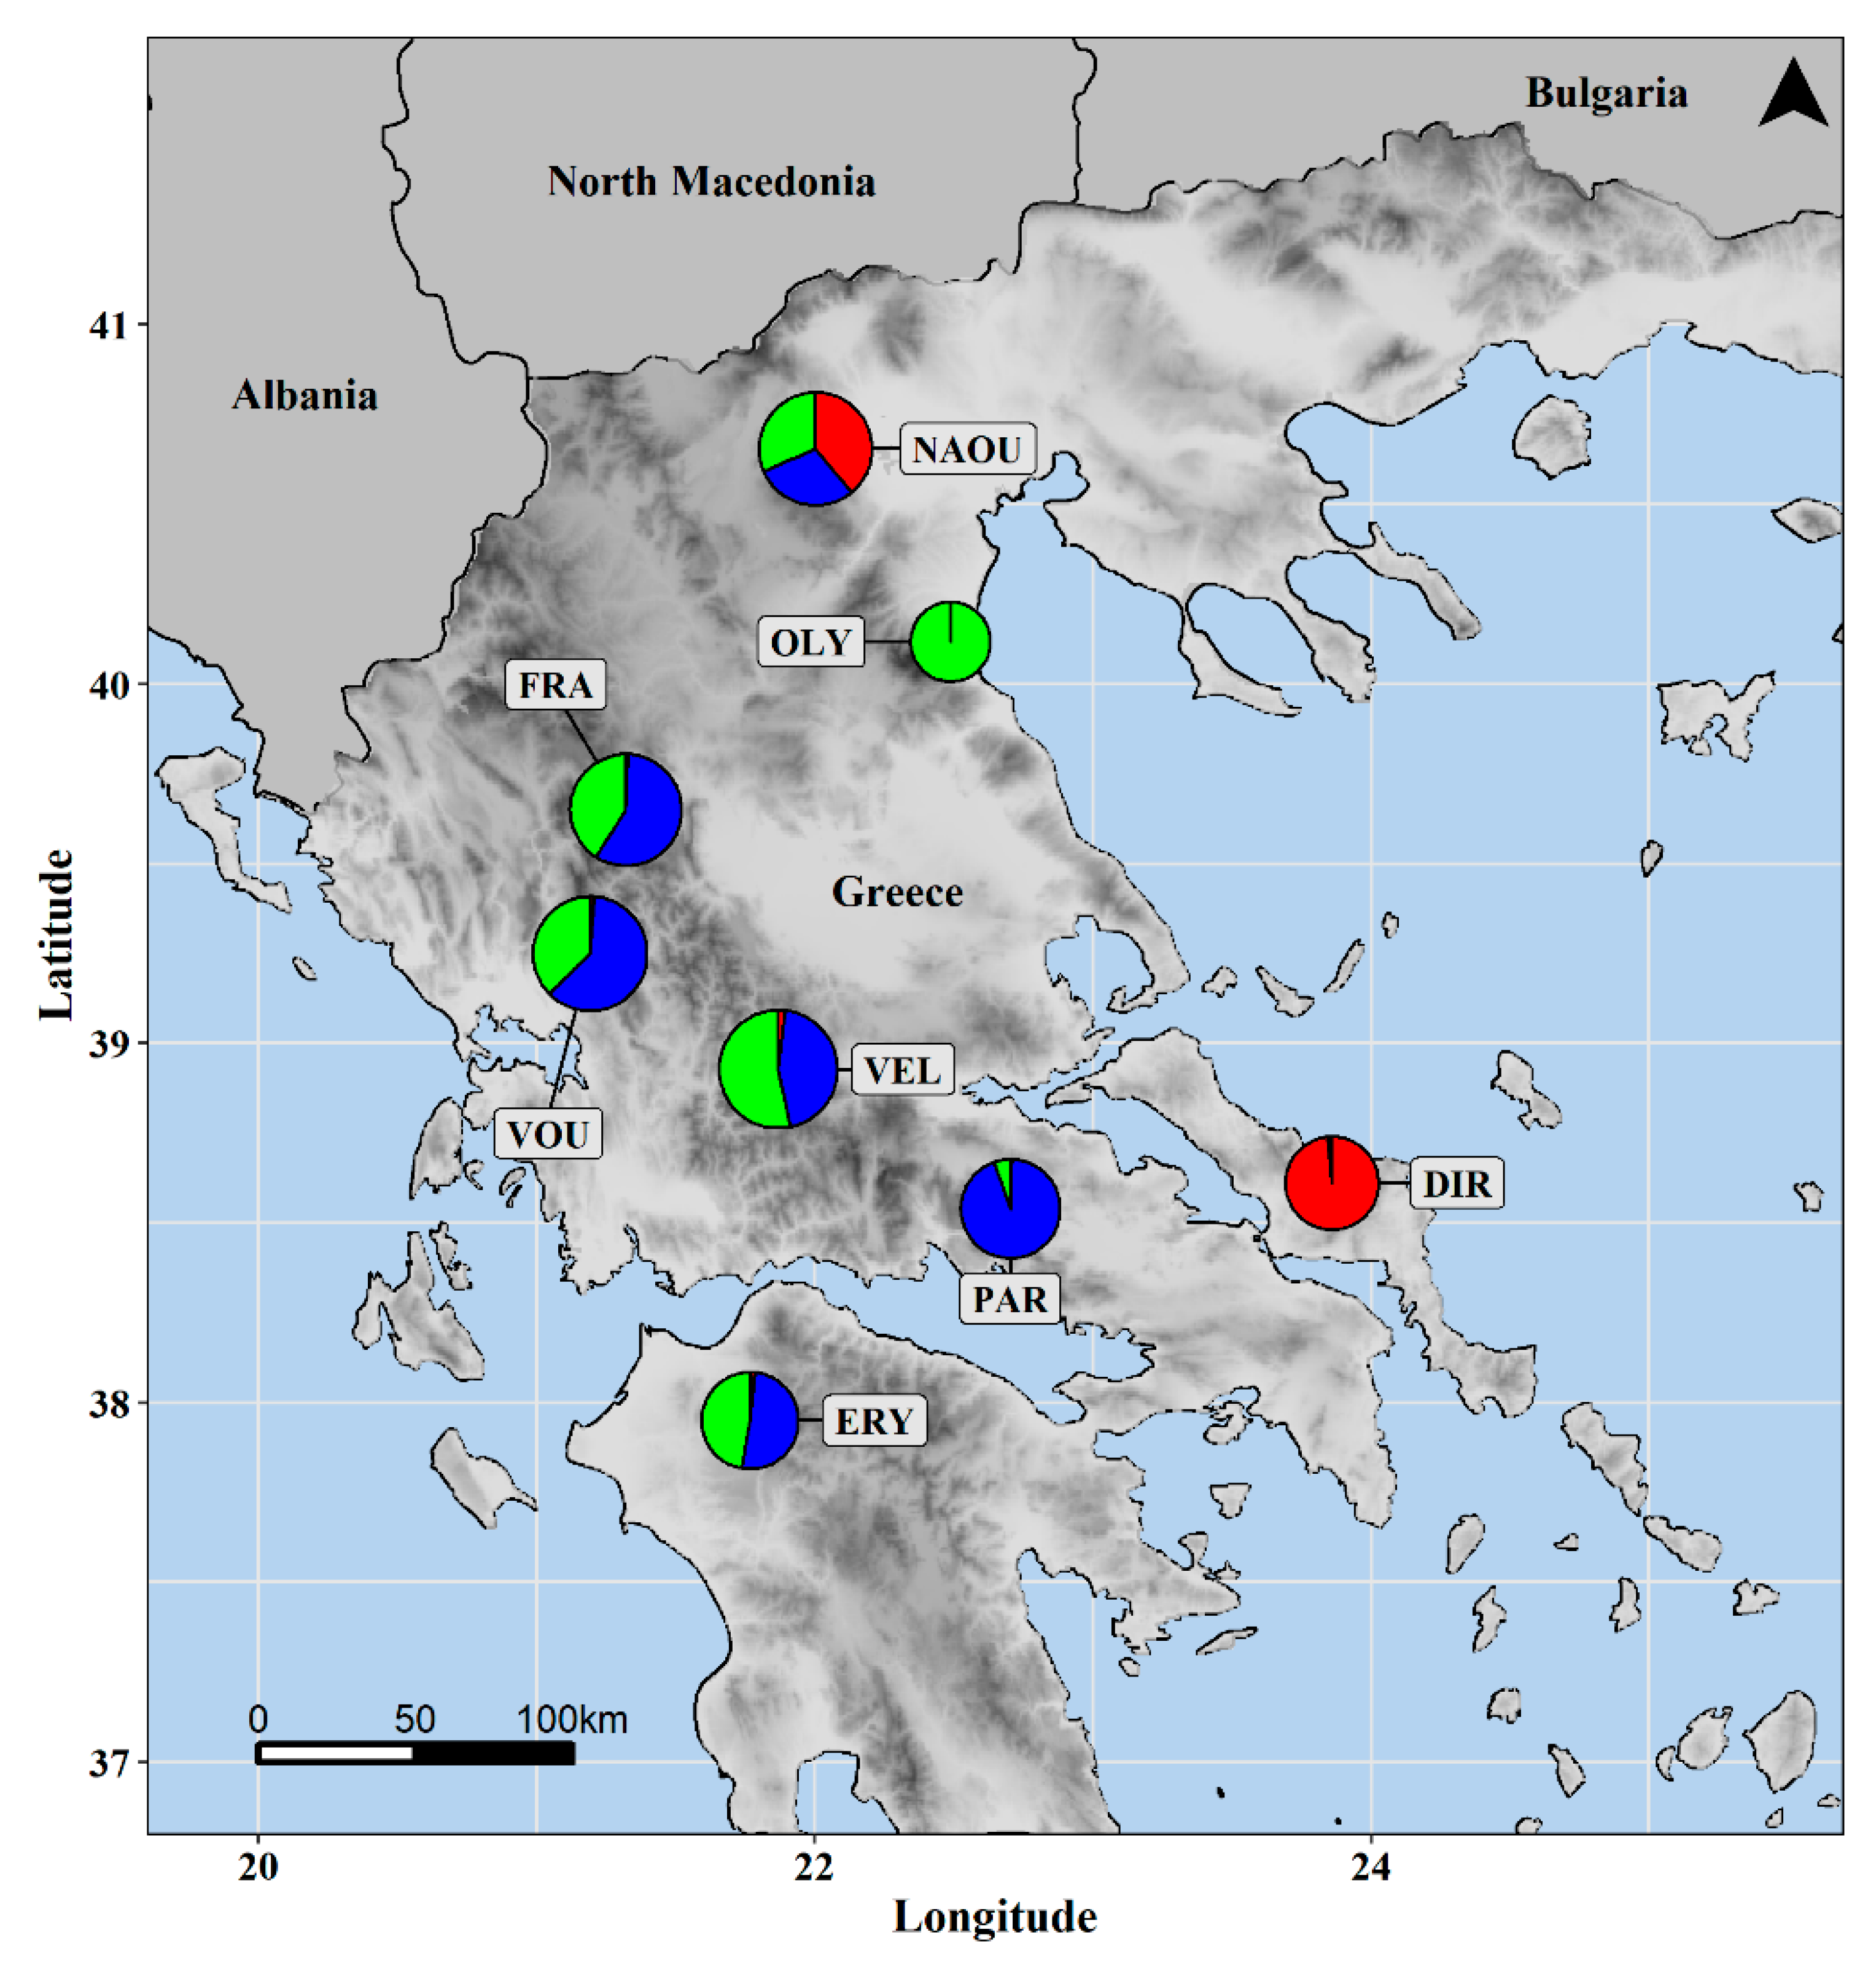
2.1. Plant Material

Individuals from eight populations of Helleborus odorus subsp. cyclophyllus, covering almost the entire distribution of the taxon in Greece, were used in the present study (Table 1). The populations consisted of many individuals, occupying large areas, which makes population size estimation difficult. All samples were collected from late February until early March 2016. Fresh and healthy leaves from 10 individuals of each population were collected and dried in silica gel.

2.2. Genetic Analysis

2.2.1. DNA Extraction

Total genomic DNA was isolated from individual dried leaves (100 mg) using the DNeasy Plant Mini Kit (Qiagen). Quality assessment and concentration of the purified DNAs were measured using a NanoDrop ND-1000 spectrophotometer (Thermo Fisher Scientific, Waltham, MA, USA), while DNA integrity was evaluated by agarose gel (0.8%) electrophoresis (Sigma).

2.2.2. ISSR Genotyping

Initially, we performed preliminary screening of several ISSR markers from the University of British Columbia UBC primer set # 9 (Vancouver, Canada), to select those exhibiting higher reproducibility and polymorphism. Based on this, ten ISSR primers were chosen, yielding the maximum numbers of reliable and reproducible bands for population genotyping (Table 2).
The PCR amplification reactions were performed within a 20 μL volume, containing 20 ng genomic DNA template, 1X PCR buffer, 1.6 μL of MgCl2 (25 mM), 1.2 μL dNTPs (100 mM each), 10 pmol from each primer, 1 U thermostable Taq DNA Polymerase (Kapa Biosystems). Reactions were carried out in MyCycler thermal cycler (Bio-Rad), under the following conditions: an initial denaturation step at 95 °C for 4 min followed by 35 cycles of denaturation at 94 °C for 45 s, annealing at 45.7–52 °C (depending on the primer set) for 45 s, extension at 72 °C for 2 min. The program was ended with a final extension step at 72 °C for 5 min. The PCR amplified fragments were separated by agarose (2%) gel electrophoresis and visualized with a GelDocEZ imaging system (Bio-Rad).
Fragments between 420 and 2470 bp, consistently amplified, were scored manually to form a binary matrix, where the presence of a band was scored as 1 and the absence as 0, assuming that each one of them corresponds to one locus with two alleles.

2.2.3. Statistical Analysis

For the estimation of the genetic diversity parameters, POPGENE version 1.31 [22], AFLPsurv version 1.0 [23] and GENALEX 6.5 [24,25] were employed. These parameters included the percentage of polymorphic bands (PPB, an index equivalent to polymorphic loci), calculated by dividing the number of polymorphic bands at the population and species levels by the total number of bands scored, Nei’s gene diversity (Hj) [26] and Shannon’s diversity index (I). Because there was no prior information regarding the level of inbreeding, we ran AFLPsurv 1.0 with different Fis values (0 assuming Hardy-Weinberg equilibrium to 1 complete lack of heterozygotes).
The estimation of gene flow (Nm), calculated as the number of migrants entering a population in each generation, was made by using POPGENE version 1.31 [22].
Pairwise Fst between the Helleborus odorus subsp. cyclophyllus populations was calculated using AFLPsurv 1.0. To depict relatedness at individual level we constructed a UPGMA polar dendrogram based on Jaccard’s coefficient of similarity using FREETREE software [27] visualized with FigTree version 1.4.3 [28]. Two samples of Ranunculus ficaria collected from North Peloponnesus were used as outgroup.
Analysis of Molecular Variance (AMOVA) and Principal Coordinates Analysis (PCoA) were performed with Genalex 6.5. For PCoA, the method for dominant data by Huff et al. [29] was followed. The test of significance for the AMOVA was carried out on 9999 permutations of the data.
We generated a Moran’s spatial correlogram (9999 permutations) with ‘fossil’ 0.3.7 [30] and ‘vegan’ 2.5.2 [31] packages, to check if there was any correlation between populations’ genetic and geographic distances.
To infer population structure and assign individuals to populations, we used STRUCTURE version 2.3.1 [32]. We used the admixture model, with correlated allele frequencies and the options RECESSIVE ALLELES and LOCPRIOR activated. No prior knowledge of the populations was included in the analysed dataset. To determine the optimal number of groups (K), we ran STRUCTURE with K varying from 1 to 8 (equal to the number of populations), with ten runs for each K value using a burn-in period of 100,000 interactions followed by 50,000 additional Markov Chain Monte Carlo (MCMC) interactions. The ΔK method [33] was used to identify the most likely number of clusters (K) using STRUCTURE HARVESTER 0.6.94 [34]. Each accession was assigned to its corresponding group based on maximum membership probability, as indicated by Remington et al. [35].

2.3. Species Occurrence Data

Helleborus odorus subsp. cyclophyllus occurrence data (167 occurrences) were obtained from the Global Biodiversity Information Facility database through functions from the ‘rgbif’ 1.4.0 [36] package. Data cleaning and organizing procedure follows Robertson et al. (see Supplementary) [37].

2.4. Environmental Data

Current and future climatic data were obtained from the WorldClim database [38] and the CHELSA database [39,40] at a 30 s resolution. We used two climate databases to assess the bioclimatic consistency and congruence of model predictions [41], a crucial source of uncertainty in SDMs [42].
An initial set of 50 predictors was constructed (Supplementary), including:
Sixteen climatic variables based on the 19 bioclimatic variables from WorldClim for current and future climate conditions.
  • Three Global Circulation Models (GCMs) that are rendered more suitable and realistic for the study area’s future climate.
  • Four different IPCC scenarios from the Representative Concentration Pathways (RCP) family.
  • Seven soil variables providing predicted values for the surface soil layer at varying depths.
  • Elevation data from the CGIAR-CSI data-portal [43] were aggregated and resampled to match the resolution of the other environmental variables. Additional topographical variables (slope, aspect, heat load index, topographic position index and terrain ruggedness index) were computed based on elevation data using functions from the ‘raster’ 2.6.7 package [44] and ‘spatialEco’ 1.2–0 package [45].
  • Geological data from the Geological Map of Greece [46].
From this set of predictors, only fifteen and seventeen variables (depending on the extent of the distributional area) were not highly correlated (Spearman rank correlation < 0.7 and VIF < 5 [47] (see Supplementary).

2.5. Species Distribution Models

2.5.1. Model Parameterization and Evaluation

The realized climatic niche of Helleborus odorus subsp. cyclophyllus was modelled by combining the available occurrence data to current environmental predictors in an ensemble modelling scheme (see Supplementary) [48].

2.5.2. Model Projections

Calibrated models with a TSS score > 0.8 (to avoid poorly calibrated ones) were used to project the suitable area for Helleborus odorus subsp. cyclophyllus taxon under current and future conditions through an ensemble forecast approach (see Supplementary) [48].

2.5.3. Area Range Change

To assess whether Helleborus odorus subsp. cyclophyllus will experience range contraction or expansion under future conditions, we used the ‘biomod’ 3.3.7 package [49]. The taxon was not assumed to have unlimited dispersal capability, since this assumption could be overoptimistic.

2.6. Bioclimatic Congruence and Consistency

We followed the framework of Morales-Barbero and Álvarez [41] in order to construct the bioclimatic congruence and consistency maps for Helleborus odorus subsp. cyclophyllus for every time period that was available in both climate databases.

2.7. Generalized Dissimilarity Modelling

We used Generalized Dissimilarity Modelling (GDM–) [50] in the framework laid out by Fitzpatrick and Keller [51] to investigate the spatial and environmental drivers of genetic beta diversity, as well as to explore the potential variation in future genetic diversity patterns due to climate change. We used the same environmental variables as in the SDM analyses, with the significance of all variables assessed through a Monte Carlo permutation test (see Supplementary). We followed Fitzpatrick and Keller [51] to visualise the spatial patterns of genetic variation (see Supplementary). Finally, we projected our GDM based on current environmental conditions to every GCM/RCP combination we included in our study, so as to predict the areas where the relationship between genetic composition and future environmental conditions will experience the greatest change ([51]—‘genetic offset’; see Supplementary).
All GDM analyses were performed with the ‘gdm’ 1.3.7 [52] R package in the R 3.5.3 [53].

3. Results

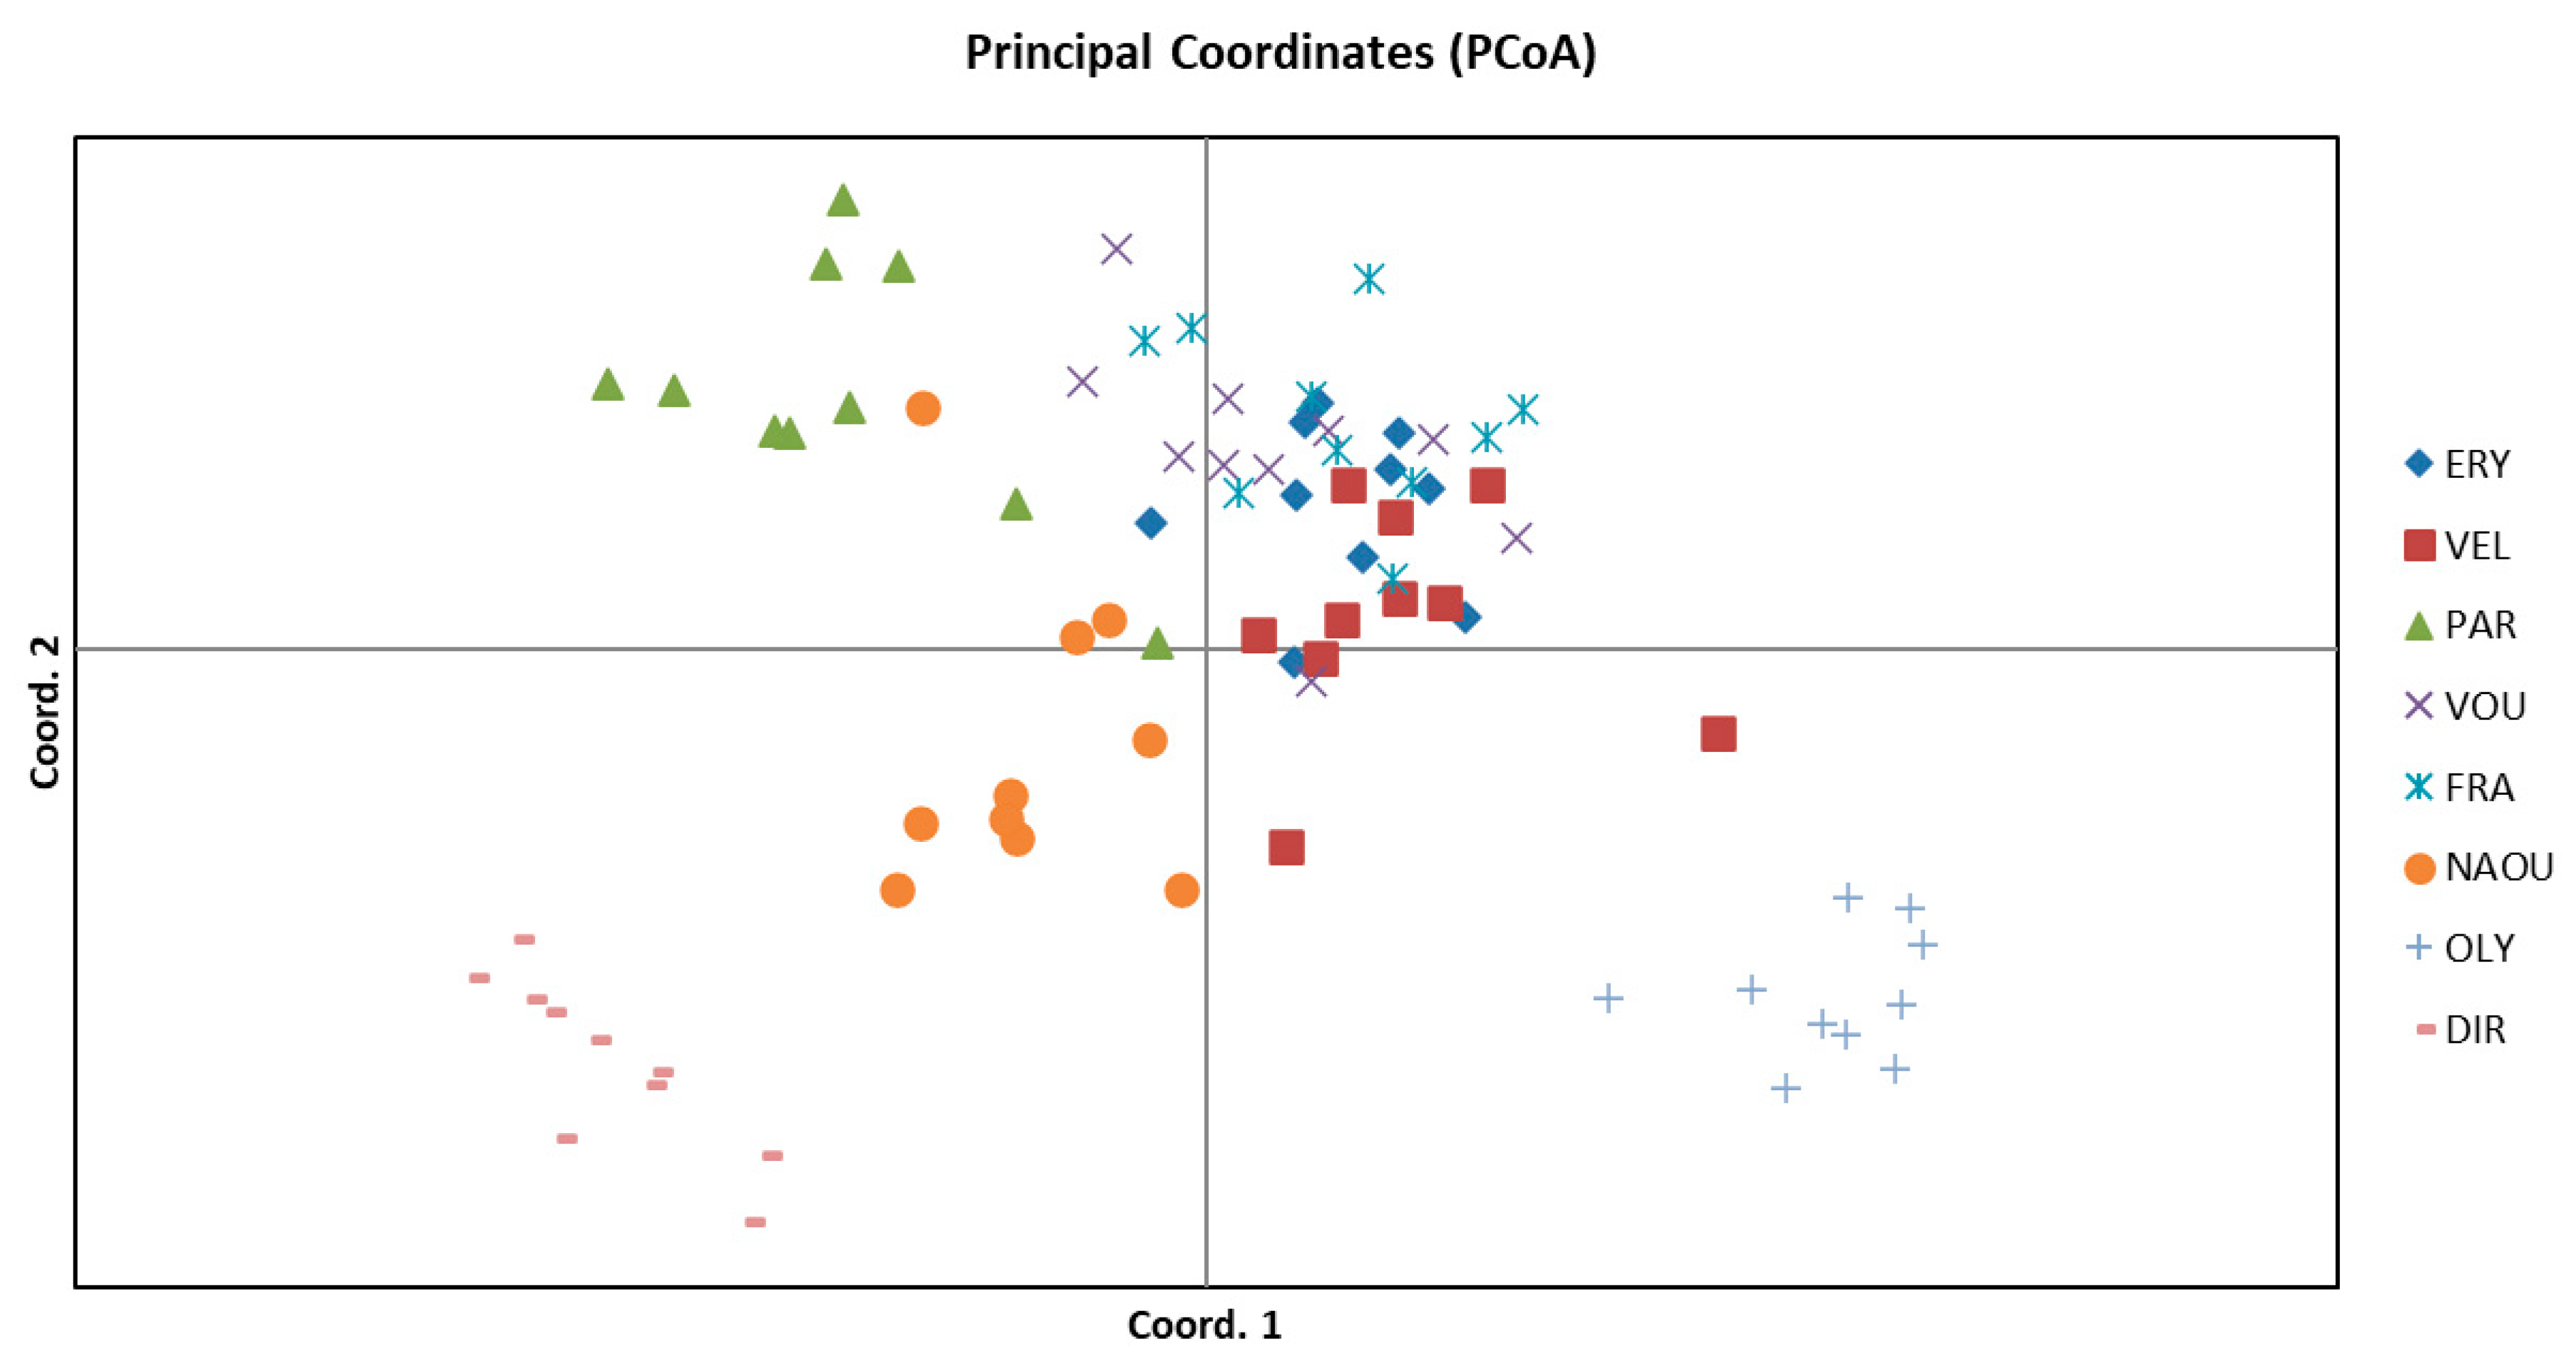
3.1. Molecular Analysis

After preliminary screening, ten ISSR primers were eventually selected for genotyping. In total 134 bands were scored, with their size ranging from 420 bp to 2470 bp. Among them, primer UBC–811 had the highest number of bands (22), while UBC–821 the lowest (7) (Table 2).
The highest number of bands (115) was observed in Velouchi population, while the lowest (84) in Olympos. Moreover, the highest number of private bands (26) were revealed in Olympos, while the lowest (9) in Parnassos. The percentage of polymorphic bands (PPB) per population ranged from 43.28% to 76.87% (Olympos and Velouchi, respectively).
Pairwise Fst values ranged from 0.0317 between Vourgareli and Fragma Mesachoras to 0.3316 between Olympos and Dirfi, while the average Fst value among the eight populations was 0.1505 (Table S1).
There were no significant differences detected for Nei’s gene diversity (Hj) values regardless populations were in Hardy–Weinberg equilibrium or not. Assuming Hardy–Weinberg equilibrium, Hj ranged from 0.2239 ± 0.016 (Olympos) to 0.3319 ± 0.013 (Velouchi), which was the richest in terms of genetic diversity. The average gene diversity within the populations (Hw) was 0.2898 ± 0.013, while the total gene diversity for the taxon (Ht) was 0.3410. Assuming no Hardy–Weinberg equilibrium, the population of Velouchi had the highest Hj value (0.3490 ± 0.0158), while the population from Olympos the lowest (0.2010 ± 0.0183). The average gene diversity within the populations of H. odorus subsp. cyclophyllus (Hw) was 0.2901 ± 0.019, while the total gene diversity for the taxon (Ht) was 0.3763. Shannon’s information index (I) ranged from 0.2322 ± 0.025 (Olympos) to 0.3951 ± 0.022 (Velouchi). Finally, gene flow (Nm) among populations was 1.3098 (Table 3).
The analysis of molecular variance (AMOVA) showed that most of the genetic diversity was attributable to differences among individuals within populations (74%), while significantly less was observed among populations (26%).
Non-significant correlation between the geographic and the genetic distance values was observed (r = 0.24; p > 0.05) for the populations under study.
The PCoA analysis among individuals (Figure 1), showed that 60.22% of total variation is explained by the first three axis (26.29%, 18.79% and 15.14%, respectively). The populations from Olympos and Dirfi, which are separated by the first coordinate are the most homogeneous and divergent ones with less intrapopulation variability. The populations from Parnassos and Naousa are separated by the second coordinate, although in some limited cases individuals from these population seem to interact. The remaining populations from Vourgareli, Velouchi, Erymanthos and Fragma Mesachoras seem to interact with each other forming a mix.
The ΔK statistic in the STRUCTURE analysis presented a maximum peak at K = 3 (Figure S1), suggesting that three different genetic clusters exist. The individuals from Olympos and Dirfi were categorised into their own unique clusters, while most of the individuals from Parnassos formed a third one. The individuals from the remaining populations were assigned to Parnassos’ and Olympos’ genetic clusters, except those from Naousa which were assigned to all three existing clusters (Figure 2).
The polar UPGMA dendrogram obtained using Jaccard’s coefficient of similarity shows that in most cases all the individuals were clustered in their respective populations. Individuals from Vourgareli and Fragma Mesachoras populations are grouped together forming a big cluster, while one individual from Velouchi was positioned separately next to those from Olympos population. The most distinct clade is the one formed by the individuals from Dirfi, followed by that formed by those from Parnassos, while the populations from Olympos, Erymanthos and Velouchi belong to a wider clade (Figure 3).
The topology obtained is in concordance with the grouping deduced by the 1st coordinate of PCoA and follows the pattern of diversity clustering revealed by the STRUCTURE analysis.

3.2. Species Distribution Modelling

The ensemble of small models (ESM) framework predictions were very good, with sufficient predictive power (Figure S2). Overall, the model based on the geographical thinning procedure, the alpha-hull method and the CHELSA database had the best predictive accuracy (Figure S2). Only intra-climate database variation was statistically insignificant (KWA: H = 2.18, d.f. = 1, p = 13.97; Figure S2); all other uncertainty sources varied significantly (KWA: p < 0.01 for all cases; Figure S2). Mean temperature and potential evapotranspiration of the wettest quarter (MAT and PETWQ, respectively) had the highest contribution among the response variables for both thinning procedures for CHELSA and WorldClim, respectively. The resulting habitat suitability maps (Figures S3 and S4) had high bioclimatic consistency for every combination of the thinning procedures and distribution areas (Figures S5 and S6).
They were converted into binary maps and then compared to the binary maps obtained for each Global Circulation Model (GCM), Representative Concentration Pathway (RCP) scenario, time period, thinning procedure, and climate database. Since the trends for the future potential distribution of Helleborus odorus subsp. cyclophyllus were largely identical across all sources of uncertainty, we present only the area range change for the WorldClim database and the CCSM4 GCM and the RCP 2.6 scenario.
Our results indicate that by 2070 H. odorus subsp. cyclophyllus is projected to lose a significant portion of its current distribution under any GCM/RCP/climate database combination, with varying magnitude across GCMs, RCPs and climate databases (3.9%–100.0%; Figure 4 and Figures S7–S17), but the median range contraction is 29.2%. The median range contraction differs between the two climate databases (KWA: H = 36.07, d.f. = 1, p < 0.001) and it was significantly higher in the CHELSA database.

3.3. Generalized Dissimilarity Modelling

GDM helped disentangle the relative contribution of geographic and environmental drivers of genetic composition across time and space. Our model explained 81.5% of deviance in genetic composition. The most important gradient for determining genetic diversity turnover was mean diurnal range (MDR), followed by geographical distance (Figure S18). The fitted functions describing the turnover rate and magnitude along each gradient were nonlinear, with turnover rate varying with position along gradients (Figure S18). The MDR I-spline indicates rapid and abrupt changes in genetic variation for values above a certain threshold (Figure S18).
Rapid turnover is predicted in the area between the mountain ranges crossing Greece in an NW–SE axis, as well as in Evvia and NE Greece (Figure S19). Our analyses highlighted five different geographical clusters (Figures S19–S20) and this situation is predicted to change drastically under any GCM/RCP (Figures S21–S44), showing a trend towards genetic homogenization. Based on the V-measure index, the highest and the lowest similarity is observed for the BCC RCP 2.6 and the HadGEM2 RCP 8.5, respectively (Figure S45; median V-measure index: 0.61).
Under any GCM/RCP, the area in northern Greece and the Pindos mountain range is predicted to exhibit greater genetic turnover than any other region (Figure 5). These areas harbour populations for which the genetic offset is predicted to be greatest under climate change (Figure 5). Low genetic offset is predicted in valleys and low-elevation areas in central Greece, as well as in the southern edge of the species’ range (Figure 5).

4. Discussion

4.1. Genetic Diversity and Structure

The relationship between species richness and elevation is predominantly hump-shaped across the mountains of the globe [54], rendering mid-elevation forest plant species as the backbone of mountain plant diversity. Despite their importance in building biodiversity across different spatial scales, mid-elevation plants have received minor attention in relation to the factors shaping intraspecific variability and range dynamics, compared to high elevation species, especially in the face of climate change.
Intraspecific genetic variation is the most fundamental level of biodiversity, and provides the basis for any evolutionary change, being crucial for maintaining the ability of species to adapt to new environmental conditions [12]. Climatic alterations impact intraspecific genetic diversity by two major processes, either by inducing plants to contract or expand their ranges and/or by promoting changes through adaptation to the local selection regime [55,56].
In this study, genetic diversity, and differentiation among Helleborus odorus subsp. cyclophyllus, populations from various mountainous locations in Greece, were analysed using ISSR markers. A total of 134 genetic loci were genotyped, which according to Nelson and Anderson [57] are adequate for dominant markers to yield acceptable results. Within population diversity in terms of percentage of polymorphic bands, Shannon’s information index (I) and Nei’s gene diversity (Hj) was higher in the north and northwest populations, except Olympos, becoming lower in the more isolated populations of east and southern Greece. The average gene diversity within populations was high (Hw = 0.29), similar to the values reported by Nybom [58] for plants with narrow distribution range (Hpop = 0.28), and much higher than those reported for endemic plants (Hpop = 0.20) using dominant markers.
The number of private bands was higher in the more isolated population of east and southern Greece, being remarkably high (26) in the population of Olympos. The Analysis of Molecular Variance (AMOVA) showed that the most of genetic variation was attributable to differences among individuals within populations (74%), and less among populations (26%). Genetic differentiation was moderate (Fst = 0.1505) and in line with AMOVA. Hogbin and Peakall [59] summarized the results of RAPD analysis (dominant markers like ISSRs) in several species, and identified a similar pattern according to which genetic variation of outcrossed species as Helleborus odorus subsp. cyclophyllus, is mainly distributed within populations, while diversity among populations accounted for less than 27%, an observation that is also in agreement with Nybom [58]. The high value of gene flow (Nm = 1.3098) largely explains the moderate inter-population genetic differentiation observed. Interestingly, gene flow was much higher among western (FRA, VOU, VEL, ERY) populations (NmW = 2.408) and relatively limited among eastern (NAOU, OLY, PAR, DIR) ones (NmE = 1.062). Our analyses based on the spatial distribution of the species’ genetic diversity identified five different geographical clusters (Figure S19). This bioregionalization might explain the restricted gene flow observed among the eastern populations of H. odorus subsp. cyclophyllus compared to the western ones.
The reduced genetic diversity observed for Olympos and Dirfi, could be the result of genetic drift. Climatic oscillations and resulting migrations along the altitudinal gradient, may have caused fluctuations in the size of populations promoting the action of genetic drift. Additionally, range expansions due to a series of repeated founder events and allele surfing may lead to a high increase in the frequency of specific alleles [60,61,62]. We cannot, however, rule out the possibility that under climate change scenarios adaptive micro-evolutionary processes (e.g., selection of local genotypes better adapted to local environmental conditions) tend to reduce variation on specific loci upon which natural selection acts, including also regions of the genome that are hitchhiking [56].
The present distribution of Helleborus odorus subsp. cyclophyllus is confined to fragmented mountainous areas, where most of the studied populations are separated by deep valleys and plains, and by the sea in the cases of Erymanthos and Dirfi, unfavourable for species growth. The moderate among populations genetic differentiation indicates a more continuous distribution in the recent past, at least for a part of its distribution range. During Quaternary glacial episodes numerous European mountain plant species managed to survive by shifting their ranges downwards in elevation and/or southwards in latitude, followed by the opposite elevational and latitudinal range shifts during interglacial periods [9,62,63,64]. It is reasonable to assume that during cold stages H. odorus subsp. cyclophyllus was distributed in lower elevation than today, allowing in some cases contacts of genetically divergent populations and inter-population hybridization.
Phylogeographic studies have provided evidence that postglacial secondary contact has also led to climate-driven hybridization events in several species increasing local genetic diversity [56]. Connectivity among populations might have been maximal during the glaciation periods and interrupted in the post-glacial period with remigration to higher altitudes, resulting in significant and moderate levels of genetic differentiation among populations. In these cases, admixed populations (e.g., Naousa in our study) are expected to occur, combining different gene pools. All populations of Helleborus odorus subsp. cyclophyllus distributed along the mountains of western Greece combine the same two gene pools, represented in their pure forms in Olympos and Parnassos as deduced by the STRUCTURE analysis. The close connection of the Erymanthos population to the populations of the Pindos mountain range confirms previous evidence that the Corinthian Gulf that separates mainland Greece from the Peloponnese is only a weak biogeographical barrier [65]. The Dirfi population was most probably isolated for the longest time. It shares a common ancestral population only with the distant population of Naousa. The latter population is the only that combines all detected gene pools, indicating the northern origin of the studied subspecies.
Helleborus odorus is a mainly Balkan species with a distribution centre at the Dinaric Alps, and subsp. cyclophyllus occupies the southern range limits of the species. The Greek populations of H. odorus subsp. cyclophyllus exhibit a west–east genetic split in terms of genetic structure, supported by the ISSR data, which becomes more evident southwards, indicating more effective genetic barriers separating western from eastern populations at the southern range limits of the subspecies. The Pindos mountain range, which runs through western mainland Greece southwards to the Peloponnese, is separated from the mountains of eastern Greece by low mountainous areas in the north, replaced by extensive plains to the south. It is possible that the low mountainous areas of northern Greece have allowed dispersal of mid-elevation plants, like H. odorus subsp. cyclophyllus, during Pleistocene glacial periods, while the plains of southern Greece have acted as more effective barriers, triggering genetic divergence of the southeast populations. The marked climatic differences between west and east Greece, especially regarding annual precipitation [66], could further promote divergent selection.

4.2. Climate Change Vulnerability

Contemporary climate change is influencing species distribution and population structure, with important consequences for patterns of genetic diversity and species’ evolutionary potential [67]. The climatic factors (MAT, PETWQ and MDR) emerged as the most significant variables in shaping the species’ distribution and its genetic diversity turnover. Our analyses were robust and bioclimatically consistent (Figures S2–S6), for every source of uncertainty. We were able to discern the physiological threshold above which the species’ local adaptation and genetic make-up seems to change drastically (Figure S18) and is responsible for the differences in within and among population genetic diversity observed in the northern and southern populations of Helleborus odorus subsp. cyclophyllus. It is very likely that the species is going to experience a moderate to severe decline in its distribution under any GCM/RCP/climate database combination (Figure 4 and Figures S7–S17). These changes will probably be more pronounced in the species’ southern and NE range edge in Greece (Figure 4 and Figures S7–S17). The Pindos mountain range seems to buffer the climate change effects and will probably continue to host several populations of H. odorus subsp. cyclophyllus.
The species’ local adaptation seems to be driven by MDR and as such, areas with high MDR differences constitute steep barriers for gene flow (e.g., the vast plains in Central Greece–Figures S19–S44). Analysis based on the spatial distribution of the species’ genetic diversity identified a strong bioregionalization comprised of five different geographical clusters (Figure S19), which might be accounted for the restricted levels of gene flow. However, we predict a trend towards genetic homogenization (Figures S21–S44) under any GCM/RCP combination, with highest similarity between the current and the future scheme observed in the BCC 2.6 GCM/RCP combination based on the V-measure index (Figure S45).
Overall, the highest similarity is anticipated for the RCP 2.6 group of climate scenarios and the lowest for the RCP 8.5 group (they represent the best–and worst–case climate scenarios, respectively). Our results indicate that the area in northern Greece is predicted to exhibit greater genetic turnover than any other region (Figure 5). These areas harbour populations for which the genetic offset is predicted to be greatest under climate change (Figure 5). Low genetic offset is predicted in the southern edge of the species’ range and the Pindos mountain range (Figure 5).
According to the SDM predictions, the species is probably going to experience a reduction in both of its edges in Greece, yet the genetic offset seems to be more pronounced in its NE Greek edge, where the Olympos and Naousa populations are predicted to experience the highest genetic diversity decline (Figure 5). Thus, the species’ adaptive genetic variability seems to be more resilient in the species’ core distribution in Greece (the Pindos mountains) and the southern limits of its overall distribution. This aligns with the fact that leading edge populations provide the majority of surviving lineages and persisting alleles, while trailing edge lineages and alleles are probably facing higher extinction risk [56,68]. These areas may harbour populations that through adaptive micro-evolutionary processes could enhance the species’ ability to cope with climate change, as well as reveal locations expected to be highly diverse in genetic composition, and thus, if sampled, help ensure its genetic diversity and its long-term survival, due to their ecological plasticity and/or adaptation [55,69,70]. The populations in the NE edge of the species’ range should also be prioritized in terms of conservation concern, since they exhibit both high genetic diversity and extinction risk.
Moreover, the species’ peripheral populations are characterised by lower genetic diversity and higher genetic differentiation compared to its central populations, as expected (‘abundant-centre hypothesis’) [71,72], but they seem to contain a large number of PrBs (especially the Olympos population), and thus they hold significant future evolutionary potential.

5. Conclusions

Our work aims to assess genetic diversity and population differentiation in Helleborus odorus subsp. cyclophyllus, and to investigate the influence of climate change on the distribution range and habitat suitability for this species, as a case study for mid-elevation plants in the Balkan Peninsula. The Greek populations of H. odorus subsp. cyclophyllus exhibit significant gene flow, which largely explains the moderate inter-population genetic differentiation observed, while most of the genetic variance is attributed to individuals within populations. Genetic structuring revealed the existence of three genetic clusters. The populations based on genetic structuring exhibit a split in the W-E axis, which becomes more evident in the southern part of the species’ distribution.
This differentiation is due to environmental constraints, which are projected to have a negative impact on the species’ future distribution and genetic composition. Apart from contemporary drivers, historical processes such as the Pleistocene climate oscillations might have contributed to the genetic structure of the species’ populations in Greece, since it is reasonable to assume that the low mountainous areas separating high mountains of northern Greece have allowed dispersal of mid-elevation plants, while the plains of southern Greece have acted as more effective barriers, triggering genetic divergence of the southeast populations. These leading-edge populations, along with the ones present in the species’ core distribution in Greece (the Pindos mountains), seem to be more resilient against environmental/climate change in terms of their adaptive genetic variability.
Helleborus odorus subsp. cyclophyllus is a typical mid-elevation forest plant species, a group that has caused less attraction and remained away from the research spotlight regarding the climate-change agenda. In this respect it might be prudent and cost-effective to focus any conservation initiatives regarding this type of species to their leading-edge populations, as they might be highly diverse in genetic composition and better-suited to cope with the effects of climate change.

Supplementary Materials

The following are available online at https://www.mdpi.com/1999-4907/11/6/620/s1.

Author Contributions

Conceptualization, V.P., P.T., and G.I.; Investigation, G.F. and K.K.; Methodology and formal analysis, G.F., V.P, and K.K.; Resources, G.F., G.I., and K.K.; Supervision, V.P., and P.T.; Writing—Original Draft Preparation, G.F., K.K., P.T., and V.P.; Writing—Review and Editing, G.F., K.K., G.I., P.T., and V.P.; Visualization, K.K., G.F., and V.P. All authors have read and agreed to the published version of the manuscript.

Funding

“PlantUP” (MIS 5002803) which is implemented under the Action “Reinforcement of the Research and Innovation Infrastructure”, funded by the Operational Programme “Competitiveness, Entrepreneurship and Innovation” (NSRF 2014–2020) and co-financed by Greece and the European Union (European Regional Development Fund).

Conflicts of Interest

The authors declare no conflict of interest.

References

  1. Rahbek, C.; Borregaard, M.K.; Antonelli, A.; Colwell, R.K.; Holt, B.G.; Nogues-Bravo, D.; Rasmussen, C.M.; Richardson, K.; Rosing, M.T.; Whittaker, R.J.; et al. Building mountain biodiversity: Geological and evolutionary processes. Science 2019, 365, 1114–1119. [Google Scholar] [CrossRef] [PubMed]
  2. Rahbek, C.; Gotelli, N.J.; Colwell, R.K.; Entsminger, G.L.; Rangel, T.F.; Graves, G.R. Predicting continental-scale patterns of bird species richness with spatially explicit models. Proc. R. Soc. B: Boil. Sci. 2006, 274, 165–174. [Google Scholar] [CrossRef] [PubMed] [Green Version]
  3. Steinbauer, M.; Field, R.; Grytnes, J.A.; Trigas, P.; Ah-Peng, C.; Attorre, F.; Birks, H.J.B.; Borges, P.A.V.; Cardoso, P.; Chou, C.H.; et al. Topography-driven isolation, speciation and a global increase of endemism with elevation. Glob. Ecol. Biogeogr. 2016, 25, 1097–1107. [Google Scholar] [CrossRef]
  4. Thuiller, W.; Lavorel, S.; Araujo, M.B.; Sykes, M.T.; Prentice, I.C. Climate change threats to plant diversity in Europe. Proc. Natl. Acad. Sci. USA 2005, 102, 8245–8250. [Google Scholar] [CrossRef] [Green Version]
  5. Kier, G.; Kreft, H.; Lee, T.M.; Jetz, W.; Ibisch, P.L.; Nowicki, C.; Mutke, J.; Barthlott, W. A global assessment of endemism and species richness across island and mainland regions. Proc. Natl. Acad. Sci. USA 2009, 106, 9322–9327. [Google Scholar] [CrossRef] [Green Version]
  6. Kryštufek, B.; Reed, J.M. Pattern and Process in Balkan Biodiversity—An Overview. In Balkan Biodiversity; Springer: Dordrecht, The Netherlands, 2004; pp. 1–8. [Google Scholar] [CrossRef]
  7. Tzedakis, P.C. The Balkans as Prime Glacial Refugial Territory of European Temperate Trees. In Balkan Biodiversity; Springer: Dordrecht, The Netherlands, 2004; pp. 49–68. [Google Scholar] [CrossRef]
  8. Frajman, B.; Oxelman, B. Reticulate phylogenetics and phytogeographical structure of Heliosperma (Sileneae, Caryophyllaceae) inferred from chloroplast and nuclear DNA sequences. Mol. Phylogenetics Evol. 2007, 43, 140–155. [Google Scholar] [CrossRef]
  9. Surina, B.; Schönswetter, P.; Schneeweiss, G.M. Quaternary range dynamics of ecologically divergent species (Edraianthus serpyllifolius and E. tenuifolius, Campanulaceae) within the Balkan refugium. J. Biogeogr. 2011, 38, 1381–1393. [Google Scholar] [CrossRef]
  10. Kutnjak, D.; Kuttner, M.; Niketić, M.; Dullinger, S.; Schönswetter, P.; Frajman, B. Escaping to the summits: Phylogeography and predicted range dynamics of Cerastium dinaricum, an endangered high mountain plant endemic to the western Balkan Peninsula. Mol. Phylogenetics Evol. 2014, 78, 365–374. [Google Scholar] [CrossRef]
  11. Pauli, H.; Gottfried, M.; Dullinger, S.; Abdaladze, O.; Akhalkatsi, M.; Alonso, J.L.B.; Coldea, G.; Dick, J.; Erschbamer, B.; Calzado, R.F.; et al. Recent Plant Diversity Changes on Europe’s Mountain Summits. Science 2012, 336, 353–355. [Google Scholar] [CrossRef] [Green Version]
  12. Frankham, R.; Ballou, J.D.; Briscoe, D.A.; McInnes, K.H. Introduction to Conservation Genetics; Cambridge University Press: Cambridge, UK; New York, NY, USA, 2002. [Google Scholar]
  13. Meiners, J.; Winkelmann, T. Evaluation of reproductive barriers and realisation of interspecific hybridisations depending on genetic distances between species in the genus Helleborus. Plant Boil. 2012, 14, 576–585. [Google Scholar] [CrossRef]
  14. Euro+Med (2006-): Euro+Med PlantBase-the information resource for Euro-Mediterranean Plant Diversity. Available online: http://ww2.bgbm.org/EuroPlusMed/ (accessed on 2 May 2020).
  15. Balázs, V.L.; Filep, R.; Ambrus, T.; Kocsis, M.; Farkas, Á.; Stranczinger, S.; Papp, N. Ethnobotanical, historical and histological evaluation of Helleborus L. genetic resources used in veterinary and human ethnomedicine. Genet. Resour. Crop. Evol. 2020, 67, 781–797. [Google Scholar] [CrossRef] [Green Version]
  16. Čakar, J.; Parić, A.; Vidic, D.; Haverić, A.; Haverić, S.; Maksimović, M.; Bajrović, K. Antioxidant and antiproliferative activities of Helleborus odorus Waldst. & Kit, H. multifidus Vis. and H. hercegovinus Martinis. Nat. Prod. Res. 2011, 25, 1969–1974. [Google Scholar] [CrossRef]
  17. Banuls, L.M.Y.; Katz, A.; Miklos, W.; Cimmino, A.; Tal, D.M.; Ainbinder, E.; Zehl, M.; Urban, E.; Evidente, A.; Kopp, B.; et al. Hellebrin and its aglycone form hellebrigenin display similar in vitro growth inhibitory effects in cancer cells and binding profiles to the alpha subunits of the Na+/K+-ATPase. Mol. Cancer 2013, 12, 33. [Google Scholar] [CrossRef] [Green Version]
  18. Reed, D.H.; Frankham, R. Society for Conservation Biology Correlation between Fitness and Genetic Diversity. Conserv. Biol. 2003, 17, 230–237. [Google Scholar] [CrossRef]
  19. Szczecińska, M.; Sramkó, G.; Wołosz, K.; Sawicki, J. Genetic Diversity and Population Structure of the Rare and Endangered Plant Species Pulsatilla patens (L.) Mill in East Central Europe. PLoS ONE 2016, 11, e0151730. [Google Scholar] [CrossRef] [Green Version]
  20. Reddy, M.P.; Sarla, N.; Siddiq, E. Inter simple sequence repeat (ISSR) polymorphism and its application in plant breeding. Euphytica 2002, 128, 9–17. [Google Scholar] [CrossRef]
  21. Mondini, L.; Noorani, A.; Pagnotta, M.A. Assessing Plant Genetic Diversity by Molecular Tools. Diversity 2009, 1, 19–35. [Google Scholar] [CrossRef] [Green Version]
  22. Yeh, F.C.; Yang, R.C.; Boyle, T.B.J.; Ye, Z.H.; Mao, J.X. POPGENE, the User-Friendly Shareware for Population Genetic Analysis; University of Alberta: Edmonton, AB, Canada, 1997. [Google Scholar]
  23. Vekemans, X.; Beauwens, T.; Lemaire, M.; Roldan-Ruiz, I. Data from amplified fragment length polymorphism (AFLP) markers show indication of size homoplasy and of a relationship between degree of homoplasy and fragment size. Mol. Ecol. 2002, 11, 139–151. [Google Scholar] [CrossRef]
  24. Peakall, R.; Smouse, P.E. GenAlEx 6: Genetic analysis in Excel. Population genetic software for teaching and research. Mol. Ecol. Notes 2006, 6, 288–295. [Google Scholar] [CrossRef]
  25. Peakall, R.; Smouse, P.E. GenAlEx 6.5: Genetic analysis in Excel. Population genetic software for teaching and research—An update. Bioinform 2012, 28, 2537–2539. [Google Scholar] [CrossRef] [Green Version]
  26. Lynch, M.; Milligan, B.G. Analysis of population genetic structure with RAPD markers. Mol. Ecol. 1994, 3, 91–99. [Google Scholar] [CrossRef]
  27. Hampl, V.; Pavlíček, A.; Flegr, J. Construction and bootstrap analysis of DNA fingerprinting-based phylogenetic trees with the freeware program FreeTree: Application to trichomonad parasites. Int. J. Syst. Evol. Microbiol. 2001, 51, 731–735. [Google Scholar] [CrossRef]
  28. Rambaut, A. FigTree, v1.3.1; beast: UK, 2010. [Google Scholar]
  29. Huff, D.R.; Peakall, R.; Smouse, P.E. RAPD variation within and among natural populations of outcrossing buffalograss [Buchloë dactyloides (Nutt.) Engelm.]. Theor. Appl. Genet. 1993, 86, 927–934. [Google Scholar] [CrossRef]
  30. Vavrek, M.J. Fossil: Palaeoecological and palaeogeographical analysis tools. Palaeontol. Electron. 2011, 14, 16. [Google Scholar]
  31. Oksanen, A.J.; Blanchet, F.G.; Friendly, M.; Kindt, R.; Legendre, P.; Mcglinn, D.; Minchin, P.R.; Hara, R.B.O.; Simpson, G.L.; Solymos, P.; et al. vegan: Community Ecology Package, version 2.5.2; CRAN, R Core Team: Cary, CA, USA, 2018. [Google Scholar]
  32. Pritchard, J.K.; Stephens, M.; Donnelly, P. Inference of population structure using multilocus genotype data. Genetics 2000, 155, 945–959. [Google Scholar]
  33. Evanno, G.; Regnaut, S.; Goudet, J. Detecting the number of clusters of individuals using the software structure: A simulation study. Mol. Ecol. 2005, 14, 2611–2620. [Google Scholar] [CrossRef] [Green Version]
  34. Earl, D.; Vonholdt, B.M. Structure Harvester: A website and program for visualizing Structure output and implementing the Evanno method. Conserv. Genet. Resour. 2011, 4, 359–361. [Google Scholar] [CrossRef]
  35. Remington, D.L.; Thornsberry, J.M.; Matsuoka, Y.; Wilson, L.M.; Whitt, S.R.; Doebley, J.; Kresovich, S.; Goodman, M.M.; Buckler, E.S. Structure of linkage disequilibrium and phenotypic associations in the maize genome. Proc. Natl. Acad. Sci. USA 2001, 98, 11479–11484. [Google Scholar] [CrossRef] [Green Version]
  36. Chamberlain, S.; Boettiger, C. R Python, and Ruby clients for GBIF species occurrence data. PeerJ Preprints 2017, 5, e3304v1. [Google Scholar] [CrossRef]
  37. Robertson, M.P.; Visser, V.; Hui, C. Biogeo: An R package for assessing and improving data quality of occurrence record datasets. Ecography 2016, 39, 394–401. [Google Scholar] [CrossRef] [Green Version]
  38. Hijmans, R.J.; Cameron, S.E.; Parra, J.L.; Jones, P.G.; Jarvis, A. Very high resolution interpolated climate surfaces for global land areas. Int. J. Clim. 2005, 25, 1965–1978. [Google Scholar] [CrossRef]
  39. Karger, D.N.; Conrad, O.; Böhner, J.; Kawohl, T.; Kreft, H.; Soria-Auza, R.W.; Zimmermann, N.E.; Linder, H.P.; Kessler, M. Climatologies at high resolution for the earth’s land surface areas. Sci. Data 2017, 4, 1–20. [Google Scholar] [CrossRef] [PubMed] [Green Version]
  40. CHELSA Database. Available online: http://chelsa-climate.org/ (accessed on 2 May 2020).
  41. Morales-Barbero, J.; Vega-Álvarez, J. Input matters matter: Bioclimatic consistency to map more reliable species distribution models. Methods Ecol. Evol. 2018, 10, 212–224. [Google Scholar] [CrossRef]
  42. Araujo, M.B.; Anderson, R.P.; Barbosa, A.M.; Beale, C.M.; Dormann, C.F.; Early, R.; Garcia, R.A.; Guisan, A.; Maiorano, L.; Naimi, B.; et al. Standards for distribution models in biodiversity assessments. Sci. Adv. 2019, 5, eaat4858. [Google Scholar] [CrossRef] [Green Version]
  43. Jarvis, A.; Reuter, H.I.; Nelson, A.; Guevara, E. Hole-filled SRTM for the Globe Version 3, from the CGIAR-CSI SRTM 90m Database 2006. Available online: http//srtm.csi.cgiar.org (accessed on 31 April 2020).
  44. Hijmans, R.; van Etten, J. Raster: Geographic Data Analysis and Modeling. R Package Version 2014, 517, 2–12. [Google Scholar]
  45. Evans, J.S. spatialEco: Spatial Analysis and Modelling Utilities, version1.3-1; CRAN, R Core Team: Cary, CA, USA, 2020. [Google Scholar]
  46. Bornovas, I.; Rondogianni-Tsiambaou, T. Geological Map of Greece Scale 1:500,000, 2nd ed.; Inst. of Geology and Mineral Exploration, Division of General Geology and Economic Geology: Athens, Greece, 1983. [Google Scholar]
  47. Dormann, C.F.; Elith, J.; Bacher, S.; Buchmann, C.; Carl, G.; Carré, G.; Márquez, J.R.G.; Gruber, B.; Lafourcade, B.; Leitão, P.J.; et al. Collinearity: A review of methods to deal with it and a simulation study evaluating their performance. Ecography 2012, 36, 27–46. [Google Scholar] [CrossRef]
  48. Araujo, M.B.; New, M. Ensemble forecasting of species distributions. Trends Ecol. Evol. 2007, 22, 42–47. [Google Scholar] [CrossRef]
  49. Thuiller, W.; Lafourcade, B.; Engler, R.; Araujo, M.B. BIOMOD—A platform for ensemble forecasting of species distributions. Ecography 2009, 32, 369–373. [Google Scholar] [CrossRef]
  50. Ferrier, S.; Manion, G.; Elith, J.; Richardson, K. Using generalized dissimilarity modelling to analyse and predict patterns of beta diversity in regional biodiversity assessment. Divers. Distrib. 2007, 13, 252–264. [Google Scholar] [CrossRef]
  51. Fitzpatrick, M.C.; Keller, S.R. Ecological genomics meets community-level modelling of biodiversity: Mapping the genomic landscape of current and future environmental adaptation. Ecol. Lett. 2014, 18, 1–16. [Google Scholar] [CrossRef]
  52. Manion, G.; Lisk, M.; Ferrier, S.; Nieto-Lugible, D.; Mokany, K.; Fitzpatrick, M.C. gdm: Generalized Dissimilarity Modeling, version 1.3.7; CRAN, R Core Team: Cary, CA, USA, 2018. [Google Scholar]
  53. R Core Development Team. R: A language and Environment for Statistical Computing; R Foundation for Statistical Computing: Vienna, Austria, 2019. [Google Scholar]
  54. Rahbek, C. The elevational gradient of species richness: A uniform pattern? Ecography 1995, 18, 200–205. [Google Scholar] [CrossRef]
  55. Hoffmann, A.A.; Sgrò, C.M. Climate change and evolutionary adaptation. Nature 2011, 470, 479–485. [Google Scholar] [CrossRef]
  56. Pauls, S.U.; Nowak, C.; Bálint, M.; Pfenninger, M. The impact of global climate change on genetic diversity within populations and species. Mol. Ecol. 2012, 22, 925–946. [Google Scholar] [CrossRef] [PubMed]
  57. Nelson, M.F.; Anderson, N.O. How many marker loci are necessary? Analysis of dominant marker data sets using two popular population genetic algorithms. Ecol. Evol. 2013, 3, 3455–3470. [Google Scholar] [CrossRef] [PubMed]
  58. Nybom, H. Comparison of different nuclear DNA markers for estimating intraspecific genetic diversity in plants. Mol. Ecol. 2004, 13, 1143–1155. [Google Scholar] [CrossRef]
  59. Hogbin, P.M.; Peakall, R. Evaluation of the Contribution of Genetic Research to the Management of the Endangered Plant Zieria prostrata. Conserv. Boil. 1999, 13, 514–522. [Google Scholar] [CrossRef]
  60. Ellstrand, N.C.; Elam, D.R. Population Genetic Consequences of Small Population Size: Implications for Plant Conservation. Annu. Rev. Ecol. Syst. 1993, 24, 217–242. [Google Scholar] [CrossRef]
  61. Slatkin, M.; Excoffier, L. Serial Founder Effects during Range Expansion: A Spatial Analog of Genetic Drift. Genetics 2012, 191, 171–181. [Google Scholar] [CrossRef] [Green Version]
  62. Grdiša, M.; Radosavljević, I.; Liber, Z.; Stefkov, G.; Ralli, P.; Chatzopoulou, P.S.; Carović-Stanko, K.; Satovic, Z. Divergent selection and genetic structure of Sideritis scardica populations from southern Balkan Peninsula as revealed by AFLP fingerprinting. Sci. Rep. 2019, 9, 1–14. [Google Scholar] [CrossRef] [Green Version]
  63. Larena, B.G.; Aguilar, J.F.; Feliner, G.N. Glacial-induced altitudinal migrations in Armeria (Plumbaginaceae) inferred from patterns of chloroplast DNA haplotype sharing. Mol. Ecol. 2002, 11, 1965–1974. [Google Scholar] [CrossRef] [Green Version]
  64. Kramp, K.; Huck, S.; Niketić, M.; Tomović, G.; Schmitt, T. Multiple glacial refugia and complex postglacial range shifts of the obligatory woodland plant Polygonatum verticillatum (Convallariaceae). Plant Boil. 2009, 11, 392–404. [Google Scholar] [CrossRef] [PubMed]
  65. Strid, A. The mountain flora of Greece with special reference to the Anatolian element. Proc. R. Soc. Edinburgh. Sect. B. Boil. Sci. 1986, 89, 59–68. [Google Scholar] [CrossRef]
  66. Feidas, H.; Karagiannidis, A.; Keppas, S.; Vaitis, M.; Kontos, T.; Zanis, P.; Melas, D.; Anadranistakis, E. Modeling and mapping temperature and precipitation climate data in Greece using topographical and geographical parameters. Theor. Appl. Clim. 2013, 118, 133–146. [Google Scholar] [CrossRef]
  67. Parmesan, C. Ecological and Evolutionary Responses to Recent Climate Change. Annu. Rev. Ecol. Evol. Syst. 2006, 37, 637–669. [Google Scholar] [CrossRef] [Green Version]
  68. McInerny, G.; Turner, J.; Wong, H.; Travis, J.M.; Benton, T.G. How range shifts induced by climate change affect neutral evolution. Proc. R. Soc. B Boil. Sci. 2009, 276, 1527–1534. [Google Scholar] [CrossRef] [Green Version]
  69. Riddle, B.R.; Dawson, M.N.; Hadly, E.A.; Hafner, D.J.; Hickerson, M.J.; Mantooth, S.J.; Yoder, A.D. The role of molecular genetics in sculpting the future of integrative biogeography. Prog. Phys. Geogr. Earth Environ. 2008, 32, 173–202. [Google Scholar] [CrossRef] [Green Version]
  70. Scoble, J.; Lowe, A. A case for incorporating phylogeography and landscape genetics into species distribution modelling approaches to improve climate adaptation and conservation planning. Divers. Distrib. 2010, 16, 343–353. [Google Scholar] [CrossRef]
  71. Eckert, C.G.; Samis, K.E.; Lougheed, S.C. Genetic variation across species’ geographical ranges: The central–marginal hypothesis and beyond. Mol. Ecol. 2008, 17, 1170–1188. [Google Scholar] [CrossRef]
  72. Sagarin, R.; Gaines, S.D. The ‘abundant centre’ distribution: To what extent is it a biogeographical rule? Ecol. Lett. 2002, 5, 137–147. [Google Scholar] [CrossRef]
Figure 1. A two-dimensional plot of the principal coordinates analysis (PCoA) of ISSR data showing the clustering of the populations.
Forests 11 00620 g001
Figure 2. Genetic diversity and structure of eight populations of Helleborus odorus subsp. cyclophyllus from Greece. Genetic structure derived from Bayesian analysis using STRUCTURE at K = 3. The size of the dots is directly proportional to the depicted values of Nei’s gene diversity (Hj) for each population.
Forests 11 00620 g002
Figure 3. UPGMA dendrogram based on Jaccard’s coefficient illustrating the genetic similarities of 80 Helleborus odorus subsp. cyclophyllus individuals from different populations.
Forests 11 00620 g003
Figure 4. Predicted potential distribution map for 2070 and the CCSM4 GCM and the RCP 2.6 scenario. Red grid cells: the species currently occupies those areas but will not in the future. Blue grid cells: the species currently occupies those areas and will continue to occupy them in the future. Grey grid cells: the species does not currently occupy those areas and it will not occupy them in the future. The dotted line indicates the distribution area of Helleborus odorus subsp. cyclophyllus based on the alpha-hull method. Climate data refer to the WorldClim database.
Forests 11 00620 g004
Figure 5. Mean predicted genetic offset from the Generalized Dissimilarity Modelling analyses based on the four Representative Concentration Pathways and the three Global Circulation Models included in our study from the WorldClim climate database.
Forests 11 00620 g005
Table 1. Abbreviations used for the analyses, locality, and collection information of the Helleborus odorus subsp. cyclophyllus populations under study.
PopulationPopulation IDLatitudeLongitudeAltitudePart of Greece Habitat
ErymanthosERY37.950421.7669950 mWestForest openings with Abies cephalonica
VelouchiVEL38.928521.86831400 mWestShrubs
ParnassosPAR38.539722.7038700 mEastForest openings with Abies cephalonica
VourgareliVOU39.368421.1919750 mWestForest edges with Fagus sylvatica & Abies borisii-regis
Fragma MesachorasFRA39.468321.3199850 mWestForest edges with Fagus sylvatica & Abies borisii-regis
NaousaNAOU40.654822.00241050 mEastForest edges with Fagus
OlymposOLY40.117822.4881400 mEastForest openings with Quercus ilex & Q. rotundifolia
DirfiDIR38.611223.86021100 mEastForest openings with Abies cephalonica
Table 2. Primers used for ISSR analysis; primers’ sequences; annealing temperatures; number and range of bands scored for each primer used.
Primer IDPrimer Sequence (5′–3′)Tm (°C)No of Bands ScoredRange (bp)
UBC-807(AG)₈T5219420–2000
UBC-811(GA)₈T5222430–1980
UBC-819(GT)₈A529650–1190
UBC-821(GT)₈T48.67950–1780
UBC-822(CT)₈A45.713680–2000
UBC-826(AC)₈C5214670–1800
UBC-840(GA)₈YT45.717470–1500
UBC-845(CT)₈RG45.7101000–2400
UBC-869(GTT)₆5191100–2470
UBC-880(GGAG)45114470–1560
Table 3. Genetic diversity as detected by ISSR markers; N = numbers of individuals surveyed from each population; No. B = number of scored bands PPB = Percentage of Polymorphic Bands; PrB = private bands; I = Shannon’s Information index; Hj = Nei’s gene diversity after Lynch and Milligan (1994) assuming Hw equilibrium (Hj–HWE) or complete shortage of heterozygotes (Hj–non HWE); Nm = estimate of gene flow among populations.
Population IDNNo.BPPB (%)PrBIHj–HWEHj–non HWENm
ERY108755.22130.3167 ± 0.0260.2719 ± 0.0170.2317 ± 0.018
VEL1011576.87120.3951 ± 0.0220.3319 ± 0.0130.3490 ± 0.015
PAR109866.4290.3368 ± 0.0240.2781 ± 0.0150.2910 ± 0.017
VOU1011275.37110.3843 ± 0.0230.3208 ± 0.0140.3395 ± 0.016
FRA1011175.37100.3788 ± 0.0230.3131 ± 0.0140.3274 ± 0.016
NAOU1010871.64120.3745 ± 0.0240.3171 ± 0.0150.3214 ± 0.017
OLY108443.28260.2322 ± 0.0250.2239 ± 0.0160.2010 ± 0.018
DIR109458.96150.2983 ± 0.0240.2613 ± 0.0160.2592 ± 0.018
Mean 0.3396 ± 0.0090.2898 ± 0.0130.2901 ± 0.0191.3098

