Article

Estimation of Aboveground Oil Palm Biomass in a Mature Plantation in the Congo Basin

by
Pierre Migolet
1,*,
Kalifa Goïta
1,
Alfred Ngomanda
2 and
Andréana Paola Mekui Biyogo
3
1
Centre D’Applications et de Recherches en Télédétection (CARTEL), Département de Géomatique Appliquée, Université de Sherbrooke, 2500 Boulevard de l’Université, Sherbrooke, QC J1K 2R1, Canada
2
Commissariat Général du Centre National de la Recherche Scientifique et Technologique (CENAREST), Libreville, B.P 842 Libreville, Gabon
3
Independent Geomatics Consultant, Former Employee of Olam Palm Gabon, 79 rue du Radoux, 1430 Rebecq, Belgique
*
Author to whom correspondence should be addressed.
Forests 2020, 11(5), 544; https://doi.org/10.3390/f11050544
Submission received: 30 March 2020 / Revised: 5 May 2020 / Accepted: 11 May 2020 / Published: 12 May 2020

Abstract

:
Agro-industrial oil palm plantations are becoming increasingly established in the Congo Basin (West Equatorial Africa) for mainly economic reasons. Knowledge of oil palm capacity to sequester carbon requires biomass estimates. This study implemented local and regional methods for estimating palm biomass in a mature plantation, using destructive sampling. Eighteen 35-year-old oil palms with breast height diameters (DBH) between 48 and 58 cm were felled and sectioned in a plantation located in Makouké, central Gabon. Field and laboratory measurements determined the biomasses of different tree compartments (fruits, leaflets, petioles, rachises, stems). Fruits and leaflets contributed an average of 6% to total aboveground palm biomass, which petioles accounted for 8%, rachises for 13% and the stem, 73%. The best allometric equation for estimating stem biomass was obtained with a composite variable, formulated as DBH2 × stem height, weighted by tissue infra-density. For leaf biomass (fruits + leaflets + petioles + rachises), the equation was of a similar form, but included the leaf number instead of infra-density. The allometric model combining the stem and leaf biomass yielded the best estimates of the total aboveground oil palm biomass (coefficient of determination (r2) = 0.972, p < 0.0001, relative root mean square error (RMSE) = 5%). Yet, the model was difficult to implement in practice, given the limited availability of variables such as the leaf number. The total aboveground biomass could be estimated with comparable results using DBH2 × stem height, weighted by the infra-density (r2 = 0.961, p < 0.0001, relative RMSE (%RMSE) = 5.7%). A simpler model excluding infra-density did not severely compromise results (R2 = 0.939, p < 0.0003, %RMSE = 8.2%). We also examined existing allometric models, established elsewhere in the world, for estimating aboveground oil palm biomass in our study area. These models exhibited performances inferior to the best local allometric equations that were developed.

Graphical Abstract

1. Introduction

The world is becoming increasingly concerned with changes that are occurring in ecosystems and in the climate. These changes are manifested in and exacerbated by forest conversion into agricultural land. This process is a major driver of global deforestation. Results of the Global Forest Resources Assessment [1] have indicated that the total forest area has declined by about 3%, from a worldwide estimate of 4128 Mha in 1990 to 3999 Mha in 2015 [2]. These losses are responsible for increasing greenhouse gas (GHG) emissions and incurring substantial changes in the amounts of carbon that are stored in forested ecosystems [3]. Indeed, a global loss of forest biomass carbon in the order of 11.1 gigatons has been reported over 25 years (from 1990 to 2015); this represents a 3.8% decrease in storage from an initial 296 Gt estimate of the total forest C [1]. The intensification of forest- and agriculture-related economic activities largely explains this change. For example, tropical forested areas are being converted into oil palm plantations to meet economic (biofuel, palm oil), social (food, household products, cosmetics, soap), cultural (traditional medicines and other care products) or scientific needs [4,5,6]. An increase in these needs has led to the development and expansion of agro-industrial oil palm plantations in tropical Asia, Oceania, Africa and Amazonia [7,8,9].
Several species of oil palms have been naturalized throughout the world. Currently, the Afrotropical species Elaeis guineensis Jacq. (African oil palm) is the palm most extensively cultivated for oil production. The Neotropical Elaeis oleifera (Kunth) Cortés (American oil palms), which also produce oil, have been rarely exploited commercially. Hybridization with E. oleifera has increased the disease resistance of E. guineensis, while improving its biochemical and physiological characteristics [10,11].
These latter species, together with palms within the genera Euterpe and Astrocaryum, have not been extensively domesticated given that they tend to occur as solitary individuals or small groups within intact tropical forest and in seral stages leading to mature stand canopy closure. Nonetheless, these species are cultivated as food crops (including açai berry and hearts of palm); the small quantities of oil extracted from their edible fruits are used in salads or as ingredients in soaps and cosmetics [12].
Resulting land use changes have exerted effects especially on the capacity of ecosystems to sequester and store carbon in the plants of which they are composed. In the case of oil palms, this capacity may increase or decrease, depending upon the ecosystems that they frequently replace [9,13,14]. In mature forests, oil palms generally cause a loss in the quantity of carbon that is stored, whereas they favor an increase in storage in fallow land and savannah areas [6,14,15]. As a result, this variation in storage can have repercussions for the climatic and environmental equilibria in the affected tropical regions [1]. An important challenge is the ability to exploit and develop agricultural areas, such as agro-industrial plantations, without compromising or damaging the ecological integrity of the broader continuous forest (e.g., [5]). Such actions would help to accentuate the trend towards decelerating deforestation rates that has been noted by the Food and Agriculture Organization (FAO) [1]. Indeed, the loss of tropical forest area declined by 42% to 5.5 Mha year−1 during the period 2010–2015, from the estimated 9.5 Mha year−1 during the 1990s [2].
To improve attempts in land use redevelopment, it is important to have a better understanding of forest and agricultural biomass stocks, together with their respective spatial and temporal dynamics. The current study developed allometric models to estimate the total aboveground biomass of oil palms in a particular region, namely the Congo Basin. We aimed at determining which components of the total aboveground biomass were most effective and efficient in constructing these allometric equations. Total aboveground biomass is the total dry mass of aboveground organic material that is present in different plant compartments, including the stem, branches, leaves, stumps and bark [16]. The total biomass represents an important carbon storage reservoir within the plant and also constitutes the part that is most vulnerable to human activities and natural perturbations, regardless of whether these effects are acute or chronic.
A number of studies have been conducted to gather data on the total dry aboveground biomass of oil palms in targeted tropical areas of Africa, Amazonia and Asia [4,17,18,19]. The resulting allometric equations rely upon characteristic attributes of oil palms (and palms, in general), such as diameter, height, wood infra-density (stem dry mass vs. fresh volume), dry mass fraction and the number of leaves or age to estimate the biomass at different stages of tree development (young, mid-mature, mature). These attributes are frequently used as simple [4,20] or as composite [21,22,23] explanatory variables. In Benin, Thenkabail et al. [20] estimated the aboveground biomass of young oil palm trees (1- to 5-years-old) using stem height. In another study conducted in Benin, Aholoukpè et al. [24] proposed a simple equation for estimating the biomass of oil palm fronds using the dry mass of the rachis, i.e., the axis of the compound leaf. Khalid et al. [4] predicted the biomass for mid-mature (23-years-old) Malaysian oil palm plantations by considering the total height as the explanatory variable. Saldarriaga et al. [18] developed equations in which the squared value of the DBH (diameter at breast height, measured at 1.3 m), together with the stem height, were used to estimate the plant biomass. In this case, the plants were relatively young, with DBHs ranging between 1 and 10 cm. The same variable combination expressed as DBH2 × stem height was used by Hughes et al. [25] in southern Mexico to estimate biomass for wild palms (Astrocaryum mexicanum Liebm. ex Mart.) with DBHs < 10 cm. Cole and Ewel [26] also considered the same variable combination for four economically valuable forest species, but also included the leaf count in the estimation of the aboveground biomass in açai palm (Euterpe oleracea Mart.) plantations (DBH < 20 cm) in the Atlantic Lowlands of Costa Rica. Goodman et al. [27] studied the allometric relationships of nine species in the Arecaceae, including Attalea phalerata Mart. ex Sprung, which is a source of vegetable oil [28]. These authors substituted the dry-matter fraction for the leaf count in palm plantations covering all the stages of development (DBH between 4 and 50 cm) in Amazonian Peru, while Da Silva et al. [22] considered the stem infra-density in the case of young (DBH 3–13 cm) forest açai or açaí-solitário (Euterpe precatoria Mart.) in Amazonian Brazil.
All of these studies have provided various explanatory variables for estimating the aboveground biomass of palms worldwide, including those that produce oil. The performances of these different variables have yet to be compared in the same study. Furthermore, the allometric equations of these studies have not been compared with local allometric models for estimating the aboveground biomass of oil palms that were established in the Congo Basin (West Equatorial Africa). The oil palms that were used in these studies were consistently young, with a few cases of semi-mature and mature individuals. However, there is little research on mature individuals (>30-years-old).
Research estimating oil palm biomass is relatively sparse for the Congo Basin. Considering the gradual but relentless establishment of oil palm plantations, it is crucial that estimation methods be developed and comparative analyses be conducted relative to other tropical regions. Thus, the current study sought (1) to evaluate the attributes that were most relevant for characterizing the aboveground biomass of oil palm plantations in the Congo Basin, and (2) to develop the necessary allometric equations and compare their results with those that have been obtained from other tropical areas. This study was based upon field measurements that were acquired through destructive sampling in agro-industrial oil palm plantations operated by the Société Olam Palm Gabon.

2. Materials and Methods
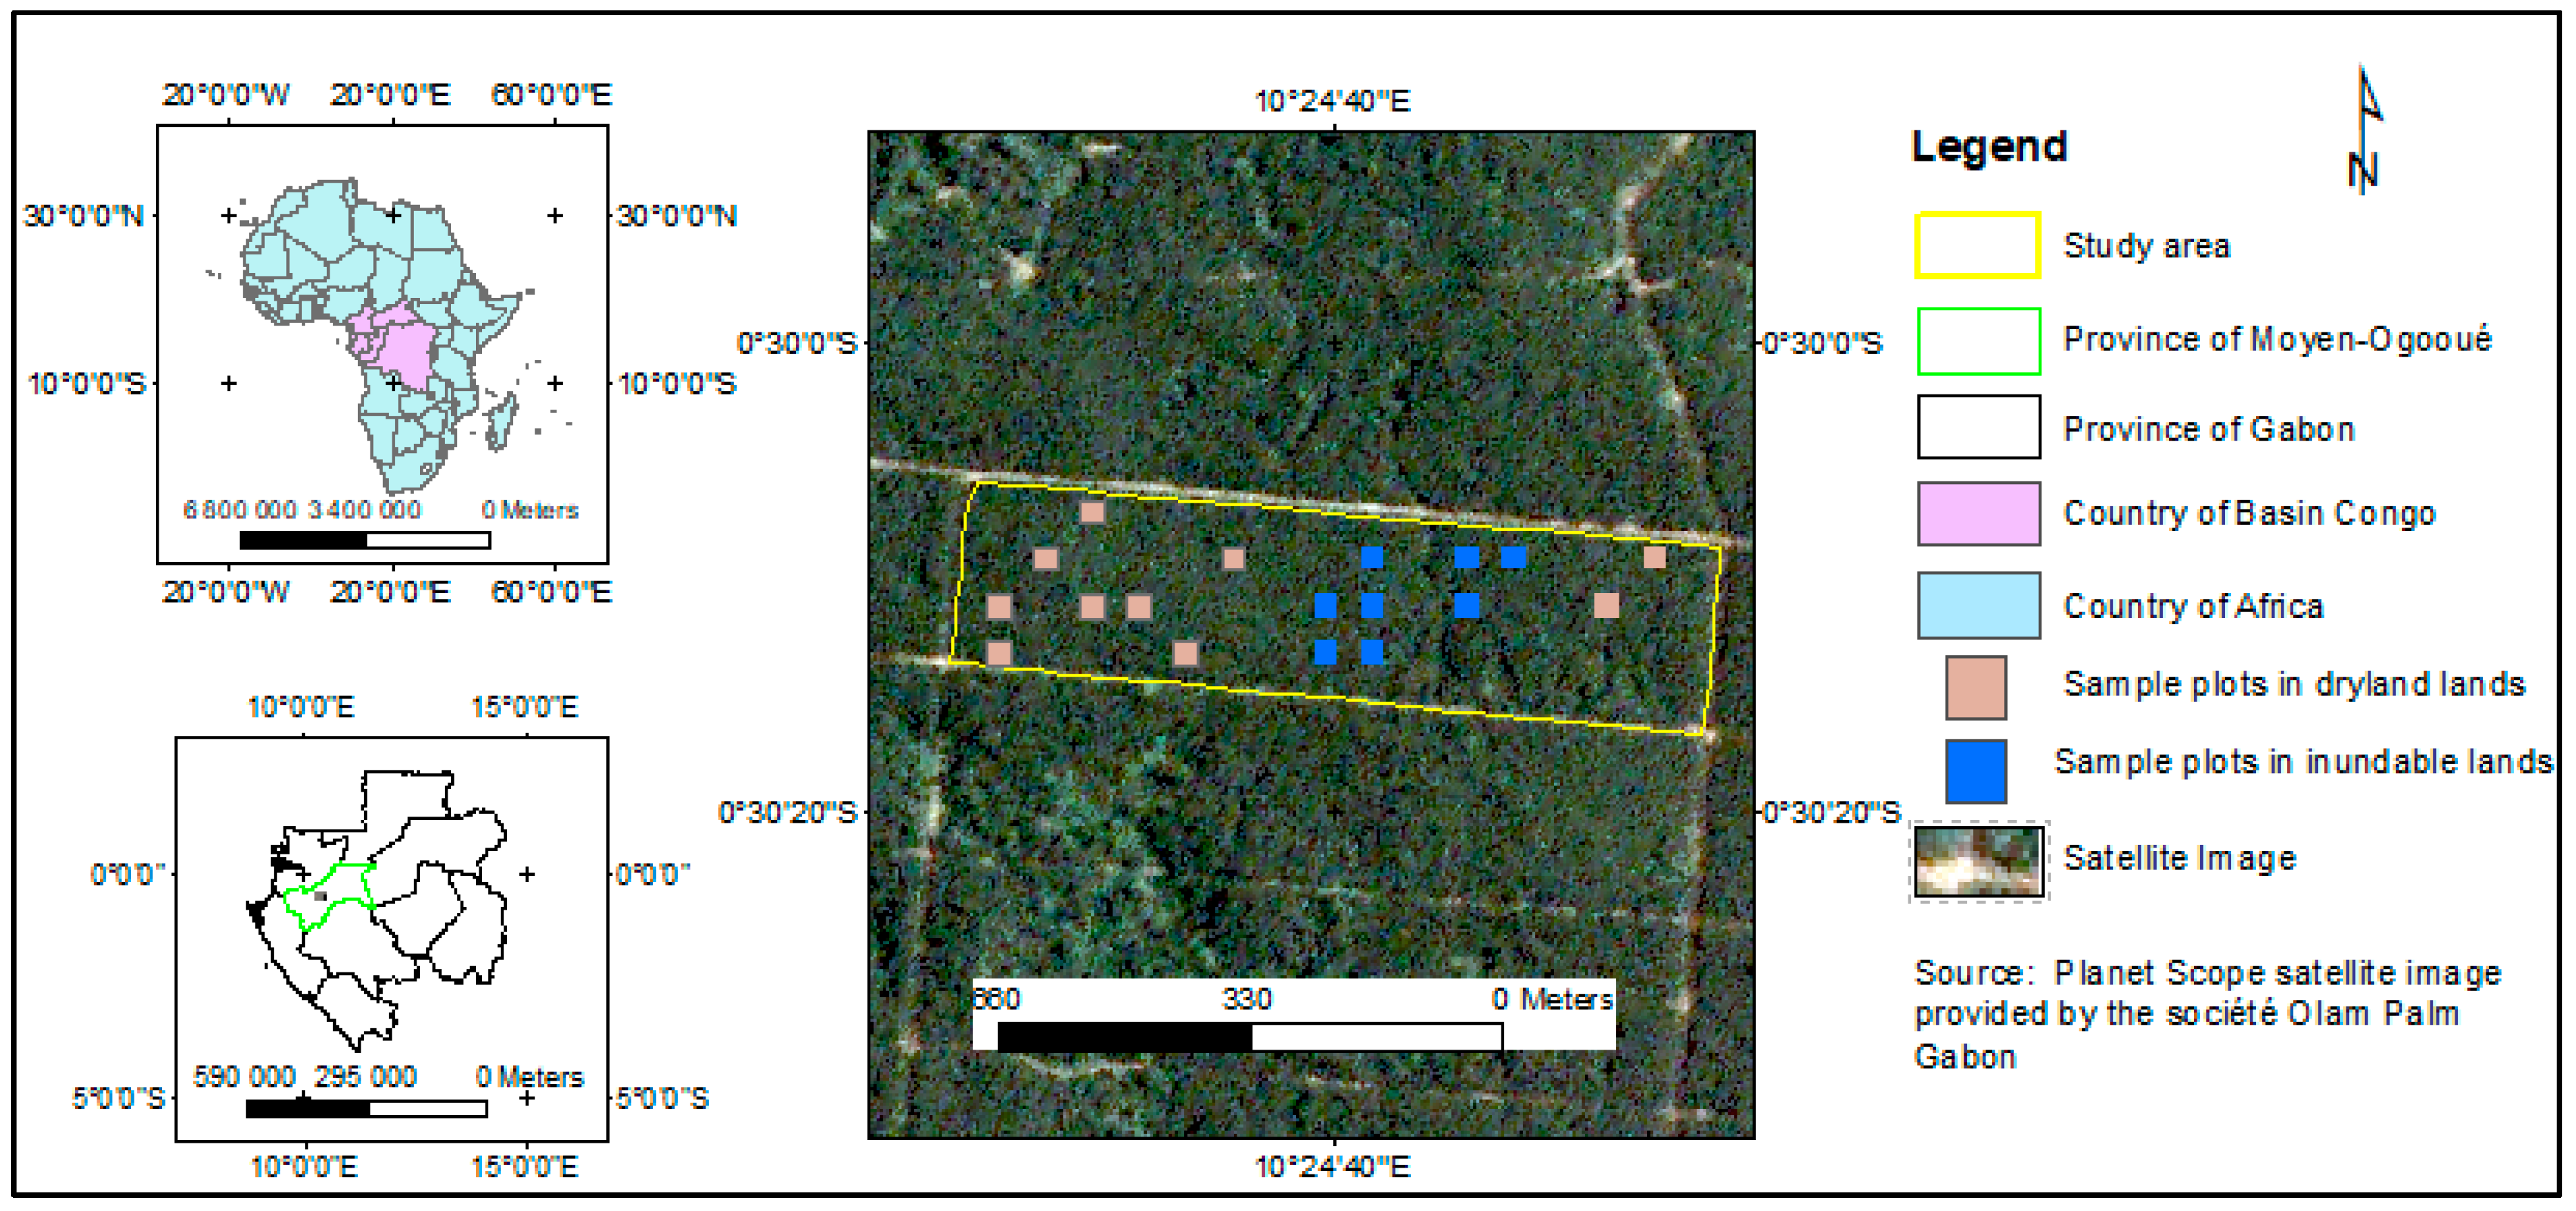
2.1. Study Area

The oil palms were sampled in a plantation operated by the Société Olam Palm Gabon, which is located in the Makouké district, Moyen Ogooué Province, central Gabon. The region is characterized by a hot and humid equatorial climate, with two rainy seasons and two dry seasons. The plantation adjoins the Ogooué River, which is the largest river in Gabon. The temperatures in the area range from 27 °C to 38 °C and precipitation reaches 1800 to 2000 mm annually. The plantation is located on a ferralitic Cambisol-dominant soil. Established in 1981, it is the oldest plantation of oil palm in Gabon. It currently covers 5700 ha, with an average density of 134 oil palm trees per hectare. Mature oil palms represent an area of about 1500 ha. The plantation is divided into blocks. One of these blocks was the study area, located between longitudes 10°24′27′′ E and 10°24′57′′ E, and latitudes 0°30′06′′ S and 0°30′16′′ S (Figure 1). The block considered covered an area of 25 ha (1000 m × 250 m). The palm trees inside the block were mature and were planted in both dry and flooded areas (Figure 1).
In 2019, the plantation obtained “Roundtable on Sustainable Palm Oil” (RSPO) certification for its efforts to protect the environment and encourage sustainable development by complying with global standards for sustainable palm oil. The RSPO certification committed Olam Palm Gabon to respecting several principles and criteria for managing the plantation, including among others (1) reducing deforestation, (2) encouraging the responsible use of agro-chemical products in the production system and (3) avoiding conflicts between local communities and plantation owners. The implementation of all these actions contributed to the sustainable exploitation of oil palm trees. The company’s commitment to not convert primary forests, areas of high conservation value, peatlands as well as land belonging to local communities into plantations, considerably limits deforestation.
Although located in the heart of the tropical forest in the Congo Basin, the area where the stuied plantation was positioned cannot be considered as fully representative of the conditions prevailing throughout the whole basin, which is a very large region. Nevertheless, it reflected certain similar natural aspects, notably in terms of tropical forest, biodiversity, climate, soil type and hydrography.

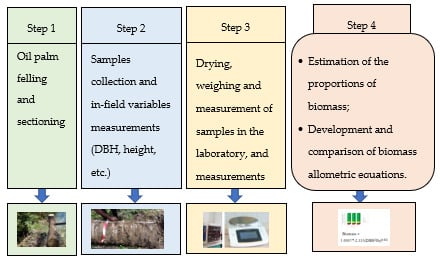
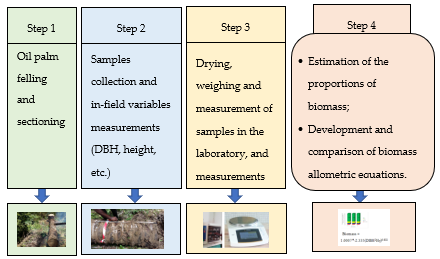
2.2. Data Collection

2.2.1. Field Data Measurement

The sampling was conducted in a 35-year old plantation. In this area, eighteen oil palms were felled during the rainy season in October 2017 to obtain information on their aboveground biomass. Each felled palm tree was randomly selected within a 30.8 m × 30.8 m sample plot across the plantation block. The sample plots were randomly located in the study block. Eight of them were located in flood prone areas, while ten were on drylands (Figure 1). The individuals were healthy and not deformed by disease. The DBH of each selected palm, together with its stem height (HT) and total height (HTOT), were recorded using a standard measuring tape (DBH in cm and heights in m). The stem height was measured from the stump to the first branch, while the total height was taken from the stump to the top of the crown. The total number of leaves (NF) on each palm was also counted. Following these measurements, the palm stem was sectioned into logs at fixed 0.5 m increments. The diameters and heights of the palm trees in the flood prone and neighboring areas were smaller (less than 52 cm for DBH and less than 16.4 m for HTOT) than those located on the dryland (more than or equal to 52 cm for DBH and 15.1 m for HTOT). The basic statistics of the measurements that were taken in the field are summarized in Table 1.
Once the measurements were taken and the stem was sectioned, each oil palm was separated into different components, namely the stem elements and the leaves, which included the petioles, rachis, leaflets and the fruits. The fresh mass of each component was immediately recorded using a one-ton scale. Subsamples were then taken from each component. Stem samples were taken from the first three cut logs, starting with the stump from the middle, and then from the crownward end of the stem. Samples were taken from the butt or bottom end of each log, in the form of a right angled triangle that varied in thickness from 2.7 to 4.8 cm, and from 12 to 48 cm for the lengths of the sides forming the right angle of the triangle. The same samples represented one-quarter of the large end of the stem section. Following weighing, all samples were inserted into numbered freezer bags for laboratory determinations. A summary of all the data on oil palms is presented in Table A1.

2.2.2. Laboratory Measurements

Subsamples that were taken from the components of the 18 individuals palms (stems, petioles, rachis, leaflets and fruit) were dried under ambient air conditions and then placed in drying oven (or steamer) at 105 °C (except for the leaflets, 65 °C) to obtain wet-to-dry conversion factors. Six oil palms were selected to obtain dried fruit masses, but not all of the individuals bore fruit. The individual components were dried to constant mass (3 consecutive days) [27,29,30] and weighed on a 5 kg balance. Thus, the dry mass fraction (DMF) of each sample per component (stems, petioles, rachis, fruit and leaflets) was calculated as the ratio of the dry mass that was recorded in the laboratory to the corresponding fresh mass that was obtained in the field for each oil palm. A mean DMF value was determined for each component. Table 2 summarizes the means that were obtained for each component and for the whole palm tree.
Finally, the fresh masses that were obtained in the field for each component of an oil palm were multiplied by the corresponding average DMF to obtain their respective dry masses. From these corrected values, it was then possible to determine the total dry mass of an individual oil palm. The dry mass: total fresh mass ratios of the palms allowed us to estimate the DMF for each of the 18 palms. The total dry masses of the different compartments of the 18 oil palms are presented in Table 2. In the laboratory, the infra-density (ρ) of the oil palm stem tissue was determined according to the protocol of Rondeux [31], and Bauwens and Fayolle [32]. The mean infra-density of the oil palm stems is also presented in Table 2.

2.3. Establishment and Validation Allometric Models

The data analyses were performed using the XLSTAT software (https://www.xlstat.com/fr/). Scatterplots were created to better understand the distributions of the data. Consequently, outliers were identified and checks were performed to detect the possible sources of error. Only data that were correctly identified and reported were retained for the purposes of this study. Using data from the 18 oil palm trees, two classes of DBH (48–54 cm and 54–58 cm) were established to determine the proportions of biomass. The DBH class of 48-54 cm had 11 oil palms and that of 54–58 cm had 7 oil palms.
The basic expression that was employed in this research for creating the allometric equations took the following form [33]:
y = a X b ,
where y is the dependent variable (dry aboveground biomass), X is the product of one or more independent variables (e.g., DBH) and a and b are empirically estimated scaling factors. Typically, the loge-transformed form of the equation is used to linearize the expression, while at the same time homogenizing the variance, which increases the validity of statistical tests that are being used [34,35,36]. The equation can be rewritten as
ln ( y ) = ln ( a ) + b ln ( X ) ,
The independent variables that were considered here are DBH, HT, HTOT, ρ and NF. To obtain unbiased estimations with log-transformed models, the bias caused by the conversion of ln (y) to the original non-transformed scale y, should be corrected. The correction factor (CF) was used to make this correction [26,27,30], such as CF = exp(root mean square error (RMSE) 2/2), where RMSE is the mean square error of the regression equation. The original untransformed scale of y could be obtained by y = (CF × a)Xb [30]. To develop the equations, 60% of the oil palms were randomly selected and used (i.e., 11 of 18 palms). The remaining 40% (7 oil palms) were set aside for the independent validation of the results. Both the data for development and validation were randomly located over drylands and flood prone areas.
The performance of the established models was evaluated using different metrics. These included the coefficient of determination (r2), the residual standard error (σ), the Akaike information criterion (AIC), the relative error (ER), the relative percentage error (%ER), and the root mean square error (RMSE) and its percentage (%RMSE). Similar metrics have been used in previous studies [30,37,38]. The expressions for calculating ER and RMSE are as follows:
ER = i = n n [ ( y ¯ i y i ) / y i ] n ,
RMSE = i = 1 n ( y i y ¯ i ) 2 n ,
where n is the number of observations, yi is the observed value for palm i, and yi is its predicted value. The relative RMSE (%RMSE) was calculated as a percentage by dividing the RMSE by the observed mean [38]. The relative percent error (%ER) was obtained by multiplying ER by 100. The interpretation of the metrics differed when attempting to characterize the best performance. The higher the r2, the more robust the equation was considered. In contrast, the lower the AIC value, the better the model fit. In all cases, the errors (ER, %ER, σ, RMSE, %RMSE) should be as small as possible. However, Kuyah et al. [39] and Yang et al. [30] have recommended giving more weight to the bias and RMSE rather than to an adjusted r2 or AIC in deciding the final optimal model [30].
The field data that were obtained from seven randomly selected sample plots were used to validate the equations that we had developed. The same metrics were considered in the validation, except for the standard residual error. Error distributions were established to better understand the predictive performance of the models.

2.4. Comparisons with Existing Biomass Allometric Models

Previous studies by different authors have established allometric equations for estimating the dry aboveground biomass of oil palms in several tropical regions of the world, i.e., Africa, Amazonia and Asia–Oceania. Table 3 summarizes the previously published equations, which were considered here for comparison. The work covered at least four different oil palm species. Depending on the study, the equations were available for the total above-ground biomass or for specific compartments (such as stem or leaves). The data from the seven validation sample plots were used to verify the applicability of each model to our study area and to compare their performance with the equations developed in this research. Our aim was to determine whether an existing biomass model for oil palm which was developed elsewhere could be used in the Congo Basin. The evaluations were made by quantifying the errors (ER, %ER, RMSE and %RMSE) for each model relative to the data that were used.

3. Results

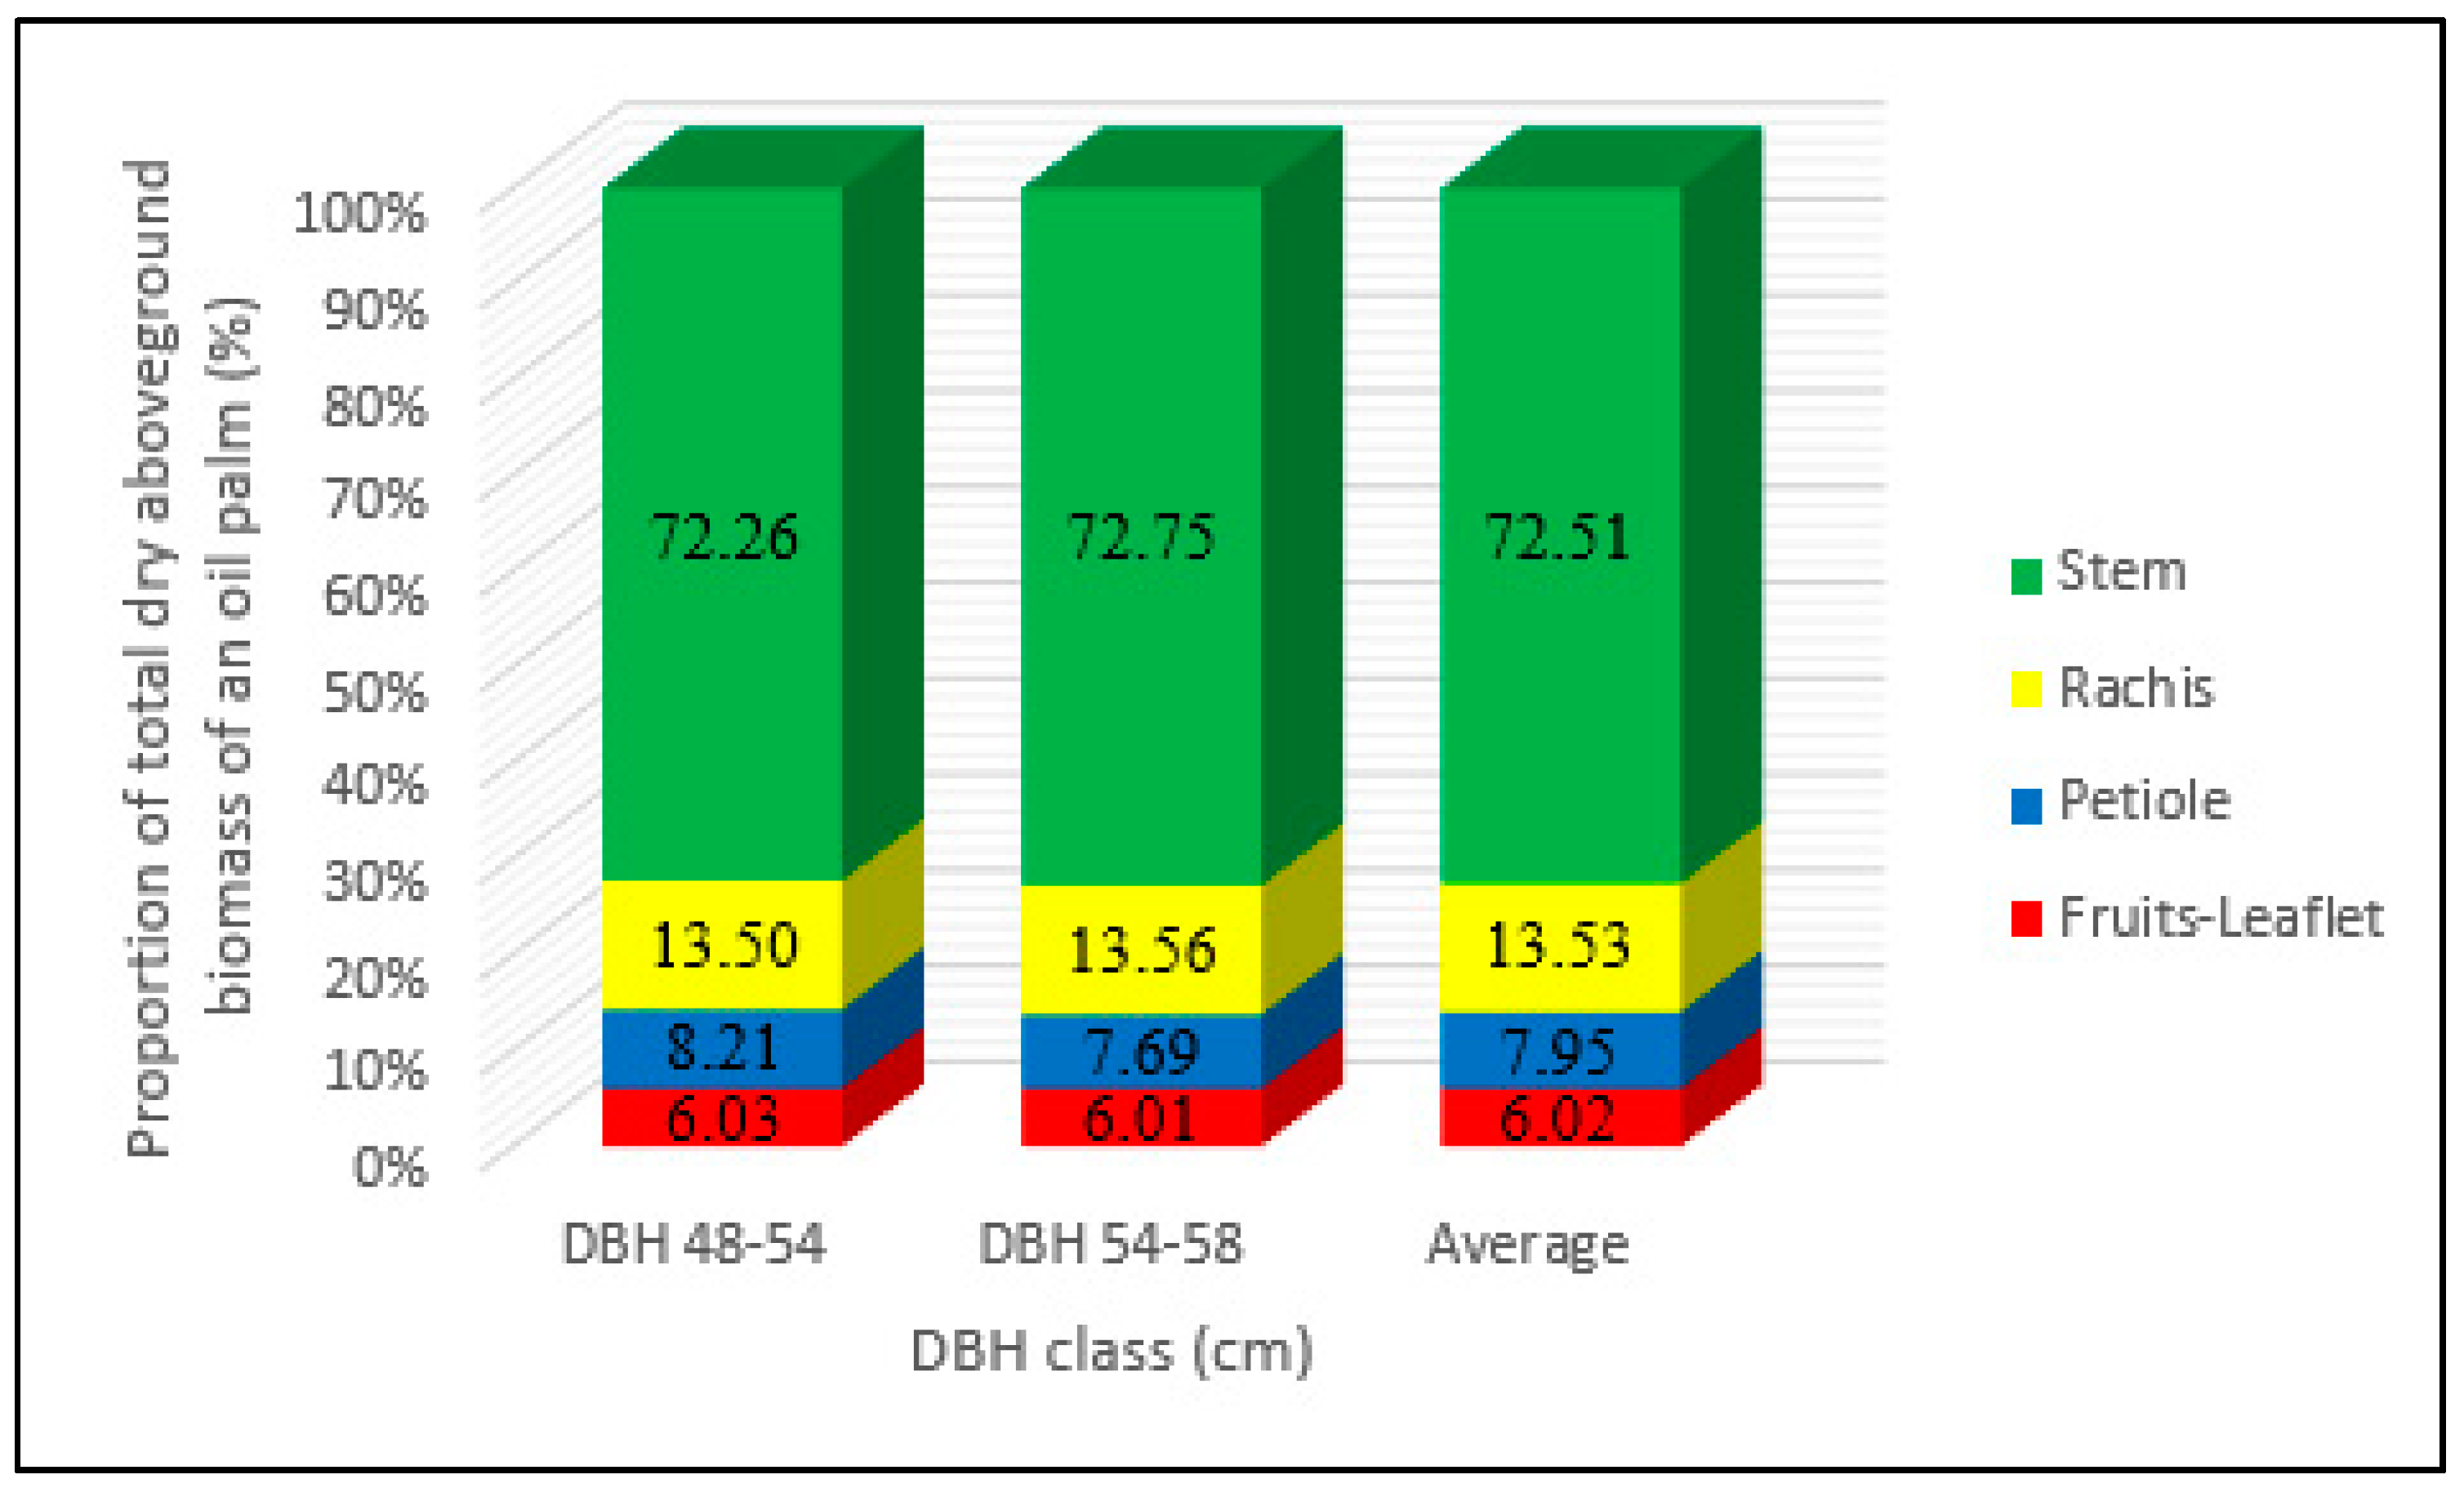
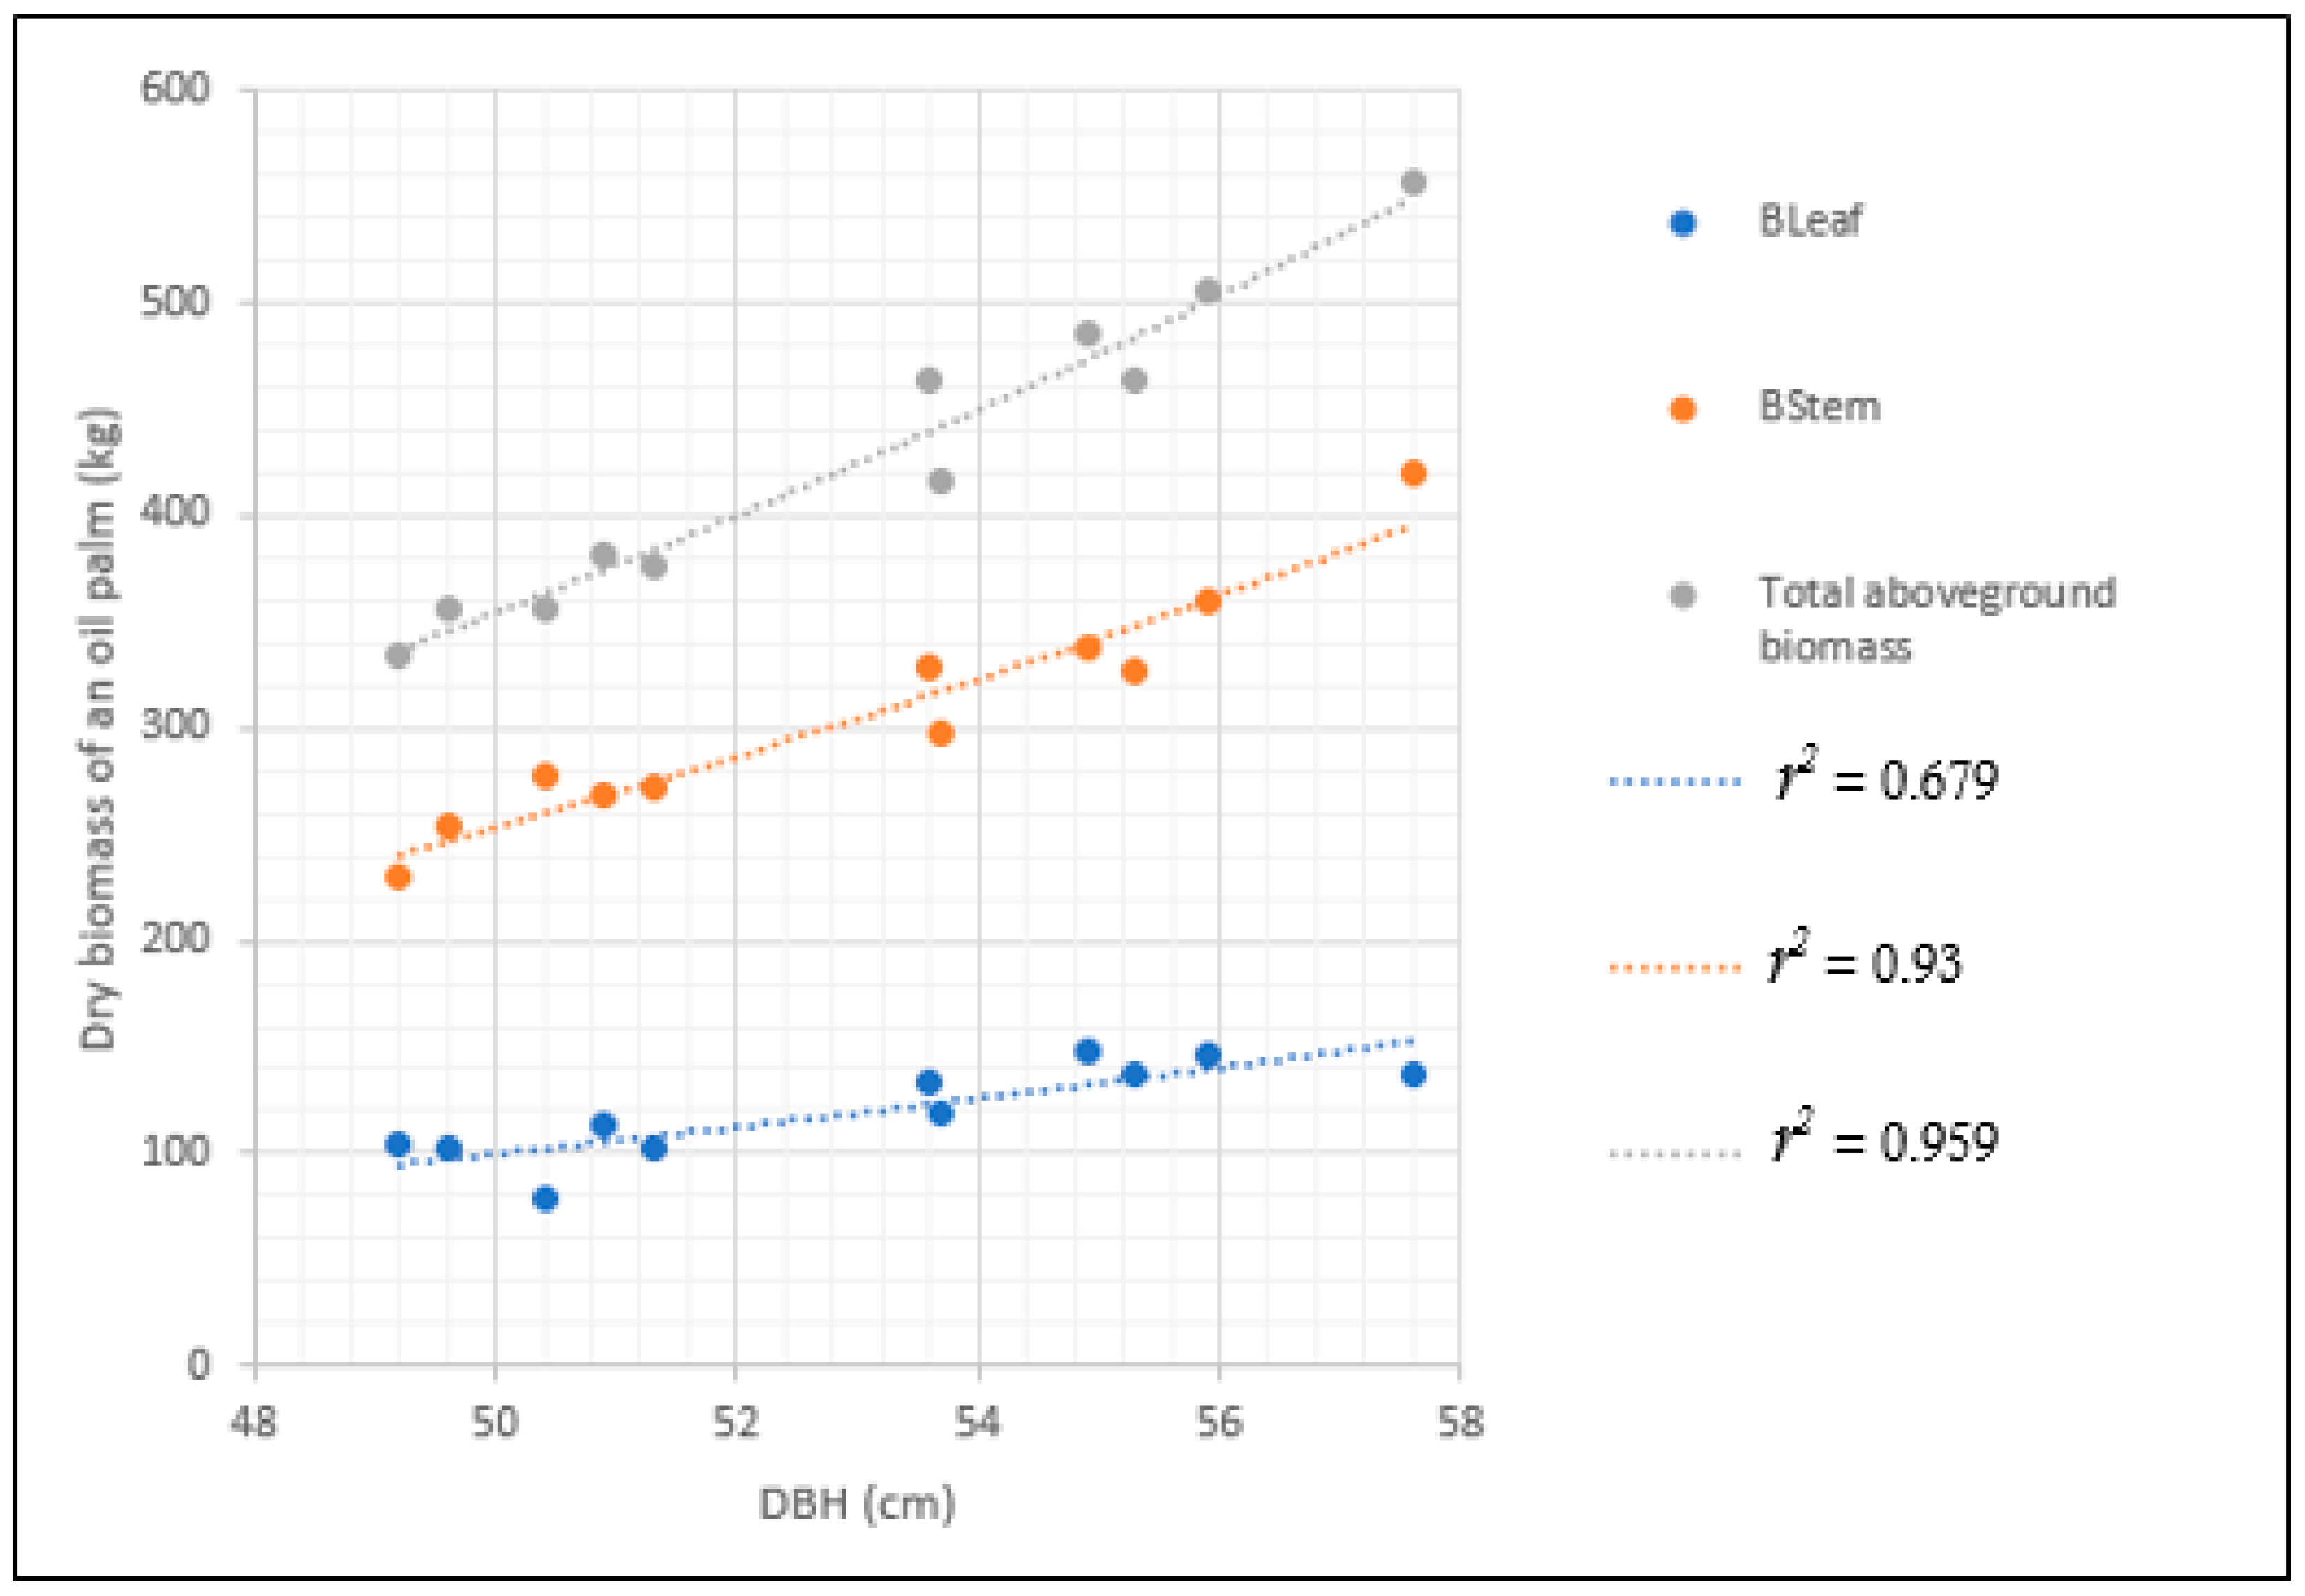
3.1. Distribution of Biomass Proportions

Average proportions are shown in Figure 2 for the aboveground oil palm biomass per compartment as a function of the DBH class. The aboveground biomass of the 18 oil palms that were sampled was concentrated mainly in the stems (72.51%). Leaf biomass (including petioles, rachises, fruits and leaflets) represented on average 27.50% of the total aboveground biomass. Average biomass proportions of rachises (13.53%) were much higher than those of petioles (7.95%) and fruits and leaflets (6.02%). The difference between the biomass proportions in each compartment by diameter class (48–54 cm vs. 54–58 cm) was analyzed by simple linear regression. Proportions did not significantly differ between the DBH classes (r2 = 0.999, p < 0.0001).

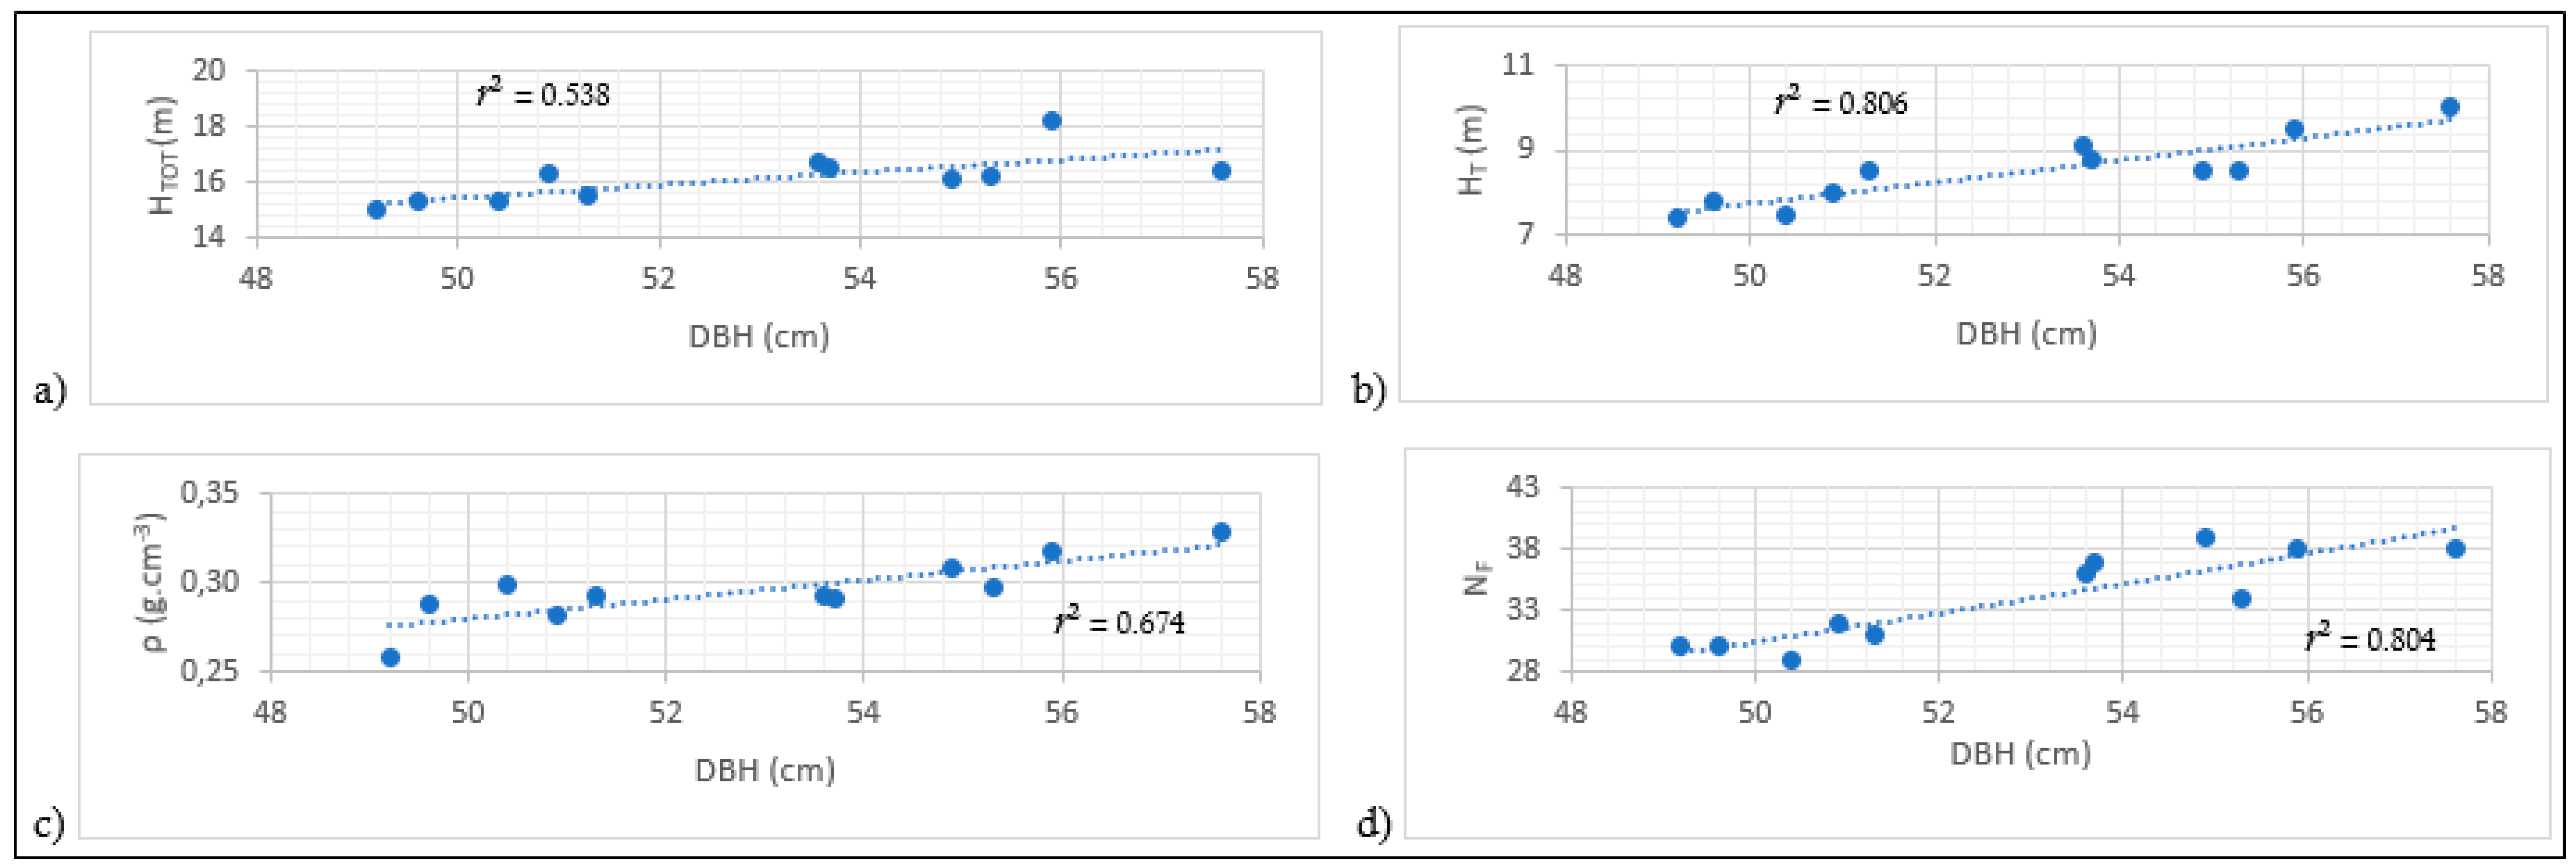
3.2. Relationships between Variables

Before creating the biomass equations, we first examined the interrelationships between the variables under consideration. Clearly, the question was whether variation in ρ, HTOT, HT and NF could be explained by the diameter (DBH). As shown in Table 4 and Figure 3, the respective allometric relationships were significant (p < 0.05) between the dependent variables ρ, HTOT, HT and NF, vs. the independent variable DBH, with a moderate to strong r2 (0.538 to 0.806). The %RMSE was < 3% (Table 4). On the one hand, the strongest relationship was obtained between the stem height and the DBH (r2 = 0.806; p = 0.0001). On the other hand, the weakest relationship (albeit, statistically significant) with the DBH was obtained with the total tree height (r2 = 0.538; p = 0.010).

3.3. Allometric Biomass Models That Were Developed

Allometric models of the aboveground oil palm biomass were developed for the different compartments, i.e., stem, leaves and the total aerial biomass. Several equations were tested to determine which were the best models; we referred to these as the local models. All the established local allometric models for estimating the aboveground biomass provided low errors overall (Table 5: %RMSE < 4%; σ < 1 kg for mean biomass = 417.7 kg; r2 ≥ 0.564, p < 0.05; %ER < 1.3%). Model 6, which was based upon DBH, yielded the highest r2 = 0.959 (p < 0.0001) and the lowest errors (%RMSE = 0.54%, %ER = 0.003%) compared to all the other local models (7 and 8) using individual explanatory variables (ρ, HT and HTOT) (Table 5).
The local models that were constructed from stem heights (%RMSE < 1.12; r2 > 0.8; p ≤ 0.0001; AIC < −55.4) were more efficient than those designed using the total heights (%RMSE < 1.8; r2 > 0.5; p ≤ 0.008; AIC < −45.4). The allometric models of the aboveground biomass using composite variables (DBH2HT or DBH2HT ρ) performed in a manner that was relatively similar to those solely based upon DBH (Table 5).
The allometric relationships between stem and leaf biomass with DBH, as an independent variable (Model 12), were significant with r2 values of 0.930 and 0.679, respectively. The errors associated with these relationships were relatively small (%RMSE = 0.76%; RMSE = 0.04 kg for stems, %RMSE = 0.10%; RMSE = 2.19 kg for leaves) (Table 5). All of the allometric models estimating stem and leaf biomasses (13 and 14), with the exception of Model 15, exhibited evaluation performances that were close to those of Model 12 (Table 5). Errors for Model 15 in predicting stem and leaf biomass were lower (RMSE < 0.094 kg; %RMSE < 1.96%) than those for Models 12, 13 and 14 (RMSE < 0.14 kg; %RMSE < 3.28%). In summary, according to the results that we obtained, the total aboveground biomass of oil palm was best correlated with the DBH compared to the stem or leaf biomass (Figure 4).

3.4. Validation of Local Allometric Models

Seven palm trees were used to validate the relationships between the individual variables that were considered (ρ, HTOT, HT and NF) and the DBH, together with the allometric relationships that were obtained with log sections. Validation results are reported in Table 6. All the variables that were considered were significantly related to DBH (r2 ≥ 0.66; p ≤ 0.026), with relatively small errors (%RMSE ≤ 9.6%; %ER ≤ 7.5%). The relationships that were obtained for the total height (Model 4) and infra-density (Model 1) appeared to be the most robust following validation (Table 6).
Different local allometric biomass estimation models that were proposed in Section 3.3 were validated using the data that were independently collected from the seven sample plots. The same performance evaluation metrics were considered. Table 7 summarizes the validation results that were obtained. Adding the stem height and infra-density or the stem height and leaf count to the model using the DBH alone as the predictor improved the predictions, as shown in the results. The introduction of infra-density (ρ) to the models that were based upon the combination (DBH2HT) contributed to the improvement of all the validation criteria of these allometric models. As an example, the root mean square error decreased from 8.2% to 5.7% when moving from Model 9 (excluding infra-density) to Model 11 (including infra-density). In the same vein, taking into account the leaf number (NF) in allometric models using DBH2HT improved the estimates of leaf biomass and by extension, the entire palm tree. The results of Allometric Models 14 and 15 clearly showed these improvements compared to models in which the leaves were not considered.
Model 9 yielded the highest r2 (0.939, p < 0.0001), the smallest AIC (45.3) and the lowest %RMSE (8.2%) among all the allometric models using structural parameters that were measured directly on oil palm (DBH and HT) (Table 7). With the addition of a variable that is not directly measurable, such as infra-density (ρ), Allometric Model 11 slightly improves upon Allometric Model 9. Allometric Model 15 includes both infra-density and leaf number (a parameter usually not available). This model exhibited the best performance in this study, with a relative RMSE of 5% (Table 7). By combining the aboveground biomass of the stems (DBH2HTρ) and leaves (DBH2HTNF), Model 15 stands out as the best of the local biomass allometric models that were developed in the study (Table 7). The expressions of these three (3) models are described below:
Allometric   Model   9 :   B = 1.0007 exp [ 2.335 + 0.832 × ln ( D B H 2 H T ) ] ,
Allometric   Model   11 :   B = 1.0008 exp [ 0.277 + 0.65 × 1 ln ( D B H 2 H T ρ ) ] ,
Allometric   Model   15 :   B = B S t e m + B L e a f = 1.0005 exp [ 0.295 + 0.678 × ln ( D B H 2 H T ρ ) ] + 1.0043 exp [ 2.852 + 0.561 × ln ( D B H 2 H T N F ) ]

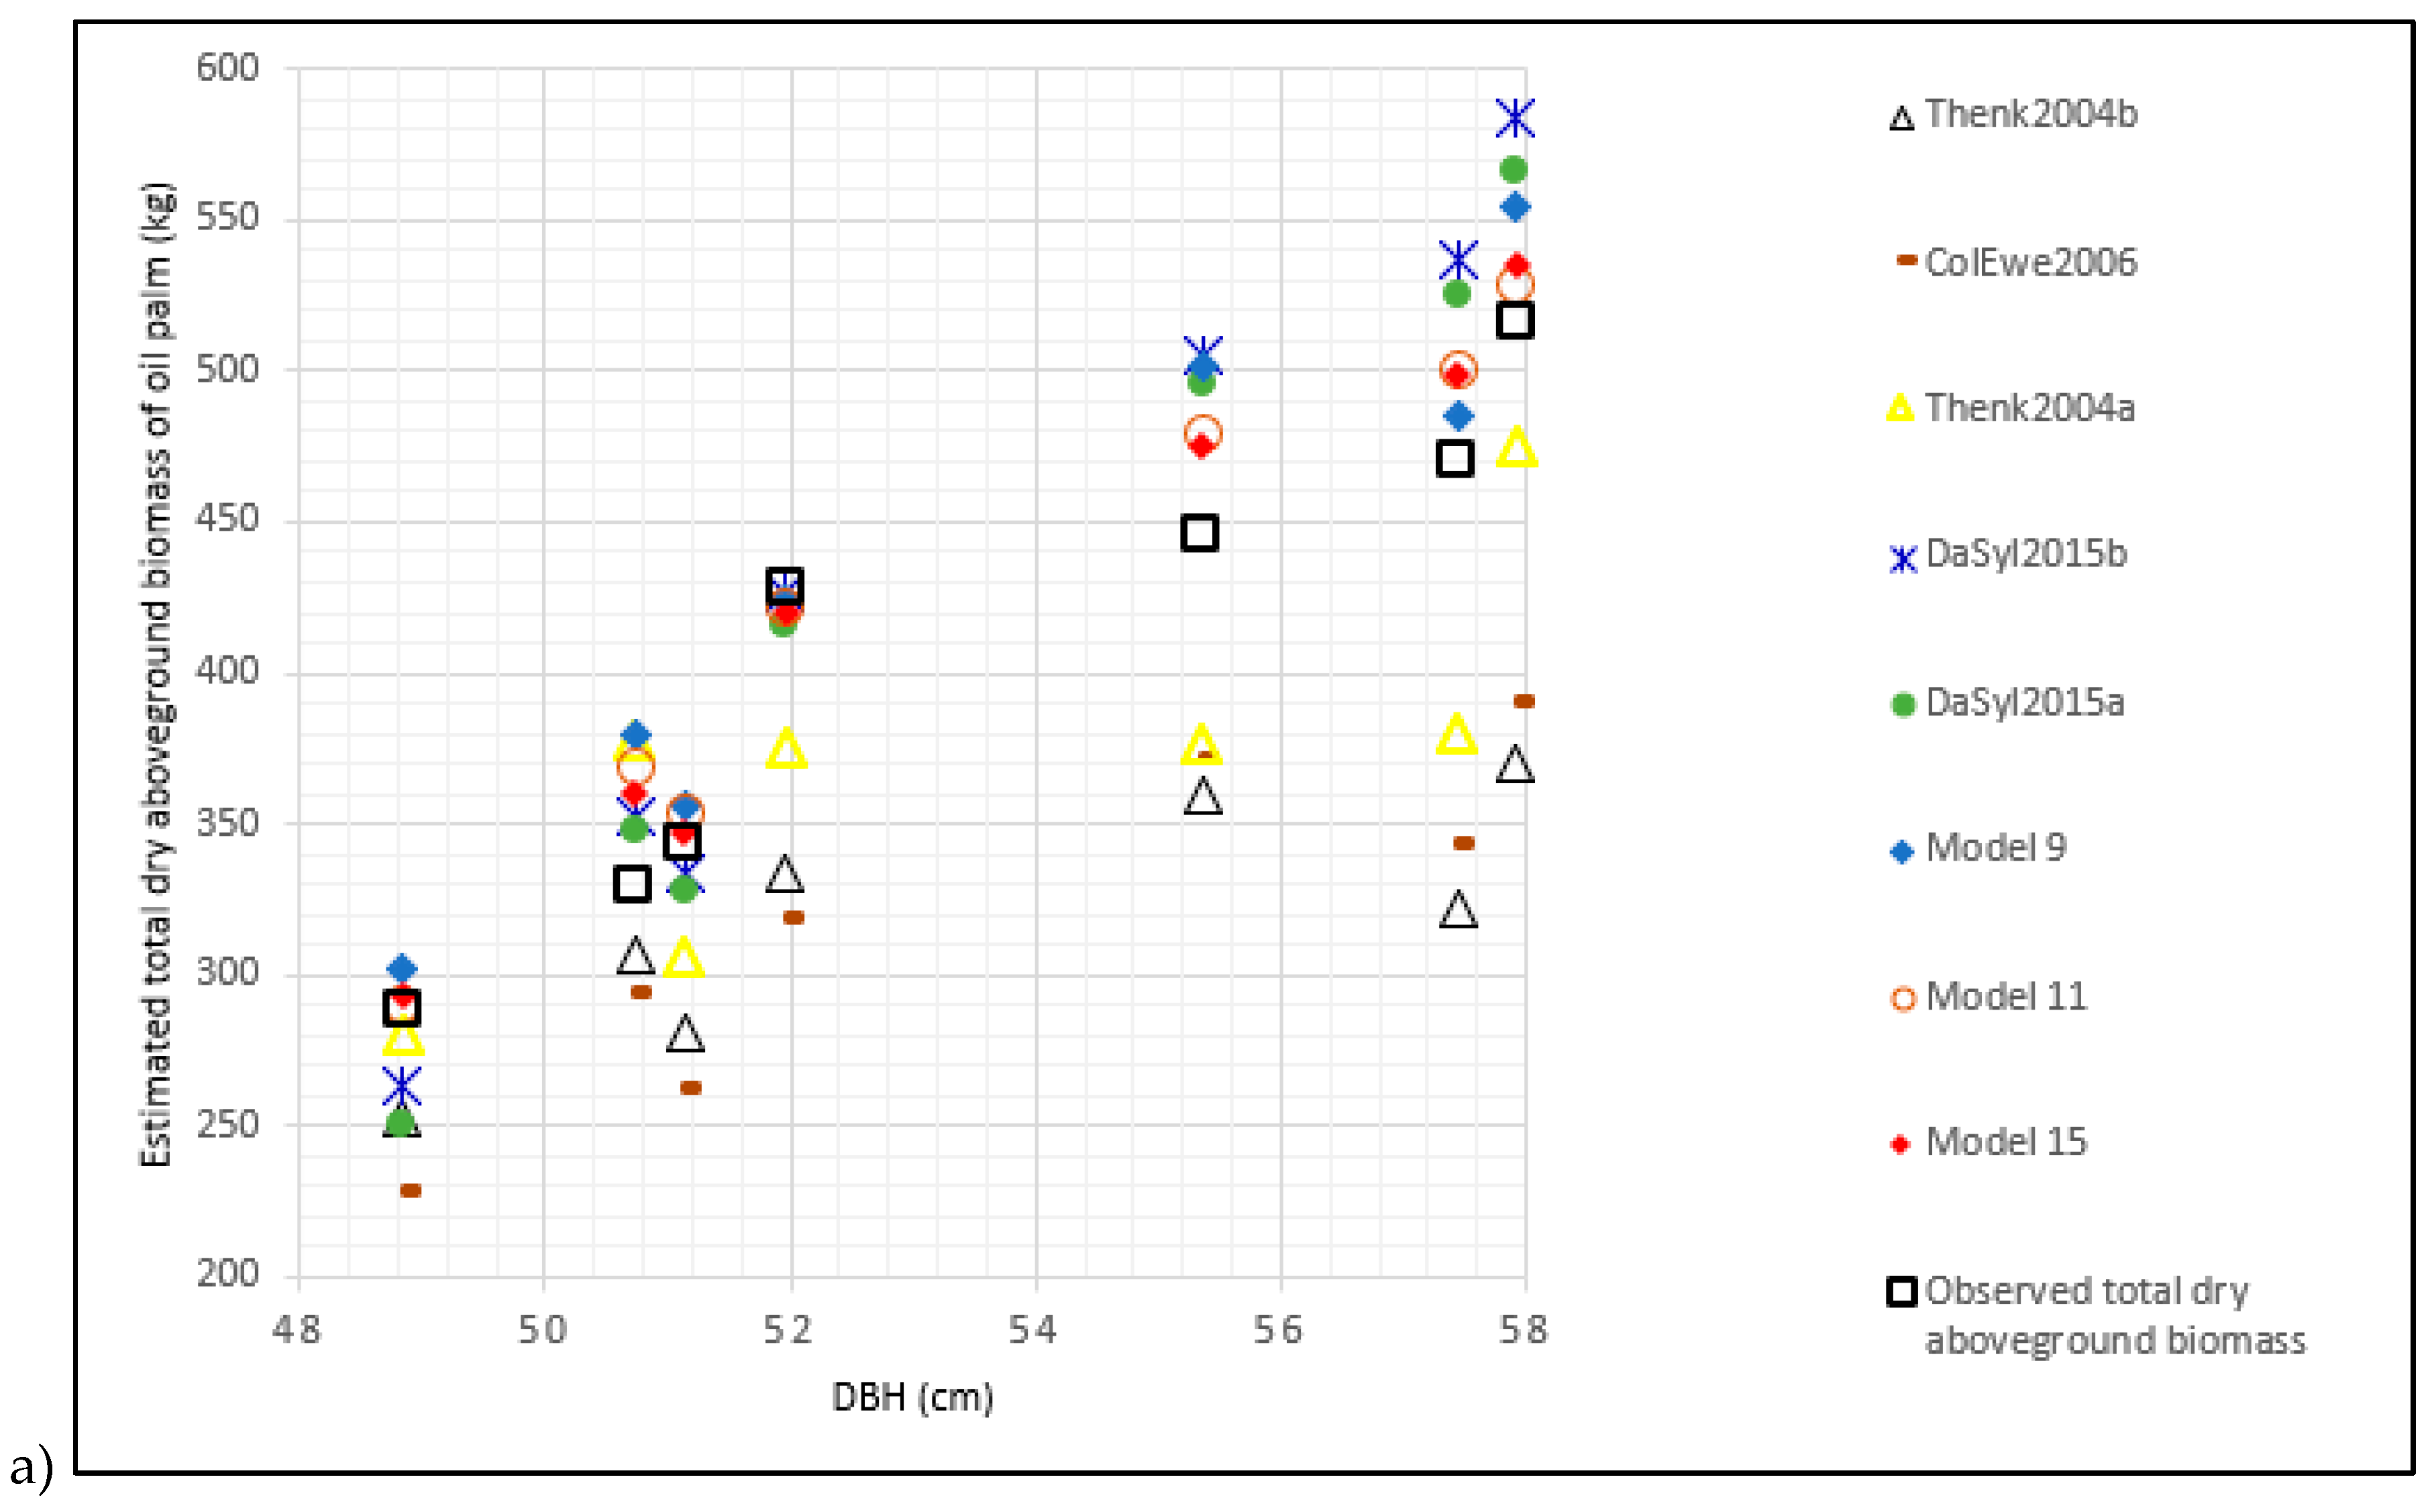
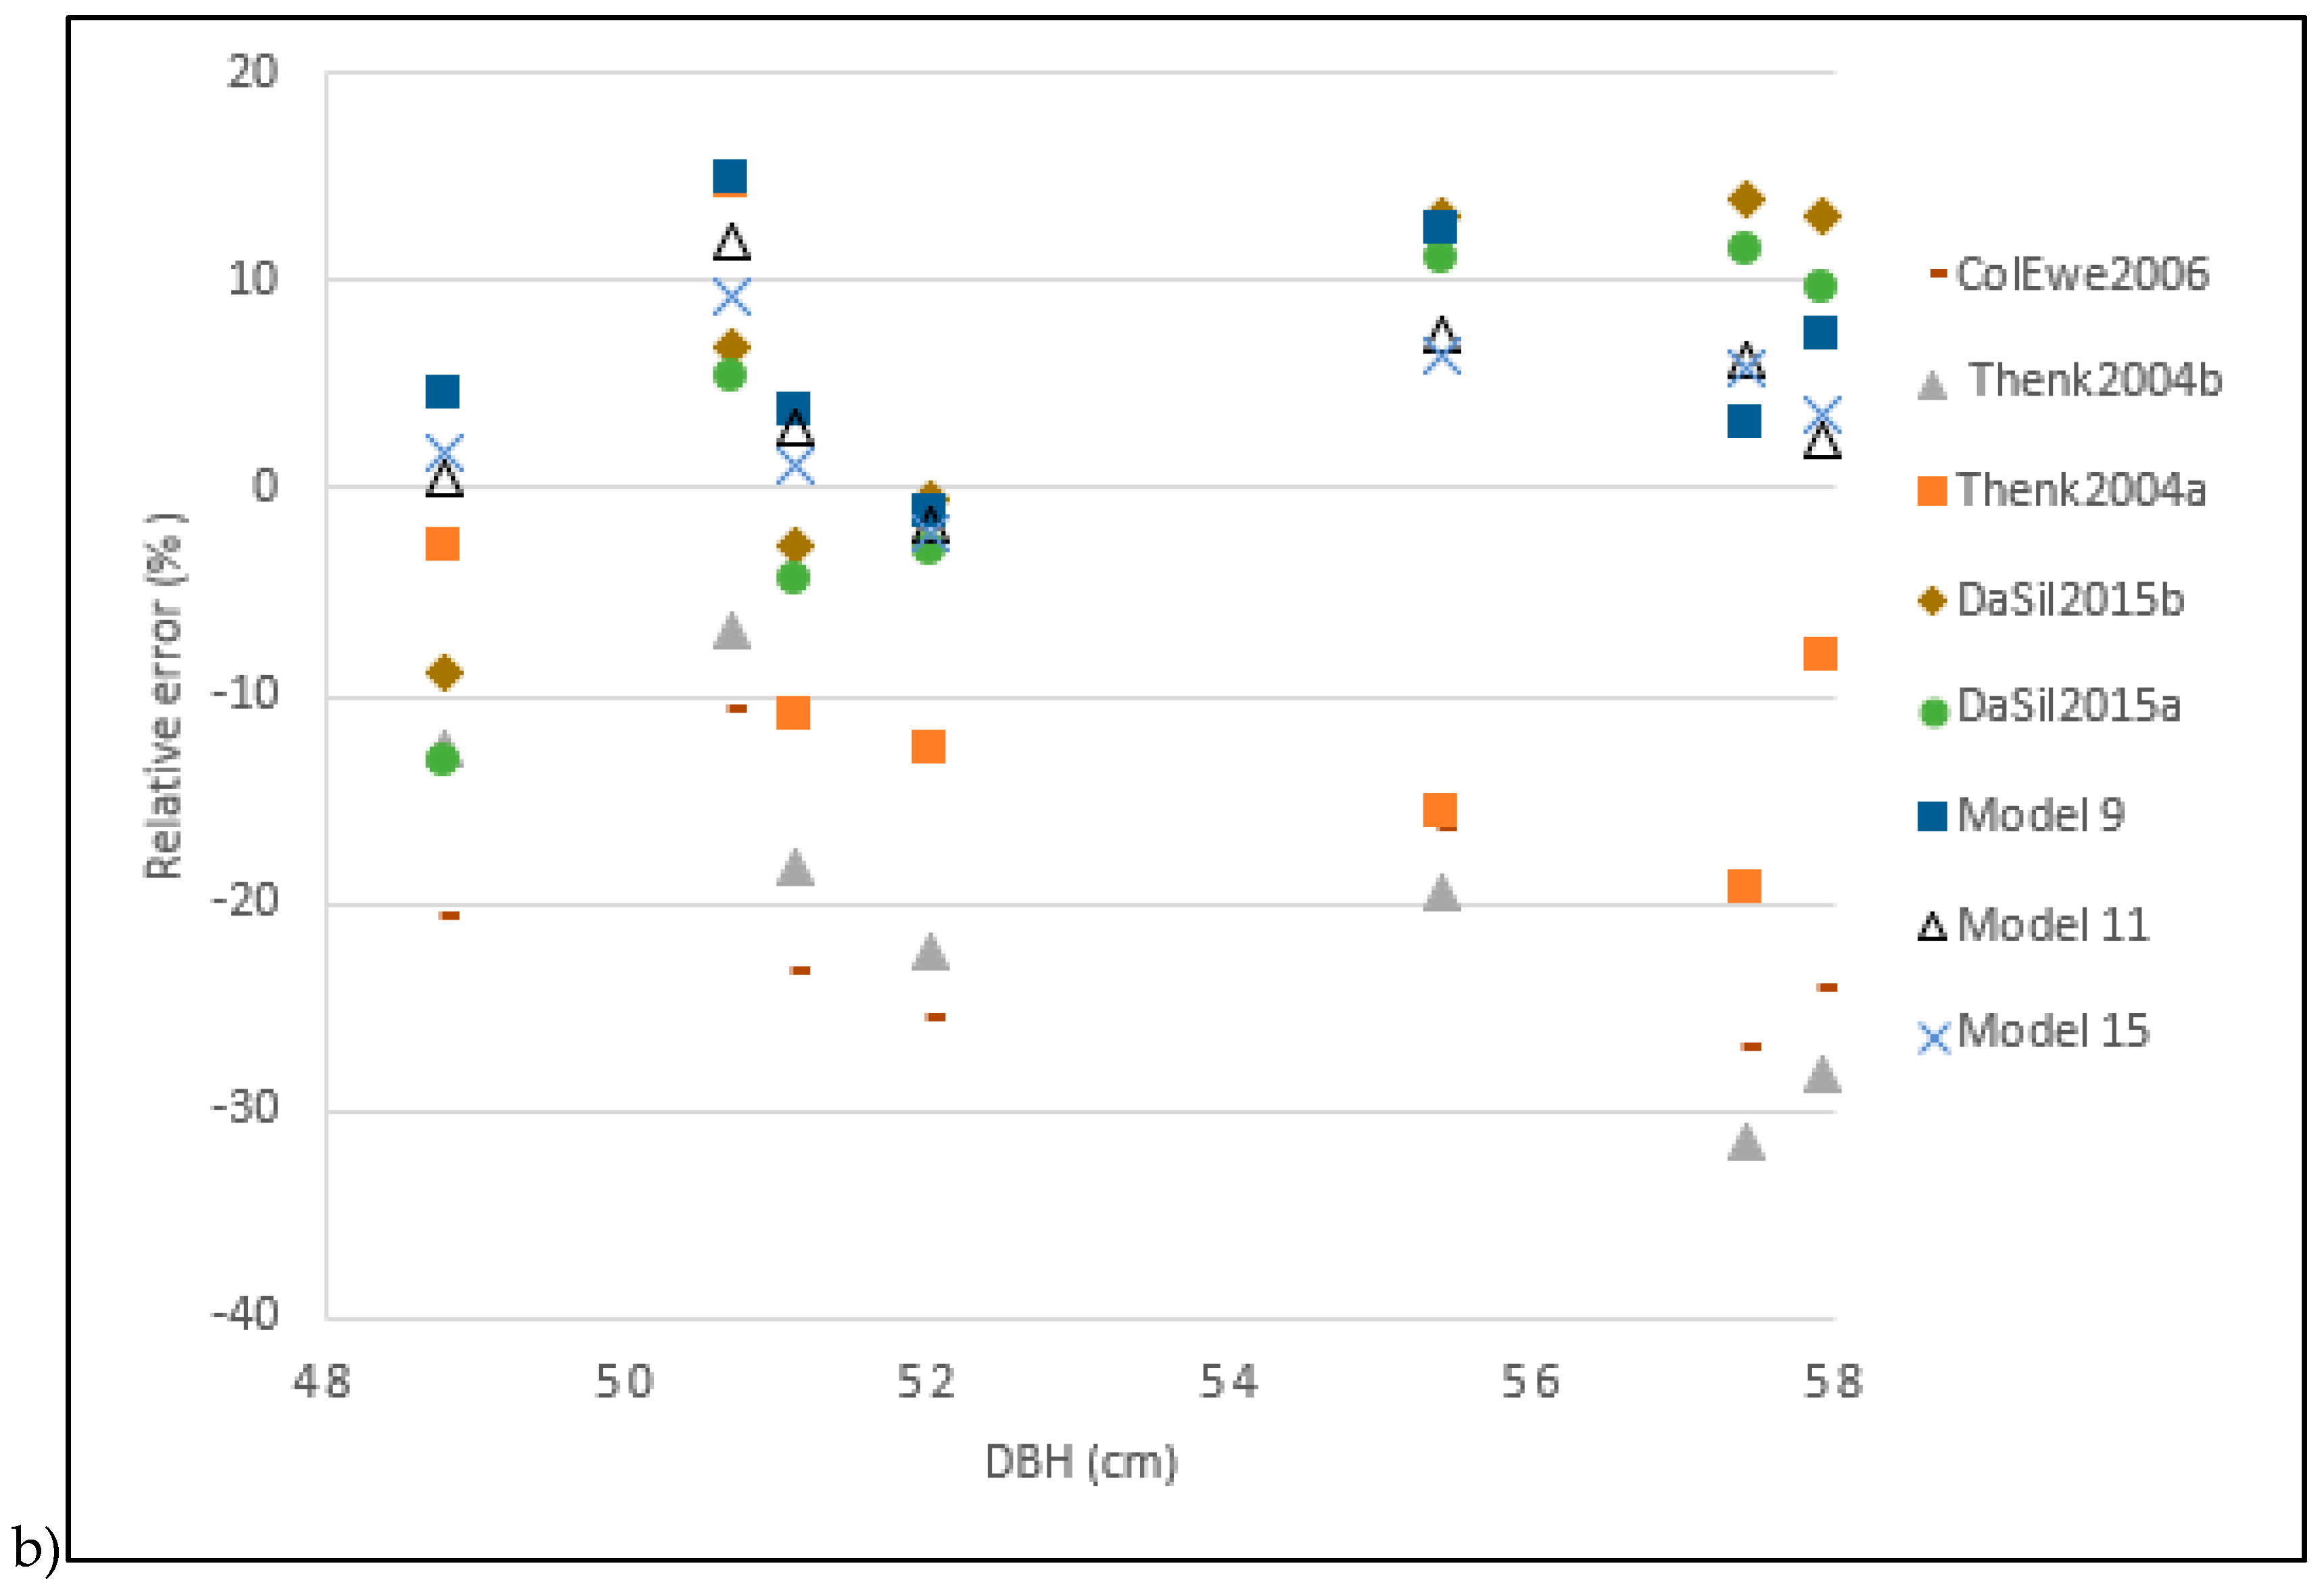
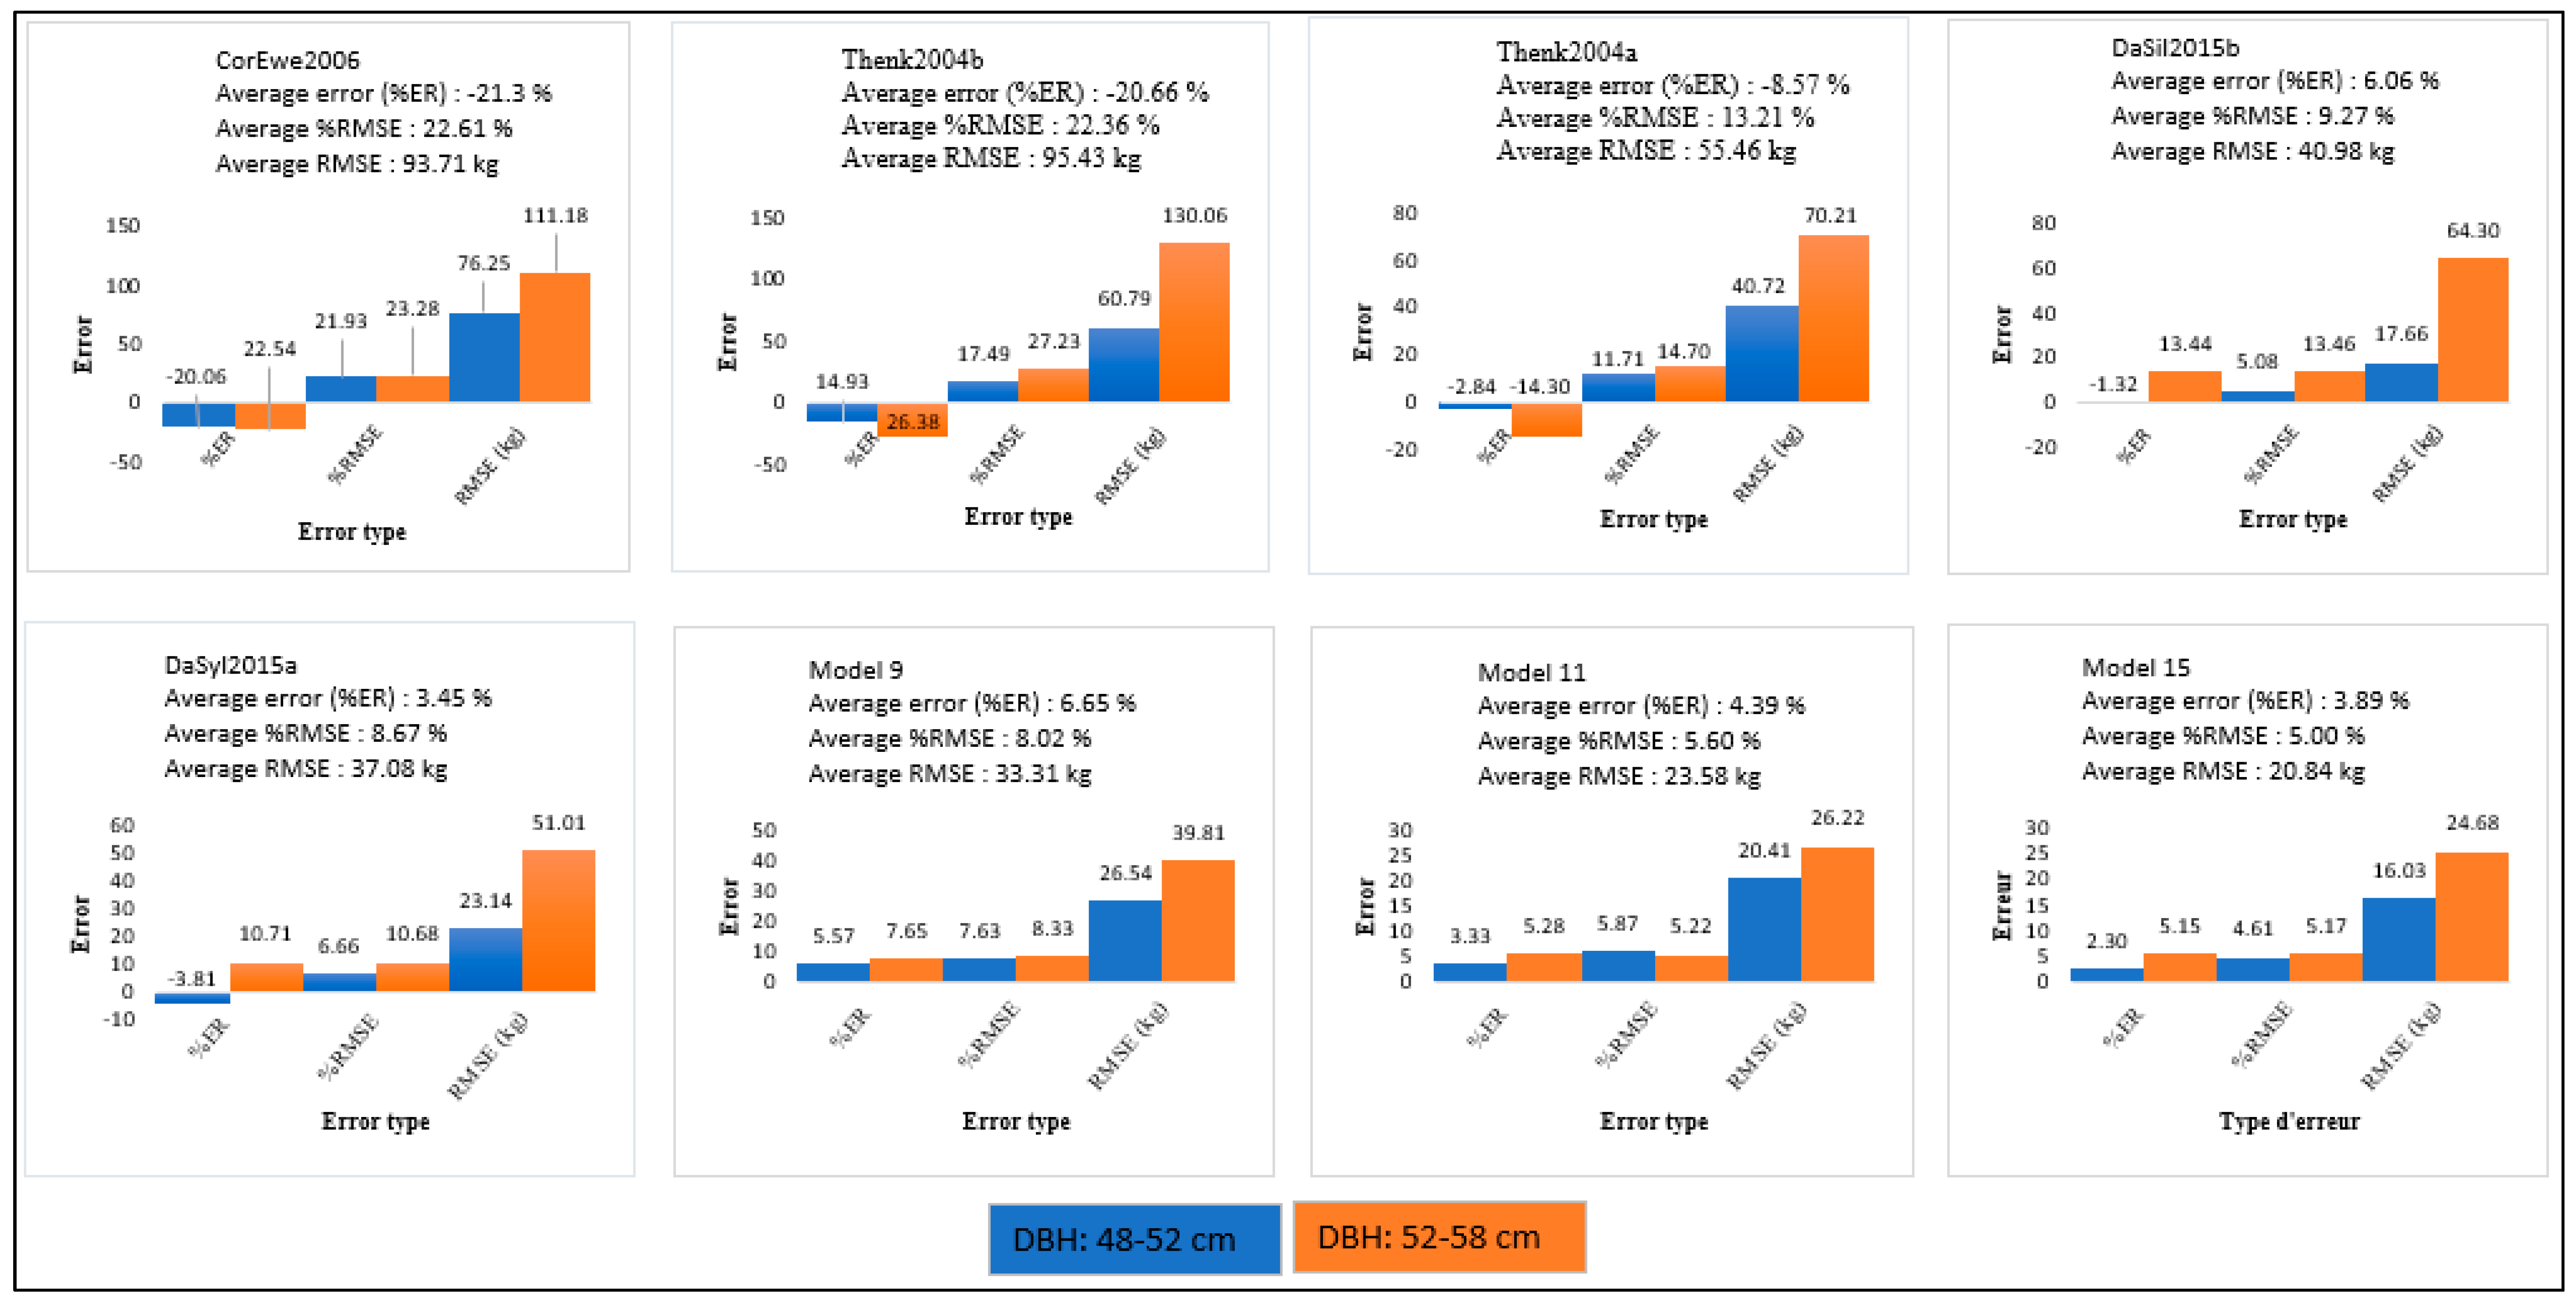
3.5. Validation of Existing Allometric Biomass Models

Nine existing models (Table 3) were evaluated using the data from the seven palm trees. The results are compiled in Table 8. Among the existing allometric models only using stem height as the predictor, the allometric equation Thenk2004a that was proposed by Thenkabail et al. [20] produced the lowest error (%RMSE = 13.7%). Although the values were lower, these results were relatively close to those provided by Allometric Model 7 that was proposed in this study (%RMSE = 9.63%). The other two existing allometric models that were based upon height had errors > 20% (Table 8). In the category of allometric models using the DBH and height together, the two existing models of Hughes et al. [25] and Saldarriaga et al. [18] could not be directly used in the study area because they produced very large estimation errors (%RMSE > 100%), unlike Model 9 in this study (%RMSE of about 8%). The allometric equation DaSilva2015a, which was devised by Da Silva et al. [22], stood out among the models that were based upon DBH, height, infra-density or the dry mass fraction (DMF) as composite explanatory variables. It produced a small error (%RMSE = 9.3%), which was close to that of the Local Allometric Model 11 which was developed in this study (%RMSE = 5.8%). Figure 5a illustrates the proximity of the two allometric models. Finally, in the category of allometric models estimating the total aerial biomass of the palm from the biomass of its components (stems, leaves or rachis) considering the DBH, HT, and ρ and NF as composite explanatory variables, the two existing models produced errors of less than 24% (Table 8). The allometric equation DaSilva2015b from Da Silva et al. [22] provided an %RMSE of 10.9%. However, this error was almost double that produced by Allometric Model 15 in this study. Figure 5b illustrates the results of the five existing models that produced the lowest errors in our study area. The results of the three best local allometric models that were proposed in this study are also shown for comparison purposes. Dispersion is greater in the estimated biomasses for larger diameters (>52 cm). The allometric equations ColEwe2006 [26] and Thenk2004b [20] systematically underestimated the biomass in the area. The associated errors were generally > 20%. Other existing allometric models in Figure 5b produced relative errors < 15%, although they were not developed specifically for the region. Of course, local models were more efficient with relative errors that were generally < 10%.

4. Discussion

4.1. Interpretation of Biomass Distribution

The distribution of the aboveground oil palm biomass among the components showed that on average the stems produced most of the biomass (about 73%) compared to the leaves (rachis + petiole + fruits/leaflets), which produced a total of about 27%. The palms that were considered in this study were generally older (>30 years) than those that were measured in most previous studies. They were practically at the stage of maximum maturity in the case of plantations. Nevertheless, other studies have reported distributions of relatively similar proportions for younger age classes. For example, Da Silva et al. [22] also noted the high proportion of stem biomass (86.4%) to leaf biomass (13.6%) in Brazil for oil palms with DBHs between 3.9 and 12.7 cm. The results that were obtained by Cole and Ewel [26] in Costa Rica were even more comparable than those obtained in this study, i.e., about 78% for stems and 22% for leaves for 13-year-old oil palms with DBH < 20 cm. According to the various results, the proportions of oil palm compartment biomasses (stem vs. leaf) varied only slightly according to age and diameter in the tropical regions that were considered. This lack of variability could likely be attributed to the maintenance that was practiced in these plantations. In natural environments, palm growth may be less homogeneous, depending upon site conditions, which in turn could affect the proportions of biomass among tree compartments. The plantation considered in this study was composed of old trees of 35 years old. This constitutes a limitation, as it is not representative of young and medium age plantations which can be found in the Congo Basin and elsewhere.

4.2. Evaluation of Local Allometric Biomass Equations

In this study, the stem diameter was measured at 1.3 m above the ground surface (DBH), consistent with other studies estimating the aboveground biomass of oil palms [22,23,27]. Several allometric relationships were established to estimate the oil palm biomass in this research (see Table 5).
Our results show an improvement in allometric relationships between biomass and DBH when height or infra-density are taken into account (Table 7). The integrative variable DBH2HT (Model 9) is effective in estimating palm biomass on the study site, as has been the case in other tropical areas [18,25,36]. The cylindrical shape of the oil palm stem, geometrically characterized by the combination DBH2HT, could explain the strong relationship with biomass. Indeed, the latter is essentially concentrated in the stem (Figure 2). Estimating biomass using DBH2HT is an alternative, non-destructive method in different tropical oil palm-producing regions.
The infra-density (ρ) of wood varies according to the type of species, plantation density and growing conditions [30]. The average value of ρ obtained for the palm stems that were considered in this study (>30-years) equals 0.293 g·cm−3. The estimate was within the range from 0.21 to 0.41 g·cm−3 that was defined by Supriadi et al. [40] for Elais guineensis-type palms. The relationship between biomass and infra-density appears to be very significant (see Allometric Model 5, Table 7). Thus, the weighting of the composite variable DBH2HT with infra-density resulted in considerable improvement in palm biomass prediction, as demonstrated by the very small error (%RMSE = 5.8%) that was obtained with Allometric Model 11 (Table 7). The combination of the three variables (DBH, HT, ρ) has also provided significant results in previous work [21,22].
To consider the contributions of all the components of the palm, we integrated the biomass that was contained in the leaves with that of the stem. The resulting Allometric Model 15 stands out as the best performing of all models that were proposed in this study, with a %RMSE of 5.1% (Table 5 and Table 7). Previous work in other regions has reported similarly convincing results and demonstrated the importance of considering the contributions of various components into account ([22,26]; see Table 3). Nevertheless, a close look at the results shows that leaf inclusion did not appreciably improve biomass estimates, compared to the results that were based solely upon DBH2HTρ (Model 11) or DBH2HT (Allometric Model 9). Despite incurring larger errors, Allometric Model 9 remains an interesting alternative to Models 11 and 15 in the absence of infra-density or leaf number data.
Although strong relationships were developed in the study, it should be mentioned that the low number of samples used remains a limitation. The study was based on a destructive approach. Thus, only eighteen trees could be felled to acquire the data both for the development of the equations and for their validation. A larger number of samples associated with a wider range of DBH and height values is therefore recommended for future studies.

4.3. Comparison of Local Models to Existing Allometric Biomass Models

Several allometric relationships have been proposed for estimating oil palm biomass elsewhere in Africa, Asia–Oceania and the Neotropics (Central and South America). The current study sought to understand whether some of these relationships were directly applicable to our site in the Congo Basin. As expected, several allometric models produced large errors (%RMSE > 100%), together with unrealistic variation in predicted biomass, especially for the highest DBHs (52 to 58 cm). This was the case for the equations of Khalid et al. [4], Saldarriaga et al. [18], Goodman et al. [27] and Hughes et al. [25] that were established for Malaysia, Colombia and Venezuela as well as Peru and Mexico, respectively (Table 8). The very high errors could be explained by the very different site conditions and the great disparity in the experimental data that were available for constructing the equations. Nonetheless, the allometric equations of Thenkabail et al. [20] (Thenk2004a and b), Cole and Ewel [26] (ColEwe2006) and those of Da Silva et al. [22] seem to be very applicable to the Congo Basin. Building upon research that was conducted by Yang et al. [30], we investigated errors that were associated with these five existing allometric relationships, together with our three best local models. Figure 6 shows the performance of these different models as a function of the two selected classes of DBH (class 1: 48–52 cm; class 2: 52–58 cm). Among the different allometric models shown, the errors appeared larger for the ColEwe2006 model [26] and Thenk2004b model [20] in both DBH classes, but remained < 25%. The biomass errors observed with the allometric model of Thenkabail et al. [20] could be due to the small stem heights that were used in their study (28–195 cm). Those of Cole and Ewel [26] could possibly be explained by the short to tall oil palms that were considered in the development of their model (1.3 to 20 m). The Thenk2004b allometric model that was developed in Benin and the two models of Da Silva et al. [22] that were developed in Brazil yielded errors < 15%. In particular, the allometric model DaSilv2015a produced results that were close to those of the models proposed in this study, especially in the first DBH class. Indeed, the allometric models of Da Silva et al. [22] were constructed from data comparable to those collected in our study (n = 20; HT = 8.8 m; ρ = 0.3306 g·cm−3). This could be the cause of their strong performance, especially in class 1 DBH. The DBHs (3.9 and 12.7 cm) that were used to establish the allometric models of Da Silva et al. [22] could have caused the slightly larger errors that were observed in class 2.

5. Conclusions

The present study estimated aboveground biomass using the structural parameters of oil palms that were acquired in the Congo Basin using destructive sampling. About three-quarters of the palm biomass was concentrated in the stem. Several allometric equations that were based on diameter at breast height, height, infra-density, number of leaves, or some combination of these different variables, were developed. The composite variable that was based upon the combination (DBH2HT) emerged as the most interesting and perhaps useful explanatory variable for estimating oil palm biomass in the current study. It was the basis of the three best models that were obtained. The best of the three (Allometric Model 15) integrates the contributions of leaves and is characterized by a low error (%RMSE about 5%). The second high-performance allometric model, which weights DBH2HT by infra-density, also produces a low error of about 6%. The third allometric model (Model 9), which was based solely upon DBH2HT, was the most practical alternative, given its relatively small error (about 8%) and the fact that information on infra-density and palm leaf number is not always available. The study shows that some allometric equations developed in other regions could have been used to estimate the palm biomass in the site that we selected in the Congo Basin, but with slightly larger errors than those of the three proposed allometric models. However, several existing models were not applicable because of the large errors they produced in the site, due to differences in palm oil species, age or site conditions.
One of the main limitations in this study resides in the reduced number of samples used to develop and then validate the allometric equations. Only the data from eighteen oil palms were available for this study. Increasing the number of samples in future works would allow the development of probably more robust equations. Such equations are essential to assess the carbon produced by oil palms and understand the impact of the establishment of agro-industrial plantations in tropical forest areas in the context of climate change, while helping their sustainable management. Combinations of data that were acquired from experimental sites in different tropical regions across the globe could make it possible to envisage the development of regional and pan-tropical allometric relationships for estimating the aboveground biomass of oil palms.

Author Contributions

Conceptualization, P.M. and K.G.; methodology, P.M., A.N., K.G.; software, P.M.; validation, P.M. and Kalifa Goïta.; formal analysis, P.M.; investigation, P.M.; resources, P.M., A.N. and A.P.M.B.; data curation, P.M.; writing—original draft preparation, P.M.; writing—review and editing, P.M., K.G., A.N., A.P.M.B.; visualization, P.M.; supervision, K.G.; project administration, P.M.; funding acquisition, P.M. and K.G. All authors have read and agreed to the published version of the manuscript.

Funding

This study was funded by the Programme Canadien de Bourses de la Francophonie (Government of Canada, Department of Foreign Affairs, Trade and Development, Canadian Partnership Branch) and by the Natural Sciences and Engineering Research Council of Canada (NSERC).

Acknowledgments

The authors acknowledge the financial support of the Programme Canadien de Bourses de la Francophonie (Government of Canada, Department of Foreign Affairs, Trade and Development, Canadian Partnership Branch) and the Natural Sciences and Engineering Research Council of Canada (NSERC).The following corporation and government institutions contributed substantially to the data measurement campaign: Olam Palm Gabon; Institut de Recherche en Ecologie Tropicale (IRET); Direction Générale des Eaux et Forêts and the Projet de Développement d’un Système d’Inventaire des Ressources Forestières Nationales contribuant à la Gestion Durable des Forêts (PDSIRFN); the Ecole Nationale des Eaux et Forêts (ENEF); and the Institut de Recherche Agronomiques et Forestières (IRAF). We are grateful to those individuals who participated in field surveys, and in drying and weighing samples, especially Jacques Mouloungou, Bruno Nkoumakali, Inès Nelly Moussavou, and Dieudonné Ndzengboro.

Conflicts of Interest

The authors declare no conflict of interest. The funders had no role in the design of the study; in the collection, analyses, or interpretation of data; in the writing of the manuscript, or in the decision to publish the results.

Appendix A

Table A1. Field and laboratory data that were used to develop aboveground biomass models for oil palm.
Plot NumberBF
(Total Fresh Aboveground Biomass of Oil Palm) (kg)
DBH
(Diameter at Breast Height,
1.3 m) (cm)
HTOT
(Total Height) (m)
HT
(Stem Height) (m)
NF
(Number of Leaves Per Palm)
DMF
(Dry Mass Fraction) Stem Mean
Dmf
(Mean Dry Mass Fraction) Of Oil Palm
ρ
(Mean Infra-Density of Oil Palm Stem) (g·cm−3)
BRachis
(Dry Rachis Biomass)
(kg)
BFSR
(Dry leaf Biomass without Rachis)
(kg)
BLeaf
(Dry Leaf Biomass of Oil Palm: Petioles, Fruits, Rachises and Leaflets)
(kg)
BStem
(Dry Stem Biomass of Oil Palm)
(kg)
B
(Total Dry Aboveground Biomass
(kg)
11336.8050.916.38.0320.29140.28570.281959.875252.9108112.786269.1137381.8997
21643.3053.616.79.1360.30850.28180.292163.090770.4268133.5175329.4937463.0112
31950.2057.616.410.0380.30810.28530.327966.916170.0291136.9452419.4599556.4051
41176.9549.215.07.4300.31050.28360.258750.783053.1305103.9135229.9270333.8405
51259.3549.615.37.8300.33140.28320.287243.187859.7505102.9383253.6564356.5947
61227.4450.415.37.5290.30080.29020.299342.300736.677978.9786277.2167356.1953
71462.4053.716.58.8370.33650.28460.291755.495463.7667119.2621296.9790416.2411
81623.3055.316.28.5340.33430.28550.297269.410967.4892136.9001326.5954463.4955
91710.0554.916.18.5390.34710.28430.307774.234274.5585148.7927337.3431486.1358
101294.1551.315.58.5310.29720.29010.292755.495446.9775102.4729272.9780375.4509
111763,155.918.29.5380.31150.28690.318083.160063.0959146.2559359.6233505.8792
121803.7557.916.69.8380.30990.28620.303045.696468.9378114,6342401,5572516.1914
131156.2550.715.38.1270.29870.28520.274929.383247.770177.1533252,6299329.7832
141672.2557.417.08.5370.28570.28140.326062.591874.5959137.1877333.4184470.6061
151543.7055.416.69.5320.25360.28890.293565.142052.9177118.0597327.9238445.9835
161216.8551.115.07.4280.26500.28220.277641.247451.416192.6635250.6978343.3613
171021.8048.814.56.65300.27060.28260.250040.803848.718089.5218199.1936288.7154
181493.2052.015.18.8330.27270.28710.295068.246648.4361116.6827311.9835428.6662

References

  1. Food and Agriculture Organization. Évaluation des Ressources Forestières Mondiales 2015: Comment les Forêts de la Planète Changent-Elles? 2nd ed.; FAO: Rome, Italy, 2016; pp. 30–31. Available online: http://www.fao.org/3/a-i4793f.pdf (accessed on 28 April 2018).
  2. Keenan, R.J.; Reams, G.A.; Achard, F.; de Freitas, J.V.; Grainger, A.; Lindquist, R. Dynamics of global forest area: Results from the FAO Global Forest Resources Assessment 2015. For. Ecol. Manag. 2015, 352, 9–20. [Google Scholar] [CrossRef]
  3. Tuma, J.; Fleiss, S.; Eggleton, P.; Frouz, J.; Klimes, P.; Lewis, O.T.; Yusah, K.M.; Fayle, T.M. Logging of rainforest and conversion to oil palm reduces bioturbator diversity but not levels of bioturbation. Appl. Soil Ecol. 2019, 144, 123–133. [Google Scholar] [CrossRef]
  4. Khalid, H.; Zin, Z.Z.; Anderson, J.M. Quantification of oil palm biomass and nutrient value in a mature plantation. I, Above-ground biomass. J. Oil Palm Res. 1999, 11, 23–32. Available online: http://jopr.mpob.gov.my/wp-content/uploads/2013/07/joprv11n1-p31.pdf (accessed on 20 October 2018).
  5. Folefack, A.J.J.; Ngo Njiki, G.M.; Darr, D. Safeguarding forests from smallholder oil palm expansion by more intensive production? The case of Ngwei forest (Cameroon). For. Policy Econ. 2019, 101, 45–61. [Google Scholar] [CrossRef]
  6. Olorunfemi, I.E.; Komolafe, A.A.; Fasinmirin, J.T.; Olufayo, A.A. Biomass carbon stocks of different land use management in the forest vegetative zone of Nigeria. Acta Oecol. 2019, 95, 45–56. [Google Scholar] [CrossRef]
  7. Megevand, C.; Mosnier, A.; Hourticq, J.; Sanders, K.; Doetinchem, N.; Streck, C. Deforestation Trends in the Congo Basin: Reconciling Economic Growth and Forest Protection; The World Bank, Directions in Development—Environment and Sustainable Development: Washington, DC, USA, 2013; pp. 4–118. [Google Scholar] [CrossRef] [Green Version]
  8. Glinskis, E.A.; Gutiérrez-Vélez, V.H. Quantifying and understanding land cover changes by large and small oil palm expansion regimes in the Peruvian Amazon. Land Use Policy 2019, 80, 95–106. [Google Scholar] [CrossRef]
  9. De Almeida, A.S.; Vieira, I.C.G.; Ferraz, S.F.B. Long-term assessment of oil palm expansion and landscape change in the eastern Brazilian Amazon. Land Use Policy 2020, 90, 104321. [Google Scholar] [CrossRef]
  10. Rivera, Y.D.; Moreno, A.L.; Romero, H.M. Biochemical and physiological characterization of oil palm interspecific hybrids (Elaeis oleifera x Elaeis guineensis) grown in hydroponics. Acta Biol. Colomb. 2013, 18, 465–472. Available online: https://www.researchgate.net/publication/257938174 (accessed on 11 January 2020).
  11. Meléndez, M.R.; Ponce, W.P. Pollination in the oil palms Elaeis guineensis, E. oleifera and their hybrids (OxG), in tropical America. Pesqui. Agropecu. Trop. 2016, 46, 102–110. [Google Scholar] [CrossRef] [Green Version]
  12. Pacheco-Palencia, L.A.; Mertens-Talcott, S. Chemical composition, antioxidant properties, and thermal stability of a phytochemical enriched oil from Acai (Euterpe oleracea Mart.). J. Agric. Food Chem. 2008, 56, 4631–4636. [Google Scholar] [CrossRef]
  13. Morel, A.C.; Fisher, J.B.; Malhi, Y. Evaluating the potential to monitor aboveground biomass in forest and oil palm in Sabah, Malaysia, for 2000–2008 with Landsat ETM+ and ALOSPALSAR. Int. J. Remote Sens. 2012, 33, 3614–3639. [Google Scholar] [CrossRef]
  14. Kho, L.-K.; Rudbeck Jepsen, M. Carbon stock of oil palm plantations and tropical forests in Malaysia: A review. Singap. J. Trop. Geogr. 2015, 36, 249–266. [Google Scholar] [CrossRef]
  15. Lahteenoja, O.; Ruokolainen, K.; Schulman, L.; Oinonen, M. Amazonian peatlands: An ignored C sink and potential source. Glob. Change Biol. 2009, 15, 2311–2320. [Google Scholar] [CrossRef]
  16. Neumann, M.; Moreno, A.; Mues, V.; Härkönen, S.; Mura, M.; Bouriaud, O.; Lang, M.; Achten, W.M.J.; Thivolle-Cazat, A.; Bronisz, K.; et al. Comparison of carbon estimation methods for European forests. For. Ecol. Manag. 2016, 361, 397–420. [Google Scholar] [CrossRef]
  17. Tinker, P.B.H.; Smilde, K.W. Dry-matter production and nutrient content of plantation oil palms in Nigeria. II. Nutrient Content. Plant. Soil 1963, 19, 350–363. Available online: https://www.jstor.org/stable/42933246 (accessed on 15 May 2018). [CrossRef]
  18. Saldarriaga, J.G.; West, D.C.; Tharp, M.L.; Uhl, C. Long-term chronosequence of forest succession in the upper Rio Negro of Colombia and Venezuela. J. Ecol. 1988, 76, 938–958. [Google Scholar] [CrossRef]
  19. Yuen, J.Q.; Fung, T.; Ziegler, A.D. Review of allometric equations for major land covers in SE Asia: Uncertainty and implications for above- and below-ground carbon estimates. For. Ecol. Manag. 2016, 360, 323–340. [Google Scholar] [CrossRef]
  20. Thenkabail, P.S.; Stucky, N.; Griscom, B.W.; Ashton, M.S.; Diels, J.; van der Meer, B.; Enclona, E. Biomass estimations and carbon stock calculations in the oil palm plantations of African derived savannas using IKONOS data. Int. J. Remote 2004, 25, 5447–5472. [Google Scholar] [CrossRef]
  21. Corley, R.H.V.; Tinker, P.B.H. The Oil Palm, 4th ed.; Blackwell Science: Hoboken, NJ, USA, 2003; pp. 89–103. [Google Scholar]
  22. Da Silva, F.; Suwa, R.; Kajimoto, T.; Ishizuka, M.; Higuchi, N.; Kunert, N. Allometric equations for estimating biomass of Euterpe precatoria, the most abundant palm species in the Amazon. Forests 2015, 6, 450–463. [Google Scholar] [CrossRef] [Green Version]
  23. Kotowska, M.M.; Leuschner, C.; Triadiati, T.; Meriem, S.; Hertel, D. Quantifying above- and belowground biomass carbon loss with forest conversion in tropical lowlands of Sumatra (Indonesia). Glob. Change Biol. 2015, 21, 3620–3634. [Google Scholar] [CrossRef]
  24. Aholoukpè, H.; Dubos, B.; Flori, A.; Deleporte, P.; Amadji, G.; Chotte, J.L.; Blavet, D. Estimating aboveground biomass of oil palm: Allometric equations for estimating frond biomass. For. Ecol. Manag. 2013, 292, 122–129. [Google Scholar] [CrossRef]
  25. Hughes, R.F.; Kauffman, J.B.; Jaramillo, V.J. Biomass, carbon, and nutrient dynamics of secondary forests in a humid tropical region of Mexico. Ecology 1999, 80, 1892–1907. [Google Scholar] [CrossRef]
  26. Cole, T.G.; Ewel, J.J. Allometric equations for four valuable tropical tree species. For. Ecol. Manag. 2006, 229, 351–360. [Google Scholar] [CrossRef]
  27. Goodman, R.C.; Phillips, O.L.; Del Castillo Torres, D.; Freitas, L.; Cortese, S.T.; Monteagudo, A.; Baker, T.R. Amazon palm biomass and allometry. For. Ecol. Manag. 2013, 310, 994–1004. [Google Scholar] [CrossRef]
  28. Moraes, R.M.; Borchsenius, F.; Blicher-Mathiesen, U. Notes on the biology and uses of the Motacú palm (Attalea phalerata, Arecaceae) from Bolivia. Econ. Bot. 1996, 50, 423–428. Available online: www.jstor.org/stable/4255886 (accessed on 10 January 2020).
  29. Sunaryathy, P.-I.; Suhasman Kanniah, K.-D.; Tan, K.-P. Estimating aboveground biomass of oil palm trees by using the destructive method. World J. Agric. Res. 2015, 3, 17–19. [Google Scholar] [CrossRef]
  30. Yang, X.; Blagodatsky, S.; Liu, F.; Beckschäfer, P.; Xu, J.; Cadisch, G. Rubber tree allometry, biomass partitioning and carbon stocks in mountainous landscapes of sub-tropical China. For. Ecol. Manag. 2017, 404, 84–99. [Google Scholar] [CrossRef]
  31. Rondeux, J. La Mesure des Arbres et des Peuplements Forestiers, 2nd ed.; Les Presses Agronomiques de Gembloux: Gembloux, Belgium, 1999; pp. 97–108. [Google Scholar]
  32. Bauwens, S.; Fayolle, A. Protocole de Collecte des Données sur le Terrain et au Laboratoire Nécessaires pour Quantifier la Biomasse Aérienne des Arbres et pour l’établissement d’équations Allométriques. Nature + 2014, 40. [Google Scholar] [CrossRef]
  33. Gould, S.J. AlIometry and size in ontogeny and phylogeny. Biol. Rev. 1966, 41, 587–640. [Google Scholar] [CrossRef]
  34. Brown, S.; Gillespie, A.J.R.; Lugo, A.E. Biomass estimation methods for tropical forests with applications to forest inventory data. For. Sci. 1989, 35, 881–902. [Google Scholar] [CrossRef]
  35. Onyekwelu, J.-C. Above-ground biomass production and biomass equations for even-aged Gmelina arborea (ROXB) plantations in southwestern Nigeria. Biomass Bioenerg. 2004, 26, 39–46. [Google Scholar] [CrossRef]
  36. Chave, J.; Andalo, C.; Brown, S.; Cairns, M.A.; Chambers, J.Q.; Eamus, D.; Fölster, H.; Fromard, F.; Higuchi, N.; Kira, T.; et al. Tree allometry and improved estimation of carbon stocks and balance in tropical forests. Oecologia 2005, 145, 87–99. [Google Scholar] [CrossRef] [PubMed]
  37. Ngomanda, A.; Engone Obiang, L.N.; Lebamba, J.; Moundounga Mavouroulou, Q.; Gomat, H.; Mankou, G.S.; Loumeto, J.; Midoko Iponga, D.; Kossi Ditsouga, F.; Zinga Koumba, R.; et al. Site-specific versus pantropical allometric equations: Which option to estimate the biomass of a moist central African forest? For. Ecol. Manag. 2014, 312, 1–9. [Google Scholar] [CrossRef]
  38. Hansen, E.H.; Gobakken, T.; Bollandsås, O.M.; Zahabu, E.; Næsset, E. Modeling aboveground biomass in dense tropical submontane rainforest using airborne laser scanner data. Remote Sens. 2015, 7, 788–807. [Google Scholar] [CrossRef] [Green Version]
  39. Kuyah, S.; Dietz, J.; Muthuri, C.; Jamnadass, R.; Mwangi, P.; Coe, R.; Neufeldt, H. Allometric equations for estimating biomass in agricultural landscapes: I. Aboveground biomass. Agric. Ecosyst. Environ. 2012, 158, 216–224. [Google Scholar] [CrossRef]
  40. Supriadi, A.; Rachman, O.; Sarwono, E. Characteristics and sawing properties of oil-palm (Elaeis guineensis Jacq.) wood logs. Buletin Penelitian Hasil Hutan 1999, 17, 1–20. [Google Scholar] [CrossRef]
Figure 1. Study area.
Forests 11 00544 g001
Figure 2. Mean proportions of the aboveground biomass for the 18 oil palms, Makouké, central Gabon.
Forests 11 00544 g002
Figure 3. Allometric relationships between the variables and the DBH of the 11 oil palms used in this study to develop local biomass models: (a) relationship between total height vs. DBH; (b) relationship between stem height vs. DBH; (c) relationship between infra-density vs. DBH; and (d) relationship between number of leaves vs. DBH.
Forests 11 00544 g003
Figure 4. Allometric relationships between the biomass components of 11 oil palms and their corresponding DBH.
Forests 11 00544 g004
Figure 5. Comparison of the selected existing allometric models with the best allometric models that were proposed in this study: (a) biomass variation according to DBH; (b) relative error variation according to DBH.
Forests 11 00544 g005aForests 11 00544 g005b
Figure 6. Errors in the allometric models when considering the two DBH classes (48–52 cm, 52–58 cm).
Forests 11 00544 g006
Table 1. Summary of the field measurements for 18 felled oil palms: n is the number of oil palms; DBH, HT, HTOT and NF are respectively the diameter at breast height (cm, measured 1.3 m above the ground surface), the stem height (m), the total height (m) and the leaf number per tree.
ParameterMinimumMaximumMeanSE%SE
DBH48.857.953.10.711.34
HT6.6510.08.460.222.60
HTOT14.518.215.970.221.38
NF273933.270.922.77
SE is the standard error for each parameter.
Table 2. Summary of the infra-density, dry mass fractions and the average total dry mass of the palm components for 18 individuals that were felled in Makouké, central Gabon.
ComponentsMinimumMaximumMeanSE% SE
Descriptive Statistical Parameters for Dry Mass Fractions (DMF)
Stem0.2530.3470.3010.0062.020
Petiole0.1340.2450.1940.0073.805
Fruit0.1560.2210.1900.0095.059
Rachis0.2330.3350.2770.0062.386
Leaflet0.1980.3860.3220.0103.215
Whole oil palm0.2810.2900.2856.10−40.220
Descriptive Statistical Parameters for Infra-Density (g·cm−3)
Stem0.250.32790.29300.00481.639
Descriptive Statistical Parameters for Total Dry Mass of Oil Palm Compartments (kg)
Stem199.19419.46302.7713.664.51
Petiole20.8946.3133.281.644.92
Fruit1482.558.5710.5417,99
Rachis29.3883.1656.503.315.86
Leaflet13.2929.5721.421.034.83
Leaf
(Petioles, Fruit, Rachis + Leaflets)
77.15148.79114.935.194.52
Stem + Leaf288.72556.41417.6917.784.26
Table 3. Existing biomass models that were considered. B = total aboveground biomass (kg); BF = total aboveground fresh biomass of an oil palm (kg); BStem = stem biomass (kg); NF = number of leaves; BFSR = leaf biomass without rachis (kg); BRachis = rachis biomass (kg); DBH = diameter at breast height (in cm, measured 1.3 m above ground surface); HTcm = stem height of a palm (cm); CF = correction factor; n = number of palms that were sampled. r2 = coefficient of determination. The other variables have been previously defined in the text.
SourceGeographic
Region
Palm SpeciesExisting Biomass Model (kg tree−1)CFr2n
Khalid et al. [4]MalaysiaElaeis guineensisBF = 725 + 197 × HTOT 0.967
Thenkabail et al. [20]BeninElaeis guineensisBF = 1.5729 × HTcm – 8.2835 0,977
B = 0.3747 × HTcm + 3.6334 0.987
Hughes et al. [25]MexicoAstrocaryum mexicanumB = exp(3.6272 + 0.5768 × ln(DBH2HT)) CF/1061.020.7315
Saldarriaga et al. [18]Colombia and VenezuelaCommonB = exp(−6.3789 – 0.877 × ln(1/DBH2) + 2.151 × ln(HT)) 0.8919
Goodman et al. [27]Amazonia (Peru)CommonB = 0.0950 × (DMF × DBH2HT) 0.99106
Da Silva et al. [22]BrazilEuterpe precatoriaB = 0.167 × (DBH2HTρ) 0.883 0.98 120
BStem = exp(0.1212 + 0.90 × ln(DBH2HTρ)) 0.98 120
BLeaf = exp(0.0065 + 0.69 × ln(DBH2HTNF)) 0.94 120
Cole and Ewel [26]Tropical zone (Costa Rica)Euterpe oleraceaeBStem = 0.0314 × (DBH2HT)0.917 × CF1.040.95156
BFSR = 0.0237 × (DBH2HTNF)0.512 × CF1.0360.94182
BRachis = 0.0458 × (DBH2HTNF)0.388 × CF1.0360.90187
1 Da Silva [22] used adjusted values of the coefficient of determination (Radj2) rather than r2.
Table 4. Criteria for evaluating the allometric relationships between the DBH and the dependent variables using data from 11 oil palms in Makouké, central Gabon. Values of the coefficients a and b of the models are given; σ is the residual standard error (in kg); p is the p-value of the model. CF is the correction factor for the log-transformed equation. Residual standard errors (σ, in kg), Akaike Information Criterion (AIC), relative error (ER), relative percentage error (%ER), root-mean-square error (RMSE, in kg) and its percentage (%RMSE) are shown for each equation.
Modelabr2σAICCFpER%ERRMSE%RMSE
Model 1: ln(ρ) = a + b × ln(DBH)−5.0570.9670.6740.037−73.3431.00060.00275 × 10−50.0750.0342.793
Model 2: ln(NF) = a + b × ln(DBH)−3.8921.8680.8040.051−63.3901.00110.000117.5 × 10−50.0170.0461.327
Model 3: ln(HT) = a + b × ln(DBH)−4.3421.6080.8060.044−66.8431.00080.000134.6 × 10−50.0340.0391.869
Model 4: ln(HTOT) = a + b × ln(DBH)−0.1790.7460.5380.038−69.7691.00060.01015.4 × 10−50.0150.0341.258
Table 5. Local allometric biomass models that were developed in this study. B is the total dry aboveground oil palm biomass. BStem, BLeaf, BFSR and BRachis are respectively stem, leaf (including petioles, rachis and leaflets), rachis-free leaf and rachis biomasses. P is the p-value of the model. Residual standard error (σ, in kg), the correction factor (CF), the ER and the RMSE are shown for each equation.
Modelabr2σAICPCFER%ERRMSE%RMSE
Allometric Equations Using Infra-Density (ρ) or DBH as the Predictor
Model 5ln(B) = a + bln(ρ)8.7552.2230.6850.099−48.9850.0021.004122.1 × 10−50.0220.0891.488
Model 6ln(B) = a + bln(DBH)−6.2563.1000.9590.035−71.480<0.00011.00052.8 × 10−50.0020.0320.535
Equations using height as the predictor
Model 7ln(B) = a + bln(HT)2.6161.6040.8240.074−55.3830.00011.002212.3 × 10−50.0120.0671.112
Model 8ln(B) = a + bln(HTOT)−0.4432.3330.5620.117−45.3500.0081.005630.4 × 10−50.0300.1061.755
Allometric Equations Using DBH and Height as Composite Predictors
Model 9ln(B) = a + bln(DBH2HT)−2.3350.8320.9420.042−67.606<0.00011.00074 × 10−50.0040.0380.638
Allometric Equations Using DBH, Height and Infra-Density as Composite Predictors
Model 10ln(B) = bln(DBH2HT ρ) 0.6830.9990.0439−68.5600.00011.0008−2.1 × 10⁻⁵−0.0020.0400.669
Model 11ln(B) = a + bln(DBH2HT ρ)0.2770.6510.9380.043−66.938<0.00011.00084.3 × 10−50.0040.0390.658
Allometric Equations Using DBH, HT, ρ or NF as Composite Variables to Estimate Aboveground Biomass from Its Components (Stems, Rachises, Leaves with/without Rachises)
Model 12ln(BStem) = a + bln(DBH)−6.7763.1470.9300.048−64,933<0.00011.00105.6 × 10−50.0050.0430.762
ln(BLeaf) = a + b(DBH)−7.1883.0140.6790.115−45,6050.0021.005551.4 × 10−50.0510.1042.197
Model 13ln(BStem) = a + bln(DBH2HT)−2.8310.8480.9210.051−63,594<0.00011.00106.4 × 10−50.0060.0460.810
ln(BFSR) = a + bln(DBH2HTNF)−3.1240.5300.5640.146−40,4300.0081.0088115.1 × 10−50.1150.1323.257
ln(BRachis) = a + bln(DBH2HTNF)−4.0410.5970.7020.122−44,3320.0011.006274.9 × 10−50.0740.1112.724
Model 14ln(BStem) = bln(DBH2HT ρ) 0.6450.9990.037−71.844<0.00011.000611 × 10−50.0110.0340.610
ln(BLeaf) = bln(DBH2HTNF) 0.3510.9990.103−46.406<0.00011.0061109.6 × 10−50.1090.1102.320
Model 15ln(BStem) = a + bln(DBH2HT ρ)−0.2950.6780.9580.037−70.429<0.00011.00063.4 × 10−50.0030.0330.594
ln(BLeaf) = a + bln(DBH2HTNF)−2.8520.5610.7470.103−48.2050.0011.004340.4 × 10−50.0400.0931.952
Table 6. Validation of the allometric relationships between the individual explanatory variables (ρ, HTOT, HT and NF) and the DBH (for estimates of a and b, see Table 4).
Modelr2AICpER%ERRMSE%RMSE
Model 1:
ln(ρ) = a + b × ln(DBH)
0.787−60.0770.0080.0343.4070.0144.845
Model 2:
ln(NF) = a + b × ln(DBH)
0.75013.3710.0120.0757.5523.0989.638
Model 3:
ln(HT) = a + b × ln(DBH)
0.660−3.1110.0260.00060.0680.6457.697
Model 4:
ln(HTOT) = a + b × ln(DBH)
0.927−15.6600.0010.0010.1360.5833.712
Table 7. Validation of the local allometric models of oil palm biomass; estimates for a and b are available in Table 5.
Modelr2AICPER%ERRMSE%RMSE
Allometric Equations Using a Single Explanatory Variable, i.e., Infra-Density or DBH
Model 6: ln(B) = a + bln(DBH)0.88749.6010.0020.0919.10945.38611.253
Model 5: ln(B) = a +bln(ρ)0.75754.9620.0110.0101.07938.1439.457
Allometric Equations Using Height as an Explanatory Variable
Model 8: ln(B) = a +bln(HTOT)0.73055.7120.0140.0121.24241.95410.402
Model 7: ln(B) = a + bln(HT)0.81053.2340.0060.0424.15738.8549.633
Allometric Equations Using DBH and Height as Compound Explanatory Variables
Model 9: ln(B) = a + bln(DBH2HT)0.93945.3050.00030.0656.50133.0278.188
Allometric Equations Using DBH, Height, and ρ as Compound Explanatory Variables
Model 10: ln(B) = bln(DBH2HT ρ)0.96142.1530.00010.0484.81526.7866.641
Model 11: ln(B) = a + bln(DBH2HT ρ)0.96142.2060.00010.0424.24723.3395.786
Allometric Equations Using Biomass Components (Stems, Rachises, Leaves with/without Rachis)
Model 12: ln(B) = [ln(BStem) + ln(BLeaf)] = [a1+b1ln(DBH) + a2+b2ln(DBH)]0.88749.6050.0020.0898,91644.85611.121
Model 13: ln(B) = [ln(BStem) + ln(BFSR) + ln(BRachis)] = [a1+b1ln(DBH2HT) + a2+b2ln(DBH2HTNF) + a3+b3ln(DBH2HTNF)]0.95642.9500.00010.0525.26827.3256.774
Model 14: ln(B) = [ln(BStem) + ln(BLeaf)] = [b1ln(DBH2HTρ) + b2ln(DBH2HTNF)]0.96940.519< 0.00010.0444.42021.3525.294
Model 15: [BStem + BLeaf] = [a1 + b1ln(DBH2HTρ) + a2 + b2ln(DBH2HTNF)]0.97239.922< 0.00010.0363.68420.6925.130
Table 8. Comparison of the existing allometric biomass models to the corresponding local models that were developed in this study.
ReferenceNameER%ERRMSE%RMSE
Allometric Equations Using Height as an Explanatory Variable
Khalid et al. [4]Khal19991.725172.583669.968166.109
Thenkabail et al. [20] (Dry biomass model)Thenk2004b−0.198−19.83896.75223.988
Thenkabail et al. [20] (Fresh biomass model)Thenk2004a−0.077−7.75255.31713.715
This studyModel 70.0424.15738.8549.633
Allometric Equations Using DBH and Height as Compound Explanatory Variables
Saldarriaga et al. [18]Sald1988−0.999−99.999410.677101.821
Hughes et al. [25]Flyn1999−0.999−99.996410.664101.818
This studyModel 90.0656.50133.0278.188
Allometric Equations Using DBH, Height and Infra-Density or Dry Mass Fraction as Composite Explanatory Variables
Goodman et al. [27]Good2013−0.994−99.408408.402101.257
Da Silva et al. [22] (Not compartmentalized allometric biomass model)DaSil2015a0.0242.41337.6999.347
This studyModel 110.0424.24723.3395.786
Allometric Equations Estimating Aboveground Biomass (B) from Biomass Components (Stems, Leaves or Rachis) Using DBH, HT and ρ or NF
Cole and Ewel [26]ColEwe2006−0.211−21.12292.84123.018
Da Silva et al. [22] (Compartmentalized allometric biomass model)DaSil2015b0.0505.00744.15710.948
This studyModel 150.0363.68420.6925.130

