Abstract
Mortise-and-tenon (M–T) joint is a traditional joint type commonly used in wood constructions and wood products. Bending moment capacity (BMC) is a critical criterion to evaluate the strength of the M–T joint. In order to design the M–T joint structure more rationally, many researchers have been devoted to studying on this topic. However, the factors influencing the BMC are too many to conduct comprehensive studies using experimental tests, especially for tenon size. In this study, the BMC and bending stiffness of the M–T joint were studied using a combination of finite element method (FEM) and response surface method to optimize the tenon size of the M–T joint. The results showed that (1) the proposed finite element model was capable of predicting BMC of M–T joints with the ratios of FEM to observed, ranging from 0.852 to 1.072; (2) the BMC and stiffness were significantly affected by tenon size, and tenon length had a more significant effect on BMC than tenon width, while the tenon width affected the bending stiffness more significantly; (3) the response surface model proposed to predict and optimize the BMC of the M–T joint relating to tenon length and tenon width was capable of providing an optimal solution; (4) it was recommended to make the ratio of tenon length to tenon width higher than 1 to get higher BMC of M–T joints. In conclusion, this study will contribute to reducing the cost of a huge amount of experimental tests by applying FEM and the response surface method to design M–T joint wood products.
1. Introduction
Previous studies have found several factors influencing the bending moment capacity (BMC) and bending stiffness of mortise-and-tenon (M–T) joints, such as wood species, annual ring, adhesive type, load type, tenon size, tenon geometry [1,2]. Among these studies, Erdil et al. [3] studied the effects of wood species, adhesive type and tenon size on the bending strength and flexibility of M–T joint T-shaped samples, indicating that the stiffness of M–T joints increased with the increase of tenon length and tenon width, and the tenon width had a more significant effect on BMC than tenon length. Likos et al. [4] evaluated the BMC and moment rotation characteristics of M–T joints as a function of tenon geometry, grain orientation, length, and shoulder fit. The results indicated that the BMC of all joints in which tenons were fully inserted into mortise was 54% greater than joints that were not fully inserted. Oktaee et al. [5] examined the effect of tenon geometry (width, thickness, and length) on the BMC of simple and haunched M–T joints under compression and tension states. Tenon length was found to have the greatest effect on BMC of M–T joints, followed by tenon width. Kasal et al. [6] studied the BMCs of L-shaped mortise and tenon furniture joints under both compression and tension loadings, considering the effects of wood species, adhesive type, and tenon size (width and length), which indicated that the tenon length had a greater effect on the BMC than tenon width. Záborský et al. [7] further studied the effects of wood species, adhesive type, joint type, tenon thickness, loading type, annual rings on bending elastic stiffness of samples. The results suggested that wood species, joint type, and tenon thickness had a significant effect on the bending elastic stiffness, but the loading type and annual ring were not significant.
Some of these studies also derived equations used to predict the BMC of M–T joint based on the regression method. Erdil et al. [3] proposed an empirical regression equation (Equation (1)) considering adhesive type, rail width, tenon width, and shear strength of wood to predict the BMC of M–T joints under compression load. Kasal et al. [6] derived an empirical expression to estimate the BMC of M–T joints under diagonal compression and tension states as functions of wood species, adhesive type, and tenon size shown as Equation (2). Wilczyński and Warmbier [8] calculated regression functions (Equation (3)) of the BMC and bending stiffness under diagonal tension state considering the tenon length, tenon width, and tenon thickness. However, these equations were only effective in the situation in which they were derived.
where M refers to the bending moment capacity (in-lb); a is adhesive type, which is equal to 1, 0.74, 0.79, and 0.83 for polyvinyl acetate (PVA), phenol resorcinol (PR), animal glue, and urea-formaldehyde (UF) adhesives, respectively; W is rail width; D is tenon depth; l is tenon length (in); S is the shear strength of wood (psi).
where M refers to the bending moment capacity (Nm), w is the tenon width, l is the tenon length, and d is the width of shoulder (mm); S is the shear strength of wood (N/mm); k1 is the loading type: k1(tension) = 1, and k1(compression) = 1.006; k2 refers to adhesive type: k2 is equal to 1 and 0.85 for polyurethane (PU) and PVA, respectively.
where M refers to the bending moment capacity (Nm); t, l, and w are thickness, length, and width of the tenon, respectively (mm).
M = a(0.25W + 0.5D)Sl0.8
M = 0.00227(wl)(0.229w + d)S0.42k1k2
M = 1.328t0.167l0.743w0.648
Beyond that, many studies have evaluated the M–T joint strength using the finite element method (FEM), aiming to search a more general method to study the M–T joint. At the early stage, most of these studies mainly focused on the stress distributions of wood products and wood constructions from a qualitative perspective [9,10,11]. Some studies regarded the M–T joint as a rigid joint without considering the contact and bonding behaviors between mortise and tenon [12,13] when establishing the finite element model of the M–T joint. There is no doubt it is unreasonable to assume the M–T joint is a rigid joint, which will much increase the stiffness of the M–T joint and make wood structures more solid. Furthermore, other studies have proposed semi-rigid finite element models to simulate the mechanical behaviors of wood M–T joints using FEM, considering the glue line between mortise and tenon. Among these studies, the glue line was built as a thin layer between mortise and tenon. Some researchers assumed the glue line was 0.1 mm thick around the entire surfaces of tenon [14,15,16]. Prekrat and Smardzewski [17] studied the effect of the glue line shape on the strength of oval M–T joints using FEM, assuming that the glue shape was rectangular and just bonding the flat faces of the joint, and the glue was ellipse-shape and bonding the entire face of the tenon, respectively. Hu et al. [18] determined the thickness of the glue line between oval mortise and tenon using a fluorescence microscope, observing that the thickness of the glue line decreased with the increase of the interference fit between curve surfaces of mortise and tenon, and little glue was observed between curve surfaces. Based on this finding, Hu et al. [19,20] established a semi-rigid M–T joint finite element model and studied the bending and withdrawal resistance of M–T joints.
The above studies confirmed that factors such as wood species, annual ring, adhesive type, load type, tenon size, and tenon geometry significantly affected bending strength by conducting a huge number of experimental tests. The FEM was also proven to be a valid method to evaluate mechanical behaviors of wood M–T joints in a qualitative angle by comparing stress distributions of wood structures. However, until now, a general, efficient, accurate, and low-cost method has not been proposed to replace the huge number of experimental tests in optimizing wood M–T joints.
In this study, the main objective is to evaluate the BMC of M-T joint with various tenon sizes using FEM and response surface method to get the optimal solution of tenon size with maximum BMC from a quantitative perspective. The specific objectives of this study are to (1) verify the proposed finite element model through comparing with the previous experimental results; (2) numerically study the effects of tenon size on BMC and stiffness of M–T joints, and further study the effect of the tenon size on failure modes of M–T joints; (3) optimize the tenon size (length and width) to get the maximum BMC of the M–T joint through response surface method; (4) verify the optimal solution of tenon size based on FEM.
2. Experimental Design
2.1. Materials
The wood used in this study was beech (Fagus orientalis. Lipsky), bought from a local commercial supplier (Nanjing, China). The specific gravity was 0.69, and the moisture content averaged 10.8%. Table 1 shows the mechanical parameters used in the finite element model, which were determined in the previous study [21].

Table 1.
Summary of mechanical properties of solid beech wood.
2.2. Description of Specimens
Figure 1 shows the configurations of mortise-and-tenon joint T-shaped samples used in this study. The post leg measured 200 mm long × 40 mm wide × 40 mm thick, and the dimensions of stretcher were 160 mm long × 40 mm wide × 40 mm thick. A previous study [8] showed that the greatest effect on the joint strength was the tenon length, the influence of the tenon width was less significant, and the effect of the tenon thickness was slight. Therefore, in this study, the tenon length and tenon width were selected as two factors to evaluate the BMC of the M–T joint. The tenon length varied from 10 to 40 mm with an increment of 10 mm, and the tenon width ranged from 15 to 25 mm with an increment of 5 mm, and the tenon thickness was a constant of 10 mm. The interaction between tenon width and mortise height was a 0.2-mm interference fit, and a 0.2-mm clearance fit was applied between tenon thickness and mortise width (Figure 1). The mortise and tenon were bonded by 65% solid content PVA.
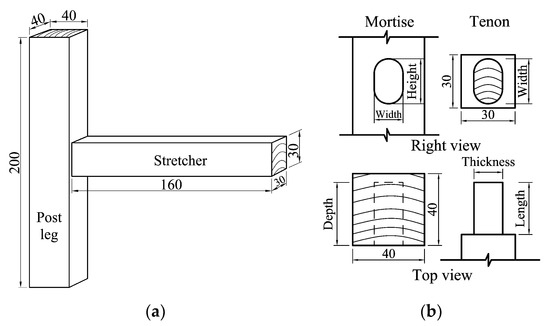
Figure 1.
Dimensions of (a) T-shaped specimens and (b) mortise-and-tenon joint (unit mm).
2.3. Finite Element Model and Simulation Method
Figure 2 shows a 3-D orthotropic finite element model of an M–T joint T-shaped sample established using finite element software (ABAQUS 6.14-1, Dassult, USA). The mechanical properties used in this model were determined from the beechwood shown in Table 1. Ductile damage was used as a stress criterion for wood members in the model, and the parameters needed were fracture strain (0.0083), stress triaxiality (0.333), strain rate (0.01), and failure displacement (0.6452 mm). The grain orientations of post leg and stretcher were differentiated by local coordinates, i.e., x, y, and z corresponded to longitudinal, radial, and tangential directions of wood, respectively. The interactions of mortise and tenon were surface-to-surface contact, for the width direction of the tenon, the penalty contact property was specified with a friction coefficient of 0.54 [22] to simulate the friction behavior with 0.2-mm interference fit. In addition, for the thickness direction of tenon, cohesive behavior was applied to simulate the cohesive bonding behavior. The parameters needed in ABAQUS software Knn, Kss, and Ktt were 1.23, 3.49, and 2.45 N/mm, respectively, measured using the method described in [23]. The loading conditions referenced to a previous study [24], specifically, the boundary conditions were that six-degree freedoms were constrained at two parts, 20 mm from the two ends of the post leg, and a displacement load was imposed on the load head at the point of 30 mm from the end of stretcher to get the ultimate reaction force of load head, which was equal to the ultimate force (F) applied at the loading point (Figure 2). The mesh of the model was also shown in Figure 2, the sizes of all elements were approximate 5 mm, while for contact parts, the sizes of elements were approximate 2 mm to make the model more accurate. The element type assigned to the T-shaped sample was C3D8, an 8-node linear brick element. A 4-node 3-D bilinear rigid quadrilateral element (R3D4) was assigned to load head.
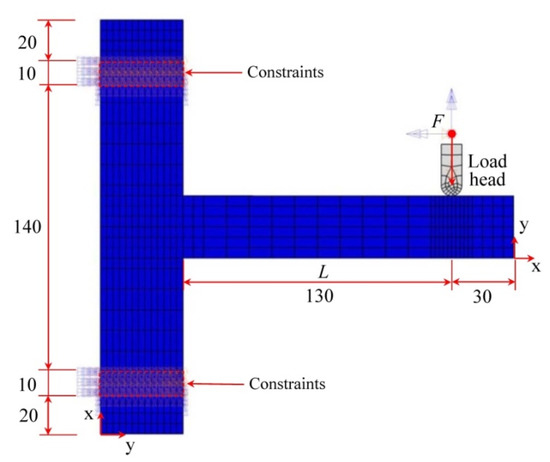
Figure 2.
The finite element model (FEM) of T-shaped mortise-and-tenon joint specimen with load and constraint conditions.
In this study, the effects of tenon width (15, 20, and 25 mm) and tenon length (10, 20, 30, and 40 mm) on BMC of M–T joints were studied, aiming to obtain the optimal tenon size with maximum BMC. Therefore, a complete 3 × 4 factorial numerical simulation was conducted using 12 M–T joint finite element models with different tenon sizes, as shown in Table 2. The BMC and bending stiffness were evaluated by Equations (4) and (5), respectively.
where M is bending moment capacity (Nm); F is the ultimate force (N); L is moment arm (mm); K is bending stiffness (N/mm); ΔF is the change of force in the linear portion of bending load and deflection curve (mm), and Δd is the change of deflection corresponding to ΔF (mm).
M = F × L
K = ΔF/Δd
Table 2.
Combinations of tenon width and tenon length evaluated in this study.
2.4. Verification of Finite Element Model
The finite element model proposed in this study was verified before conducting the numerical and optimal studies. A finite element model was built using the method described above and applied to simulate the experimental tests [24] to get the BMC and compare with the experimental results.
2.5. Statistical Analysis
All data were analyzed by Design Expert (Version 8.06, Stat-Ease, Inc. Minneapolis, MN, USA) using the response surface method. The response surface model was built by the modified cubic regression method, and the model terms were statistically analyzed by analysis of variance (ANOVA) at a 5% significant level. Model numerical optimization was also conducted by Design Expert using the nonlinear programming method.
3. Results and Discussions
3.1. Results of Finite Element Model Verification
Table 3 shows the results of the BMC values of the experiment [24] and those of the finite element model proposed in this study, indicating that the results of FEM were well consistent with those of experimental tests with the ratios of FEM to observed ranging from 0.852 to 1.072. In other words, this finite element model was capable of replacing a large number of experimental tests to study the effect of tenon size on BMC of M–T joints.
Table 3.
Comparisons of bending moment capacities (BMCs) between experiment and FEM.
3.2. Bending Behavior of M–T Joints During Loading Process
Figure 3 shows a typical bending load and deflection curve of the M–T joint (30 mm long × 15 mm wide × 10 mm thick) with four critical load points and a definition of stiffness (K) of the M–T joint. Figure 4 shows the stress distributions of this M–T joint during the loading process corresponding to four critical load points shown in Figure 3.
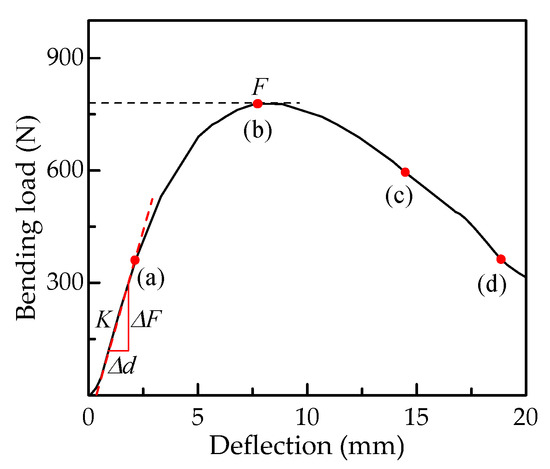
Figure 3.
A typical bending load and deflection curve of the M–T joint measured 30 mm long by 15 mm wide with four critical loading points, (a) 364 N in linear stage, (b) the maximum load 778 N, (c) 594 N at failure stage, and (d) 366 N at failure stage.
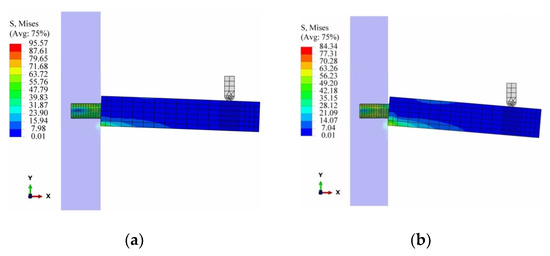
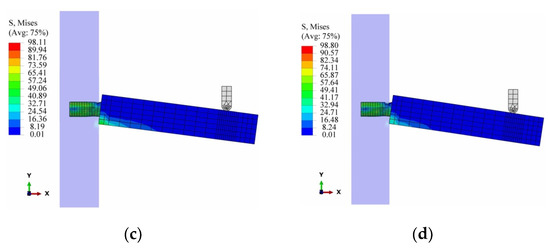
Figure 4.
Stress distributions of the M–T joint T-shaped sample at different loading stages corresponding to the four points shown in Figure 3; (a) 364 N in linear stage, (b) the maximum load 778 N, (c) 594 N at failure stage, and (d) 366 N at failure stage. (unit MPa).
3.3. Bending Moment Capacity and Stiffness of the M–T Joint
Table 4 shows the BMCs and bending stiffness of all combinations of tenon length and tenon width, which indicated that the BMC increased as either tenon width or tenon length increased. Further comparing the effects of tenon width and tenon length on BMC, the tenon length influenced BMC more significantly when the tenon length was relatively short, ranging from 10 to 30 mm. While the effect of tenon length on BMC decreased when the tenon length was longer than 30 mm and tenon width was bigger than 15 mm. The bending stiffness of the M–T joint increased with the increase of tenon width and tenon length in the evaluated ranges. The tenon width had a more significant effect on bending stiffness, whereas this effect of tenon length reduced when the tenon length was longer than 30 mm. These results agree with those of previous studies [5,24].
Table 4.
Bending moment capacities (BMCs) and stiffness of M–T joint based on FEM.
3.4. Failure modes of M–T joints
Figure 5 summarized the failure modes of all finite element models with different tenon sizes. Two typical failure modes were observed. When the tenon length was shorter than tenon width, the failure occurred at the front end of the tenon, indicating that the tenon was completely pulled out from the mortise because of fracture of glue without damage of tenon, and the glue cannot provide enough strength to hold the tenon. In case of the tenon length being longer than or equal to the tenon width, the tenons fractured at the rear end of tenon because of tenon fracture in tension perpendicular to the grain. In other words, the tenon withdrew completely from the mortise when the ratio of tenon width to tenon length was higher than 1, otherwise, the M–T joint failed because of the fracture of tenon at the rear end of the tenon. Therefore, it was recommended to make the tenon length longer than tenon width to get the higher BMC in the design of the M–T joints. In general, the stress at the failure part should reach the peak value. While in the finite element model, once the stress exceeds the ultimate strength of the material, the elements at the places of damage are degraded and deleted, which make the stress at damage part smaller than other undamaged parts.
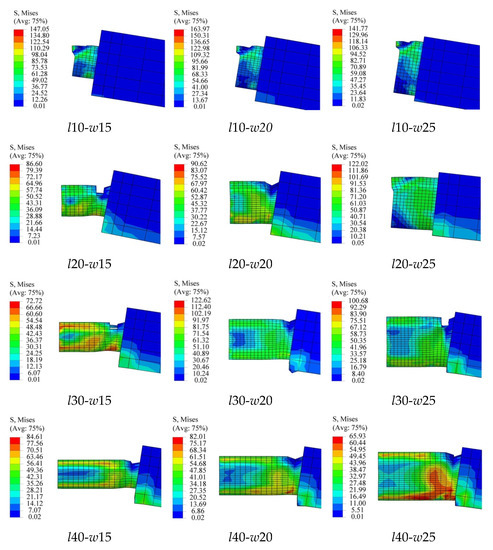
Figure 5.
The failure modes of tenons with different sizes based on FEM. (unit MPa).
3.5. Response Surface Model
Figure 6 shows the response surface model used to predict the BMC of M–T joints relating to the tenon width and tenon length. The response surface reduced cubic model for predicting the BMC of M–T joints was derived, as shown in Equation (6). Additionally, the ANOVA result of model terms is shown in Table 5.
M = 39.072 + 4.627A − 6.4384B + 0.876AB − 0.434A2 − 0.015A2B + 0.008A3
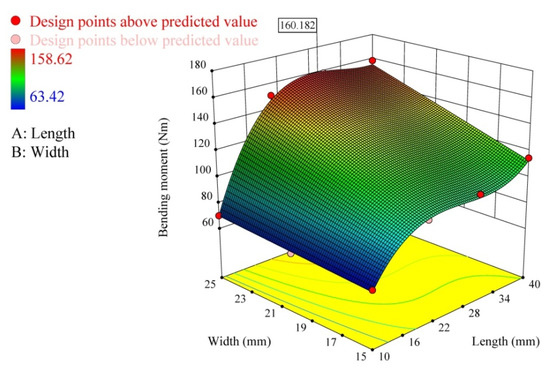
Figure 6.
Response surface model of bending moment relating to tenon width and tenon length.
Table 5.
ANOVA of response surface reduced cubic model.
The model F-value of 142.10 implied that the model was significant. Values of p less than 0.05 indicate that the model terms are significant. In this case, B, AB, A2, A2B, and A3 were significant model terms. The “predicted R-squared” of 0.9494 was in reasonable agreement with the “adjusted R-squared” of 0.9872. Therefore, this model is acceptable to predict the BMC of M–T joint T-shaped samples evaluated in this study.
Furthermore, numerical optimization was conducted, aiming to obtain the maximum BMC of M–T joints using a nonlinear programming method based on Design Expert software. The objective function was the response surface model shown in Equation (6). The constraints were that the tenon length ranged from 10 to 40 mm, and the tenon width varied between 15 and 25 mm. The final goal was to get the maximum BMC. Considering the above conditions, the optimal solution was that the maximum BMC is 160.18 Nm, with the tenon length of 28.81 mm and tenon width 25 mm.
3.6. Verification of the Optimal Solution
Another M–T joint T-shaped finite element model was established using the optimized tenon size, measuring 28.81 mm long by 25 mm thick. Figure 7 shows the results of the finite element model, indicating that the maximum bending load is 1226.75 N (Figure 7b). According to Equation (4), the BMC of optimized M–T joints is 159.48 Nm, which is well consistent with the result of the response surface model (160.18 Nm) and higher than other combinations of tenon widths and tenon lengths evaluated in this study. Therefore, the method of combining FEM and the response surface method is capable of optimizing the BMC of M–T joint T-shaped samples.
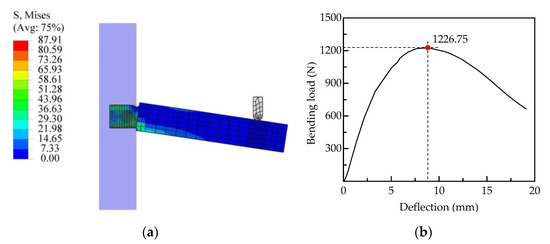
Figure 7.
Results of the finite element model with optimized tenon size, (a) stress distributions (unit MPa), and (b) bending load-deflection curve of M–T joints with maximum bending load values.
4. Conclusions
In this study, bending moment capacity and bending stiffness were studied using FEM and the response surface method to optimize the tenon size. The following conclusions were drawn:
- The proposed finite element model using contact behavior to simulate the glued M–T joint was verified through predicting the bending moment capacity of the M–T joint.
- The BMC and stiffness were significantly affected by tenon size, and tenon length had a more significant effect on bending moment than tenon width, while the tenon width affected the bending stiffness more significantly.
- The proposed method combining FEM and response surface method used to predict and optimize the BMC of M–T joints relating to tenon length and tenon width is capable of replacing the experiments and providing reasonable results without experimental errors.
- It is recommended to make the ratio of tenon length to tenon width greater than 1 to get higher BMC in the design of M–T joints.
In conclusion, the proposed method combining FEM and the response surface method is verified as an efficient way to optimize the M–T joints, which will contribute to the design of M–T joint wood products. Further research will focus on the following points: (1) additional tests will be repeated to make the conclusions more reliable; (2) the relationship between bending moment capacity and furniture structure will be studied based on FEM to better instruct the design of M–T joint wood products.
Author Contributions
Conceptualization, W.H. and N.L.; methodology, W.H.; software, W.H.; validation, W.H. and N.L.; formal analysis, W.H.; investigation, W.H.; resources, W.H.; data curation, W.H. and N.L.; writing—original draft preparation, W.H.; writing—review and editing, W.H. and N.L.; supervision, W.H.; funding acquisition, W.H. All authors have read and agreed to the published version of the manuscript.
Funding
This work was supported by the Scientific Research Foundation of Nanjing Forestry University (GXL2019074), A Project Funded by the National First-class Disciplines (PNFD).
Acknowledgments
The authors would like to express their heartfelt gratitude to the Priority Academic Program Development of Jiangsu Higher Education Institutions. We also would like to thank the anonymous reviewers and editor for their valuable comments and suggestions for improving the quality of this paper.
Conflicts of Interest
The authors declare no conflict of interest.
References
- Eckelman, C.A.; Haviarova, E.; Erdil, Y.Z.; Akcay, H.; Tankut, A.; Tankut, N. Bending moment capacity of round mortise and tenon furniture joints. Forest Prod. J. 2004, 54, 192–197. [Google Scholar]
- Tankut, A.N.; Tankut, N. The effects of joint forms (shape) and dimensions on the strengths of mortise and tenon joints. Turk. J. Agric. For. 2005, 29, 493–498. [Google Scholar]
- Erdil, Y.Z.; Kasal, A.; Eckelman, C.A. Bending moment capacity of rectangular mortise and tenon furniture joints. Forest Prod. J. 2005, 55, 209–213. [Google Scholar]
- Likos, E.; Haviarova, E.; Eckelman, C.A.; Erdil, Y.Z.; Özcifci, A. Effect of tenon geometry, grain orientation, and shoulder on bending moment capacity and moment rotation characteristics of mortise and tenon joints. Wood Fiber Sci. 2012, 44, 462–469. [Google Scholar]
- Oktaee, J.; Ebrahimi, G.; Layeghi, M.; Ghofrani, M.; Eckelman, C.A. Bending moment capacity of simple and haunched mortise and tenon furniture joints under tension and compression loads. Turk. J. Agric. For. 2014, 38, 291–297. [Google Scholar] [CrossRef]
- Kasal, A.; Eckelman, C.A.; Haviarova, E.; Erdil, T.Z.; Yalcin, I. Bending moment capacities of L-shaped mortise and tenon joints under compression and tension loadings. BioResources 2015, 10, 7009–7020. [Google Scholar] [CrossRef]
- Záborský, V.; Borůvka, V.; Kašičková, V.; Ruman, D. Effect of wood species, adhesive type and annual ring directions on the stiffness of rail to leg mortise and tenon furniture joints. BioResources 2017, 12, 7016–7031. [Google Scholar] [CrossRef]
- Wilczyński, A.; Warmbier, K. Effect of joint dimensions on strength and stiffness of tenon joints. Folia For. Pol. 2003, 34, 53–66. [Google Scholar]
- Xi, X.; Yang, Y.; Zhang, Z.F. Pull-out force and finite element analysis of T-type components of Vitex negundo L. scrimber with different node forms. J. Forest Eng. 2020, 5, 182–187. [Google Scholar] [CrossRef]
- Chen, Y.S.; Wu, Z.H. Study on structure optimization design of modified wood furniture tenon structure based on the finite element analysis of ANSYS. J. Intell. Fuzzy. Syst. 2018, 34, 913–922. [Google Scholar] [CrossRef]
- Zhou, C.M.; Yu, M.N.; Zhou, T. Experimental study on three-dimensional shape mapping of complex furniture. EURASIP J. Image Video 2018, 2018, 89. [Google Scholar] [CrossRef]
- Gavronski, T. Rigidity-strength models and stress distribution in housed tenon joints subjected to torsion. Electron. J. Pol. Agric. Univ. 2006. Available online: http://www.ejpau.media.pl/volume9/issue4/art-32.html (accessed on 25 March 2019).
- Çolakoglu, M.H.; Apay, A.C. Finite element analysis of wooden chair strength in free drop. Int. J. Phys. Sci. 2012, 7, 1105–1114. [Google Scholar] [CrossRef]
- Smardzewski, J. Effect of wood species and glue type on contact stresses in a mortise and tenon joint. J. Mec. Eng. Sci. 2008, 222, 2293–2299. [Google Scholar] [CrossRef]
- Derikvand, M.; Ebrahimi, G. Finite element analysis of stress and strain distributions in mortise and loose tenon furniture joints. J. Forestry Res. 2014, 25, 677–681. [Google Scholar] [CrossRef]
- Kasal, A.; Smardzewski, J.; Kuşkun, T.; Erdil, Y.Z. Numerical analyses of various sizes of mortise and tenon furniture joints. BioResources 2016, 11, 6836–6853. [Google Scholar] [CrossRef]
- Prekrat, S.; Smardzewski, J. Effect of glue line shape on strength of mortise and tenon joint. Drv. Ind. 2010, 61, 223–228. [Google Scholar]
- Hu, W.G.; Guan, H.Y.; Zhang, J.L. Finite element analysis of tensile load resistance of mortise–and–tenon joints considering tenon fit effects. Wood Fiber Sci. 2018, 50, 121–131. [Google Scholar] [CrossRef]
- Hu, W.G.; Wan, H.; Guan, H.Y. Size effect on the elastic mechanical properties of beech and its application in finite element analysis of wood structures. Forests 2019, 10, 783. [Google Scholar] [CrossRef]
- Hu, W.G.; Liu, N.; Guan, H.Y. Experimental and numerical study on methods of testing withdrawal resistance of mortise-and-tenon joint for wood products. Forests 2020, 11, 280. [Google Scholar] [CrossRef]
- Hu, W.G.; Guan, H.Y. Study on elastic constants of beech in different stress states. J. Forest Eng. 2017, 2, 31–36. [Google Scholar] [CrossRef]
- Hu, W.G.; Guan, H.Y. Investigation on withdrawal force of mortise and tenon joint based on friction properties. J. Forest Eng. 2017, 2, 158–162. [Google Scholar] [CrossRef]
- Hu, W.G.; Guan, H.Y. A finite element model of semi-rigid mortise-and-tenon joint considering glue line and friction coefficient. J. Wood Sci. 2019, 64, 14. [Google Scholar] [CrossRef]
- Kasal, A.; Havierova, E.; Efe, H.; Eckelman, C.A.; Erdil, Y.Z. Effect of adhesive type and tenon size on bending moment capacity and rigidity of T-shaped furniture joints constructed of Turkish beech and Scots pine. Wood Fiber Sci. 2013, 45, 287–293. [Google Scholar]
© 2020 by the authors. Licensee MDPI, Basel, Switzerland. This article is an open access article distributed under the terms and conditions of the Creative Commons Attribution (CC BY) license (http://creativecommons.org/licenses/by/4.0/).