Downscaling of Long-Term Global Scenarios to Regions with a Forest Sector Model


Abstract
1. Introduction
2. Methods and Data
2.1. Forest Partial Equilibrium Models
2.2. GLOBIOM
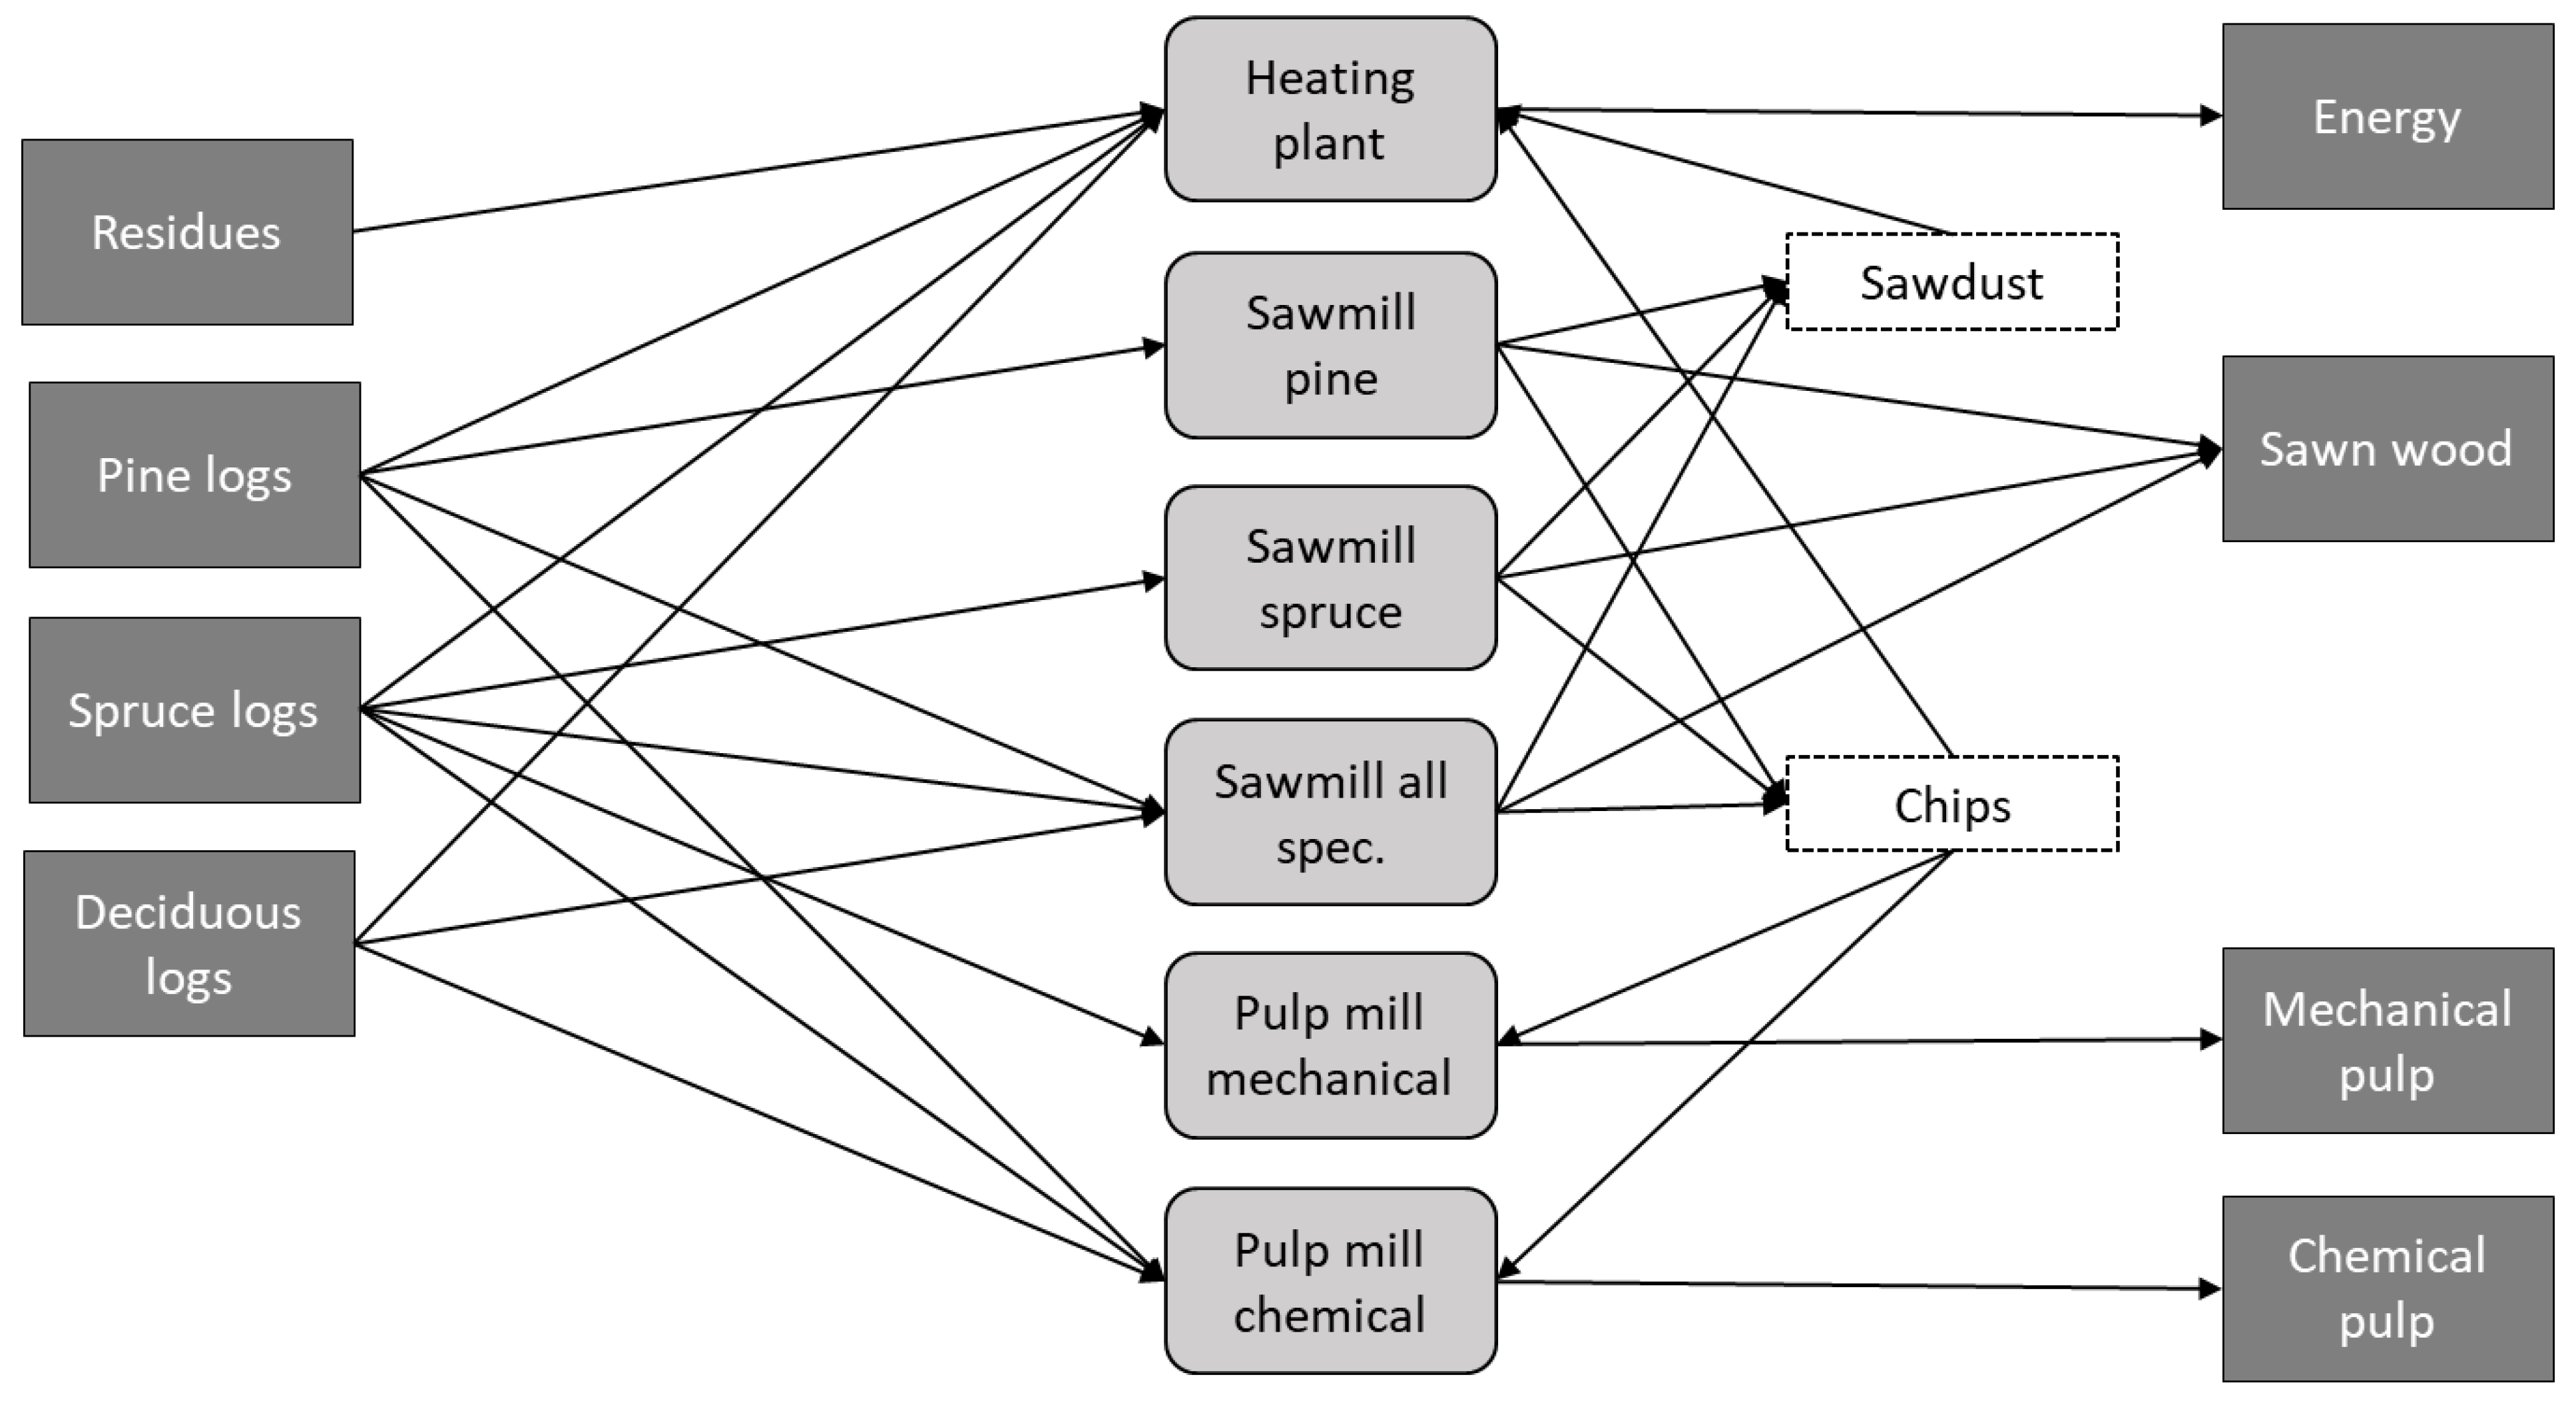
2.3. SweFor
2.4. Data
3. Results
3.1. National Level
3.2. County Level
4. Discussion
5. Conclusions
Author Contributions
Funding
Acknowledgments
Conflicts of Interest
Appendix A
Appendix A.1. Material—Scenarios
Appendix A.2. Scenario Estimates for Sweden

| Scenario | 2010 | 2020 | 2030 | 2040 | 2050 | 2060 | 2070 | 2080 | 2090 | 2100 |
|---|---|---|---|---|---|---|---|---|---|---|
| RCP8p5.SSP1 | 69.73 | 76.36 | 82.83 | 86.22 | 89.93 | 91.87 | 94.04 | 96.00 | 97.95 | 100.03 |
| RCP8p5.SSP2 | 69.73 | 76.28 | 82.83 | 84.54 | 89.57 | 91.34 | 93.34 | 95.17 | 97.31 | 99.61 |
| RCP8p5.SSP3 | 69.73 | 75.66 | 82.57 | 84.15 | 87.38 | 87.75 | 88.13 | 88.17 | 88.18 | 88.32 |
| RCP8p5.SSP4 | 69.73 | 75.95 | 82.83 | 84.85 | 88.97 | 90.58 | 92.24 | 93.51 | 94.90 | 96.15 |
| RCP8p5.SSP5 | 69.73 | 76.55 | 82.83 | 87.45 | 93.29 | 96.73 | 103.51 | 110.88 | 117.49 | 122.95 |
| RCP4p5.SSP1 | 69.73 | 76.36 | 82.83 | 86.22 | 89.92 | 91.86 | 94.04 | 95.94 | 97.89 | 100.37 |
| RCP4p5.SSP2 | 69.73 | 76.29 | 82.83 | 84.55 | 88.96 | 90.73 | 92.82 | 94.68 | 97.06 | 99.88 |
| RCP4p5.SSP3 | 69.73 | 75.66 | 82.58 | 84.16 | 87.37 | 87.74 | 88.12 | 88.16 | 88.18 | 88.41 |
| RCP4p5.SSP4 | 69.73 | 75.95 | 82.83 | 84.85 | 89.42 | 91.11 | 92.69 | 94.16 | 95.33 | 96.98 |
| RCP4p5.SSP5 | 69.73 | 76.55 | 82.83 | 87.45 | 93.28 | 96.73 | 103.51 | 110.86 | 117.36 | 122.95 |
| RCP2p6.SSP1 | 69.73 | 76.36 | 82.83 | 86.22 | 89.93 | 92.06 | 94.75 | 97.86 | 102.31 | 112.56 |
| RCP2p6.SSP2 | 69.73 | 76.30 | 82.83 | 84.55 | 88.96 | 90.91 | 93.36 | 96.89 | 103.33 | 115.23 |
| RCP2p6.SSP3 | 69.73 | 75.70 | 82.64 | 84.18 | 87.38 | 88.05 | 88.90 | 90.06 | 96.04 | 107.92 |
| RCP2p6.SSP4 | 69.73 | 75.95 | 82.83 | 84.82 | 89.36 | 91.07 | 93.10 | 95.36 | 99.40 | 109.68 |
| RCP2p6.SSP5 | 69.73 | 76.55 | 82.83 | 87.45 | 93.29 | 97.34 | 104.70 | 113.03 | 122.22 | 123.00 |
| Scenario | 2010 | 2020 | 2030 | 2040 | 2050 | 2060 | 2070 | 2080 | 2090 | 2100 |
|---|---|---|---|---|---|---|---|---|---|---|
| RCP8p5.SSP1 | 63.83 | 68.76 | 73.58 | 76.11 | 78.88 | 80.33 | 81.95 | 83.42 | 84.87 | 86.42 |
| RCP8p5.SSP2 | 63.83 | 68.70 | 73.58 | 74.85 | 78.61 | 79.94 | 81.43 | 82.79 | 84.39 | 86.11 |
| RCP8p5.SSP3 | 63.83 | 68.24 | 73.38 | 74.56 | 76.98 | 77.25 | 77.54 | 77.57 | 77.57 | 77.68 |
| RCP8p5.SSP4 | 63.83 | 68.46 | 73.58 | 75.09 | 78.16 | 79.37 | 80.61 | 81.56 | 82.59 | 83.53 |
| RCP8p5.SSP5 | 63.83 | 68.90 | 73.58 | 77.03 | 81.39 | 83.97 | 89.03 | 94.55 | 99.48 | 103.56 |
| RCP4p5.SSP1 | 63.83 | 68.76 | 73.58 | 76.11 | 78.88 | 80.32 | 81.95 | 83.37 | 84.82 | 86.68 |
| RCP4p5.SSP2 | 63.83 | 68.71 | 73.58 | 74.86 | 78.16 | 79.48 | 81.04 | 82.43 | 84.21 | 86.31 |
| RCP4p5.SSP3 | 63.83 | 68.24 | 73.39 | 74.57 | 76.97 | 77.24 | 77.53 | 77.56 | 77.57 | 77.74 |
| RCP4p5.SSP4 | 63.83 | 68.46 | 73.58 | 75.08 | 78.50 | 79.77 | 80.95 | 82.04 | 82.91 | 84.15 |
| RCP4p5.SSP5 | 63.83 | 68.90 | 73.58 | 77.03 | 81.39 | 83.96 | 89.03 | 94.53 | 99.38 | 103.56 |
| RCP2p6.SSP1 | 63.83 | 68.76 | 73.58 | 76.11 | 78.88 | 80.47 | 82.48 | 84.81 | 88.13 | 95.79 |
| RCP2p6.SSP2 | 63.83 | 68.72 | 73.58 | 74.86 | 78.16 | 79.61 | 81.44 | 84.08 | 88.89 | 97.79 |
| RCP2p6.SSP3 | 63.83 | 68.27 | 73.43 | 74.58 | 76.97 | 77.48 | 78.11 | 78.98 | 83.45 | 92.33 |
| RCP2p6.SSP4 | 63.83 | 68.46 | 73.58 | 75.06 | 78.45 | 79.73 | 81.25 | 82.94 | 85.95 | 93.65 |
| RCP2p6.SSP5 | 63.83 | 68.90 | 73.58 | 77.03 | 81.40 | 84.42 | 89.92 | 96.15 | 103.01 | 103.60 |
| Scenario | 2010 | 2020 | 2030 | 2040 | 2050 | 2060 | 2070 | 2080 | 2090 | 2100 |
|---|---|---|---|---|---|---|---|---|---|---|
| RCP8p5.SSP1 | 33.00 | 36.29 | 40.28 | 42.37 | 43.46 | 44.63 | 45.97 | 46.57 | 47.16 | 48.01 |
| RCP8p5.SSP2 | 33.00 | 36.24 | 40.07 | 40.99 | 42.78 | 43.82 | 45.02 | 45.55 | 46.29 | 47.28 |
| RCP8p5.SSP3 | 33.00 | 35.92 | 39.35 | 40.54 | 41.25 | 41.45 | 41.65 | 41.65 | 41.65 | 41.65 |
| RCP8p5.SSP4 | 33.00 | 36.03 | 39.91 | 40.97 | 42.48 | 43.44 | 44.45 | 44.83 | 45.25 | 45.63 |
| RCP8p5.SSP5 | 33.00 | 36.31 | 40.06 | 42.37 | 44.96 | 47.27 | 50.89 | 54.36 | 57.18 | 59.51 |
| RCP4p5.SSP1 | 33.00 | 36.29 | 40.28 | 42.37 | 43.47 | 44.64 | 45.98 | 46.56 | 47.16 | 48.02 |
| RCP4p5.SSP2 | 33.00 | 36.24 | 39.92 | 40.84 | 42.43 | 43.46 | 44.74 | 45.31 | 46.05 | 47.06 |
| RCP4p5.SSP3 | 33.00 | 35.92 | 39.35 | 40.54 | 41.25 | 41.45 | 41.65 | 41.65 | 41.65 | 41.65 |
| RCP4p5.SSP4 | 33.00 | 36.03 | 39.91 | 40.96 | 42.51 | 43.54 | 44.48 | 44.93 | 45.28 | 45.79 |
| RCP4p5.SSP5 | 33.00 | 36.31 | 40.05 | 42.37 | 44.96 | 47.27 | 50.89 | 54.35 | 57.12 | 59.51 |
| RCP2p6.SSP1 | 33.00 | 36.29 | 40.28 | 42.37 | 43.47 | 44.79 | 46.06 | 47.01 | 49.17 | 50.83 |
| RCP2p6.SSP2 | 33.00 | 36.25 | 39.92 | 40.84 | 42.44 | 43.61 | 44.97 | 46.05 | 48.15 | 49.92 |
| RCP2p6.SSP3 | 33.00 | 35.95 | 39.39 | 40.55 | 41.27 | 41.60 | 41.95 | 41.95 | 41.95 | 41.95 |
| RCP2p6.SSP4 | 33.00 | 36.03 | 39.91 | 40.94 | 42.45 | 43.48 | 44.55 | 45.24 | 46.17 | 46.83 |
| RCP2p6.SSP5 | 33.00 | 36.31 | 40.05 | 42.37 | 44.96 | 47.59 | 51.64 | 55.27 | 59.20 | 59.53 |
| Scenario | 2010 | 2020 | 2030 | 2040 | 2050 | 2060 | 2070 | 2080 | 2090 | 2100 |
|---|---|---|---|---|---|---|---|---|---|---|
| RCP8p5.SSP1 | 30.33 | 31.98 | 32.81 | 33.27 | 34.95 | 35.22 | 35.51 | 36.37 | 37.23 | 37.94 |
| RCP8p5.SSP2 | 30.33 | 31.97 | 33.02 | 33.38 | 35.36 | 35.64 | 35.94 | 36.76 | 37.62 | 38.36 |
| RCP8p5.SSP3 | 30.33 | 31.83 | 33.54 | 33.54 | 35.25 | 35.32 | 35.40 | 35.43 | 35.43 | 35.53 |
| RCP8p5.SSP4 | 30.33 | 31.93 | 33.18 | 33.64 | 35.21 | 35.45 | 35.68 | 36.24 | 36.87 | 37.42 |
| RCP8p5.SSP5 | 30.33 | 32.10 | 33.04 | 34.19 | 35.96 | 36.23 | 37.68 | 39.72 | 41.84 | 43.60 |
| RCP4p5.SSP1 | 30.33 | 31.98 | 32.81 | 33.27 | 34.93 | 35.21 | 35.49 | 36.33 | 37.19 | 38.19 |
| RCP4p5.SSP2 | 30.33 | 31.97 | 33.17 | 33.54 | 35.26 | 35.54 | 35.82 | 36.64 | 37.68 | 38.78 |
| RCP4p5.SSP3 | 30.33 | 31.83 | 33.55 | 33.55 | 35.24 | 35.31 | 35.39 | 35.42 | 35.43 | 35.60 |
| RCP4p5.SSP4 | 30.33 | 31.93 | 33.18 | 33.64 | 35.52 | 35.75 | 35.99 | 36.63 | 37.15 | 37.88 |
| RCP4p5.SSP5 | 30.33 | 32.10 | 33.04 | 34.19 | 35.96 | 36.23 | 37.67 | 39.72 | 41.80 | 43.60 |
| RCP2p6.SSP1 | 30.33 | 31.98 | 32.81 | 33.27 | 34.93 | 35.21 | 35.95 | 37.32 | 38.48 | 44.49 |
| RCP2p6.SSP2 | 30.33 | 31.97 | 33.17 | 33.54 | 35.25 | 35.53 | 36.00 | 37.55 | 40.27 | 47.41 |
| RCP2p6.SSP3 | 30.33 | 31.83 | 33.56 | 33.56 | 35.22 | 35.39 | 35.67 | 36.54 | 41.02 | 49.92 |
| RCP2p6.SSP4 | 30.33 | 31.93 | 33.18 | 33.64 | 35.54 | 35.77 | 36.22 | 37.22 | 39.31 | 46.35 |
| RCP2p6.SSP5 | 30.33 | 32.10 | 33.04 | 34.19 | 35.97 | 36.36 | 37.82 | 40.42 | 43.36 | 43.64 |
| Scenario | 2010 | 2020 | 2030 | 2040 | 2050 | 2060 | 2070 | 2080 | 2090 | 2100 |
|---|---|---|---|---|---|---|---|---|---|---|
| RCP8p5.SSP1 | 9.88 | 16.04 | 26.19 | 27.31 | 31.60 | 31.60 | 31.60 | 31.60 | 31.60 | 31.60 |
| RCP8p5.SSP2 | 9.88 | 16.21 | 26.22 | 27.64 | 31.50 | 31.50 | 31.50 | 31.50 | 31.50 | 31.50 |
| RCP8p5.SSP3 | 9.88 | 16.40 | 25.56 | 27.05 | 30.88 | 30.88 | 30.88 | 30.88 | 30.88 | 30.88 |
| RCP8p5.SSP4 | 9.88 | 15.85 | 25.66 | 27.01 | 31.33 | 31.33 | 31.33 | 31.33 | 31.33 | 31.33 |
| RCP8p5.SSP5 | 9.88 | 15.94 | 26.06 | 26.80 | 30.65 | 30.65 | 30.65 | 30.65 | 30.65 | 30.65 |
| RCP4p5.SSP1 | 9.88 | 16.04 | 26.19 | 27.31 | 31.60 | 31.60 | 31.60 | 31.60 | 31.60 | 31.60 |
| RCP4p5.SSP2 | 9.88 | 15.87 | 25.70 | 27.12 | 31.33 | 31.33 | 31.33 | 31.33 | 31.33 | 31.33 |
| RCP4p5.SSP3 | 9.88 | 16.38 | 25.54 | 27.03 | 30.87 | 30.87 | 30.87 | 30.87 | 30.87 | 30.87 |
| RCP4p5.SSP4 | 9.88 | 16.19 | 26.02 | 27.36 | 31.46 | 31.46 | 31.46 | 31.46 | 31.46 | 31.46 |
| RCP4p5.SSP5 | 9.88 | 15.94 | 26.06 | 26.80 | 30.65 | 30.65 | 30.65 | 30.65 | 30.65 | 30.65 |
| RCP2p6.SSP1 | 9.88 | 16.04 | 26.19 | 27.31 | 31.60 | 31.60 | 31.60 | 33.85 | 35.12 | 38.02 |
| RCP2p6.SSP2 | 9.88 | 15.87 | 25.70 | 27.12 | 31.33 | 31.33 | 31.33 | 33.58 | 35.40 | 38.78 |
| RCP2p6.SSP3 | 9.88 | 16.37 | 25.51 | 27.01 | 30.88 | 30.88 | 30.88 | 31.64 | 33.34 | 36.71 |
| RCP2p6.SSP4 | 9.88 | 16.19 | 26.02 | 27.37 | 31.44 | 31.44 | 31.44 | 33.14 | 34.29 | 37.21 |
| RCP2p6.SSP5 | 9.88 | 15.94 | 26.06 | 26.80 | 30.64 | 30.64 | 30.64 | 37.25 | 40.76 | 40.99 |
| Scenario | 2010 | 2020 | 2030 | 2040 | 2050 | 2060 | 2070 | 2080 | 2090 | 2100 |
|---|---|---|---|---|---|---|---|---|---|---|
| RCP8p5.SSP1 | 64.85 | 70.52 | 74.88 | 82.43 | 91.12 | 85.49 | 86.40 | 85.95 | 87.05 | 87.86 |
| RCP8p5.SSP2 | 64.85 | 70.39 | 72.66 | 80.36 | 84.94 | 82.19 | 85.49 | 86.27 | 85.66 | 88.89 |
| RCP8p5.SSP3 | 64.85 | 70.39 | 71.61 | 77.65 | 80.56 | 74.21 | 74.21 | 74.21 | 72.56 | 69.16 |
| RCP8p5.SSP4 | 64.85 | 70.39 | 72.88 | 81.52 | 85.18 | 80.63 | 81.54 | 79.53 | 80.15 | 79.40 |
| RCP8p5.SSP5 | 64.85 | 71.23 | 78.90 | 88.63 | 93.67 | 92.77 | 96.10 | 103.15 | 130.51 | 171.57 |
| RCP4p5.SSP1 | 64.85 | 70.52 | 74.84 | 82.43 | 91.12 | 85.49 | 86.40 | 85.95 | 87.05 | 90.21 |
| RCP4p5.SSP2 | 64.85 | 70.39 | 73.77 | 81.52 | 85.06 | 82.37 | 85.40 | 83.87 | 83.89 | 90.85 |
| RCP4p5.SSP3 | 64.85 | 70.39 | 71.61 | 77.65 | 80.56 | 74.21 | 74.21 | 74.21 | 71.53 | 70.41 |
| RCP4p5.SSP4 | 64.85 | 70.39 | 72.66 | 81.52 | 85.06 | 81.04 | 81.79 | 79.03 | 78.48 | 82.46 |
| RCP4p5.SSP5 | 64.85 | 71.23 | 78.85 | 88.64 | 93.67 | 92.77 | 96.15 | 103.26 | 130.43 | 173.80 |
| RCP2p6.SSP1 | 64.85 | 70.52 | 74.80 | 82.43 | 91.16 | 86.17 | 90.46 | 92.20 | 89.01 | 96.93 |
| RCP2p6.SSP2 | 64.85 | 70.39 | 73.79 | 81.52 | 85.06 | 84.14 | 86.94 | 91.58 | 90.44 | 99.75 |
| RCP2p6.SSP3 | 64.85 | 70.39 | 71.60 | 77.96 | 80.56 | 74.21 | 74.21 | 74.36 | 83.44 | 93.51 |
| RCP2p6.SSP4 | 64.85 | 70.39 | 72.66 | 81.52 | 84.99 | 82.34 | 84.24 | 84.21 | 88.55 | 97.07 |
| RCP2p6.SSP5 | 64.85 | 71.23 | 78.89 | 88.63 | 93.67 | 92.77 | 96.95 | 119.01 | 146.46 | 210.47 |
| Scenario | 2010 | 2020 | 2030 | 2040 | 2050 | 2060 | 2070 | 2080 | 2090 | 2100 |
|---|---|---|---|---|---|---|---|---|---|---|
| RCP8p5.SSP1 | 48.99 | 54.56 | 58.93 | 65.69 | 68.73 | 63.11 | 64.02 | 63.56 | 64.67 | 65.48 |
| RCP8p5.SSP2 | 48.99 | 54.44 | 56.70 | 64.40 | 66.63 | 63.88 | 63.10 | 63.88 | 66.31 | 67.06 |
| RCP8p5.SSP3 | 48.99 | 54.44 | 55.65 | 61.69 | 64.61 | 58.25 | 58.25 | 58.25 | 56.61 | 53.20 |
| RCP8p5.SSP4 | 48.99 | 54.44 | 56.93 | 65.57 | 66.87 | 62.32 | 63.19 | 61.23 | 61.85 | 61.10 |
| RCP8p5.SSP5 | 48.99 | 55.27 | 62.95 | 68.12 | 71.28 | 70.39 | 73.71 | 74.85 | 84.14 | 90.66 |
| RCP4p5.SSP1 | 48.99 | 54.56 | 58.89 | 65.69 | 68.74 | 63.11 | 64.01 | 63.57 | 64.67 | 67.82 |
| RCP4p5.SSP2 | 48.99 | 54.44 | 57.82 | 65.57 | 66.75 | 64.07 | 65.46 | 65.57 | 65.57 | 68.46 |
| RCP4p5.SSP3 | 48.99 | 54.44 | 55.65 | 61.69 | 64.61 | 58.25 | 58.25 | 58.25 | 55.58 | 54.46 |
| RCP4p5.SSP4 | 48.99 | 54.44 | 56.70 | 65.57 | 66.75 | 62.73 | 59.40 | 60.73 | 60.17 | 64.16 |
| RCP4p5.SSP5 | 48.99 | 55.27 | 62.90 | 68.12 | 71.28 | 70.39 | 73.76 | 74.38 | 82.31 | 91.24 |
| RCP2p6.SSP1 | 48.99 | 54.56 | 58.85 | 65.69 | 68.78 | 63.79 | 68.07 | 69.82 | 66.62 | 74.55 |
| RCP2p6.SSP2 | 48.99 | 54.44 | 57.83 | 65.57 | 66.75 | 65.83 | 66.91 | 69.19 | 68.05 | 77.37 |
| RCP2p6.SSP3 | 48.99 | 54.44 | 55.65 | 62.01 | 64.61 | 58.25 | 58.25 | 58.41 | 67.48 | 77.56 |
| RCP2p6.SSP4 | 48.99 | 54.44 | 56.70 | 65.57 | 66.69 | 64.03 | 63.41 | 65.91 | 66.26 | 74.68 |
| RCP2p6.SSP5 | 48.99 | 55.27 | 62.93 | 68.11 | 71.28 | 70.39 | 74.57 | 84.34 | 94.09 | 138.06 |
Appendix A.3. Scenario Estimates for Germany
| Scenario | 2010 | 2020 | 2030 | 2040 | 2050 | 2060 | 2070 | 2080 | 2090 | 2100 |
|---|---|---|---|---|---|---|---|---|---|---|
| RCP8.5.SSP1 | 77.57 | 86.51 | 90.91 | 96.56 | 101.58 | 106.75 | 111.96 | 114.50 | 116.84 | 119.07 |
| RCP8.5.SSP2 | 77.57 | 86.35 | 90.37 | 94.43 | 98.85 | 102.77 | 107.66 | 110.44 | 113.44 | 116.95 |
| RCP8.5.SSP3 | 77.57 | 86.04 | 88.72 | 91.17 | 91.74 | 91.76 | 91.78 | 91.78 | 91.78 | 91.78 |
| RCP8.5.SSP4 | 77.57 | 86.22 | 90.04 | 95.10 | 98.62 | 102.69 | 106.15 | 107.23 | 108.53 | 109.55 |
| RCP8.5.SSP5 | 77.57 | 86.79 | 92.65 | 100.14 | 109.06 | 119.26 | 130.78 | 131.00 | 131.01 | 131.01 |
| RCP4p5.SSP1 | 77.57 | 86.51 | 90.91 | 96.52 | 101.55 | 106.75 | 111.95 | 114.43 | 116.69 | 120.08 |
| RCP4p5.SSP2 | 77.57 | 86.25 | 90.19 | 94.27 | 98.71 | 102.60 | 107.56 | 110.24 | 113.33 | 118.16 |
| RCP4p5.SSP3 | 77.57 | 86.04 | 88.72 | 91.17 | 91.74 | 91.76 | 91.78 | 91.78 | 91.78 | 91.78 |
| RCP4p5.SSP4 | 77.57 | 86.27 | 90.49 | 95.36 | 98.96 | 102.90 | 106.60 | 107.61 | 108.82 | 110.75 |
| RCP4p5.SSP5 | 77.57 | 86.79 | 92.65 | 100.15 | 108.98 | 119.14 | 130.47 | 131.00 | 131.01 | 131.01 |
| RCP2p6.SSP1 | 77.57 | 86.51 | 90.88 | 96.48 | 101.46 | 108.66 | 114.36 | 122.43 | 130.94 | 131.01 |
| RCP2p6.SSP2 | 77.57 | 86.25 | 90.19 | 94.28 | 98.71 | 104.94 | 110.64 | 122.19 | 130.94 | 131.01 |
| RCP2p6.SSP3 | 77.57 | 86.09 | 88.77 | 91.24 | 91.80 | 92.66 | 92.69 | 106.69 | 129.32 | 130.99 |
| RCP2p6.SSP4 | 77.57 | 86.27 | 90.51 | 95.35 | 99.39 | 105.27 | 109.32 | 119.25 | 130.92 | 131.01 |
| RCP2p6.SSP5 | 77.57 | 86.79 | 92.65 | 100.13 | 109.00 | 120.40 | 130.93 | 131.01 | 131.01 | 131.01 |
| Scenario | 2010 | 2020 | 2030 | 2040 | 2050 | 2060 | 2070 | 2080 | 2090 | 2100 |
|---|---|---|---|---|---|---|---|---|---|---|
| RCP8.5.SSP1 | 64.70 | 71.40 | 74.69 | 78.93 | 82.69 | 86.57 | 90.47 | 92.37 | 94.13 | 95.80 |
| RCP8.5.SSP2 | 64.70 | 71.28 | 74.29 | 77.33 | 80.65 | 83.59 | 87.25 | 89.33 | 91.58 | 94.21 |
| RCP8.5.SSP3 | 64.70 | 71.05 | 73.05 | 74.89 | 75.32 | 75.34 | 75.35 | 75.35 | 75.35 | 75.35 |
| RCP8.5.SSP4 | 64.70 | 71.18 | 74.04 | 77.84 | 80.48 | 83.52 | 86.11 | 86.93 | 87.90 | 88.66 |
| RCP8.5.SSP5 | 64.70 | 71.61 | 76.00 | 81.61 | 88.30 | 95.94 | 104.57 | 104.74 | 104.74 | 104.74 |
| RCP4p5.SSP1 | 64.70 | 71.40 | 74.69 | 78.90 | 82.67 | 86.56 | 90.46 | 92.33 | 94.02 | 96.56 |
| RCP4p5.SSP2 | 64.70 | 71.20 | 74.16 | 77.21 | 80.54 | 83.46 | 87.17 | 89.18 | 91.50 | 95.12 |
| RCP4p5.SSP3 | 64.70 | 71.05 | 73.05 | 74.89 | 75.32 | 75.34 | 75.35 | 75.35 | 75.35 | 75.35 |
| RCP4p5.SSP4 | 64.70 | 71.22 | 74.38 | 78.03 | 80.73 | 83.68 | 86.45 | 87.21 | 88.12 | 89.57 |
| RCP4p5.SSP5 | 64.70 | 71.61 | 76.00 | 81.61 | 88.23 | 95.85 | 104.34 | 104.74 | 104.74 | 104.74 |
| RCP2p6.SSP1 | 64.70 | 71.40 | 74.67 | 78.87 | 82.60 | 88.00 | 92.27 | 98.32 | 104.69 | 104.74 |
| RCP2p6.SSP2 | 64.70 | 71.20 | 74.16 | 77.22 | 80.54 | 85.21 | 89.48 | 98.14 | 104.69 | 104.74 |
| RCP2p6.SSP3 | 64.70 | 71.08 | 73.09 | 74.95 | 75.37 | 76.01 | 76.03 | 86.52 | 103.48 | 104.73 |
| RCP2p6.SSP4 | 64.70 | 71.22 | 74.39 | 78.03 | 81.05 | 85.46 | 88.49 | 95.94 | 104.68 | 104.74 |
| RCP2p6.SSP5 | 64.70 | 71.61 | 76.00 | 81.60 | 88.25 | 96.80 | 104.68 | 104.74 | 104.74 | 104.74 |
| Scenario | 2010 | 2020 | 2030 | 2040 | 2050 | 2060 | 2070 | 2080 | 2090 | 2100 |
|---|---|---|---|---|---|---|---|---|---|---|
| RCP8.5.SSP1 | 42.04 | 46.41 | 49.67 | 53.85 | 57.53 | 61.01 | 64.25 | 65.29 | 66.62 | 67.97 |
| RCP8.5.SSP2 | 42.04 | 46.24 | 49.22 | 52.24 | 55.45 | 57.99 | 61.26 | 62.39 | 64.09 | 66.22 |
| RCP8.5.SSP3 | 42.04 | 45.99 | 47.99 | 49.83 | 50.22 | 50.24 | 50.25 | 50.25 | 50.25 | 50.25 |
| RCP8.5.SSP4 | 42.04 | 46.19 | 49.03 | 52.78 | 55.35 | 57.81 | 59.89 | 60.27 | 60.97 | 61.55 |
| RCP8.5.SSP5 | 42.04 | 46.76 | 51.10 | 56.57 | 62.39 | 68.57 | 75.99 | 76.60 | 76.60 | 76.60 |
| RCP4p5.SSP1 | 42.04 | 46.41 | 49.67 | 53.81 | 57.50 | 61.00 | 64.24 | 65.24 | 66.51 | 68.12 |
| RCP4p5.SSP2 | 42.04 | 46.24 | 49.16 | 52.20 | 55.41 | 57.93 | 61.18 | 62.30 | 64.05 | 66.65 |
| RCP4p5.SSP3 | 42.04 | 45.99 | 47.99 | 49.83 | 50.22 | 50.24 | 50.25 | 50.25 | 50.25 | 50.25 |
| RCP4p5.SSP4 | 42.04 | 46.19 | 49.32 | 52.92 | 55.50 | 57.87 | 60.13 | 60.46 | 61.09 | 61.62 |
| RCP4p5.SSP5 | 42.04 | 46.76 | 51.10 | 56.57 | 62.33 | 68.49 | 75.77 | 76.60 | 76.60 | 76.60 |
| RCP2p6.SSP1 | 42.04 | 46.41 | 49.65 | 53.79 | 57.44 | 61.14 | 64.73 | 66.93 | 68.44 | 68.57 |
| RCP2p6.SSP2 | 42.04 | 46.24 | 49.16 | 52.20 | 55.42 | 58.71 | 62.21 | 63.62 | 66.41 | 66.58 |
| RCP2p6.SSP3 | 42.04 | 46.03 | 48.04 | 49.88 | 50.27 | 50.82 | 50.84 | 50.84 | 50.85 | 50.86 |
| RCP2p6.SSP4 | 42.04 | 46.19 | 49.33 | 52.92 | 55.88 | 58.73 | 60.92 | 61.72 | 62.34 | 62.46 |
| RCP2p6.SSP5 | 42.04 | 46.76 | 51.10 | 56.56 | 62.35 | 68.57 | 75.15 | 76.02 | 76.60 | 76.60 |
| Scenario | 2010 | 2020 | 2030 | 2040 | 2050 | 2060 | 2070 | 2080 | 2090 | 2100 |
|---|---|---|---|---|---|---|---|---|---|---|
| RCP8.5.SSP1 | 22.66 | 25.02 | 25.02 | 25.08 | 25.16 | 25.56 | 26.22 | 27.08 | 27.51 | 27.84 |
| RCP8.5.SSP2 | 22.66 | 25.07 | 25.07 | 25.09 | 25.20 | 25.60 | 25.99 | 26.94 | 27.50 | 27.99 |
| RCP8.5.SSP3 | 22.66 | 25.06 | 25.06 | 25.06 | 25.06 | 25.06 | 25.06 | 25.06 | 25.06 | 25.06 |
| RCP8.5.SSP4 | 22.66 | 25.01 | 25.01 | 25.06 | 25.13 | 25.71 | 26.23 | 26.62 | 26.89 | 27.08 |
| RCP8.5.SSP5 | 22.66 | 24.88 | 24.90 | 25.04 | 25.94 | 27.40 | 28.65 | 28.43 | 28.46 | 28.49 |
| RCP4p5.SSP1 | 22.66 | 25.02 | 25.02 | 25.08 | 25.16 | 25.56 | 26.22 | 27.09 | 27.51 | 28.44 |
| RCP4p5.SSP2 | 22.66 | 24.99 | 24.99 | 25.01 | 25.13 | 25.52 | 25.99 | 26.89 | 27.45 | 28.47 |
| RCP4p5.SSP3 | 22.66 | 25.06 | 25.06 | 25.06 | 25.06 | 25.06 | 25.06 | 25.06 | 25.06 | 25.06 |
| RCP4p5.SSP4 | 22.66 | 25.06 | 25.06 | 25.10 | 25.23 | 25.81 | 26.33 | 26.72 | 26.99 | 27.95 |
| RCP4p5.SSP5 | 22.66 | 24.88 | 24.90 | 25.04 | 25.93 | 27.39 | 28.64 | 28.43 | 28.46 | 28.46 |
| RCP2p6.SSP1 | 22.66 | 25.02 | 25.02 | 25.08 | 25.16 | 26.86 | 27.54 | 31.42 | 36.36 | 36.36 |
| RCP2p6.SSP2 | 22.66 | 24.99 | 24.99 | 25.01 | 25.13 | 26.50 | 27.27 | 34.57 | 38.41 | 38.42 |
| RCP2p6.SSP3 | 22.66 | 25.06 | 25.06 | 25.06 | 25.06 | 25.16 | 25.16 | 35.74 | 52.75 | 54.06 |
| RCP2p6.SSP4 | 22.66 | 25.06 | 25.06 | 25.10 | 25.17 | 26.73 | 27.57 | 34.25 | 42.47 | 42.47 |
| RCP2p6.SSP5 | 22.66 | 24.88 | 24.90 | 25.04 | 25.93 | 28.28 | 29.64 | 29.07 | 28.56 | 28.56 |
| Scenario | 2010 | 2020 | 2030 | 2040 | 2050 | 2060 | 2070 | 2080 | 2090 | 2100 |
|---|---|---|---|---|---|---|---|---|---|---|
| RCP8.5.SSP1 | 67.88 | 70.40 | 68.67 | 69.69 | 69.68 | 69.73 | 69.76 | 68.47 | 68.49 | 68.47 |
| RCP8.5.SSP2 | 67.88 | 70.38 | 68.40 | 68.60 | 68.94 | 68.90 | 69.48 | 68.43 | 68.70 | 69.24 |
| RCP8.5.SSP3 | 67.88 | 70.10 | 67.52 | 67.40 | 66.19 | 66.13 | 66.10 | 66.10 | 66.10 | 66.10 |
| RCP8.5.SSP4 | 67.88 | 70.25 | 68.36 | 69.19 | 68.63 | 68.93 | 68.68 | 67.19 | 67.58 | 67.54 |
| RCP8.5.SSP5 | 67.88 | 70.54 | 69.61 | 70.56 | 71.73 | 73.67 | 77.84 | 120.92 | 168.22 | 213.40 |
| RCP4p5.SSP1 | 67.88 | 70.40 | 68.67 | 69.69 | 69.68 | 69.69 | 69.76 | 68.47 | 68.49 | 69.35 |
| RCP4p5.SSP2 | 67.88 | 70.38 | 68.40 | 68.62 | 68.95 | 68.77 | 69.46 | 68.31 | 68.71 | 70.07 |
| RCP4p5.SSP3 | 67.88 | 70.10 | 67.52 | 67.40 | 66.19 | 66.13 | 66.10 | 66.10 | 66.10 | 66.10 |
| RCP4p5.SSP4 | 67.88 | 70.38 | 68.64 | 69.15 | 68.61 | 68.90 | 68.68 | 67.39 | 67.44 | 67.91 |
| RCP4p5.SSP5 | 67.88 | 70.54 | 69.59 | 70.56 | 71.72 | 73.70 | 77.77 | 120.81 | 166.35 | 212.86 |
| RCP2p6.SSP1 | 67.88 | 70.40 | 68.67 | 69.69 | 69.68 | 70.56 | 70.41 | 72.34 | 81.46 | 96.74 |
| RCP2p6.SSP2 | 67.88 | 70.38 | 68.40 | 68.62 | 68.95 | 69.86 | 69.98 | 74.14 | 84.09 | 104.49 |
| RCP2p6.SSP3 | 67.88 | 70.11 | 67.52 | 67.42 | 66.19 | 66.36 | 66.13 | 73.91 | 82.98 | 93.05 |
| RCP2p6.SSP4 | 67.88 | 70.38 | 68.69 | 69.15 | 68.89 | 69.77 | 69.12 | 72.88 | 82.27 | 93.80 |
| RCP2p6.SSP5 | 67.88 | 70.54 | 69.61 | 70.56 | 71.72 | 74.38 | 83.23 | 135.97 | 180.44 | 231.77 |
| Scenario | 2010 | 2020 | 2030 | 2040 | 2050 | 2060 | 2070 | 2080 | 2090 | 2100 |
|---|---|---|---|---|---|---|---|---|---|---|
| RCP8.5.SSP1 | 50.88 | 53.23 | 51.29 | 52.30 | 52.22 | 52.01 | 52.04 | 50.75 | 50.76 | 50.74 |
| RCP8.5.SSP2 | 50.88 | 53.23 | 51.01 | 51.22 | 51.56 | 51.47 | 51.76 | 50.76 | 50.98 | 51.52 |
| RCP8.5.SSP3 | 50.88 | 52.96 | 50.35 | 50.23 | 49.02 | 48.96 | 48.96 | 48.96 | 48.96 | 48.96 |
| RCP8.5.SSP4 | 50.88 | 53.10 | 51.19 | 51.80 | 51.24 | 51.50 | 51.16 | 49.72 | 50.03 | 49.88 |
| RCP8.5.SSP5 | 50.88 | 53.23 | 52.22 | 52.97 | 53.95 | 55.76 | 58.73 | 94.20 | 102.71 | 112.45 |
| RCP4p5.SSP1 | 50.88 | 53.23 | 51.29 | 52.30 | 52.22 | 51.96 | 52.04 | 50.75 | 50.77 | 51.63 |
| RCP4p5.SSP2 | 50.88 | 53.23 | 51.02 | 51.23 | 51.56 | 51.33 | 51.75 | 50.65 | 50.99 | 52.35 |
| RCP4p5.SSP3 | 50.88 | 52.96 | 50.35 | 50.23 | 49.02 | 48.96 | 48.96 | 48.96 | 48.96 | 48.96 |
| RCP4p5.SSP4 | 50.88 | 53.23 | 51.25 | 51.76 | 51.22 | 51.47 | 51.16 | 49.92 | 49.90 | 50.25 |
| RCP4p5.SSP5 | 50.88 | 53.23 | 52.21 | 52.97 | 53.93 | 55.79 | 58.66 | 93.34 | 103.03 | 107.21 |
| RCP2p6.SSP1 | 50.88 | 53.23 | 51.29 | 52.31 | 52.22 | 52.89 | 52.69 | 54.62 | 63.74 | 79.02 |
| RCP2p6.SSP2 | 50.88 | 53.23 | 51.02 | 51.23 | 51.56 | 52.39 | 52.32 | 56.49 | 66.42 | 86.81 |
| RCP2p6.SSP3 | 50.88 | 52.96 | 50.35 | 50.17 | 49.02 | 49.02 | 48.96 | 56.77 | 65.85 | 75.92 |
| RCP2p6.SSP4 | 50.88 | 53.23 | 51.30 | 51.76 | 51.50 | 52.30 | 51.57 | 55.23 | 64.62 | 76.15 |
| RCP2p6.SSP5 | 50.88 | 53.23 | 52.22 | 52.97 | 53.94 | 56.51 | 64.12 | 116.87 | 144.24 | 142.85 |
Appendix A.4. Scenario Estimates for Finland
| Scenario | 2010 | 2020 | 2030 | 2040 | 2050 | 2060 | 2070 | 2080 | 2090 | 2100 |
|---|---|---|---|---|---|---|---|---|---|---|
| RCPref.SSP1 | 51.86 | 52.74 | 55.77 | 59.74 | 62.80 | 64.29 | 66.62 | 69.29 | 71.85 | 74.47 |
| RCPref.SSP2 | 51.86 | 52.40 | 55.05 | 57.74 | 60.37 | 61.73 | 64.02 | 66.52 | 69.88 | 73.02 |
| RCPref.SSP3 | 51.86 | 52.59 | 54.66 | 56.75 | 57.24 | 57.43 | 57.71 | 57.75 | 57.76 | 57.76 |
| RCPref.SSP4 | 51.86 | 51.91 | 55.11 | 58.13 | 60.90 | 62.24 | 63.76 | 65.03 | 66.65 | 67.85 |
| RCPref.SSP5 | 51.86 | 52.83 | 56.60 | 62.46 | 67.82 | 72.33 | 78.59 | 87.16 | 94.31 | 94.93 |
| RCP4p5.SSP1 | 51.86 | 52.74 | 55.76 | 59.74 | 62.78 | 64.25 | 66.53 | 69.13 | 71.75 | 75.94 |
| RCP4p5.SSP2 | 51.86 | 51.91 | 54.88 | 57.40 | 60.18 | 61.68 | 64.24 | 66.72 | 70.06 | 75.09 |
| RCP4p5.SSP3 | 51.86 | 52.59 | 54.66 | 56.72 | 57.21 | 57.40 | 57.68 | 57.71 | 57.72 | 57.73 |
| RCP4p5.SSP4 | 51.86 | 52.65 | 55.40 | 58.43 | 61.26 | 62.50 | 63.94 | 65.22 | 66.83 | 69.64 |
| RCP4p5.SSP5 | 51.86 | 52.83 | 56.60 | 62.46 | 67.82 | 72.33 | 78.64 | 87.47 | 94.71 | 94.93 |
| RCP2p6.SSP1 | 51.86 | 52.74 | 55.76 | 59.74 | 62.78 | 64.98 | 67.98 | 73.46 | 80.72 | 92.54 |
| RCP2p6.SSP2 | 51.86 | 51.91 | 54.88 | 57.40 | 60.18 | 62.51 | 65.80 | 71.27 | 81.31 | 92.58 |
| RCP2p6.SSP3 | 51.86 | 52.59 | 54.66 | 56.75 | 57.24 | 57.57 | 58.43 | 64.05 | 75.59 | 89.36 |
| RCP2p6.SSP4 | 51.86 | 52.65 | 55.40 | 58.41 | 61.08 | 62.85 | 65.08 | 69.13 | 78.22 | 90.56 |
| RCP2p6.SSP5 | 51.86 | 52.83 | 56.60 | 62.46 | 67.82 | 73.38 | 80.90 | 92.54 | 94.93 | 95.28 |
| Scenario | 2010 | 2020 | 2030 | 2040 | 2050 | 2060 | 2070 | 2080 | 2090 | 2100 |
|---|---|---|---|---|---|---|---|---|---|---|
| RCPref.SSP1 | 46.45 | 47.10 | 49.35 | 52.31 | 54.59 | 55.69 | 57.43 | 59.42 | 61.30 | 63.20 |
| RCPref.SSP2 | 46.45 | 46.85 | 48.82 | 50.82 | 52.78 | 53.79 | 55.50 | 57.35 | 59.85 | 62.15 |
| RCPref.SSP3 | 46.45 | 46.99 | 48.53 | 50.09 | 50.45 | 50.59 | 50.79 | 50.82 | 50.82 | 50.82 |
| RCPref.SSP4 | 46.45 | 46.48 | 48.87 | 51.11 | 53.17 | 54.16 | 55.30 | 56.25 | 57.45 | 58.34 |
| RCPref.SSP5 | 46.45 | 47.17 | 49.97 | 54.34 | 58.32 | 61.65 | 66.19 | 72.42 | 77.63 | 78.09 |
| RCP4p5.SSP1 | 46.45 | 47.10 | 49.35 | 52.31 | 54.57 | 55.66 | 57.36 | 59.29 | 61.23 | 64.27 |
| RCP4p5.SSP2 | 46.45 | 46.48 | 48.69 | 50.57 | 52.64 | 53.75 | 55.66 | 57.50 | 59.99 | 63.65 |
| RCP4p5.SSP3 | 46.45 | 46.99 | 48.53 | 50.06 | 50.42 | 50.56 | 50.77 | 50.79 | 50.80 | 50.80 |
| RCP4p5.SSP4 | 46.45 | 47.04 | 49.08 | 51.34 | 53.44 | 54.37 | 55.44 | 56.38 | 57.58 | 59.68 |
| RCP4p5.SSP5 | 46.45 | 47.17 | 49.97 | 54.34 | 58.32 | 61.65 | 66.23 | 72.65 | 77.92 | 78.09 |
| RCP2p6.SSP1 | 46.45 | 47.10 | 49.35 | 52.31 | 54.57 | 56.21 | 58.44 | 62.47 | 67.74 | 76.33 |
| RCP2p6.SSP2 | 46.45 | 46.48 | 48.69 | 50.57 | 52.64 | 54.37 | 56.81 | 60.89 | 68.17 | 76.37 |
| RCP2p6.SSP3 | 46.45 | 46.99 | 48.53 | 50.08 | 50.45 | 50.69 | 51.33 | 55.52 | 64.01 | 74.02 |
| RCP2p6.SSP4 | 46.45 | 47.04 | 49.08 | 51.32 | 53.30 | 54.62 | 56.28 | 59.29 | 65.92 | 74.90 |
| RCP2p6.SSP5 | 46.45 | 47.17 | 49.97 | 54.34 | 58.32 | 62.41 | 67.87 | 76.33 | 78.09 | 78.34 |
| Scenario | 2010 | 2020 | 2030 | 2040 | 2050 | 2060 | 2070 | 2080 | 2090 | 2100 |
|---|---|---|---|---|---|---|---|---|---|---|
| RCPref.SSP1 | 21.08 | 21.73 | 23.03 | 25.00 | 26.34 | 27.27 | 28.51 | 29.61 | 30.65 | 31.89 |
| RCPref.SSP2 | 21.08 | 21.48 | 22.62 | 23.85 | 24.93 | 25.76 | 26.87 | 27.87 | 29.29 | 30.79 |
| RCPref.SSP3 | 21.08 | 21.62 | 22.53 | 23.31 | 23.60 | 23.69 | 23.84 | 23.84 | 23.84 | 23.84 |
| RCPref.SSP4 | 21.08 | 21.11 | 22.58 | 23.93 | 24.96 | 25.81 | 26.73 | 27.16 | 27.71 | 28.17 |
| RCPref.SSP5 | 21.08 | 21.80 | 23.36 | 26.35 | 28.78 | 31.50 | 34.73 | 38.67 | 41.44 | 41.69 |
| RCP4p5.SSP1 | 21.08 | 21.73 | 23.03 | 25.00 | 26.32 | 27.24 | 28.45 | 29.56 | 30.58 | 32.68 |
| RCP4p5.SSP2 | 21.08 | 21.11 | 22.49 | 23.60 | 24.69 | 25.61 | 26.92 | 27.87 | 29.32 | 31.92 |
| RCP4p5.SSP3 | 21.08 | 21.62 | 22.53 | 23.29 | 23.57 | 23.66 | 23.81 | 23.81 | 23.81 | 23.81 |
| RCP4p5.SSP4 | 21.08 | 21.67 | 22.79 | 24.16 | 25.19 | 25.97 | 26.83 | 27.26 | 27.81 | 28.96 |
| RCP4p5.SSP5 | 21.08 | 21.80 | 23.36 | 26.35 | 28.78 | 31.53 | 34.76 | 38.78 | 41.60 | 41.69 |
| RCP2p6.SSP1 | 21.08 | 21.73 | 23.03 | 25.00 | 26.32 | 27.38 | 28.77 | 31.77 | 34.49 | 36.89 |
| RCP2p6.SSP2 | 21.08 | 21.11 | 22.49 | 23.60 | 24.69 | 25.79 | 27.33 | 30.28 | 32.85 | 36.12 |
| RCP2p6.SSP3 | 21.08 | 21.62 | 22.53 | 23.31 | 23.60 | 23.80 | 23.97 | 23.97 | 23.97 | 23.98 |
| RCP2p6.SSP4 | 21.08 | 21.67 | 22.79 | 24.14 | 25.17 | 26.04 | 27.06 | 28.92 | 30.19 | 31.39 |
| RCP2p6.SSP5 | 21.08 | 21.80 | 23.36 | 26.35 | 28.78 | 31.61 | 35.76 | 40.75 | 41.69 | 41.82 |
| Scenario | 2010 | 2020 | 2030 | 2040 | 2050 | 2060 | 2070 | 2080 | 2090 | 2100 |
|---|---|---|---|---|---|---|---|---|---|---|
| RCPref.SSP1 | 25.37 | 25.37 | 26.32 | 27.31 | 28.25 | 28.42 | 28.91 | 29.81 | 30.65 | 31.31 |
| RCPref.SSP2 | 25.37 | 25.37 | 26.20 | 26.97 | 27.85 | 28.03 | 28.63 | 29.48 | 30.56 | 31.35 |
| RCPref.SSP3 | 25.37 | 25.37 | 26.00 | 26.77 | 26.85 | 26.90 | 26.96 | 26.98 | 26.99 | 26.99 |
| RCPref.SSP4 | 25.37 | 25.37 | 26.29 | 27.18 | 28.21 | 28.36 | 28.57 | 29.08 | 29.74 | 30.17 |
| RCPref.SSP5 | 25.37 | 25.37 | 26.61 | 27.99 | 29.55 | 30.15 | 31.46 | 33.76 | 36.19 | 36.40 |
| RCP4p5.SSP1 | 25.37 | 25.37 | 26.32 | 27.31 | 28.25 | 28.42 | 28.91 | 29.74 | 30.65 | 31.58 |
| RCP4p5.SSP2 | 25.37 | 25.37 | 26.20 | 26.97 | 27.95 | 28.14 | 28.74 | 29.63 | 30.67 | 31.73 |
| RCP4p5.SSP3 | 25.37 | 25.37 | 26.00 | 26.77 | 26.85 | 26.90 | 26.96 | 26.98 | 26.99 | 26.99 |
| RCP4p5.SSP4 | 25.37 | 25.37 | 26.29 | 27.18 | 28.25 | 28.40 | 28.61 | 29.12 | 29.77 | 30.72 |
| RCP4p5.SSP5 | 25.37 | 25.37 | 26.61 | 27.99 | 29.55 | 30.12 | 31.46 | 33.86 | 36.32 | 36.40 |
| RCP2p6.SSP1 | 25.37 | 25.37 | 26.32 | 27.31 | 28.25 | 28.83 | 29.67 | 30.70 | 33.25 | 39.44 |
| RCP2p6.SSP2 | 25.37 | 25.37 | 26.20 | 26.97 | 27.95 | 28.58 | 29.48 | 30.60 | 35.32 | 40.25 |
| RCP2p6.SSP3 | 25.37 | 25.37 | 26.00 | 26.77 | 26.85 | 26.90 | 27.35 | 31.54 | 40.03 | 50.05 |
| RCP2p6.SSP4 | 25.37 | 25.37 | 26.29 | 27.18 | 28.14 | 28.58 | 29.22 | 30.37 | 35.73 | 43.51 |
| RCP2p6.SSP5 | 25.37 | 25.37 | 26.61 | 27.99 | 29.55 | 30.79 | 32.12 | 35.58 | 36.40 | 36.52 |
| Scenario | 2010 | 2020 | 2030 | 2040 | 2050 | 2060 | 2070 | 2080 | 2090 | 2100 |
|---|---|---|---|---|---|---|---|---|---|---|
| RCPref.SSP1 | 57.95 | 59.00 | 61.75 | 63.11 | 61.85 | 59.91 | 60.93 | 61.27 | 62.86 | 62.60 |
| RCPref.SSP2 | 57.95 | 58.81 | 61.37 | 61.59 | 61.39 | 59.76 | 61.11 | 61.49 | 62.30 | 63.29 |
| RCPref.SSP3 | 57.95 | 59.00 | 60.38 | 60.95 | 58.56 | 58.33 | 58.46 | 57.95 | 57.95 | 57.95 |
| RCPref.SSP4 | 57.95 | 58.05 | 62.48 | 62.19 | 61.36 | 59.43 | 59.93 | 59.86 | 60.30 | 59.73 |
| RCPref.SSP5 | 57.95 | 59.00 | 63.13 | 65.55 | 65.01 | 65.21 | 72.41 | 88.14 | 117.52 | 172.52 |
| RCP4p5.SSP1 | 57.95 | 59.00 | 61.75 | 63.11 | 61.85 | 59.91 | 60.93 | 61.28 | 62.88 | 66.98 |
| RCP4p5.SSP2 | 57.95 | 58.05 | 61.81 | 61.59 | 61.41 | 60.03 | 61.11 | 61.00 | 62.27 | 66.18 |
| RCP4p5.SSP3 | 57.95 | 59.00 | 60.38 | 60.95 | 58.56 | 58.33 | 58.46 | 57.95 | 57.95 | 57.95 |
| RCP4p5.SSP4 | 57.95 | 59.00 | 61.76 | 62.22 | 61.91 | 59.40 | 59.92 | 59.86 | 59.82 | 61.76 |
| RCP4p5.SSP5 | 57.95 | 59.00 | 63.13 | 65.55 | 65.01 | 65.21 | 72.41 | 87.60 | 116.05 | 175.27 |
| RCP2p6.SSP1 | 57.95 | 59.00 | 61.75 | 63.11 | 61.85 | 61.03 | 61.94 | 66.60 | 72.31 | 81.09 |
| RCP2p6.SSP2 | 57.95 | 58.05 | 61.81 | 61.59 | 61.41 | 61.21 | 62.17 | 66.47 | 74.59 | 83.91 |
| RCP2p6.SSP3 | 57.95 | 59.00 | 60.38 | 60.95 | 58.56 | 58.46 | 58.89 | 64.93 | 74.01 | 84.08 |
| RCP2p6.SSP4 | 57.95 | 59.00 | 61.76 | 62.05 | 61.35 | 60.46 | 61.03 | 63.39 | 72.78 | 81.20 |
| RCP2p6.SSP5 | 57.95 | 59.00 | 63.13 | 65.55 | 65.01 | 66.63 | 76.17 | 99.70 | 143.12 | 205.38 |
| Scenario | 2010 | 2020 | 2030 | 2040 | 2050 | 2060 | 2070 | 2080 | 2090 | 2100 |
|---|---|---|---|---|---|---|---|---|---|---|
| RCPref.SSP1 | 40.40 | 41.46 | 44.21 | 45.57 | 44.31 | 42.37 | 43.38 | 43.73 | 45.32 | 45.06 |
| RCPref.SSP2 | 40.40 | 41.26 | 43.82 | 44.04 | 43.85 | 42.21 | 43.56 | 43.95 | 44.76 | 45.75 |
| RCPref.SSP3 | 40.40 | 41.46 | 42.83 | 43.40 | 41.02 | 40.78 | 40.91 | 40.40 | 40.40 | 40.40 |
| RCPref.SSP4 | 40.40 | 40.51 | 44.93 | 44.65 | 43.82 | 41.88 | 42.39 | 42.32 | 42.76 | 42.19 |
| RCPref.SSP5 | 40.40 | 41.46 | 45.58 | 48.01 | 47.47 | 47.67 | 54.21 | 54.13 | 58.07 | 94.76 |
| RCP4p5.SSP1 | 40.40 | 41.46 | 44.21 | 45.57 | 44.31 | 42.37 | 43.38 | 43.73 | 45.33 | 48.78 |
| RCP4p5.SSP2 | 40.40 | 40.51 | 44.26 | 44.05 | 43.87 | 42.48 | 43.56 | 43.46 | 44.73 | 48.63 |
| RCP4p5.SSP3 | 40.40 | 41.46 | 42.83 | 43.40 | 41.02 | 40.79 | 40.91 | 40.40 | 40.40 | 40.40 |
| RCP4p5.SSP4 | 40.40 | 41.46 | 44.21 | 44.67 | 44.36 | 41.86 | 42.38 | 42.31 | 42.28 | 44.22 |
| RCP4p5.SSP5 | 40.40 | 41.46 | 45.58 | 48.01 | 47.47 | 47.67 | 54.21 | 55.82 | 64.11 | 99.61 |
| RCP2p6.SSP1 | 40.40 | 41.46 | 44.21 | 45.57 | 44.31 | 43.49 | 44.40 | 49.06 | 54.35 | 63.53 |
| RCP2p6.SSP2 | 40.40 | 40.51 | 44.26 | 44.05 | 43.87 | 43.67 | 44.63 | 48.93 | 57.03 | 66.35 |
| RCP2p6.SSP3 | 40.40 | 41.46 | 42.83 | 43.40 | 41.02 | 40.91 | 41.34 | 47.39 | 56.46 | 66.54 |
| RCP2p6.SSP4 | 40.40 | 41.46 | 44.21 | 44.51 | 43.80 | 42.91 | 43.48 | 45.85 | 55.24 | 63.66 |
| RCP2p6.SSP5 | 40.40 | 41.46 | 45.58 | 48.01 | 47.47 | 49.09 | 57.97 | 63.02 | 90.74 | 130.31 |
Appendix A.5. Scenario Estimates for Norway
| Scenario | 2010 | 2020 | 2030 | 2040 | 2050 | 2060 | 2070 | 2080 | 2090 | 2100 |
|---|---|---|---|---|---|---|---|---|---|---|
| RCPref.SSP1 | 10.63 | 10.95 | 11.73 | 12.76 | 13.64 | 14.36 | 15.06 | 15.80 | 16.67 | 16.67 |
| RCPref.SSP2 | 10.63 | 10.88 | 11.51 | 12.27 | 13.03 | 13.76 | 14.85 | 15.72 | 17.01 | 17.01 |
| RCPref.SSP3 | 10.63 | 10.78 | 10.90 | 10.97 | 11.01 | 11.09 | 11.13 | 11.14 | 11.15 | 11.15 |
| RCPref.SSP4 | 10.63 | 10.93 | 11.71 | 12.45 | 12.92 | 13.62 | 14.03 | 14.67 | 15.23 | 15.23 |
| RCPref.SSP5 | 10.63 | 11.13 | 12.56 | 14.10 | 15.87 | 18.13 | 20.96 | 24.73 | 28.95 | 28.95 |
| RCP4p5.SSP1 | 10.63 | 10.95 | 11.73 | 12.70 | 13.63 | 14.35 | 15.14 | 15.84 | 17.03 | 17.03 |
| RCP4p5.SSP2 | 10.63 | 10.88 | 11.52 | 12.26 | 13.02 | 13.75 | 14.84 | 15.72 | 17.00 | 17.00 |
| RCP4p5.SSP3 | 10.63 | 10.78 | 10.99 | 10.99 | 11.00 | 11.07 | 11.07 | 11.09 | 11.24 | 11.24 |
| RCP4p5.SSP4 | 10.63 | 10.93 | 11.71 | 12.48 | 12.97 | 13.68 | 14.08 | 14.62 | 15.27 | 15.27 |
| RCP4p5.SSP5 | 10.63 | 11.14 | 12.57 | 14.10 | 15.87 | 18.13 | 20.96 | 24.82 | 29.21 | 29.21 |
| RCP2p6.SSP1 | 10.63 | 10.95 | 11.73 | 12.70 | 13.82 | 14.90 | 16.83 | 18.90 | 21.93 | 21.93 |
| RCP2p6.SSP2 | 10.63 | 10.88 | 11.53 | 12.27 | 13.16 | 14.26 | 16.32 | 18.86 | 22.54 | 22.54 |
| RCP2p6.SSP3 | 10.63 | 10.78 | 10.90 | 11.03 | 11.25 | 11.54 | 12.67 | 16.03 | 20.25 | 20.25 |
| RCP2p6.SSP4 | 10.63 | 10.93 | 11.70 | 12.46 | 13.18 | 13.92 | 15.64 | 18.02 | 21.22 | 21.22 |
| RCP2p6.SSP5 | 10.63 | 11.14 | 12.58 | 14.10 | 16.24 | 18.99 | 23.28 | 27.82 | 31.46 | 31.46 |
| Scenario | 2010 | 2020 | 2030 | 2040 | 2050 | 2060 | 2070 | 2080 | 2090 | 2100 |
|---|---|---|---|---|---|---|---|---|---|---|
| RCPref.SSP1 | 8.27 | 8.27 | 8.49 | 9.01 | 9.47 | 9.95 | 10.38 | 10.86 | 11.34 | 11.84 |
| RCPref.SSP2 | 8.27 | 8.27 | 8.45 | 8.84 | 9.19 | 9.62 | 10.06 | 10.72 | 11.28 | 12.02 |
| RCPref.SSP3 | 8.27 | 8.27 | 8.38 | 8.46 | 8.51 | 8.54 | 8.60 | 8.62 | 8.63 | 8.63 |
| RCPref.SSP4 | 8.27 | 8.27 | 8.48 | 8.97 | 9.30 | 9.60 | 9.99 | 10.24 | 10.64 | 10.99 |
| RCPref.SSP5 | 8.27 | 8.27 | 8.61 | 9.47 | 10.20 | 11.21 | 13.01 | 15.22 | 17.78 | 20.58 |
| RCP4p5.SSP1 | 8.27 | 8.27 | 8.49 | 9.01 | 9.45 | 9.92 | 10.36 | 10.90 | 11.34 | 12.20 |
| RCP4p5.SSP2 | 8.27 | 8.27 | 8.45 | 8.85 | 9.18 | 9.60 | 10.02 | 10.68 | 11.24 | 12.21 |
| RCP4p5.SSP3 | 8.27 | 8.27 | 8.38 | 8.52 | 8.53 | 8.53 | 8.57 | 8.58 | 8.59 | 8.69 |
| RCP4p5.SSP4 | 8.27 | 8.27 | 8.48 | 8.97 | 9.31 | 9.62 | 10.01 | 10.26 | 10.59 | 11.05 |
| RCP4p5.SSP5 | 8.27 | 8.27 | 8.61 | 9.47 | 10.20 | 11.21 | 13.05 | 15.22 | 17.83 | 20.75 |
| RCP2p6.SSP1 | 8.27 | 8.27 | 8.49 | 9.01 | 9.45 | 10.19 | 10.94 | 12.46 | 13.85 | 15.88 |
| RCP2p6.SSP2 | 8.27 | 8.27 | 8.45 | 8.85 | 9.19 | 9.78 | 10.72 | 12.12 | 13.82 | 16.28 |
| RCP2p6.SSP3 | 8.27 | 8.27 | 8.38 | 8.46 | 8.55 | 8.70 | 8.90 | 9.66 | 11.92 | 14.76 |
| RCP2p6.SSP4 | 8.27 | 8.27 | 8.48 | 8.97 | 9.31 | 9.83 | 10.45 | 11.65 | 13.26 | 15.40 |
| RCP2p6.SSP5 | 8.27 | 8.27 | 8.62 | 9.47 | 10.20 | 12.06 | 13.90 | 16.77 | 19.84 | 22.28 |
| Scenario | 2010 | 2020 | 2030 | 2040 | 2050 | 2060 | 2070 | 2080 | 2090 | 2100 |
|---|---|---|---|---|---|---|---|---|---|---|
| RCPref.SSP1 | 4.31 | 4.31 | 4.42 | 4.69 | 5.06 | 5.36 | 5.62 | 5.86 | 6.13 | 6.44 |
| RCPref.SSP2 | 4.31 | 4.31 | 4.40 | 4.62 | 4.89 | 5.15 | 5.41 | 5.79 | 6.10 | 6.55 |
| RCPref.SSP3 | 4.31 | 4.31 | 4.37 | 4.41 | 4.43 | 4.45 | 4.48 | 4.49 | 4.49 | 4.50 |
| RCPref.SSP4 | 4.31 | 4.31 | 4.42 | 4.69 | 4.95 | 5.11 | 5.36 | 5.50 | 5.73 | 5.92 |
| RCPref.SSP5 | 4.31 | 4.31 | 4.48 | 4.99 | 5.52 | 6.15 | 6.94 | 7.92 | 9.25 | 10.71 |
| RCP4p5.SSP1 | 4.31 | 4.31 | 4.42 | 4.69 | 5.04 | 5.36 | 5.61 | 5.89 | 6.14 | 6.56 |
| RCP4p5.SSP2 | 4.31 | 4.31 | 4.40 | 4.62 | 4.88 | 5.15 | 5.41 | 5.78 | 6.09 | 6.55 |
| RCP4p5.SSP3 | 4.31 | 4.31 | 4.37 | 4.44 | 4.44 | 4.44 | 4.47 | 4.47 | 4.48 | 4.53 |
| RCP4p5.SSP4 | 4.31 | 4.31 | 4.42 | 4.69 | 4.96 | 5.13 | 5.38 | 5.52 | 5.71 | 5.93 |
| RCP4p5.SSP5 | 4.31 | 4.31 | 4.49 | 4.99 | 5.52 | 6.15 | 6.94 | 7.92 | 9.28 | 10.79 |
| RCP2p6.SSP1 | 4.31 | 4.31 | 4.42 | 4.69 | 5.04 | 5.43 | 5.81 | 6.48 | 7.21 | 8.26 |
| RCP2p6.SSP2 | 4.31 | 4.31 | 4.40 | 4.63 | 4.89 | 5.20 | 5.58 | 6.31 | 7.19 | 8.47 |
| RCP2p6.SSP3 | 4.31 | 4.31 | 4.37 | 4.41 | 4.45 | 4.53 | 4.63 | 4.75 | 4.79 | 4.80 |
| RCP2p6.SSP4 | 4.31 | 4.31 | 4.42 | 4.69 | 4.95 | 5.21 | 5.46 | 6.07 | 6.85 | 7.25 |
| RCP2p6.SSP5 | 4.31 | 4.31 | 4.49 | 4.99 | 5.52 | 6.28 | 7.24 | 8.73 | 10.32 | 11.59 |
| Scenario | 2010 | 2020 | 2030 | 2040 | 2050 | 2060 | 2070 | 2080 | 2090 | 2100 |
|---|---|---|---|---|---|---|---|---|---|---|
| RCPref.SSP1 | 3.96 | 3.96 | 4.07 | 4.32 | 4.41 | 4.58 | 4.77 | 5.00 | 5.21 | 5.41 |
| RCPref.SSP2 | 3.96 | 3.96 | 4.05 | 4.22 | 4.30 | 4.47 | 4.65 | 4.93 | 5.18 | 5.46 |
| RCPref.SSP3 | 3.96 | 3.96 | 4.02 | 4.05 | 4.08 | 4.09 | 4.12 | 4.13 | 4.13 | 4.14 |
| RCPref.SSP4 | 3.96 | 3.96 | 4.06 | 4.28 | 4.35 | 4.48 | 4.63 | 4.74 | 4.91 | 5.07 |
| RCPref.SSP5 | 3.96 | 3.96 | 4.12 | 4.48 | 4.67 | 5.07 | 6.07 | 7.30 | 8.53 | 9.87 |
| RCP4p5.SSP1 | 3.96 | 3.96 | 4.07 | 4.32 | 4.41 | 4.56 | 4.75 | 5.01 | 5.21 | 5.64 |
| RCP4p5.SSP2 | 3.96 | 3.96 | 4.05 | 4.22 | 4.30 | 4.45 | 4.61 | 4.90 | 5.14 | 5.66 |
| RCP4p5.SSP3 | 3.96 | 3.96 | 4.02 | 4.08 | 4.08 | 4.09 | 4.11 | 4.11 | 4.12 | 4.17 |
| RCP4p5.SSP4 | 3.96 | 3.96 | 4.06 | 4.28 | 4.35 | 4.49 | 4.63 | 4.74 | 4.88 | 5.11 |
| RCP4p5.SSP5 | 3.96 | 3.96 | 4.13 | 4.48 | 4.67 | 5.07 | 6.11 | 7.30 | 8.56 | 9.96 |
| RCP2p6.SSP1 | 3.96 | 3.96 | 4.07 | 4.32 | 4.41 | 4.76 | 5.14 | 5.97 | 6.64 | 7.62 |
| RCP2p6.SSP2 | 3.96 | 3.96 | 4.05 | 4.22 | 4.30 | 4.58 | 5.14 | 5.81 | 6.63 | 7.81 |
| RCP2p6.SSP3 | 3.96 | 3.96 | 4.02 | 4.05 | 4.10 | 4.17 | 4.26 | 4.92 | 7.13 | 9.97 |
| RCP2p6.SSP4 | 3.96 | 3.96 | 4.06 | 4.28 | 4.35 | 4.62 | 4.99 | 5.59 | 6.41 | 8.15 |
| RCP2p6.SSP5 | 3.96 | 3.96 | 4.13 | 4.48 | 4.67 | 5.78 | 6.67 | 8.05 | 9.52 | 10.69 |
| Scenario | 2010 | 2020 | 2030 | 2040 | 2050 | 2060 | 2070 | 2080 | 2090 | 2100 |
|---|---|---|---|---|---|---|---|---|---|---|
| RCPref.SSP1 | 68.33 | 66.67 | 72.48 | 75.28 | 76.67 | 76.51 | 76.59 | 77.77 | 79.92 | 82.04 |
| RCPref.SSP2 | 68.33 | 66.67 | 71.68 | 74.38 | 74.44 | 74.90 | 76.46 | 78.02 | 80.39 | 84.53 |
| RCPref.SSP3 | 68.33 | 66.28 | 69.71 | 70.28 | 68.21 | 68.09 | 68.25 | 65.23 | 67.47 | 66.34 |
| RCPref.SSP4 | 68.33 | 66.80 | 71.78 | 74.44 | 74.31 | 74.24 | 74.20 | 74.13 | 74.83 | 74.85 |
| RCPref.SSP5 | 68.33 | 67.41 | 74.08 | 79.18 | 81.41 | 85.93 | 96.59 | 101.77 | 124.77 | 159.07 |
| RCP4p5.SSP1 | 68.33 | 66.67 | 72.45 | 75.10 | 76.67 | 76.52 | 76.38 | 78.51 | 80.37 | 83.98 |
| RCP4p5.SSP2 | 68.33 | 66.93 | 70.76 | 74.38 | 74.32 | 75.05 | 75.71 | 77.82 | 80.05 | 84.53 |
| RCP4p5.SSP3 | 68.33 | 66.28 | 69.70 | 70.97 | 70.64 | 70.64 | 70.64 | 66.63 | 67.99 | 66.81 |
| RCP4p5.SSP4 | 68.33 | 66.54 | 72.61 | 74.98 | 74.71 | 74.24 | 74.19 | 74.13 | 74.82 | 78.14 |
| RCP4p5.SSP5 | 68.33 | 67.41 | 74.08 | 79.18 | 81.48 | 85.91 | 96.59 | 100.97 | 124.43 | 160.18 |
| RCP2p6.SSP1 | 68.33 | 66.67 | 72.41 | 75.11 | 76.67 | 76.82 | 78.16 | 77.77 | 80.54 | 85.74 |
| RCP2p6.SSP2 | 68.33 | 66.93 | 70.76 | 74.38 | 74.32 | 76.58 | 75.93 | 76.89 | 80.52 | 88.37 |
| RCP2p6.SSP3 | 68.33 | 66.28 | 69.71 | 70.31 | 68.79 | 68.69 | 69.57 | 66.28 | 75.36 | 85.43 |
| RCP2p6.SSP4 | 68.33 | 66.51 | 72.57 | 74.38 | 74.65 | 74.24 | 75.00 | 74.70 | 75.41 | 84.43 |
| RCP2p6.SSP5 | 68.33 | 67.43 | 74.08 | 79.17 | 81.48 | 89.28 | 95.89 | 113.78 | 140.02 | 185.54 |
| Scenario | 2010 | 2020 | 2030 | 2040 | 2050 | 2060 | 2070 | 2080 | 2090 | 2100 |
|---|---|---|---|---|---|---|---|---|---|---|
| RCPref.SSP1 | 34.38 | 36.18 | 34.60 | 34.14 | 33.89 | 33.89 | 33.89 | 33.89 | 33.89 | 34.09 |
| RCPref.SSP2 | 34.38 | 36.18 | 35.47 | 33.89 | 33.89 | 33.89 | 33.89 | 33.89 | 33.89 | 34.09 |
| RCPref.SSP3 | 34.38 | 36.60 | 35.31 | 34.67 | 36.89 | 37.02 | 36.84 | 40.11 | 37.68 | 38.90 |
| RCPref.SSP4 | 34.38 | 36.04 | 35.36 | 33.89 | 33.89 | 33.89 | 33.89 | 33.89 | 33.89 | 33.89 |
| RCPref.SSP5 | 34.38 | 35.38 | 34.26 | 33.89 | 33.89 | 33.89 | 34.83 | 40.98 | 49.45 | 54.88 |
| RCP4p5.SSP1 | 34.38 | 36.18 | 34.64 | 34.09 | 33.89 | 33.89 | 33.89 | 33.89 | 33.89 | 34.83 |
| RCP4p5.SSP2 | 34.38 | 35.90 | 36.46 | 33.89 | 33.89 | 33.89 | 33.89 | 33.89 | 33.89 | 34.83 |
| RCP4p5.SSP3 | 34.38 | 36.60 | 35.31 | 34.15 | 34.26 | 34.26 | 34.26 | 38.58 | 37.12 | 38.39 |
| RCP4p5.SSP4 | 34.38 | 36.32 | 34.46 | 33.89 | 33.89 | 33.89 | 33.89 | 33.89 | 33.89 | 33.89 |
| RCP4p5.SSP5 | 34.38 | 35.37 | 34.26 | 33.89 | 33.89 | 33.89 | 34.83 | 40.12 | 49.98 | 59.53 |
| RCP2p6.SSP1 | 34.38 | 36.18 | 34.68 | 34.12 | 33.89 | 33.89 | 34.09 | 45.24 | 54.35 | 63.53 |
| RCP2p6.SSP2 | 34.38 | 35.90 | 36.46 | 33.89 | 33.89 | 33.89 | 36.09 | 47.11 | 57.03 | 66.35 |
| RCP2p6.SSP3 | 34.38 | 36.60 | 35.31 | 34.64 | 36.27 | 38.71 | 37.76 | 47.39 | 56.46 | 66.54 |
| RCP2p6.SSP4 | 34.38 | 36.35 | 34.50 | 33.89 | 33.89 | 33.89 | 33.89 | 45.85 | 55.24 | 63.66 |
| RCP2p6.SSP5 | 34.38 | 35.36 | 34.26 | 33.89 | 33.89 | 35.95 | 41.98 | 57.06 | 71.37 | 95.06 |
Appendix B
Material—SweFor
| Facility Type | Investment Cost Per Output Unit (SEK) (a) | Operating Cost Per Input Unit (SEK) (b) | Capital Cost on Capacity (% of Investment Cost) (c) | Maintenance Cost (% on Investment Cost) (c) |
|---|---|---|---|---|
| Sawmill pine | 3750 | 700 | 5% | 10% |
| Sawmill spruce | 3750 | 700 | ||
| Sawmill all species | 3750 | 700 | ||
| Pulp mill chemical | 6500 | 800 | ||
| Pulp mill mechanical | 4000 | 800 | ||
| Heating plant | 2500 | 300 |
| Model Item | Definition |
|---|---|
| Residues [58] | Allowed if mesic-moist or dryer and slope less or equal to 20% and distance to road less or equal to 500 m. |
| M3 to ton TS [59] | 0.46 tonTS m−3 u.b. (weighted coniferous and deciduous). |
| M3 to chips (a) [60] | 0.261 m3 m−3 u.b.(b) after sawing |
| M3 to sawdust [60] | 0.1019 m3 m−3 u.b. after sawing |
| M3 own consumption [60] | 0.1 m3 m−3 u.b. used by sawmill internally |
| M3 to mech. pulp [61] | 0.427 ton m−3 u.b. (only spruce) |
| M3 to chem. pulp [61] | 0.230 ton m−3 u.b. (all species) |
| Ton TS to energy [59] | 4.8 MWh tonTS−1 |
| Residue extraction to roadside [62] | 129 + 0.1879*m, SEK tonTS−1 where m is forwarding distance to road in meters. |
| Transport cost per ton TS [57] | 31.824 + 1.4339*km, SEK tonTS−1 where km is distance in km measured by Euclidian distance multiplied with a curving coefficient of 1.25 (all transports are in ton TS) |
| Item | Sawn Wood Pine | Sawn Wood Spruce | Sawn Wood All Spec. | Mechanical Pulp | Chemical Pulp | Energy |
|---|---|---|---|---|---|---|
| No. of (a) | 10 | 7 | 24 | 8 | 27 | 63 |
| Capacity (a,b) | 4.7 | 4.4 | 9.9 | 4.5 | 10.6 | 30.2 |
| Price (c) | 1900 | 3600 | 6400 | 700 | ||
| Volume (d) | 16 | 3.5 | 8.0 | 24.0 | ||
| Elasticity (e) | −0.5 | −0.5 | −0.9 | ∞ | ||
| Demand func. steps (f) | 1000 | 1000 | 1000 | 1 | ||
References
- Nordström, E.M.; Forsell, N.; Lundström, A.; Korosuo, A.; Bergh, J.; Havlík, P.; Kraxner, F.; Frank, S.; Fricko, O.; Lundmark, T.; et al. Impacts of global climate change mitigation scenarios on forests and harvesting in Sweden. Can. J. For. Res. 2016, 46, 1427–1438. [Google Scholar] [CrossRef]
- Kallio, A.M.I.; Moiseyev, A.; Solberg, B. Economic impacts of increased forest conservation in Europe: A forest sector model analysis. Environ. Sci. Policy 2006, 9, 457–465. [Google Scholar] [CrossRef]
- Kallio, A.M.I.; Chudy, R.; Solberg, B. Prospects for producing liquid wood-based biofuels and impacts in the wood using sectors in Europe. Biomass Bioenergy 2018, 108, 415–425. [Google Scholar] [CrossRef]
- Jonsson, R. Trends and possible future developments in global forest-product markets—Implications for the Swedish forest sector. Forests 2011, 2, 147–167. [Google Scholar] [CrossRef]
- Daigneaulta, A.; Johnston, C.; Korosuo, A.; Baker, J.; Forsell, N.; Prestemone, J.P.; Abt, B. Developing Detailed Shared Socioeconomic Pathway (SSP) Narratives for the Global Forest Sector. J. For. Econ. 2019, 34, 7–45. [Google Scholar] [CrossRef]
- Forsell, N.; Korosuo, A.; Havlík, P.; Valin, H.; Lauri, P.; Gusti, M.; Kindermann, G.; Obersteiner, M.; Böttcher, H.; Hennenberg, K.; et al. Study on Impacts on Resource Efficiency of Future EU Demand for Bioenergy (ReceBio), Final Report; Report Prepared by IIASA/EFI for the European Commission, Directorate General of Environment; Publications Office of the European Union: Luxembourg, 2016; 43p. [Google Scholar]
- EFSOS. EFSOS II—The European Forest Sector Outlook Study II, 2010–2030; No. 28 United Nations Publications; United Nations Economic Commission for Europe: Geneva, Switzerland, 2011. [Google Scholar]
- Lauri, P.; Havlík, P.; Kindermann, G.; Forsell, N.; Böttcher, H.; Obersteiner, M. Woody biomass energy potential in 2050. Energy Policy 2014, 66, 19–31. [Google Scholar] [CrossRef]
- Lauri, P.; Forsell, N.; Korosou, A.; Havlík, P.; Obersteiner, M.; Nordin, A. Impact of the 2 °C target on the global woody biomass use. For. Policy Econ. 2017, 83, 121–130. [Google Scholar] [CrossRef]
- Popp, A.; Calvin, K.; Fujimori, S.; Havlik, P.; Humpenöder, F.; Stehfest, E.; Bodirsky, B.L.; Dietrich, J.P.; Doelmann, J.C.; Gusti, M.; et al. Land-use futures in the shared socio-economic pathways. Glob. Environ. Chang. 2017, 42, 331–345. [Google Scholar] [CrossRef]
- Tomppo, E.; Gschwantner, T.; Lawrence, M.; McRoberts, R.E.; Gabler, K.; Schadauer, K.; Vidal, C.; Lanz, A.; Cienciala, E. National Forest Inventories. Pathways for Common Reporting; European Science Foundation: Helsinki, Finland, 2010; pp. 541–553. [Google Scholar]
- Claesson, S.; Duvemo, K.; Lundström, A.; Wikberg, P.E. Rapport Skogliga Konsekvensanalyser 2015—SKA 15 [Impact Assessments within Forestry 2015—SKA 15]; Report 2015:10; Skogsstyrelsens Böcker och Broschyrer: Jönköping, Sweden, 2015; p. 110. (In Swedish) [Google Scholar]
- Lundmark, T.; Bergh, J.; Hofer, P.; Lundström, A.; Nordin, A.; Poudel, B.C.; Sathre, R.; Taverna, R.; Werner, F. Potential roles of Swedish forestry in the context of climate change mitigation. Forests 2014, 5, 557–578. [Google Scholar] [CrossRef]
- Kritzberg, E.S.; Hasselquist, E.M.; Škerlep, M.; Löfgren, S.; Olsson, O.; Stadmark, J.; Valinia, S.; Hansson, L.-A.; Laudon, H. Browning of freshwaters: Consequences to ecosystem services, underlying drivers, and potential mitigation measures. AMBIO 2020, 49, 375–390. [Google Scholar] [CrossRef]
- Eriksson, A.; Snäll, T.; Harrison, P.J. Rapport Analys av milöförhållanden—SKA 15 [Analysis of Environmental Conditions—SKA 15]; Report 2015:11; Skogsstyrelsens Böcker och Broschyrer: Jönköping, Sweden, 2015; p. 62. (In Swedish) [Google Scholar]
- Mair, L.; Jönsson, M.; Räty, M.; Bärring, L.; Strandberg, G.; Lämås, T.; Snäll, T. Land use changes could modify future negative effects of climate change on old-growth forest indicator species. Divers. Distrib. 2018, 24, 1416–1425. [Google Scholar] [CrossRef]
- Dudek, T. Influence of selected features of forests on forest landscape aesthetic value—Example of SE Poland. J. Environ. Eng. Landsc. Manag. 2018, 26, 275–284. [Google Scholar] [CrossRef]
- Forsell, N.; Wikström, P.; Garcia, F.; Sabbadin, R.; Blennow, K.; Eriksson, L.O. Management of the risk of wind damage in forestry: A graph-based Markov decision process approach. Ann. Oper. Res. 2011, 190, 57–74. [Google Scholar] [CrossRef]
- Lundholm, A.; Corrigan, E.; Nieuwenhuis, M. Implementing climate change and associated future timber price trends in a decision support system designed for Irish forest management and applied to Ireland’s Western Peatland forests. Forests 2019, 10, 270. [Google Scholar] [CrossRef]
- Solberg, B. Forest sector simulation models as methodological tools in forest policy analysis. Silva Fenn. 1986, 20, 419–427. [Google Scholar] [CrossRef]
- Latta, G.S.; Sjølie, H.K.; Solberg, B. A review of recent developments and applications of partial equilibrium models of the forest sector. J. For. Econ. 2013, 19, 350–360. [Google Scholar] [CrossRef]
- Jonsson, R.; Rinaldi, F.; Räty, M.; Sallnäs, O. Integrating forest-based industry and forest resource modeling. For. Biogeosci. For. 2016, 9, 743–750. [Google Scholar] [CrossRef]
- Havlik, P.; Valin, H.; Herrero, M. Climate change mitigation through livestock system transition. Proc. Natl. Acad. Sci. USA 2014, 111, 3709–3714. [Google Scholar] [CrossRef]
- Wikström, P.; Wikström, P.; Edenius, L.; Elfving, B.; Eriksson, L.; Lämås, T.; Sonesson, J.; Öhman, K.; Wallerman, J.; Waller, C.; et al. The Heureka Forestry Decision Support System: An Overview. Math. Comput. For. Nat. Resour. Sci. 2011, 3, 87–94. [Google Scholar]
- Pussinen, A.; Schelhaas, M.J.; Verkaik, E.; Heikkinen, E.; Liski, J.; Karjalainen, T.; Päivinen, R.; Nabuurs, G.J. Manual for the European Forest Information Scenario Model (EFISCEN 2.0); Internal Report; European Forest Institute: Joensu, Finland, 2001; Volume 5, pp. 1–49. [Google Scholar]
- Alig, R.; Latta, G.; Adams, D.; McCarl, B. Mitigating greenhouse gases: The importance of land base interactions between forests, agriculture, and residential development in the face of changes in bioenergy and carbon prices. For. Policy Econ. 2010, 12, 67–75. [Google Scholar] [CrossRef]
- Lauri, P.; Havlik, P.; Kindermann, G.; Obersteiner, M. Global potential of energy wood. In Proceedings of the Worlds within Reach: From Science to Policy—IIASA 40th Anniversary Conference, Laxenburg, Austria, 24–26 October 2012; Hofburg Congress Center, Vienna and IIASA: Laxenburg, Austria, 2012. [Google Scholar]
- Lecocq, F.; Caurla, S.; Delacote, P.; Barkaoui, A.; Sauquet, A. Paying for forest carbon or stimulating fuelwood demand? Insights from the French Forest Sector Model. J. For. Econ. 2011, 17, 157–168. [Google Scholar] [CrossRef]
- Sjølie, H.K.; Trømborg, E.; Solberg, B.; Bolkesjø, T.F. Effects and costs of policies to increase bioenergy use and reduce GHG emissions from heating in Norway. For. Policy Econ. 2010, 12, 57–66. [Google Scholar] [CrossRef]
- Bolkesjø, T.F.; Trømborg, E.; Solberg, B. Increasing forest conservation in Norway: Consequences for timber and forest products markets. Environ. Resour. Econ. 2005, 31, 95–115. [Google Scholar] [CrossRef]
- Hänninen, R.; Kallio, A.M.I. Economic impacts on the forest sector of increasing forest biodiversity conservation in Finland. Silva Fenn. 2007, 41, 507–523. [Google Scholar] [CrossRef][Green Version]
- Samuelson, P.A. Spatial price equilibrium and linear programming. Am. Econ. Rev. 1952, 42, 283–303. [Google Scholar]
- Havlik, P.; Schneider, U.; Schmid, E. Global land-use implications of first and second generation biofuels targets. Energy Policy 2011, 39, 5690–5702. [Google Scholar] [CrossRef]
- Takayama, T.; Judge, G. Spatial and Temporal Price and Allocation Models; North-Holland: Amsterdam, The Netherlands, 1971. [Google Scholar]
- Schneider, U.; Havlík, P.; Schmid, E. Impacts of population growth, economic development, and technical change on the global food production and consumption. Agric. Syst. 2011, 104, 204–215. [Google Scholar] [CrossRef]
- FAO. FAOSTAT Database. Available online: https://www.fao.org/faostat (accessed on 15 December 2018).
- Muhammad, A.; Seale, J.L., Jr.; Meade, B.; Regmi, A. International Evidence on Food Consumption Patterns: An Update Using 2005 International Comparison Program Data; TB-1929; U.S. Department of Agriculture, Economic Research Service: Washington, DC, USA, 2011. [Google Scholar]
- Skalský, R.; Tarasovicova, Z.; Balkovic, J. Geo-Bene Global Database for Bio-Physical Modeling v.1.0. Concepts, Methodologies and Data; Technical Report; IIASA: Laxenburg, Austria, 2008. [Google Scholar]
- Williams, J. The Epic Model; Singh, V., Ed.; Water Resources Publications: Littleton, CO, USA, 1995; pp. 909–1000. [Google Scholar]
- Kindermann, G.E.; McCallum, I.; Fritz, S.; Obersteiner, M. A global forest growing stock, biomass and carbon map based on FAO statistics. Silva Fenn. 2008, 42, 387–396. [Google Scholar] [CrossRef]
- Gusti, M. An algorithm for simulation of forest management decisions in the global forest model. Artif. Intell. 2010, 4, 45–49. [Google Scholar]
- Herrero, M.; Havlík, P.; Valin, H.; Notenbaert, A.; Rufino, M.C.; Thornton, P.K.; Blümmel, M.; Weiss, F.; Grace, D.; Obersteiner, M. Biomass use, production, feed efficiencies, and greenhouse gas emissions from global livestock systems. Proc. Natl. Acad. Sci. USA 2013, 110, 20888–20893. [Google Scholar] [CrossRef]
- SSP Database. Available online: https://tntcat.iiasa.ac.at/SspDb (accessed on 15 December 2018).
- O’Neill, B.C.; Kriegler, E.; Ebi, K.L.; Kemp-Benedict, E.; Riahi, K.; Rothman, D.S.; van Ruijven, B.J.; van Vuuren, D.P. The roads ahead: Narratives for shared socioeconomic pathways describing world futures in the 21st century. Glob. Environ. Chang. 2017, 42, 169–180. [Google Scholar] [CrossRef]
- Moss, R.H.; Edmonds, J.A.; Hibbard, K.A.; Manning, M.R.; Rose, S.K.; Van Vuuren, D.P.; Carter, T.R.; Emori, S.; Kainuma, M.; Kram, T.; et al. The next generation of scenarios for climate change research and assessment. Nature 2010, 463, 747–756. [Google Scholar] [CrossRef] [PubMed]
- Van Vuuren, D.P.; Edmonds, J.; Kainuma, M.; Riahi, K.; Thomson, A.; Hibbard, K.; Hurtt, G.C.; Kram, T.; Krey, V.; Lamarque, J.F.; et al. The representative concentration pathways: An overview. Clim. Chang. 2011, 109, 5. [Google Scholar] [CrossRef]
- Trømborg, E.; Sjølie, H.K. Data Applied in the Forest Sector Models NorFor and NTMIII; INA Report No. 17; Department of Ecology and Natural Resource Management, Norwegian University of Life Sciences: Ås Municipality, Norway, 2011. [Google Scholar]
- Sjølie, H.K.; Latta, G.S.; Gobakken, T.; Solberg, B. NorFor—A Forest Sector Model of Norway. Model Overview and Structure; Department of Ecology and Natural Resource Management, Norwegian University of Life Sciences: Ås Municipality, Norway, 2011. [Google Scholar]
- Abt, R.C.; Cubbage, F.W.; Pacheco, G. Southern forest resource assessment using the subregional timber supply (SRTS) model. For. Prod. J. 2000, 50, 25–33. [Google Scholar]
- Johnson, K.N.; Scheurman, H.L. Techniques for prescribing optimal timber harvest. For. Sci. 1977, 18, 1–31. [Google Scholar]
- Energimyndigheten. Scenarier Över Sveriges Energisystem 2018; ER 2019:07; Energimyndigheten: Stockholm, Sweden, 2019. [Google Scholar]
- Fridman, J.; Holm, S.; Nilsson, M.; Nilsson, P.; Ringvall, A.H.; Ståhl, G. Adapting National Forest Inventories to changing requirements—The case of the Swedish National Forest Inventory at the turn of the 20th century. Silva Fenn. 2014, 48, 29. [Google Scholar] [CrossRef]
- AIMMS. AIMMS Optimization Modeling. Available online: https://aimms.com/english/developers/resources/manuals/optimization-modeling/ (accessed on 10 September 2018).
- Gurobi. Available online: http://www.gurobi.com/ (accessed on 2 July 2018).
- Surendra, J. Statistiska Meddelanden, JO0312 SM 1801; Tabell 2: Gross Felling by Ownership Class. 3-Year Average 2015–2017. Bruttoavverkning 2017. Preliminär Statistik. [Gross Felling in 2017, Preliminary Statistics]; Skogsstyrelsen: Jönköping, Sweden, 2018. [Google Scholar]
- Lauri, P.; Forsell, N.; Gusti, M.; Korosou, A.; Havlík, P.; Obersteiner, M. Global woody biomass harvest volumes and forest area use under different SSP-RCP scenarios. J. For. Econ. 2019, 34, 285–309. [Google Scholar] [CrossRef]
- Granström, S.C. Analys av Fjärrvärmeföretagens Intäkts-Och Kostnadsutveckling; EI R2011:08; Energimarknadsinspektionen: Eskilstuna, Sweden, 2011. [Google Scholar]
- Eriksson, L.O.; Athanassiadis, D.; Öhman, M. Ett Energioptimerat Skogsbruk i Sverige; Rapport 2013:17; Svensk Fjärrvärme: Stockholm, Sweden, 2013. [Google Scholar]
- Claesson, S.; Andersson, B.; Bergh, J. Skogliga Konsekvensanalyser 2008–SKA VB 08; Rapport 25; Skogsstyrelsen: Jönköping, Sweden, 2008. [Google Scholar]
- Skogforsk. WeCalc—Energisnurran. Available online: https://www.skogskunskap.se/rakna-med-verktyg/skogsbransle/wecalc---energisnurran/ (accessed on 1 July 2018).
- Lindholm, G. Sågverksbranschens Kostnads-Och Intäktsstruktur: Undersökning, Analys Och Trender Inom Svensk Sågverksnäring; SLU, Department of Forest Products: Uppsala, Sweden, 2006. [Google Scholar]
- ETSAP. Technology Brief I07—May 2015, Table 4. Energy Technology Systems Analysis Progamme. 2015. Available online: https://iea-etsap.org/E-TechDS/PDF/I07_Pulp&Paper_May2015OK.pdf (accessed on 15 February 2020).
- Heureka Wiki. Available online: https://www.heurekaslu.se/wiki/Heureka_Wiki (accessed on 15 October 2019).
- Skogsindustrierna. Our Members. 2018. Available online: https://www.forestindustries.se/about-us/our-members/ (accessed on 1 July 2018).
- Energiföretagen. Tillförd Energi. 2018. Available online: https://www.energiforetagen.se/statistik/fjarrvarmestatistik/tillford-energi/[?] (accessed on 15 February 2020).
- Skogsstyrelsen. Skogsstatistisk Årsbok. 2014. Available online: https://www.skogsstyrelsen.se/globalassets/statistik/historisk-statistik/skogsstatistisk-arsbok-2010-2014/skogsstatistisk-arsbok-2014.pdf (accessed on 15 February 2018).
- Bolkesjø, T.F.; Buongiorno, J. Short-and long-run exchange rate effects on forest product trade: Evidence from panel data. J. For. Econ. 2006, 11, 205–221. [Google Scholar] [CrossRef]
- Buongiorno, J. Income and time dependence of forest product demand elasticities and implications for forecasting. Silva Fenn. 2015, 49, 1–17. [Google Scholar] [CrossRef]
- Simangunsong, B.C.H.; Buongiorno, J. International demand equations for forest products: A comparison of methods. Scand. J. For. Res. 2001, 16, 155–172. [Google Scholar] [CrossRef]
- Michinaka, T.; Tachibana, S.; Turner, J.A. Estimating price and income elasticities of demand for forest products: Cluster analysis used as a tool in grouping. For. Policy Econ. 2011, 13, 435–445. [Google Scholar] [CrossRef]
- Solberg, B.; Moiseyev, A.; Kallio, A.M.I.; Toppinen, A. Forest sector market impacts of changed roundwood export tariffs and investment climate in Russia. For. Policy Econ. 2010, 12, 17–23. [Google Scholar] [CrossRef]
- Lintunen, J.; Laturi, J.; Uusivuori, J. Finnish Forest and Energy Policy Model (FinFEP). A Model Description; Natural Resources and Bioeconomy Studies 59; Luke: Helsinki, Finland, 2015. [Google Scholar]
- Sjølie, H.K.; Latta, G.S.; Trømborg, E.; Bolkesjø, T.F.; Solberg, B. An assessment of forest sector modeling approaches: Conceptual differences and quantitative comparison. Scand. J. For. Res. 2015, 30, 60–72. [Google Scholar] [CrossRef]


| Sets and Indices | Explanation |
|---|---|
| Set of scenarios and set index | |
| Set of time periods and set index | |
| Set of NFI plots and t index | |
| Set of management programs, the subset belonging to set , and set index | |
| Set of factors and set index | |
| Set of facilities and t index | |
| Set of facility types, the singleton set designating the facility type of facility and set index | |
| The set of elements constituting the stepwise demand functions, and set index | |
| Variables | |
| Share of the area of NFI plot allocated to management program | |
| Amount of factor transported from NFI plot to facility in period | |
| Amount of factor transported from facility to facility in period | |
| Amount of factor to be used as input at facility in period | |
| Amount of factor produced at facility in period | |
| Capacity of facility in period | |
| Maintained capacity at facility in period | |
| Investment in new capacity at facility in period | |
| Total output of factor in period | |
| Amount allocated to step of factor in period | |
| Total cost in period | |
| Total surplus in period | |
| Total net socl surplus | |
| Parameters | |
| Available amount at roadside of factor in period represented by NFI plot when allocated management program | |
| Standing stock after harvest in period represented by NFI plot when allocated management program | |
| Cost due to forest management activities in period represented by NFI plot when allocated management program | |
| The initial standing stock | |
| Unit output of factor per unit input of factor for facility of type | |
| Initial capacity of facility | |
| Maximum amount to be allocated to step of the demand function for factor in period | |
| Price per unit at step of the demand function for factor in period | |
| Unit transport cost of factor per distance unit | |
| Distance between NFI plot and facility | |
| Distance between facility and facility | |
| Unit operating cost per input of factor for a facility of type | |
| Maintenance cost per unit of capacity for a facility of type | |
| Cost of installing new capacity for a facility of type | |
| Capital cost per unit of capacity for a facility of type | |
| Discount factor for period |
| Maximize π subject to | (1) | |
| Transport and production model | ||
| (2) | ||
| (3) | ||
| (4) | ||
| (5) | ||
| (6) | ||
| (7) | ||
| (8) | ||
| Capacity model | ||
| (9) | ||
| \ | (10) | |
| \ | (11) | |
| Demand model | ||
| (12) | ||
| (13) | ||
| (14) | ||
| Financial model | ||
| (15) | ||
| (16) | ||
| (17) | ||
| and all variables ≥ 0 except , and that are free and | (18) |
| County | ||||
|---|---|---|---|---|
| N | S | M | I | |
| Forest area (ha) | 2,933,574 | 693,807 | 333,770 | 141,278 |
| No. of plots | 458 | 233 | 122 | 59 |
| Mean volume (m3 ha−1) | 104 | 144 | 163 | 114 |
| Average age (y) | 68 | 43 | 50 | 75 |
| Productivity (m3 ha−1 y−1) | 3.2 | 8.9 | 7.3 | 3.8 |
| Conifers (% of volume) | 81 | 80 | 77 | 76 |
| Deciduous (% of volume) | 19 | 18 | 23 | 24 |
© 2020 by the authors. Licensee MDPI, Basel, Switzerland. This article is an open access article distributed under the terms and conditions of the Creative Commons Attribution (CC BY) license (http://creativecommons.org/licenses/by/4.0/).
Share and Cite
Eriksson, L.O.; Forsell, N.; Eggers, J.; Snäll, T. Downscaling of Long-Term Global Scenarios to Regions with a Forest Sector Model. Forests 2020, 11, 500. https://doi.org/10.3390/f11050500
Eriksson LO, Forsell N, Eggers J, Snäll T. Downscaling of Long-Term Global Scenarios to Regions with a Forest Sector Model. Forests. 2020; 11(5):500. https://doi.org/10.3390/f11050500
Chicago/Turabian StyleEriksson, Ljusk Ola, Nicklas Forsell, Jeannette Eggers, and Tord Snäll. 2020. "Downscaling of Long-Term Global Scenarios to Regions with a Forest Sector Model" Forests 11, no. 5: 500. https://doi.org/10.3390/f11050500
APA StyleEriksson, L. O., Forsell, N., Eggers, J., & Snäll, T. (2020). Downscaling of Long-Term Global Scenarios to Regions with a Forest Sector Model. Forests, 11(5), 500. https://doi.org/10.3390/f11050500