Article

Seasonal Pattern of Stem Diameter Growth of Qinghai Spruce in the Qilian Mountains, Northwestern China

1
Research Institute of Forest Ecology, Environment and Protection, Chinese Academy of Forestry, Key Laboratory of Forest Ecology and Environment of the State Forestry Administration of China, Beijing 100091, China
2
School of Politics and Public Managements, Qinghai Nationalities University, Xining 810000, China
3
State Key Laboratory of Urban and Regional Ecology, Research Center for Eco-Environmental Sciences, Chinese Academy of Sciences, Beijing 100085, China
4
University of Chinese Academy of Sciences, Beijing 100049, China
5
Academy of Water Resource Conservation Forests of Qilian Mountains in Gansu Province, Zhangye 734000, China
*
Author to whom correspondence should be addressed.
Forests 2020, 11(5), 494; https://doi.org/10.3390/f11050494
Submission received: 11 March 2020 / Revised: 20 April 2020 / Accepted: 26 April 2020 / Published: 27 April 2020
(This article belongs to the Section Forest Ecology and Management)

Abstract

:
It is important to develop a better understanding of the climatic and soil factors controlling the stem diameter growth of Qinghai spruce (Picea crassifolia Kom.) forest. The results will provide basic information for the scientific prediction of trends in the future development of forests. To explain the seasonal pattern of stem diameter growth of Qinghai spruce and its response to environmental factors in the Qilian Mountains, northwest China, the stem diameter changes of 10 sample trees with different sizes and soil and meteorological conditions were observed from May to October of 2015 and 2016. Our results showed that the growth initiation of the stem diameter of Qinghai spruce was on approximately 25 May 2015 and 20 June 2016, and stem diameter growth commenced when the average air and soil temperatures were more than 10 °C and 3 °C, respectively. The cessation of growth occurred on approximately 21 August 2015 and 14 September 2016, and it was probably controlled by soil moisture. Stem diameter growth began earlier, ended later, and exhibited a larger growth rate as tree size increased. For the period May–October, the cumulative stem diameter growth of individual trees was 400 and 380 μm in 2015 and 2016, respectively. The cumulative stem diameter growth had a clear seasonal pattern, which could be divided into three growth stages, i.e., the beginning (from day of year (DOY) 120 to the timing of growth initiation with the daily growth rate of less than 2 μm·day−1), rapid growth (from the timing of growth initiation to the timing of growth cessation with the daily growth rate of more than 2 μm·day−1), and ending stages (from the timing of growth cessation to DOY 300 with the daily growth rate of less than 2 μm·day−1). The correlation of daily stem growth and environmental factors varied with growth stages; however, temperature, vapor pressure deficit (VPD), and soil moisture were the key factors controlling daily stem diameter growth. Overall, these results indicated that the seasonal variation in stem growth was regulated by soil and climatic triggers. Consequently, changes in climate seasonality may have considerable effects on the seasonal patterns of both stem growth and tree growth.

1. Introduction

In recent decades, the climate has been warmer and drier [1], and the frequency and intensity of drought events have increased worldwide [2], most notably in northern China [3,4]. These changes affect inter-annual tree growth through the specific physiological thresholds of temperature and water availability [5,6,7], and they may have considerable effects on seasonal growth patterns of tree growth in arid areas [8,9]. However, the intra-annual variation in stem radial growth, which provides scientific support for forest management decision-making, remains less studied in arid areas of China.
In the arid northwestern region of China, the Qilian Mountains are a key nourishing and cherished water source area, feeding the Shiyanghe, Shulehe, and Heihe rivers [10]. Qinghai spruce is the dominant tree species of forests in this region, growing on shaded or semi-shaded slopes with elevations of 2500–3300 m [6]. Previous studies found that the daily and seasonal stem radial variations in individual Qinghai spruce sample trees and stem growth initiation were related to the soil temperatures at a depth of 40 cm and the mean air temperature [9,10]. In a natural forest, Qinghai spruce trees had obviously different diameters in the stand. To provide an accurate estimate of the intra-annual stem growth at the stand level, it is necessary to select sample trees with different diameters. We do not yet have a clear understanding of the variation in stem diameter growth among tree sizes and how environmental factors affect inter-annual variability in the seasonal pattern of stem diameter growth.
Consequently, we focused on (a) assessing the seasonal pattern of stem diameter growth and its variation among tree sizes, (b) how environmental factors affect seasonal growth parameters, and (c) which environmental factors control daily rate of stem diameter growth. To achieve these objectives, we selected a forest plot with 30- to 140-year-old Qinghai spruce in the Pailugou watershed, located in the Qilian Mountains, northwest China. Stem diameter changes, meteorological factors, soil moisture, and soil temperature were measured synchronously in the field from May to October of 2015 and 2016. Our work will contribute to improving the understanding of forest responses to environmental factors and to providing a basis for scientific prediction of trends in the future development of forest resources in arid regions.

2. Materials and Methods
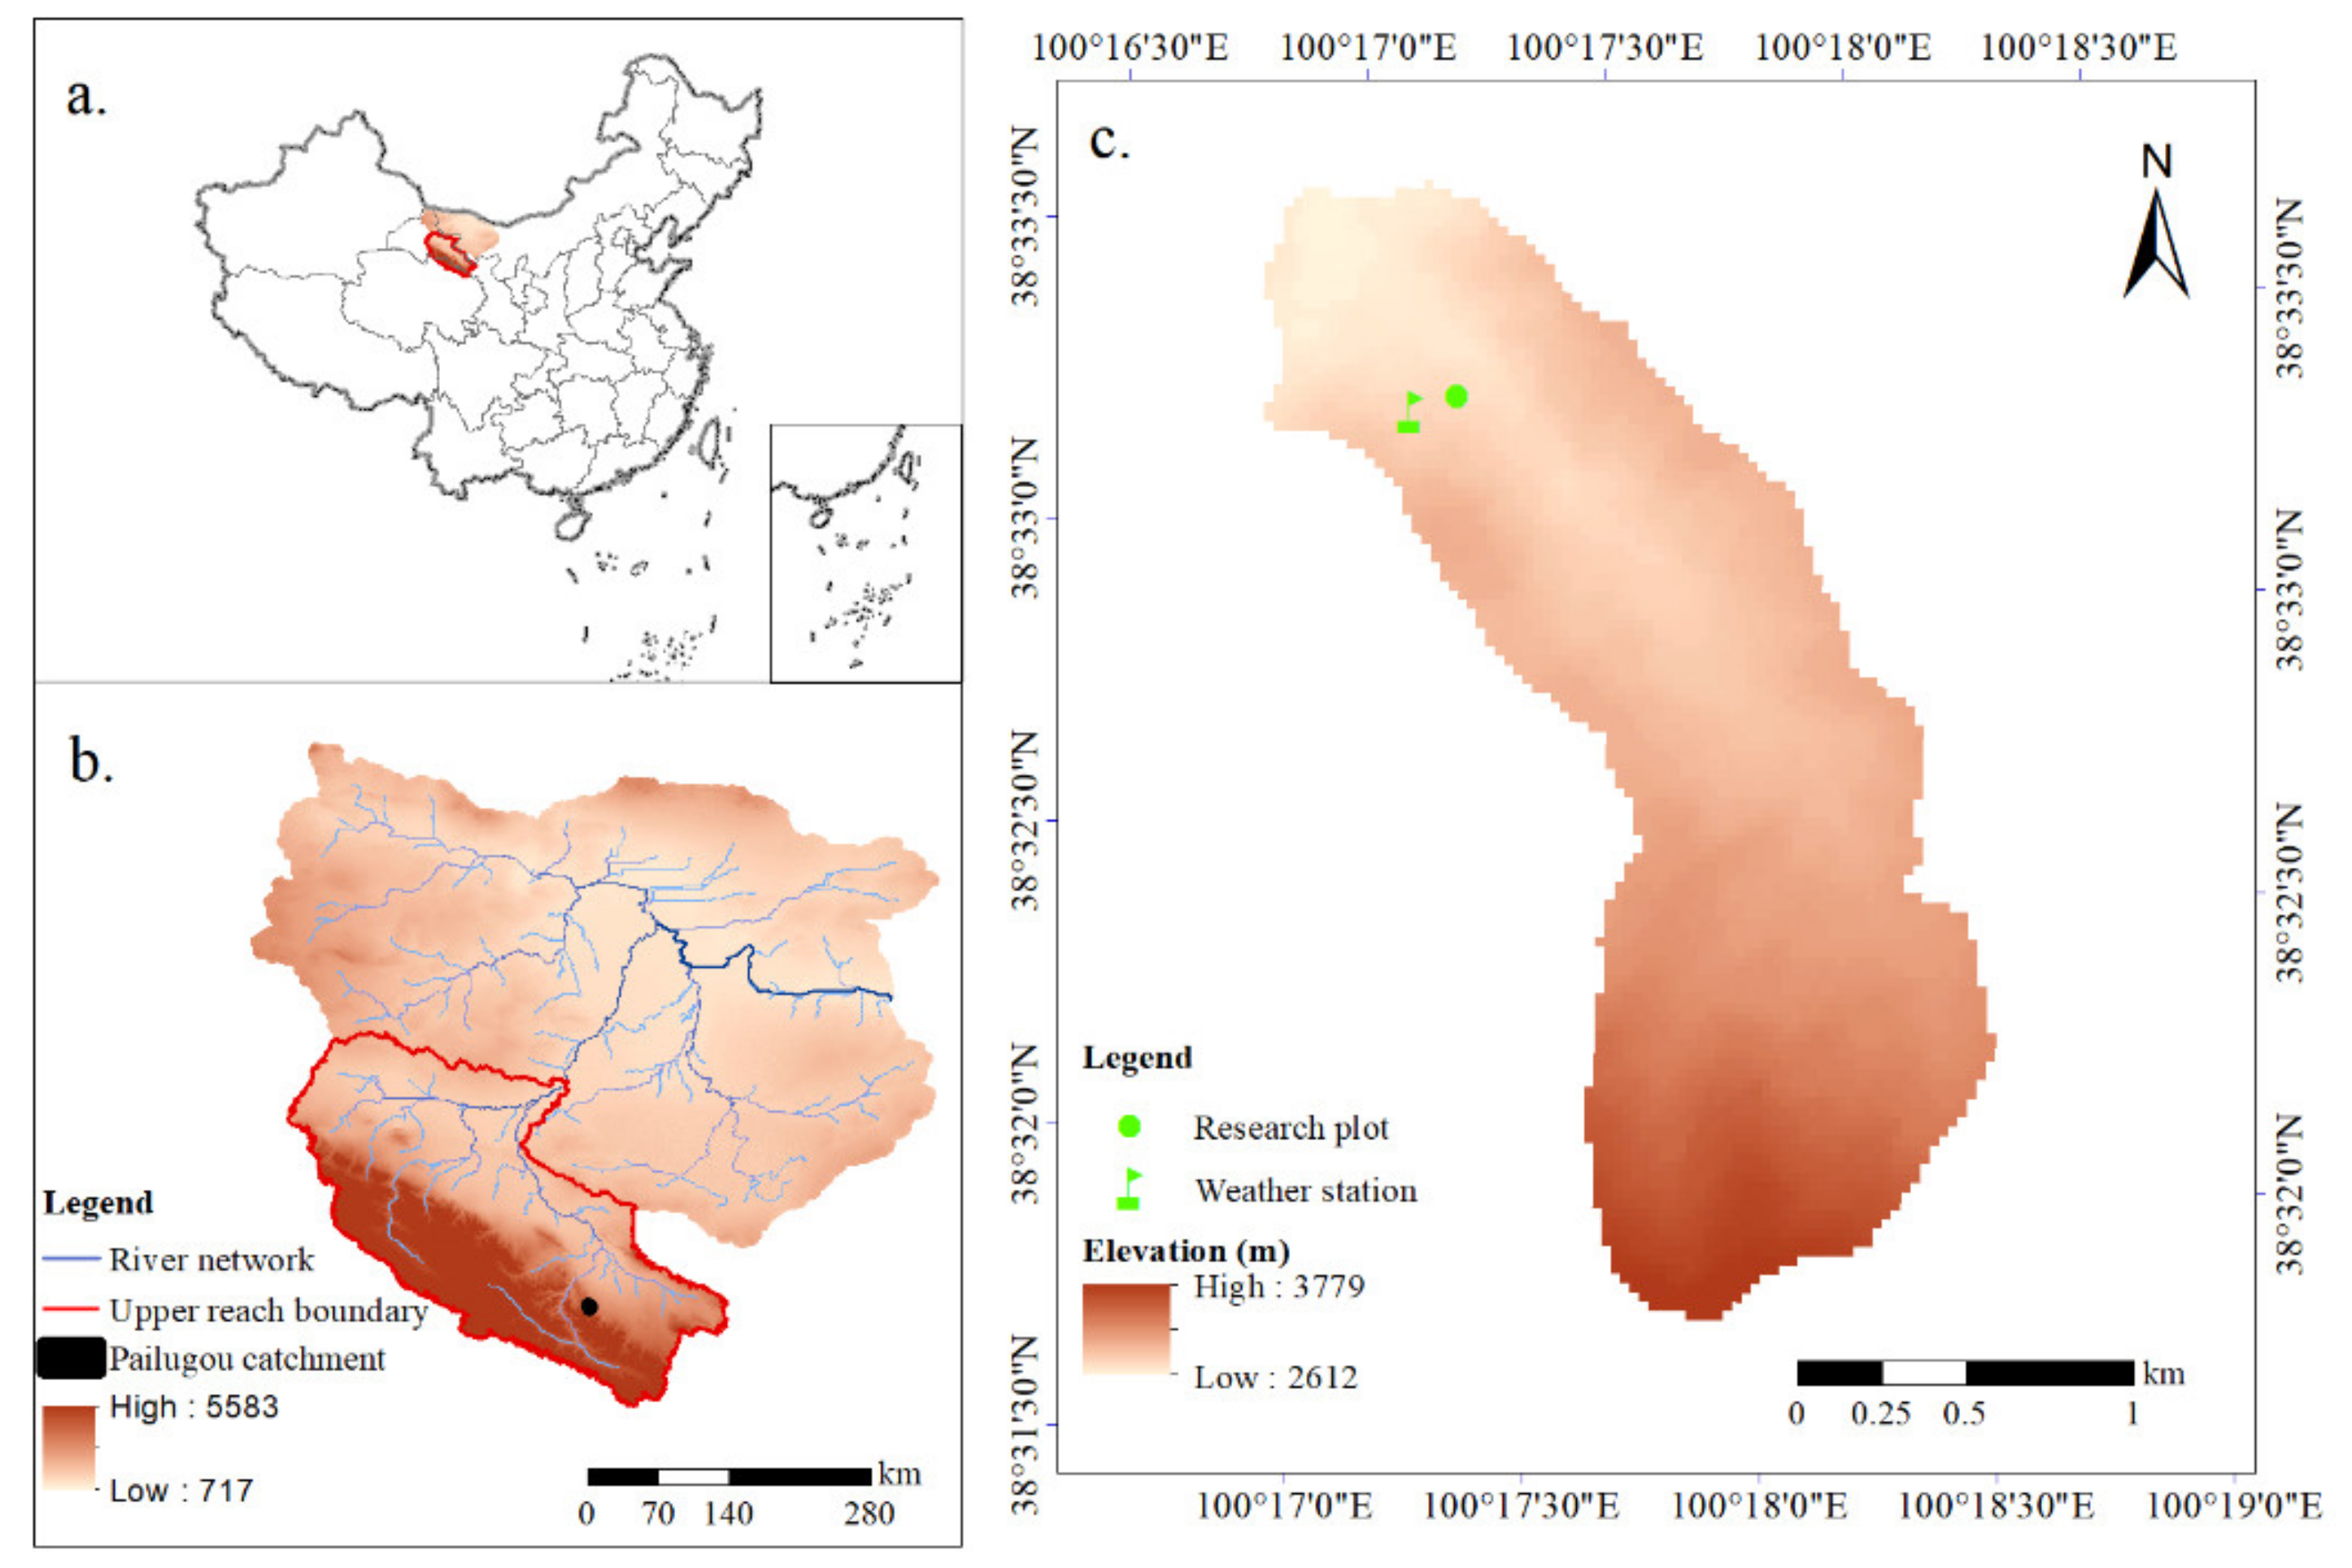
2.1. Study Area

The study was conducted in the Pailugou watershed (38°31′–38°33′ N, 100°16′–100°18′ E), with an area of 2.85 km2 and an elevation range of 2500–3800 m a.s.l.; the site is located in the middle part of the Qilian Mountains, in the upper Heihe River basin of arid northwest China (36°43′–39°36′ N, 97°25′–103°46′ E) (Figure 1). The climate is arid and semiarid continental. According to meteorological data from the Xishui station at an elevation of 2600 m, from 1994 to 2014, the mean annual air temperature was 1.6 °C. The mean annual precipitation was 435.5 mm, and approximately 84% of the rainfall occurred in the growing season (from May to September). The basin evaporation was 1081.7 mm. The mean annual sunshine duration was 1892.6 h·a−1. The mean annual relative humidity was 60% [11,12].
In the Pailugou watershed, along the elevation gradient, the vegetation types are mountain forest grasslands, subalpine shrub meadows, and alpine meadows, respectively [12]. Mountain forest is mainly distributed on shaded (north-facing) or semi-shaded (northwest- and northeast-facing) slopes at elevations from 2500 to 3300 m a.s.l., and the dominant tree species is Qinghai spruce (Picea crassifolia Kom.). Shrub community is mainly distributed on foot slope positions of shady slopes and areas above the tree line, and the main shrub species include Caragana jubata (Pall.) Poir., Berberis diaphana Maxim., and Potentilla fruticosa L. widely distributed at elevations <2900 m a.s.l., and Caragana jubata (Pall.) Poir., and Salix gilashanica C. Wang et P. Y. Fu distributed at elevations >3100 m a.s.l. Herbaceous vegetation consists mainly of Carex lanceolata Boott, Pedicularis spp. and Stipa capillata L.

2.2. Research Plot

In 2015, a 20 m × 20 m plot was set up in a pure spruce plot (38°33′14.8″ N, 100°17′5.4″ E; 2762 m a.s.l.), located on the northeast-facing slope with a slope gradient of 27° (Figure 1c). The forest in the plot consisted of Qinghai spruce ranging from 30 to 140 years old, with an average canopy density of 0.68 and a tree density of 2100 trees·ha−1. The tree height ranged from 1.7 m to 16.3 m, with an average of 8.4 ± 3.8 m. The diameter at breast height (DBH) ranged from 2.4 cm to 32.9 cm, with an average of 11.8 ± 6.5 cm. The canopy width ranged from 1.26 m to 6.16 m, with an average of 3.01 ± 0.98 m.
All 84 Qinghai spruce trees in this research plot were divided into four size classes according to DBH, i.e., big trees (DBH > 22.5 cm), medium trees (12.5 cm < DBH ≤ 22.5 cm), small trees (4.0 cm < DBH ≤ 12.5 cm), and seedlings (DBH ≤ 4.0 cm) [13]. In the plot, there were only six big trees with an average DBH of 27.2 ± 4.9 cm. The number of medium trees was the largest, 36 trees, and nearly six times that of the big trees (Table 1).
The dominant shrub in the plot was Potentilla fruticosa L., with an average height of 0.41 m, and a coverage of approximately 2%. The herbaceous vegetation was mainly Carex lanceolata Boott and Pedicularis spp., with an average height of 4.7 cm, and a coverage of approximately 4%. Moss (Abietinella abietina) covered the forest floor. The average thickness was 7.4 ± 2.4 cm, with a coverage of approximately 25%.
In the plot, the soil was thick and highly permeable, with an average soil thickness of 70 cm. The soil type was mountainous grey cinnamon soil and its texture was loam, with sand content of 34% [7], a total soil porosity of 71.2%, capillary porosity of 59.5%, non-capillary porosity of 11.7%, and a bulk density of 0.83 g·cm−3 in the root zone (0- to 60-cm soil layer) [14,15]. Within the 0- to 60-cm root zone, the saturation moisture content was approximately 0.69 m3·m−3 and the field capacity was approximately 0.58 m3·m−3 [15].

2.3. Measurements of Stem Diameter Dynamics

In order to describe tree diameter growth for the whole forest, three or four representative trees (i.e., healthy, average shape) from each tree size class and ten trees in total were chosen as sample trees (Table 2). The microvariations in the stem diameters of the ten sample trees were measured at breast height (1.3 m above ground level) with band dendrometers. The dendrometers (Ecomatik, Munich, Germany), with a resolution of 0.1 mm, were constructed of a spring and a flexible stainless-steel band with a scale. Before installing the band, the outer bark under the band was lightly brushed to ensure smooth contact with the trunk. The scale of the band dendrometers varied with the stem diameter changes. For the period of 2015 and 2016 (May–October), the initial stem diameter of the dendrometers was observed for individual sample trees on May 1. Data were acquired at time intervals of approximately 5–10 days to observe whether the stem diameter measured by the dendrometers changed.
The cumulative stem diameter growth (G, μm) was estimated by Equation (1):
G = D i D 0
where Di is the daily stem diameter on day i, and D0 is the initial stem diameter on 1 May 2015 or 2016.
The daily rate of stem diameter growth (Gr, μm·day−1) was estimated by Equation (2):
G r = 1 n D i D j
where Di is the daily stem diameter on day i, Dj is the daily stem diameter on day j, n is the number of days between Di and Dj, and i is greater than j.

2.4. Seasonal Growth Pattern Assessment

Among the various sigmoidal models available to describe growth patterns, the Gompertz function is one of the most commonly applied models [9,16]. Due to its flexibility and asymmetrical shape [17], it has been used to describe tree growth patterns for entire tree lifespans [18] as well as patterns of seasonal growth [19,20,21]. To characterize the complete seasonal growth pattern (May–October) in the Qinghai spruce plot, the cumulative stem diameter growth curves were fitted with the Gompertz function defined as (Equation (3)):
Y = A exp exp β κ × t
where Y is the accumulative stem diameter change, A is the upper asymptote, β is the x-axis placement parameter, κ is the rate of change parameter, and t is the time in days.

2.5. Weather and Soil Moisture Measurements

An automatic weather station (CR3000, Campbell Company, US) approximately 2 m in height was installed on an open area, approximately 100 m from the plot, to collect meteorological data from May to October 2015 and 2016. The meteorological factors included air temperature (HMP115A, T (°C)), relative humidity (HMP45A, Rh (%)), and precipitation (TE525MM, P (mm)). These measurements were conducted at 1-min intervals, and the mean 10-min values were stored in a data logger.
The vapor pressure deficit (VPD, kPa) was calculated from air temperature (T, °C) and relative humidity (Rh, %) using the Magnus equation (Equation (4)) [22]:
V P D = 6.10 × e xp 17.08 × T T + 234.2 × 1 R h 100
The volumetric soil moisture (Ms, m3·m3) and the soil temperature (Ts, °C) for the root zone layers (the 0- to 10-cm, 10- to 20-cm, 20- to 40-cm, and 40- to 60-cm soil layers) were continuously monitored from June to October of 2015 and 2016 by using soil moisture and temperature sensors (5-TE, Decagon, United States). Up to 95% of the active roots were distributed within the upper 45 cm of the soil profile [9]. Therefore, the soil moisture and temperature of the 0- to 60-cm soil layer were used for analyses. Data were collected every 10 min by a data logger (EM50, Decagon, United States).

2.6. Data Analysis

In this study, the cumulative stem diameter growth was modeled with a Gompertz function (Equation (3)) using the nonlinear regression procedure. The ordinary least squares method was employed for the parameter estimation of the Gompertz function (1stOpt software, 7D-Soft High Technology Inc.). First, to access inter-annual variability, we modeled the averaged stem radial changes for ten sample trees for each year (n = 2). Then, to assess the variation among tree sizes, the seasonal growth pattern of each size class (n = 3) for each growing season (n = 2) was modeled.
The timing of growth initiation and cessation was determined as the day of year (DOY) when the modeled daily growth rates passed the threshold of 2 μm·day−1, which corresponded to the dendrometer accuracy and the variation of cumulative stem diameter growth. Then, the growing season (May–October) was divided by the timing of growth initiation and cessation into three stages: (1) the beginning stage (stage 1), the period from DOY 120 to the timing of growth initiation with the daily growth rate of less than 2 μm·day−1; (2) the rapid growth stage (stage 2), the period from the timing of growth initiation to the timing of growth cessation with the daily growth rate of more than 2 μm·day−1; and (3) the ending stage (stage 3), the period from the timing of growth cessation to DOY 300 with the daily growth rate of less than 2 μm·day−1 (Figure 2) [23].
Nonparametric Spearman correlation coefficients were calculated using the Statistical Product and Service Solutions (SPSS) version 21.0 (IBM Inc., Chicago, IL, USA) to quantify the relationships between the daily mean rate of stem diameter growth for ten Qinghai spruce trees (Gr) obtained by using Gompertz functions and the environmental variables (mean temperature (Tmean), maximum temperature (Tmax), minimum temperature (Tmin), precipitation (P), relative humidity (Rh), vapor pressure deficit (VPD), volumetric soil moisture (Ms5, Ms15, Ms30, Ms50), and soil temperature (Ts5, Ts15, Ts30, Ts50) of the 0- to 10-cm, 10- to 20-cm, 20- to 40-cm, and 40- to 60-cm soil layers, respectively).

3. Results

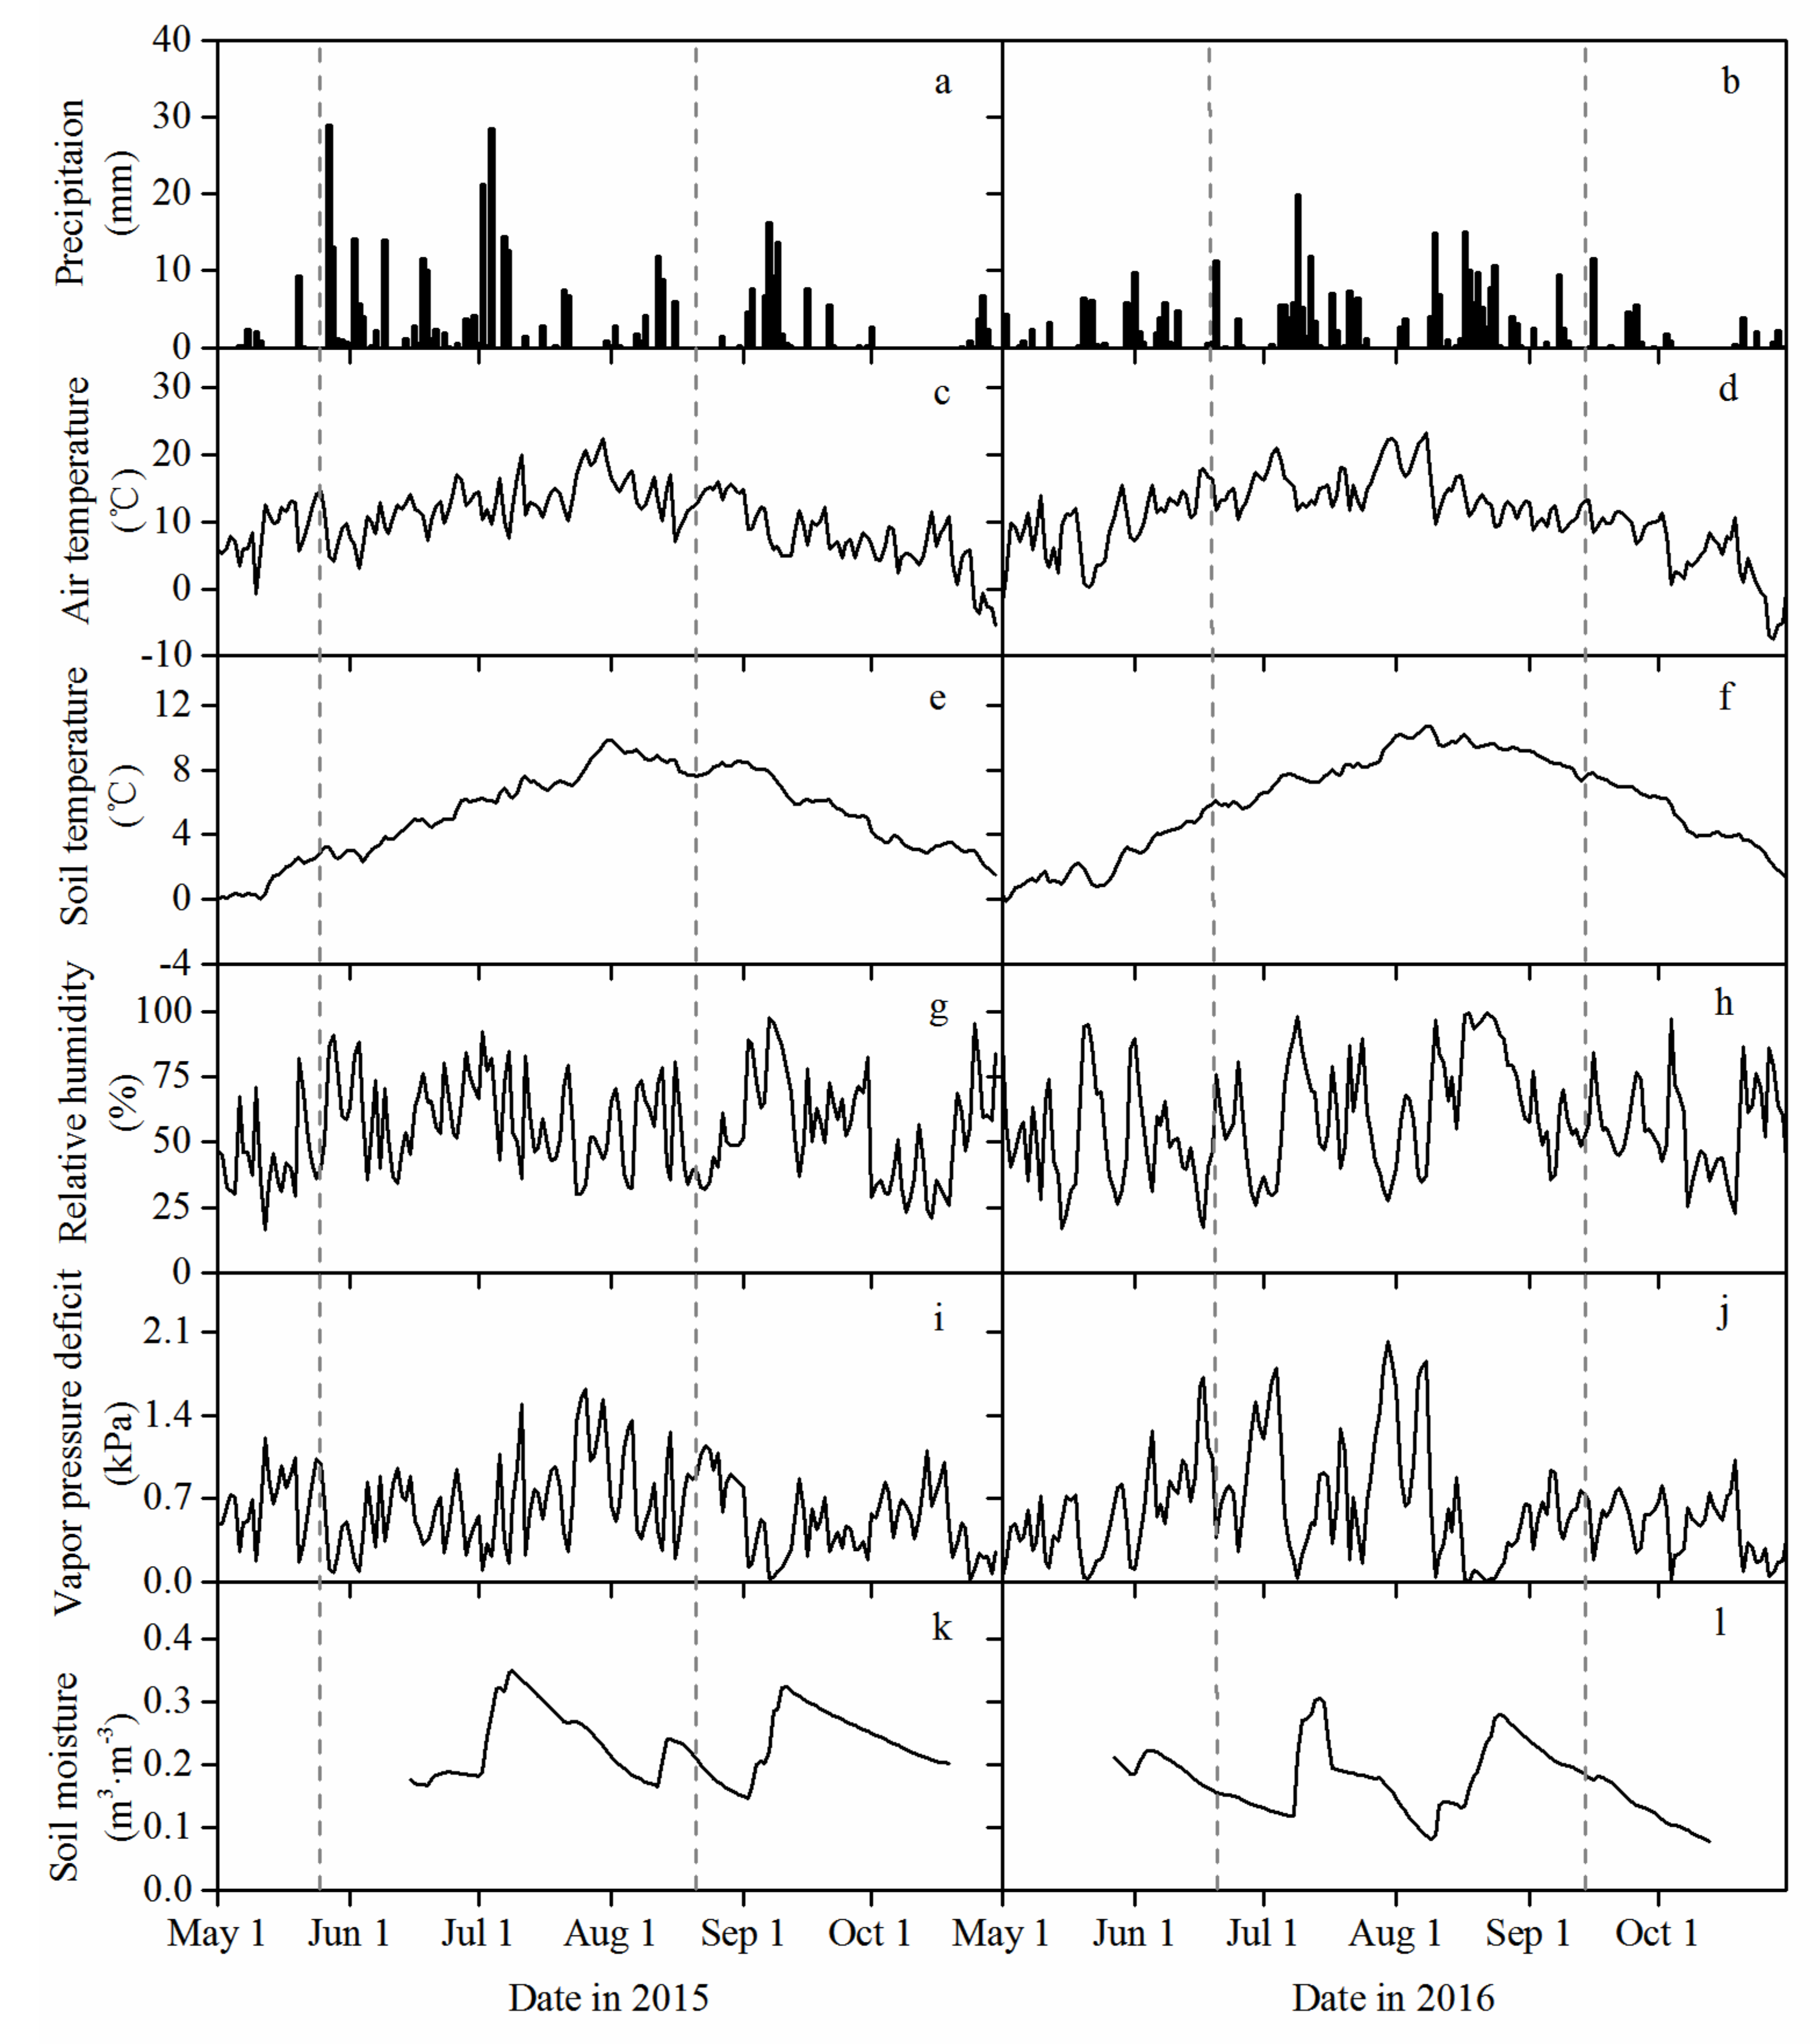
3.1. Environmental Characteristics during the Growing Season

In the Pailugou watershed, precipitation was unevenly distributed during the growing seasons of 2015 and 2016 (May–October). There were 76 and 88 rainy days, with total precipitation of 369 mm and 333.7 mm in the growing seasons of 2015 and 2016, respectively. On 84.2% (2015) and 92.0% (2016) of the rainy days, the precipitation was less than 10 mm, and there were only four rainfall events with precipitation greater than 15 mm in 2015 and two rainfall events greater than 15 mm in 2016 (Figure 3a,b).
There was a warm growing season (May–October). The daily mean air temperature varied in the range of −5.5–22.4 °C and −7.6–23.3 °C, with averages of 10.1 °C and 10.8 °C, respectively. Maximum air temperatures were recorded in late July or early August (Figure 3c,d). Soil temperature varied with air temperature. The daily mean soil temperature in the 0- to 60-cm soil layer varied in the ranges of 0.01–9.82 °C and −0.14–10.72 °C, with averages of 5.23 °C and 5.91 °C, respectively, in 2015 and 2016 (Figure 3e,f).
During the growing season, there were severe fluctuations in the humidity conditions. The relative humidity varied in the ranges of 16.5–97.6% and 16.7–99.3%, with averages of 55.1% and 57.8%, in 2015 and 2016, respectively (Figure 3g,h). The VPD varied in the range of 0.02–1.63 kPa and 0.01–2.02 kPa, with averages of 0.60 kPa and 0.60 kPa, respectively, in 2015 and 2016 (Figure 3i,j).
Soil moisture violently fluctuated with the occurrence of rainfall events. The mean volumetric soil moisture in the 0- to 60-cm soil layer was 0.234 m3·m3 from 15 June to 19 October 2015, but it remained at a low level with a mean of 0.193 m3·m3 in August. In 2016, the mean volumetric soil moisture of 0.173 m3·m−3 in the 0- to 60-cm soil layer was slightly lower than that in 2015 (Figure 3k,l).
In particularly, there was the remarkable characteristic of the inter-annual fluctuation of weather and corresponding changes of soil moisture (Figure 3). In this study, there was still a significant difference between two growing seasons. In 2015, the growing season was slightly colder than that in 2016, but the May of 2015 were slightly warmer than that of 2016. Due to insufficient precipitation and high temperatures in the period from mid-July to August in 2015, the soil moisture continued to drop and reached its minimum of the growing season, which would lead to soil water deficit for tree growth in the August of 2015. However, in 2016, a different moisture pattern emerged, with uniform distribution of rainfall in July and August leading to the soil moisture being maintained at a high level in August. Meanwhile, in the late growing seasons (September–October) of 2015, the soil moisture was obviously higher than that in 2016, but the air and soil temperature remained at a low level in 2015 and 2016.

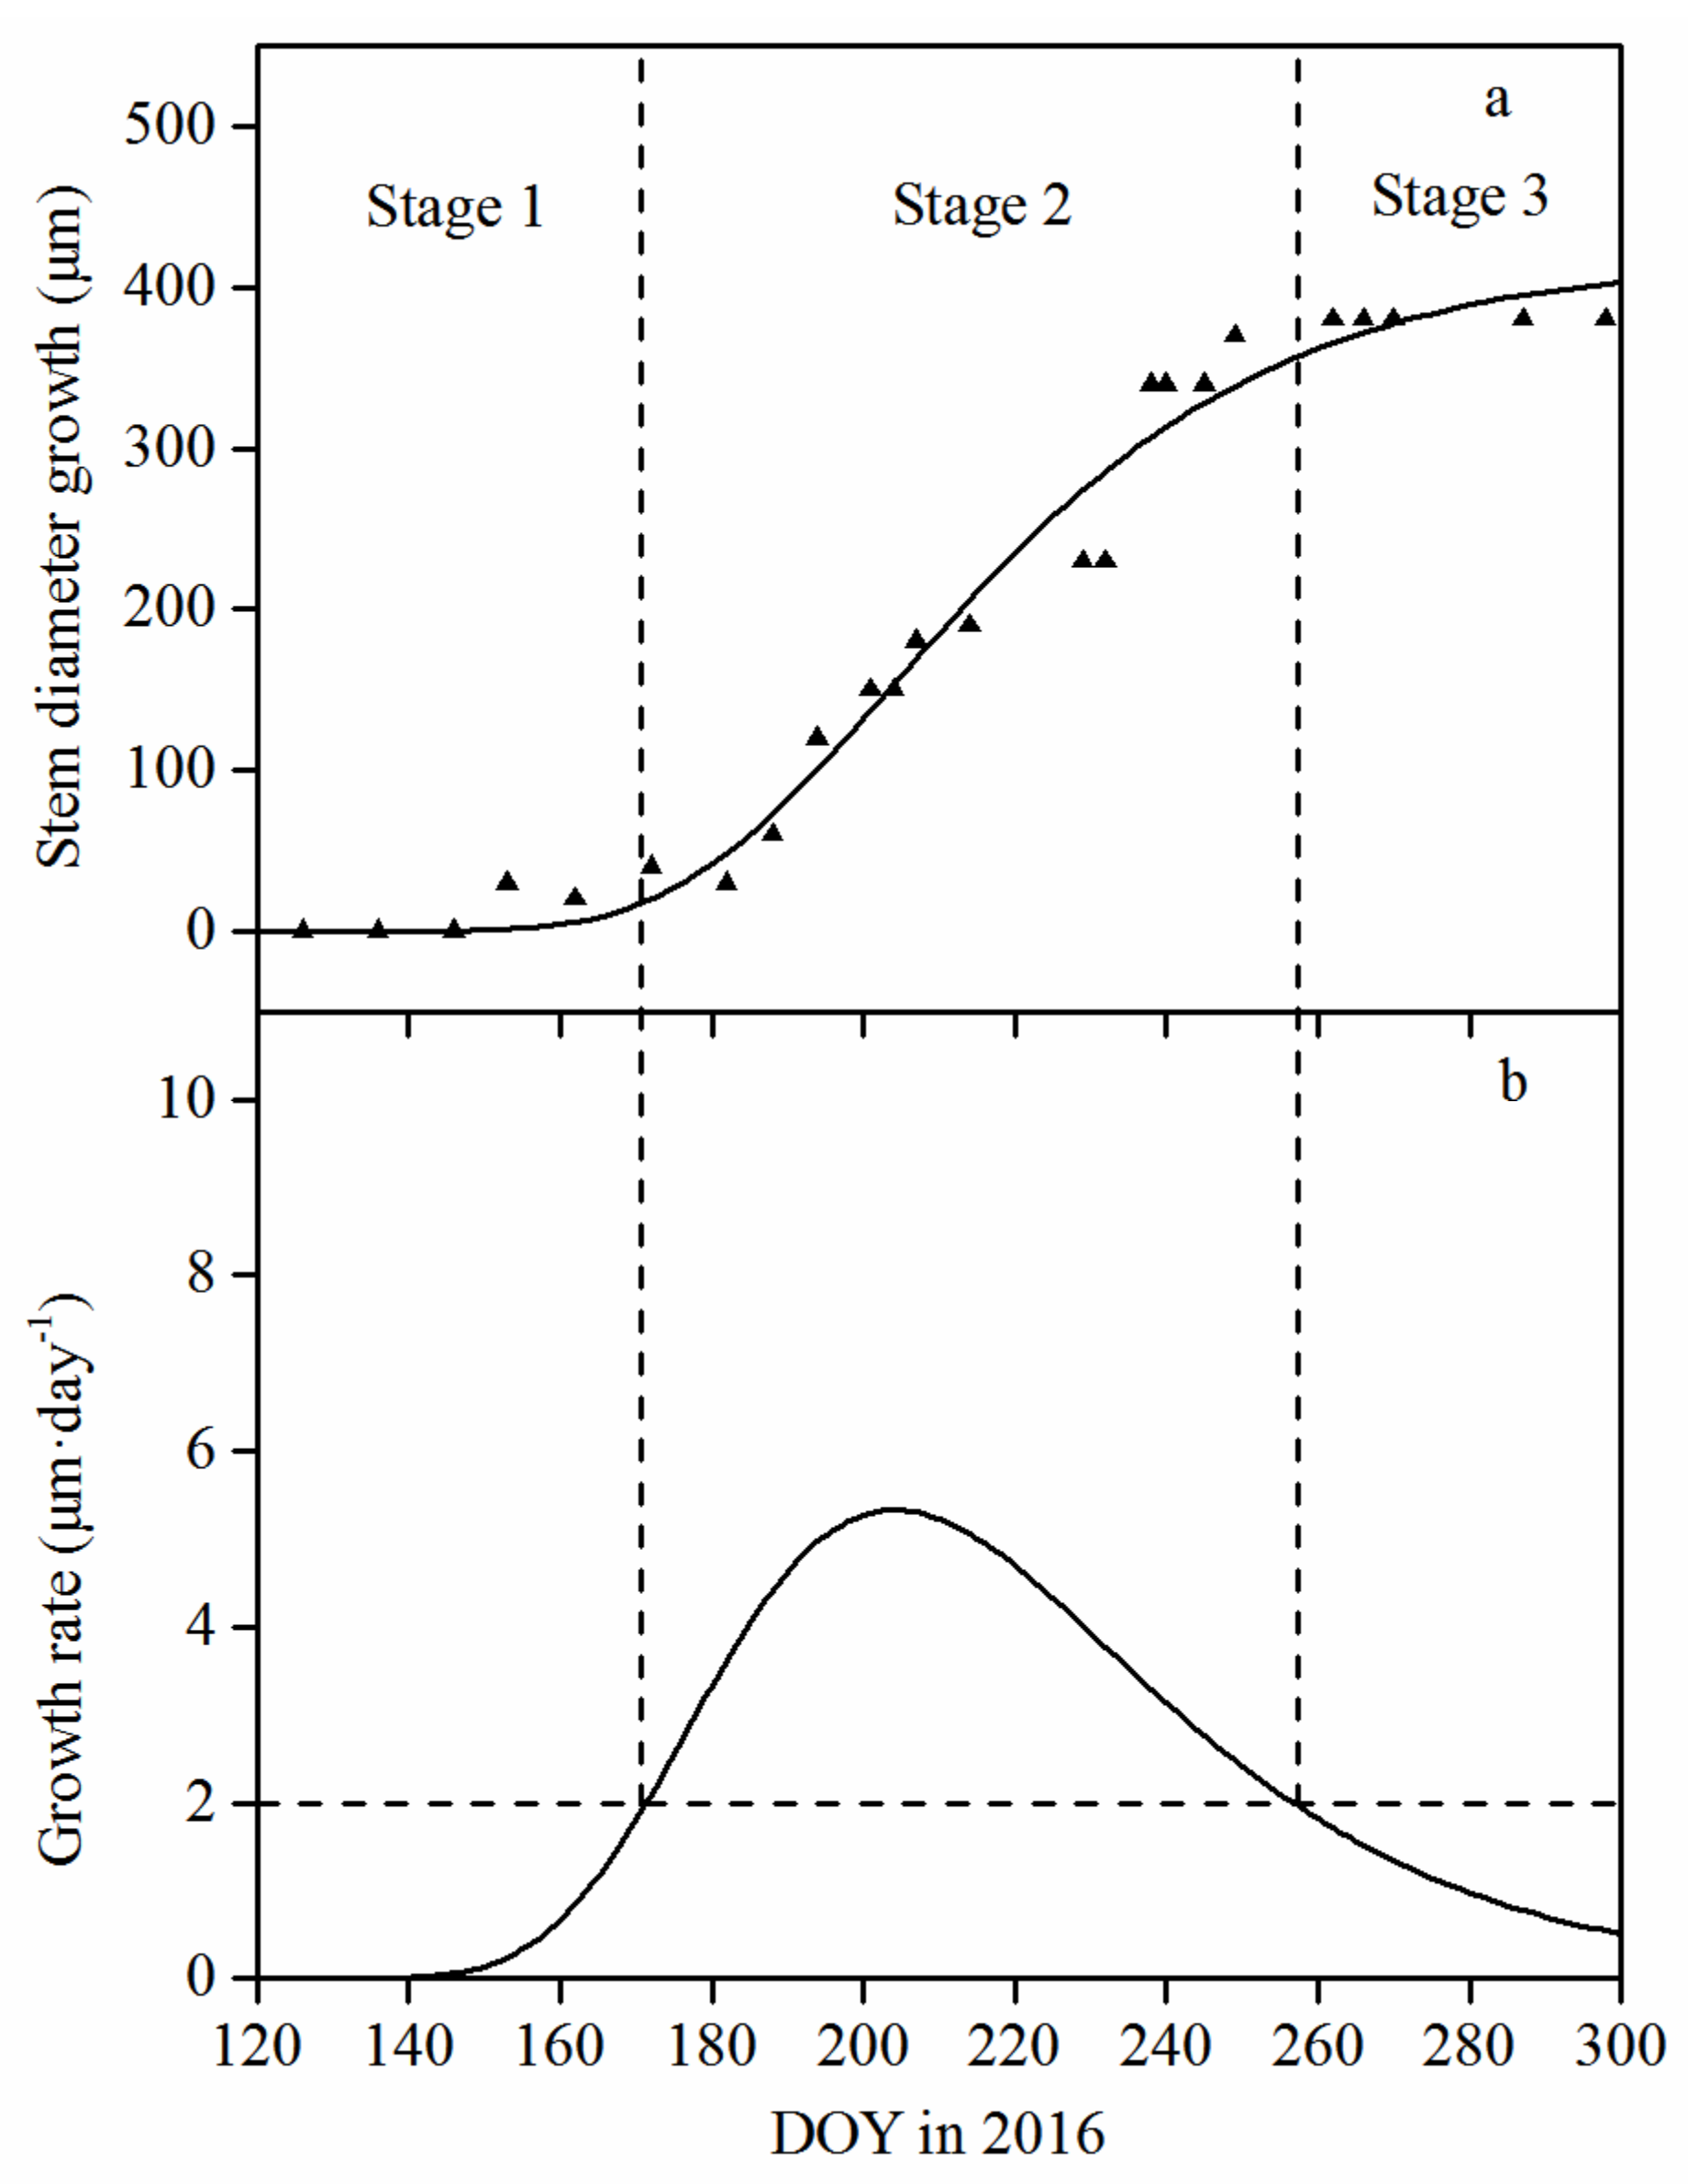
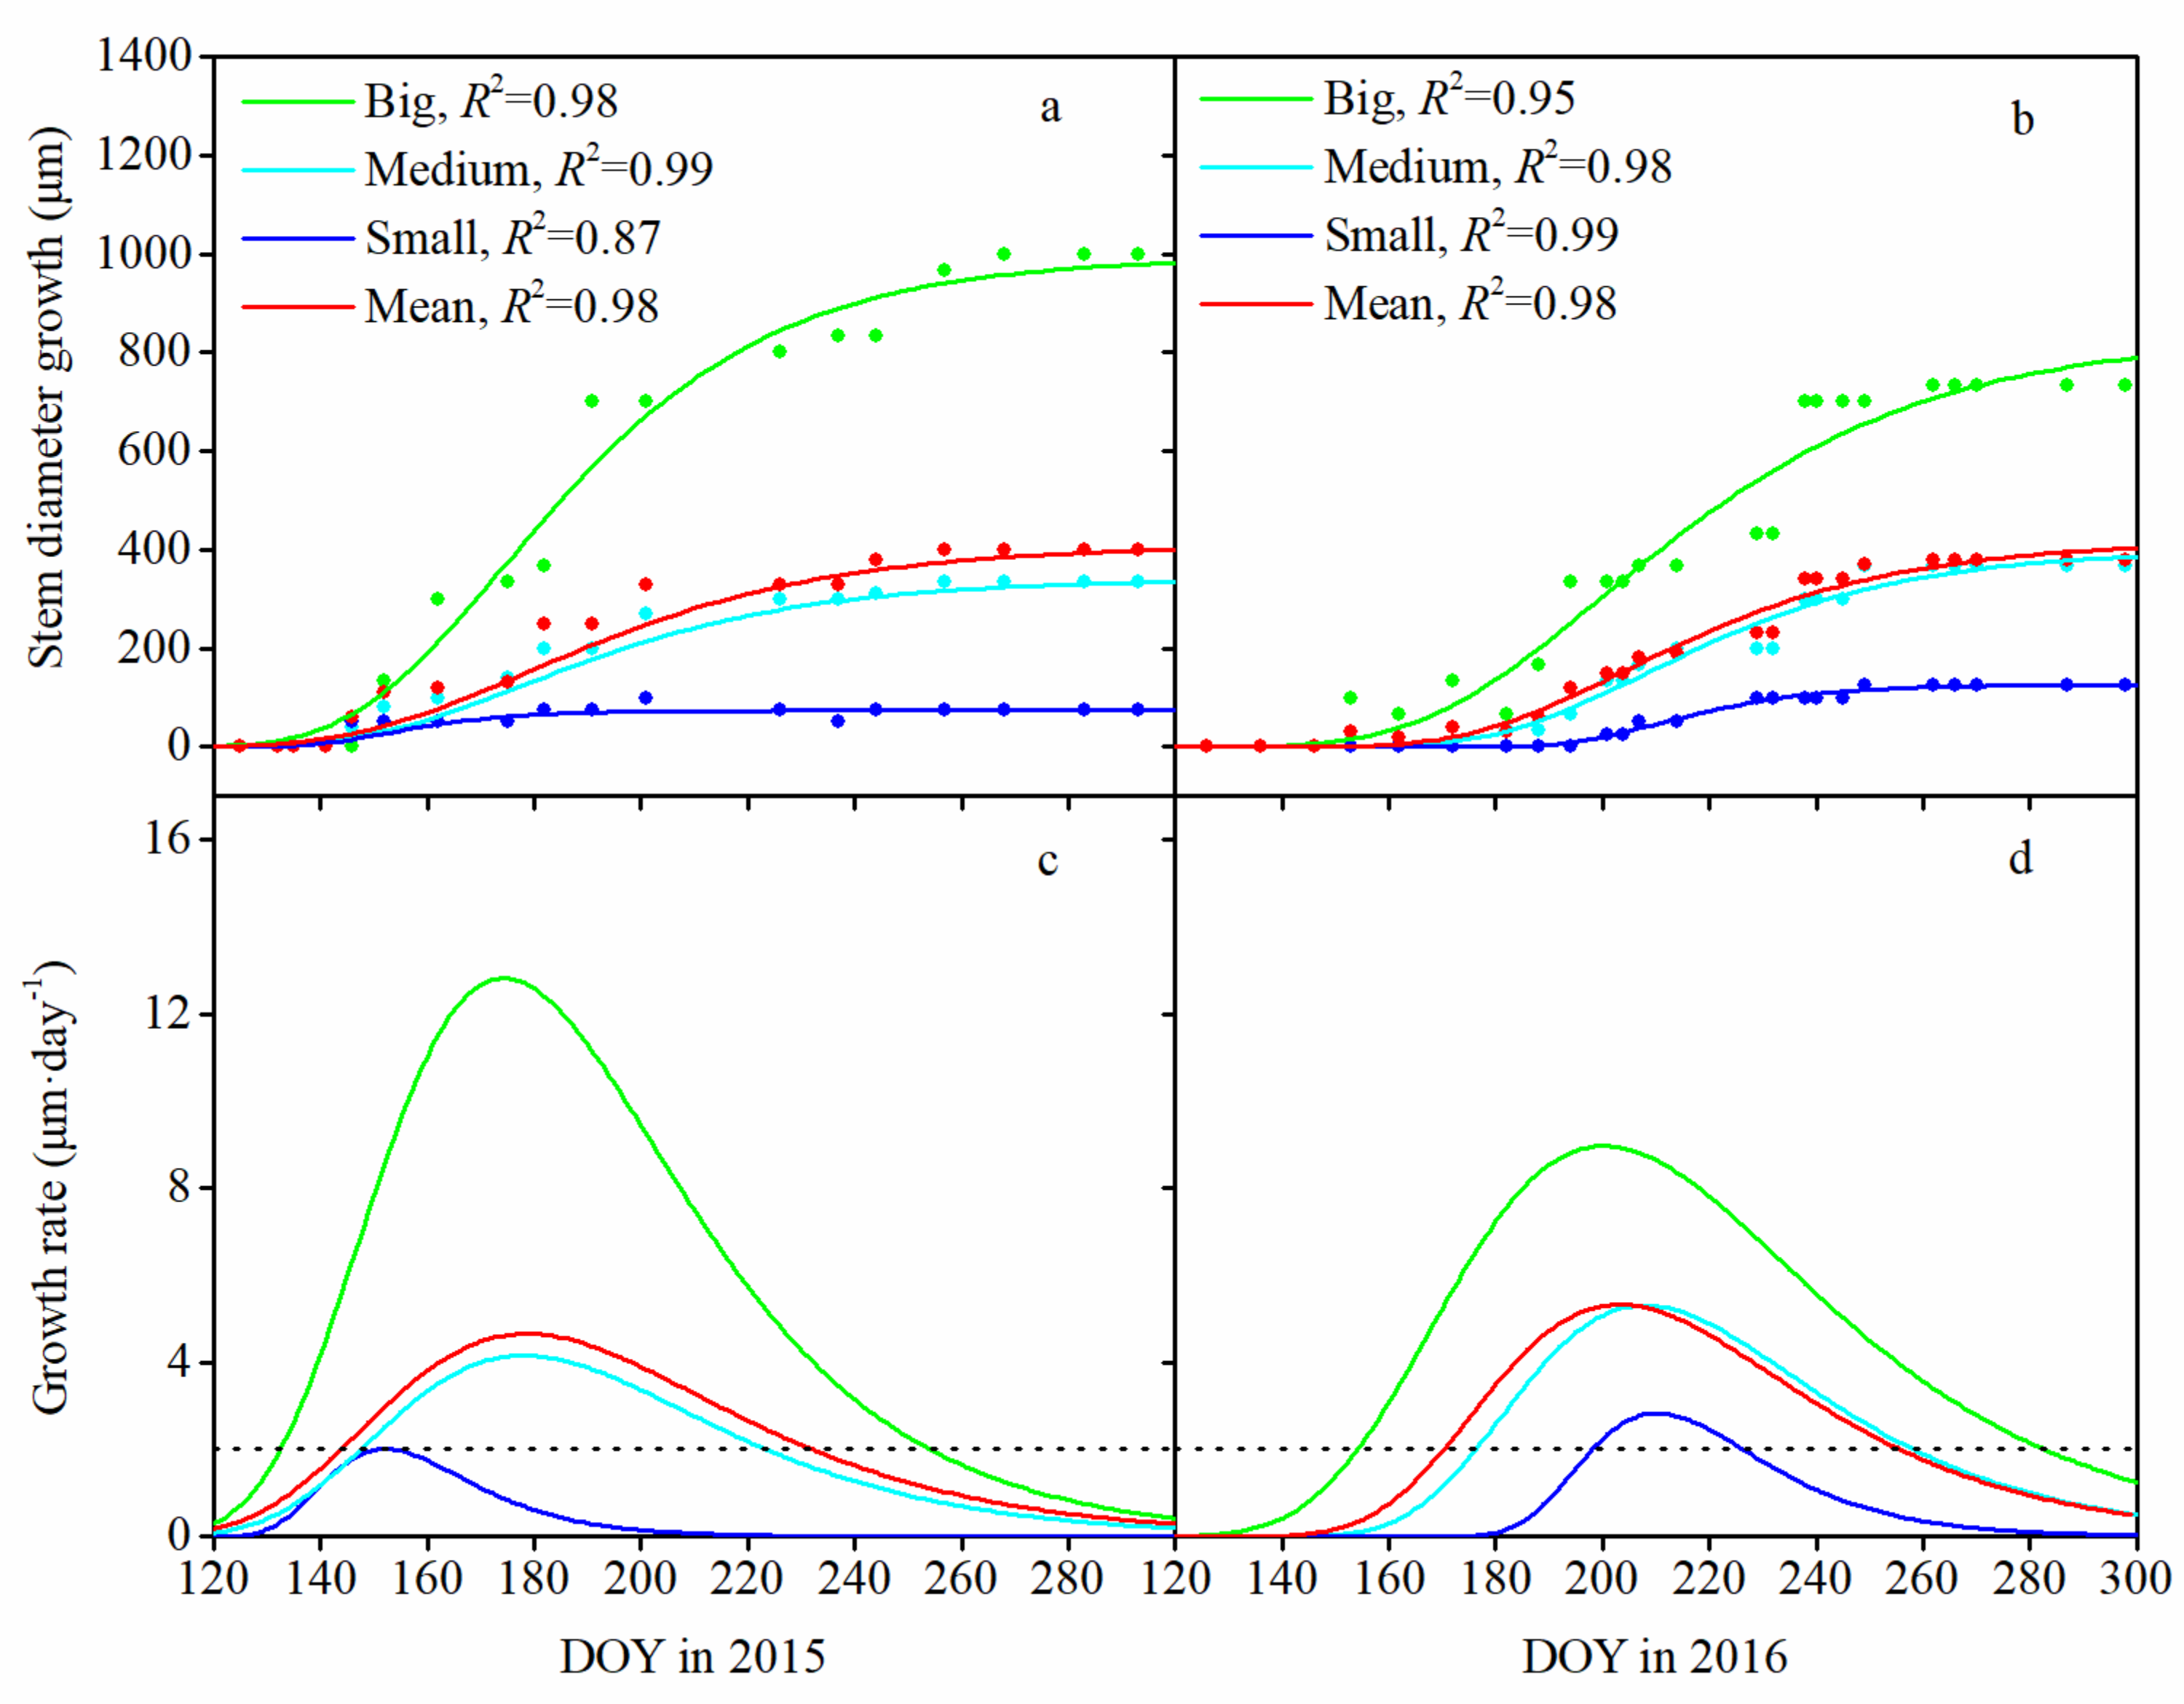
3.2. Seasonal Pattern of Stem Diameter Growth and Its Variation among Tree Sizes

In our study area, a fitting curve of cumulative stem diameter growth (Figure 4a,b) was built based on the observed data, which explained 87–99% of the variation in the seasonal diameter measurements. The daily rates of stem growth as the derivation of the fitting curve of cumulative stem diameter growth were calculated and are shown in Figure 4c,d.
Based on the curve of cumulative stem diameter growth, ten Qinghai spruce trees began to grow in May–June and stopped growing in August–September. According to the threshold of stem growth of 2 μm·day−1, in 2015, the timing of growth initiation of ten Qinghai spruce trees was approximately 25 May (day of year (DOY) 145), the timing of growth cessation was approximately 21 August (DOY 233), and the growing duration was 89 days; in 2016, stem growth began on approximately 20 June (DOY 172), the timing of growth cessation was approximately 14 September (DOY 258), and the growing duration was 87 days. According to the fitting curve of the associated growth rate, the maximum daily diameter growth peaked on approximately 28 June (DOY 179) in 2015 and 22 July (DOY 204) in 2016, with values of 4.658 and 5.327 μm·day−1, respectively (Figure 4c and Table 3). It took 34 and 32 days from growth initiation to reach daily maximum growth in 2015 and 2016, respectively (Table 3).
There was the same seasonal pattern of stem diameter growth for all trees (Figure 4), but the value of parameters defining the seasonal pattern varied greatly among tree size classes (Table 3). Stem diameter growth began earlier, ended later, and exhibited a larger maximum growth rate as tree size increased in 2015 and 2016 (Figure 4c,d). The timing difference among tree sizes was big in 2016 with late initiation and cessation. Growth initiation was 44 days later for small trees than for big trees, rather than the 15 days later in 2015 with early initiation and cessation (Figure 4c,d).
The cumulative stem diameter growth in the growing season increased as tree size increased, i.e., the mean cumulative stem diameter growth of the big trees was the highest with the values of 1000.0 μm in 2015 and 733.3 μm in 2016, which was almost two times of that for the medium trees (with values of 333.3 and 366.7 μm, respectively). The smallest cumulative stem diameter growth was that of the small trees, with the values of 75.0 μm in 2015 and 125.0 μm in 2016 (Table 3).
In the plot, the mean cumulative stem diameter increments of ten Qinghai spruce trees were 400 and 380 μm, respectively, which was close to that of the medium trees, and this result indicated the mean stem diameter growth of ten Qinghai spruce trees could describe stem growth for the whole forest due to the abundant medium trees in the plot (Table 1).

3.3. Monthly Mean Rate of Stem Diameter Growth and Its Variation among Tree Sizes

During the growing seasons in 2015 and 2016 (May–September), the mean rate of stem growth of ten Qinghai spruce trees was 2.61 ± 1.49 and 2.46 ± 2.03 μm·day−1, respectively. The rate of stem growth showed a “unimodal” change with the seasonal changes, i.e., it initially increased quickly and then decreased (Table 4). In 2015, the rate of stem growth quickly increased from 1.94 ± 2.26 μm·day1 in May to 5.16 ± 7.75 μm·day1 in July, and they had a slow growth rate in August and September, with values of 1.29 ± 4.29 and 2.33 ± 3.53 μm·day1, respectively. However, in 2016, the maximum rate of stem growth appeared in August, and its value was 4.84 ± 5.54 μm·day1.
There were obviously different rates of stem growth among tree sizes (Table 4). The rate of stem growth of the big trees was higher than that of the medium and small trees, particularly in the rapid growth stage. In 2015, stem diameter of the big trees grew at a faster rate and growth rate reached as high as 12.37 ± 3.42 μm·day−1 in July, which was 2.95 times higher than that of the medium trees, and was 10.22 times higher than that of the small trees. In 2016, the maximum growth rate of the big trees appeared in August, with the value of 10.75 ± 6.72 μm·day−1, but for the medium and small trees this appeared in July, with the values of 5.38 ± 2.28 and 1.61 ± 0.00 μm·day−1, respectively.

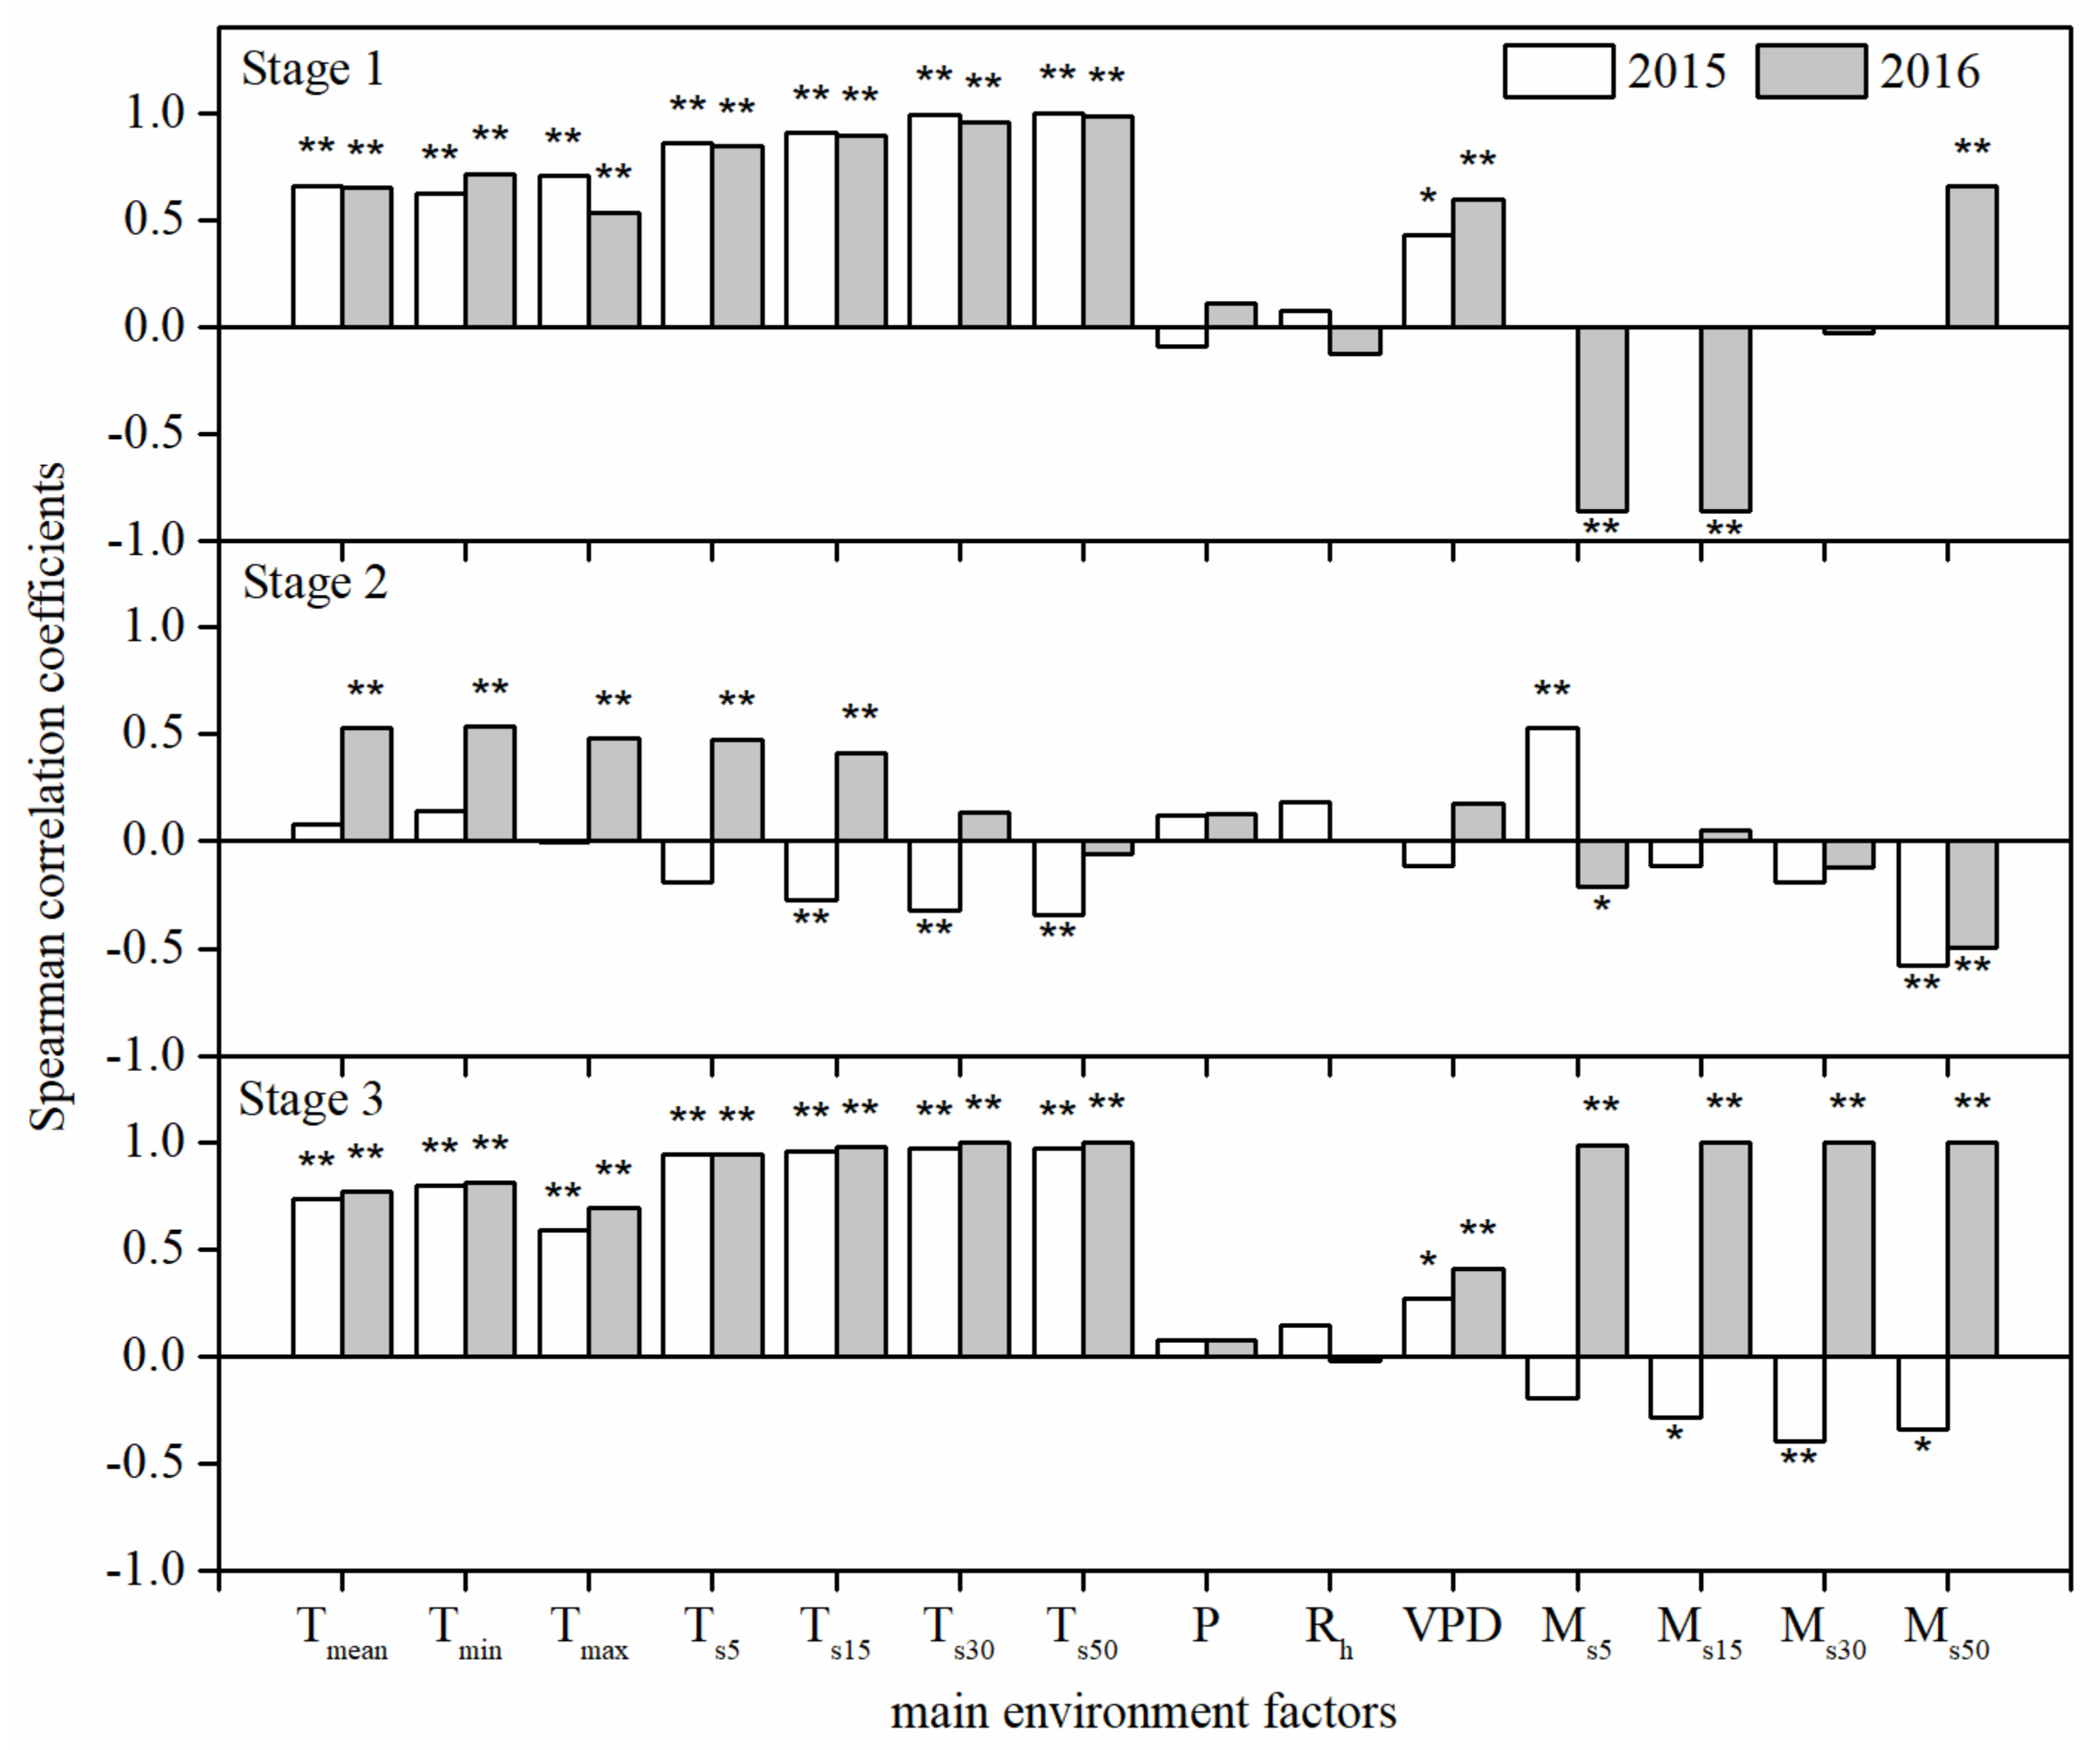
3.4. Effects of Environmental Factors on the Daily Mean Rate of Stem Diameter Growth

In the beginning and ending stages (i.e., stages 1 and 3), the daily mean rate of stem diameter growth for the whole forest (Gr) was significantly positively correlated with air temperature (Tmean, Tmax, and Tmin) and soil temperature (Ts5, Ts15, Ts30, and Ts50) with a Spearman correlation coefficient of more than 0.5, and also with vapor pressure deficit (VPD) but with a smaller Spearman correlation coefficient than that for air and soil temperature in 2015 and 2016. There was, however, a contradiction on soil moisture for stage 3, the Gr was negatively correlated with soil moisture in 2015 while it was significantly positively correlated with soil moisture in 2016 (Figure 5).
For the rapid growth stage (stage 2), the situation with the relationship between the Gr and environmental factors was very complicated (Figure 5). Firstly, in 2015, the Gr was positively correlated with air temperature (Tmean, Tmax, and Tmin), but it was negatively correlated with the soil temperature (Ts5, Ts15, Ts30, and Ts50) with Spearman correlation coefficients of less than 0.3. However, in 2016, the Gr was positively correlated with air temperature and soil temperature (Ts5, Ts15, and Ts30) with Spearman correlation coefficients of about 0.5. The Gr was positively correlated with air humidity such as daily precipitation (P), relative humidity (Rh), and VPD but with Spearman correlation coefficients of less than 0.2, which is lower than that of significance level. Similarly, the Gr was only significantly positively correlated with soil moisture at the top soil layer (0- to 10-cm) in 2015 but negatively correlated with that in 2016. In particular, the Gr was significantly negatively correlated with soil moisture at the deep soil layer (40- to 60-cm).

4. Discussion

4.1. Impact of Environmental Factors on Seasonal Diameter Growth

4.1.1. Temperature Controls Growth Initiation

Stem growth can be considered to begin when cambial cells start to enlarge and divide, and it ends when cambial cell division terminates [21]. The onset of cambial activity and cell production is controlled by temperature in cold environments, such as boreal and montane forests [24,25,26,27,28]. Cambial activity is generally initiated when the mean daily air temperature reaches a certain threshold [26,29,30]. However, some researchers have reported that the onset of stem growth is not sensitive to air temperature; rather, it is mainly influenced by soil temperature [9,31,32], since soil temperature strongly affects root activity and water uptake [33], and warmer soil facilitates root water uptake when growth begins [9].
For Qinghai spruce trees, Tian et al. [9] reported that tree growth began on approximately 11 May when the soil temperatures at the 40-cm depth began to increase steadily to above 0 °C, while Wang et al. [10] found that tree growth began on approximately 30 May when the daily mean air temperatures were sustained above 5 °C. In this study, growth initiation of the Qinghai spruce trees occurred on approximately 25 May 2015 and 20 June 2016 (Table 3), when the air temperature remained at approximately 10 °C, and the soil temperature was more than 3 °C. Before mid-May, soil water below the 40- to 60-cm depth was still frozen in the Qinghai spruce plot [34]. When soil is frozen, roots are limited in absorbing soil moisture, which may result in later growth initiation than the dates reported by many researchers [9,10]. Therefore, in this study, the growth initiation thresholds were found to be an air temperature of 10 °C and a soil temperature of 3 °C. This result was indirectly proven by the fact that growth initiation of Qinghai spruce trees occurred approximately 20 days earlier in 2015 than in 2016. Air temperature and soil temperature reached their thresholds on 25 May 2015, on which the average air temperatures and soil temperature were 14.5 °C and 2.98 °C, respectively. However, during May 2016, these factors were at a low level, i.e., average air temperature of 7.15 ± 4.44 °C and average soil temperature of −0.14–2 °C. In mid-June 2016, the air and soil temperatures reached their thresholds for tree growth and initiated tree growth.

4.1.2. Soil Moisture Controls Growth Cessation

The cessation of growth could be defined as the moment when all xylem cells had completed their differentiation and undergone apoptosis [16]. Therefore, the growth cessation of trees was not sensitive to air or soil temperature [27], but it was controlled by summer water deficits [35,36] and an earlier cell differentiation [16]. In this study, we also found that soil moisture controlled growth cessation of the Qinghai spruce trees.
In 2015, growth cessation of the Qinghai spruce trees occurred on approximately 21 August 2015. From 21 to 31 August 2015, air and soil temperatures were still suitable for tree growth, with values of 14.55 °C and 8.12 °C, respectively. However, soil moisture was very low, with a mean of 0.174 m3·m−3, due to insufficient recharge from rainfall. This low soil moisture resulted in the cessation of stem growth. In 2016, the growth cession of the Qinghai spruce trees was on approximately 14 September, which was 24 days later than that of 2015. In the period from 21 August to 14 September 2016, there was adequate air temperature, soil temperature, and moisture for tree growth, and the trees continued to grow. In the middle of September, the soil temperature and moisture declined to lower levels, with values of 7.6 °C and 0.184 m3·m−3, respectively, and the Qinghai spruce trees stopped growing.

4.1.3. Both Soil Moisture and Soil Temperature Control the Maximum Growth Rate

The maximum daily growth rate of conifers in cold environments, such as genera Picea, Pinus, Abies and Larix, was found to peak around the time of maximum day length rather than during the warmest period of the year [21]. However, Platycladus orientalis (Linn.) Franco in semiarid areas of North China was found to peak in late July or early August under conditions of optimal soil water content [37]. In this study, the maximum growth rate of the Qinghai spruce trees occurred in late June in 2015, which was consistent with the time of summer solstice (22 June). However, in 2016, the maximum growth rate occurred in late July, which was approximately one month after the maximum day length (21 June) (Table 3). Although the date of the maximum daily growth rate was very different, it took 34 and 32 days from the growth initiation to reach daily maximum growth rate in 2015 and 2016, respectively. This showed there was probably a certain determinism in growth, i.e., the period was around 30 days from the initiation to daily maximum growth rate. It is necessary to verify this in the future by data from long-term monitoring.
Comparing the environmental conditions on the peak days of 2015 and 2016, we found that the timing of the maximum growth rate was mainly related to soil temperature and moisture. These two variables were relatively low at the time of the summer solstice of 2016, i.e., the average soil temperature was 5.84 °C, which reached its maximum of the growing season of 2016 (10.72 °C on 9 August 2016), and the soil moisture was 0.15 m3·m−3, which was only half of the maximum value of the growing season of 2016 (0.30 m3·m−3 on 14 July 2016) and closed to wilting point (20% of field capacity). Therefore, the timing of the maximum growth rate may be synchronized with not only the maximum day length but also the optimal soil water and temperature in the Qinghai spruce plots of arid environments.

4.2. Seasonal Pattern of Stem Diameter Growth among Tree Sizes

In related studies, tree growth initiation and cessation were different between measured trees, and the growth rate of stems with big diameters was relatively higher than that of those with small diameters. Big trees also had a longer growing season duration than small trees [9,23], which was probably related to the social position of the tree, competition, tree roots, and light conditions [23,38].
In this study, with the same growth environment in a year, there was the same growth pattern of stem diameter growth of ten Qinghai spruce trees in 2015 and 2016 (May–October). However, the value of parameters defining the seasonal growth pattern varied greatly among tree sizes (Figure 4), i.e., the timing of growth initiation of the big trees was earlier, the timing of growth cession was later, and they had a higher growth rate than that of the medium and small trees (Table 3 and Table 4). The average height of the big trees was high in the stand (Table 2), and they occupied a favorable social position in the forest and generally obtained more resources, especially light and soil moisture [11,39]. On the other hand, tree height and canopy width of the medium and small trees was lower in the stand (Table 2). The medium and small trees were located next to larger trees and their crowns were partly covered and obtained less light, and this may have induced a shorter growing season duration and a lower growth rate.
Additionally, stem diameter growth of the small trees began later and ended earlier than that of the big trees. The timing difference among tree sizes was large in 2016 with late initiation and cessation; growth initiation for small trees was 44 days later than that for big trees rather than the 15 days later in 2015, with early initiation and cessation (Figure 4c,d). This might indicate that the small trees were more sensitive to adversity (such as the low temperature or drought stress), and the adverse niche occupied by the small trees may have increased their sensitivity to adversity. Therefore, in natural forests, the difference in tree growth between measured trees is critical for forest management and we will further discuss this and its relationship with tree characteristics such as height, social position, and competition, in future studies.

4.3. Impact of Environmental Factors on Daily Mean Rate of Stem Diameter Growth

The daily stem diameter growth of Qinghai spruce trees was related to both climatic and edaphic factors [9,10]. In arid areas, stem growth is mainly limited by moisture availability [37,40]. In this study, we found that the daily rate of stem diameter growth of Qinghai spruce trees was controlled by soil temperature and moisture. This result was coincident with previous research on Picea meyeri Rehd. et Wils. at the tree line of Luya Mountain, China [41].
In this study, the Qinghai spruce trees had a clear seasonal pattern, which could be divided into the beginning (stage 1), rapid growth (stage 2), and ending (stage 3) stages (Figure 2). During stage 1, the onset of stem growth was influenced by temperature and precipitation [42]. We found that the daily rate of daily stem diameter growth was significantly positively correlated with air temperature (Tmean, Tmax, and Tmin), soil temperature (Ts5, Ts15, Ts30, and Ts50) and VPD, but it was negatively correlated with soil moisture (Figure 5). Air and soil temperature were the main influencing factors affecting the daily rate of stem growth. During stage 1, the soil temperature of the 40- to 60-cm layer was below 0 °C, thus restricting root activity and water uptake [9], and it also limited cambial activity and cell production [26,29,30].
During stage 2, air temperature reached its maximum (Figure 3), and this increase in temperature may have increased evaporation and lead to water stress [43], thus affecting tree growth. In this study, the daily rate of stem diameter growth was negatively correlated with VPD and soil temperature in 2015 (Figure 5). This result further confirmed that high temperature and VPD promoted transpiration, which led to water stress and resulted in stem contraction [9,44]. However, the daily rate of stem diameter growth was positively correlated with soil temperature in 2016 (Figure 5). This indicated that the moisture condition was so much better that it was no longer the limiting factor for growth in this period. This favorable moisture condition was due to more rainfall in August 2016 (109.3 mm, 32.8% of total precipitation in the growing season of 2016) and there was also obviously lower VPD than that in August 2015. As a result, stem diameter growth was only related to soil temperature, not soil moisture and VPD in 2016. Nevertheless, stem diameter growth was still controlled by temperature and soil moisture in stage 2. This was a little different from the mechanism of stem growth of Platycladus orientalis (Linn.) Franco, which is mainly limited by moisture availability in semi-arid area of north China [37].
During stage 3, the daily rate of stem diameter growth was restricted by low air temperature, water deficits [35,36,44], and an earlier cell differentiation [16]. In this study, the daily rate of stem diameter growth was positively correlated with air temperature (Tmean, Tmin, and Tmax), soil temperature (Ts5, Ts15, Ts30, and Ts50), precipitation (P), and vapor pressure deficit (VPD) in 2015 and 2016, but it was significantly negatively or positively correlated with soil moisture in 2015 and 2016 (Figure 5). In fact, higher soil moisture in 2015 did not lead to a faster stem growth in 2015 than in 2016. This was partly because the daily rate of stem diameter growth was very low, at less than 2 μm·day−1 during this period, and low air temperature also played a role in stem diameter growth in 2015. The fact that the daily rate of stem diameter growth was controlled by both soil moisture and temperature was fully shown in 2016, when the stem diameter growth was significantly positively correlated with soil moisture and temperature, due to the low soil moisture and temperature. This result was coincident with previous research on Juniperus przewalskill Kom. in the Qilian Mountains, China [45].
In this study, the temporal variation in climatic conditions, soil temperature, and soil moisture were different in the growing seasons of 2015 and 2016 (Figure 3), and these factors made an obvious difference in stem growth of Qinghai spruce in 2015 and 2016 (Figure 4). This resulted in the complexity and difficulty of building the model. Therefore, it is necessary to follow the stem diameter growth of Qinghai spruce with more years of observations and more sample trees with different diameters in future studies, to provide a better understanding of the process of stem diameter growth and the corresponding controlling mechanisms and to build an integrated model for daily stem diameter growth.

4.4. Implications for Forest Management

In the future, global temperatures are likely to continue to increase and this will be accompanied by the expansion of drylands [46]. This trend may further impact the growth of dryland forests. Qinghai spruce is an important tree species for soil and water conservation in the Qilian Mountains. Based on the relationship between stem growth and environmental factors, temperature and drought affected the initiation, cessation and rate of stem growth, i.e., the initiation of stem growth began earlier as temperature increased and the cessation of stem growth ended earlier as the intensity of soil drought increased. Wang et al. [6] also found that tree growth of Qinghai spruce significantly decreased in the rapid warming period, and it was affected by drought in the Qilian Mountains. Therefore, to maintain tree growth, it is necessary to relieve drought stress by thinning forests to maintain stand density appropriately in arid regions.

5. Conclusions

In our study area, Qinghai spruce trees began to grow in May–June and stopped in August–September. According to the daily rate of stem growth of 2 μm·day−1, the seasonal variation pattern of cumulative stem diameter growth could be divided into three growth stages, i.e., the beginning, rapid growth, and ending stages. For the period studied, air temperature, soil temperature, and moisture affected the initiation and cessation of stem diameter growth. The maximum growth rate was related not only to the maximum day length but also to the optimal soil water content and soil temperature. Daily stem diameter growth was closely related to both climatic and soil factors in the beginning, rapid growth, and ending stages. Temperature, soil moisture, and VPD were the main factors controlling daily stem diameter growth.

Author Contributions

Conceptualization, Y.W. (Yanfang Wan), P.Y., X.L. (Xiaoqing Li), and Y.W. (Yanhui Wang); instrument installation, L.Z., X.L. (Xiande Liu), and S.W.; investigation, Y.W. (Yanfang Wan), X.L. (Xiaoqing Li), L.Z., X.L. (Xiande Liu), and S.W.; formal analysis, Y.W. (Yanfang Wan) and X.L. (Xiaoqing Li); writing—original draft preparation, Y.W. (Yanfang Wan); writing—review and editing, Y.W. (Yanfang Wan), P.Y., Y.W. (Yanhui Wang), B.W., and Y.Y. All authors have read and agreed to the published version of the manuscript.

Funding

This work was financially supported by the National Natural Science Foundation of China (NSFC 41671025, 91425301, 91225302).

Acknowledgments

We thank Ming Jin, Wenmao Jing, Weijun Zhao, Jian Ma, and other staff of the Academy of Water Resource Conservation Forests of Qilian Mountains in Gansu Province for their assistance in the field work.

Conflicts of Interest

The authors declare no conflict of interest.

References

  1. IPCC. Climate Change 2014: Mitigation of Climate Change. Contribution of Working Group III to the Fifth Assessment Report of the Intergovernmental Panel on Climate Change; Edenhofer, O., Pichs-Madruga, R., Sokona, Y., Farahani, E., Kadner, S., Seyboth, K., Adler, A., Baum, I., Brunner, S., Eickemeier, P., et al., Eds.; Cambridge University Press: Cambridge, UK, 2014. [Google Scholar]
  2. Sheffield, J.; Andreadis, K.M.; Wood, E.F.; Lettenmaier, D.P. Global and continental drought in the second half of the twentieth century: Severity-area-duration analysis and temporal variability of large-scale events. J. Clim. 2009, 22, 1962–1981. [Google Scholar] [CrossRef]
  3. Li, J.B.; Cook, E.R.; D’arrigo, R.; Chen, F.H.; Gou, X.H. Moisture variability across China and Mongolia: 1951–2005. Clim. Dyn. 2009, 32, 1173–1186. [Google Scholar] [CrossRef]
  4. Piao, S.L.; Ciais, P.; Huang, Y.; Shen, Z.H.; Peng, S.S.; Li, J.S.; Zhou, L.P.; Liu, H.Y.; Ma, Y.C.; Ding, Y.H.; et al. The impacts of climate change on water resources and agriculture in China. Nature 2010, 467, 43–51. [Google Scholar] [CrossRef] [PubMed]
  5. Andreu, L.; Gutierrez, E.; Macias, M.; Ribas, M.; Bosch, O.; Camarero, J.J. Climate increases regional tree-growth variability in Iberian pine forests. Glob. Chang. Biol. 2007, 13, 804–815. [Google Scholar] [CrossRef]
  6. Wang, B.; Yu, P.T.; Zhang, L.; Wang, Y.H.; Yu, P.T.; Wang, S.L. Differential trends of Qinghai spruce growth with elevation in Northwestern China during the recent warming hiatus. Forests 2019, 10, 712–726. [Google Scholar] [CrossRef] [Green Version]
  7. Zhang, L.; Shi, H.; Yu, P.T.; Wang, Y.H.; Pan, S.F.; Wang, B.; Tian, H.Q. Divergent growth responses to warming between stand-grown and open-grown trees in a dryland montane forest in northwestern China. Forests 2019, 10, 1133–1149. [Google Scholar] [CrossRef] [Green Version]
  8. Deslauriers, A.; Anfodillo, T.; Rossi, S.; Carraro, V. Using simple causal modeling to understand how water and temperature affect daily stem radial variation in trees. Tree Physiol. 2007, 27, 1125–1136. [Google Scholar] [CrossRef] [Green Version]
  9. Tian, Q.; He, Z.; Xiao, S.; Peng, X.; Ding, A.; Lin, P. Response of stem radial growth of Qinghai spruce (Picea crassifolia) to environmental factors in the Qilian Mountains of China. Dendrochronologia 2017, 44, 76–83. [Google Scholar] [CrossRef]
  10. Wang, B.; Chen, T.; Xu, G.; Liu, X.; Wang, W.; Wu, G.; Zhang, Y. Alpine timberline population dynamics under climate change: A comparison between Qilian juniper and Qinghai spruce tree species in the middle Qilian Mountains of northeast Tibetan Plateau. Boreas 2016, 45, 411–422. [Google Scholar] [CrossRef]
  11. Wan, Y.F.; Yu, P.T.; Liu, X.D.; Wang, S.L.; Wang, Y.H.; Xiong, W. Variation in sap flow density among levels of tree dominance in Picea crassifolia in the Qilian Mountains. Acta Ecol. Sin. 2017, 37, 3106–3114. [Google Scholar] [CrossRef] [Green Version]
  12. Zhao, Y.H.; Liu, X.D.; Li, G.; Wang, S.L.; Zhao, W.J.; Ma, J. Phenology of five shrub communities along an elevation gradient in the Qilian Mountains, China. Forests 2018, 9, 58. [Google Scholar] [CrossRef] [Green Version]
  13. Zhang, L.; Yu, P.T.; Wang, Y.H.; Wang, S.L.; Liu, X.D. Biomass change of middle aged forest of Qinghai spruce along an altitudinal gradient on the north slope of Qilian Mountains. Sci. Silva. Sin. 2015, 51, 4–10. [Google Scholar] [CrossRef]
  14. Wang, B.; Yu, P.T.; Wang, S.L.; Wang, Y.H.; Liu, X.D.; Jin, M.; Zhang, X.L. Response of soil water storage to slope position of forestland in Qilian Mountains. Sci. Soil Water Conserv. 2016, 14, 101–108. [Google Scholar] [CrossRef]
  15. Wang, B. Study on eco-hydrological characteristics of typical shady slope Picea crassifolia forest in Qilian Mountains. Chin. Acad. For. 2017. [Google Scholar] [CrossRef] [Green Version]
  16. Duchesne, L.; Houle, D.; D’Orangeville, L. Influence of climate on seasonal patterns of stem increment of balsam fir in a boreal forest of Québec, Canada. Agric. Meteorol. 2012, 108–114. [Google Scholar] [CrossRef]
  17. Zeide, B. Analysis of growth equations. For. Sci. 1993, 39, 594–616. [Google Scholar] [CrossRef]
  18. Aznar, J.-C.; Richer-Laflèche, M.; Bégin, C.; Marion, J. Mining and smelting activities produce anomalies in tree-growth patterns (Murdochville, Québec). Water Air Soil Pollut. 2007, 186, 139–147. [Google Scholar] [CrossRef]
  19. Deslauriers, A.; Morin, H.; Urbinati, C. Daily weather re-sponse of balsam fir (Abies balsamea (L.) Mill.) stem radius increment from dendrometer analysis in the boreal forests of Qubec (Canada). Trees 2003, 17, 477–484. [Google Scholar] [CrossRef]
  20. Rossi, S.; Dealauriers, A.; Morin, H. Application of the Gompertz equation for the study of xylem cell development. Dendrochronologia 2003, 21, 33–39. [Google Scholar] [CrossRef]
  21. Rossi, S.; Deslauriers, A.; Anfodillo, T.; Morin, H.; Saracino, A.; Motta, R.; Borghetti, M. Conifers in cold environments synchronize maximum growth rate of tree-ring formation with day length. New Phytol. 2006, 170, 301–310. [Google Scholar] [CrossRef] [Green Version]
  22. Murray, F.W. On the computation of saturation vapor pressure. J. Appl. Meteorol. 1967, 6, 203–204. [Google Scholar] [CrossRef]
  23. Li, X.Q.; Liu, X.D.; Wang, L.; Yu, P.T.; Niu, Y.; Wang, S.L.; Wan, Y.F. Diameter structure and its effect on radial growth of Picea crassifolia forest in the Qilian Mountains. Arid Zone Res. 2017, 34, 1117–1123. [Google Scholar] [CrossRef]
  24. Deslauriers, A.; Morin, H. Intra-annual tracheid production in balsam fir stems and the effect of meteorological variables. Trees 2005, 19, 402–408. [Google Scholar] [CrossRef] [Green Version]
  25. Deslauriers, A.; Rossi, S.; Anfodillo, T.; Saracino, A. Cambial phenology, wood formation and temperature thresholds in two contrasting years at high altitude in southern Italy. Tree Physiol. 2008, 28, 863–871. [Google Scholar] [CrossRef] [PubMed] [Green Version]
  26. Lenz, A.; Hoch, G.; Körner, C. Early season temperature controls cambial activity and total tree ring width at the alpine treeline? Plant. Ecol. Divers. 2013, 6, 365–375. [Google Scholar] [CrossRef]
  27. Moser, L.; Fonti, P.; Buntgen, U.; Esper, J.; Luterbacher, J.; Franzen, J.; Frank, D. Timing and duration of European larch growing season along altitudinal gradients in the Swiss Alps. Tree Physiol. 2010, 30, 225–233. [Google Scholar] [CrossRef]
  28. Rossi, S.; Morin, H.; Deslauriers, A.; Plourde, P.Y. Predicting xylem phenology in black spruce under climate warming. Glob. Chang. Biol. 2011, 17, 614–625. [Google Scholar] [CrossRef]
  29. Rossi, S.; Deslauriers, A.; Anfodillo, T.; Carraro, V. Evidence of threshold temperatures for xylogenesis in conifers at high altitudes. Oecologia 2007, 152, 1–12. [Google Scholar] [CrossRef]
  30. Rossi, S.; Deslauriers, A.; Griçar, J.; Seo, J.W.; Rathgeber, C.B.K.; Anfodillo, T.; Morin, H.; Levanic, T.; Oven, P.; Jalkanen, R. Critical temperatures for xylogenesis in conifers of cold climates. Glob. Ecol. Biogeogr. 2008, 17, 696–707. [Google Scholar] [CrossRef]
  31. Tardif, J.; Flannigan, M.; Bergeron, Y. An analysis of the daily radial activity of 7 boreal tree species: Northwestern Quebec. Env. Monit. Assess. 2001, 67, 141–160. [Google Scholar] [CrossRef]
  32. Gruber, A.; Zimmermann, J.; Wieser, G.; Oberhuber, W. Effects of climate variables on intra-annual stem radial increment in Pinus cembra (L.) along the alpine treeline ecotone. Ann. Sci. 2009, 66, 1–11. [Google Scholar] [CrossRef] [PubMed] [Green Version]
  33. Körner, C. Alpine plant life: Functional plant ecology of high mountain ecosystems. SpringerBerl. Heidelb. 2003. [Google Scholar] [CrossRef]
  34. Ren, L.; Wang, S.L.; Yu, P.T.; Wang, Y.H.; Zhang, X.P.; Wang, B.; Liu, X.D.; Jin, M. Seasonal change and numerical simulation of the frozen soil under two types of vegetation in Qilian Mountains. For. Res. 2016, 29, 596–602. [Google Scholar] [CrossRef]
  35. Levanič, T.; Gričar, J.; Gagen, M.; Jalkanen, R.; Loader, N.J.; McCarroll, D.; Oven, P.; Robertson, I. The climate sensitivity of Norway spruce (Picea abies (L.) Karst) in the southeastern European Alps. Trees 2008, 23, 169–180. [Google Scholar] [CrossRef] [Green Version]
  36. Oberhuber, W.; Gruber, A.; Kofler, W.; Swidrak, I. Radial stem growth in response to microclimate and soil moisture in a drought-prone mixed coniferous forest at an inner Alpine site. Eur. J. Res. 2014, 133, 467–479. [Google Scholar] [CrossRef] [Green Version]
  37. Jiang, Y.; Wang, B.; Dong, M.; Huang, Y.; Wang, M.; Wang, B. Response of daily stem radial growth of Platycladus orientalis to environmental factors in a semi-arid area of north China. Trees 2015, 29, 87–96. [Google Scholar] [CrossRef]
  38. Ford, K.R.; Breckheimer, I.K.; Franklin, J.F.; Freund, J.A.; Kroiss, S.J.; Larson, A.J.; Theobald, E.J.; HilleRisLambers, J. Competition alters tree growth responses to climate at individual and stand scales. Can. J. Res. 2017, 47, 53–62. [Google Scholar] [CrossRef] [Green Version]
  39. Zhang, X.; Wang, Y.J.; Wang, Y.Q.; Zhang, S.H.; Zhao, X.L. Effects of social position and competition on tree transpiration of a natural mixed forest in Chongqing, China. Trees 2019, 33. [Google Scholar] [CrossRef]
  40. Liang, E.; Dawadi, B.; Pederson, N.; Eckstein, D. Is the growth of birch at the upper timberline in the Himalayas limited by moisture or by temperature? Ecology 2014, 95, 2453–2465. [Google Scholar] [CrossRef] [Green Version]
  41. Dong, M.Y.; Jiang, Y.; Yang, H.C.; Wang, M.C.; Zhang, W.T.; Guo, Y.Y. Dynamics of stem radial growth of Picea meyeri during the growing season at the treeline of Luya Mountain, China. Chin. J. Plant. Ecol. 2012, 236, 956–964. [Google Scholar] [CrossRef]
  42. Ren, P.; Rossi, S.; Camarero, J.J.; Ellison, A.M.; Liang, E.; Peñuelas, J. Critical temperature and precipitation thresholds for the onset of xylogenesis of Juniperus przewalskii in a semi-arid area of the north-eastern Tibetan Plateau. Ann. Bot. 2017. [Google Scholar] [CrossRef]
  43. Way, D.A.; Sage, R.F. Elevated growth temperatures reduce the carbon gain of black spruce (Picea mariana (Mill.) BSP). Glob. Chang. Biol. 2008, 14, 624–636. [Google Scholar] [CrossRef]
  44. Zweifel, R.; Zimmermann, L.; Zeugin, F.; Newbery, D.M. Intra-annual radial growth and water relations of trees: Implications towards a growth mechanism. J. Exp. Bot. 2006, 57, 1445–1459. [Google Scholar] [CrossRef] [PubMed] [Green Version]
  45. Zhang, J.Z. Cambial phenology and intra-annual radial growth dynamics of conifers over the Qilian Mountains. Lanzhou Univ. 2018. [Google Scholar] [CrossRef] [Green Version]
  46. Park, C.E.; Jeong, S.J.; Joshi, M.; Osborn, T.J.; Ho, C.H.; Piao, S.; Chen, D.; Liu, J.; Yang, H.; Park, H.; et al. Keeping global warming within 1.5 °C constrains emergence of aridification. Nat. Clim. Chang. 2018, 8, 70–74. [Google Scholar] [CrossRef] [Green Version]
Figure 1. The digital elevation model (DEM) of the Heihe River basin (b), its location in China (a), and the location of the research plot in the Pailugou watershed (c).
Forests 11 00494 g001
Figure 2. Observed and modeled changes in mean cumulative stem diameter growth (a) and associated mean growth rate (b) of ten Qinghai spruce trees during the whole study period of 2016 (May–October). Dashed lines in the bottom panels represent daily growth rates equal to 2 μm·day−1. The mean cumulative stem growth was divided into three stages: stage 1 with the beginning growth (day of year (DOY) 120–171), stage 2 with the rapid growth (DOY 172–258), and stage 3 with the ending growth (DOY 259–300).
Forests 11 00494 g002
Figure 3. The daily variation in weather parameters (precipitation (a,b), mean air temperature (c,d), relative humidity (g,h), and vapor pressure deficit (i,j)), and soil factors (mean soil temperature (e,f) and volumetric soil moisture (k,l)) of the 0- to 60-cm soil layers in the Pailugou watershed from May to October of 2015 and 2016. The vertical dashed lines delimit the three stages of mean stem diameter growth of ten Qinghai spruce trees.
Forests 11 00494 g003
Figure 4. Observed and modeled changes in the cumulative stem diameter growth (a,b) and associated growth rate (c,d) of Qinghai spruce trees during the growing seasons of 2015 and 2016 (May–October), respectively. Dashed lines in the bottom panels represent daily growth rates equal to 2 μm·day−1.
Forests 11 00494 g004
Figure 5. Spearman correlation coefficients of daily mean rate of stem diameter growth for the whole forest (Gr) and air temperature (mean, Tmean; minimum, Tmin; and maximum, Tmax), precipitation (P), relative humidity (Rh), vapor pressure deficit (VPD), volumetric soil moisture (Ms5, Ms15, Ms30, and Ms50), and soil temperature (Ts5, Ts15, Ts30, and Ts50) at the 0- to 10-cm, 10- to 20-cm, 20- to 40-cm, and 40- to 60-cm soil layers during stages 1, 2, and 3 of 2015 and 2016. The values marked ** and * indicate that they are significant at the 0.01 and 0.05 levels, respectively.
Forests 11 00494 g005
Table 1. Forest structure in the Qinghai spruce plot (mean value ± standard deviation).
Tree Size ClassesNumber of TreesAverage Diameter at Breast Height (DBH) (cm)Average Tree Height (m)Average Canopy Width (m)Average Canopy Thickness (m)Percent of Total Trees (%)
Big627.2 ± 4.912.9 ± 2.25.47 ± 0.669.62 ± 1.707.14
Medium3615.0 ± 1.711.2 ± 1.13.30 ± 0.516.03 ± 2.2342.86
Small229.8 ± 2.18.1 ± 1.82.82 ± 0.434.65 ± 1.5526.19
Seedling203.6 ± 0.72.5 ± 0.51.97 ± 0.431.26 ± 0.5223.81
Note: the area is 400 m2.
Table 2. The characteristics of ten sample trees in the Qinghai spruce plot.
Tree Size ClassesTree No.DBH (cm)Height (m)Canopy Width (m)Canopy Thickness (m)
Big131.9416.36.012.1
231.1614.24.911.0
328.8513.36.28.5
Medium416.6311.64.17.0
516.2413.13.28.1
615.0210.83.54.4
Small711.6810.33.15.2
810.878.23.55.0
97.086.41.95.3
104.392.82.21.1
Table 3. Characterization of the seasonal patterns of stem diameter growth for each year.
YearTree Size ClassesCumulative Stem Growth
(μm)
Timing of Growth Initiation
(DOY)
Timing of Growth Cessation
(DOY)
Growing Season Duration
(days)
Maximum Growth Rate
(μm·day−1)
Day of Maximum Growth
(DOY)
2015Mean400.0145233894.658179
Big1000.013425412112.824175
Medium333.3148224774.160178
Small75.0149158102.008153
2016Mean380.0172258875.327204
Big733.31552831298.967201
Medium366.7177258825.305208
Small125.0199226282.828212
Note: The timing of growth initiation and cessation was determined as the day of year (DOY) when the modeled daily growth rates (Figure 4c,d) passed the threshold of 2 μm·day−1.
Table 4. Monthly mean rate of stem diameter growth and its variation among tree sizes (mean value ± standard deviation (μm·day1)).
YearTree Size ClassesMayJuneJulyAugustSeptember
2015Mean1.94 ± 2.262.33 ± 4.985.16 ± 7.751.29 ± 4.292.33 ± 3.53
Big4.30 ± 1.867.78 ± 2.3612.37 ± 3.422.69 ± 1.145.56 ± 2.36
Medium1.29 ± 1.113.33 ± 1.244.19 ± 1.591.00 ± 0.691.11 ± 0.92
Small1.61 ± 0.411.08 ± 0.541.21 ± 1.14−1.21 ± 0.930.83 ± 0.00
2016Mean0.97 ± 1.560.67 ± 1.414.52 ± 5.524.84 ± 5.541.33 ± 2.33
Big3.23 ± 0.001.11 ± 0.237.53 ± 2.2810.75 ± 2.281.11 ± 0.92
Medium0.00 ± 0.001.11 ± 0.325.38 ± 2.283.23 ± 2.282.22 ± 1.85
Small0.00 ± 0.000.00 ± 0.001.61 ± 0.001.61 ± 0.860.83 ± 0.67
Note: Qinghai spruce trees stopped growth in October.

