Article

Evaluation and Tradeoff Analysis of Ecosystem Service for Typical Land-Use Patterns in the Karst Region of Southwest China

1
Key Laboratory of Agro-Ecological Processes in Subtropical Region, Institute of Subtropical Agriculture, Chinese Academy of Sciences, Changsha 410125, China
2
University of Chinese Academy of Sciences, Beijing 100049, China
3
Huanjiang Observation and Research Station for Karst Ecosystem, Chinese Academy of Sciences, Huanjiang 547100, China
4
Guangxi Key Laboratory of Plant Conservation and Restoration Ecology in Karst Terrain, Guangxi Institute of Botany, Guangxi Zhuang Autonomous Region and Chinese Academy of Sciences, Guilin 541006, China
5
College of Agricultural Sciences and Natural Resources, University of Nebraska-Lincoln, Lincoln, NE 68583, USA
*
Author to whom correspondence should be addressed.
Forests 2020, 11(4), 451; https://doi.org/10.3390/f11040451
Submission received: 21 February 2020 / Revised: 7 April 2020 / Accepted: 14 April 2020 / Published: 16 April 2020
(This article belongs to the Special Issue Analyses and Design of Fruit-Tree Based Agroforestry Systems)

Abstract

:
Although many land-use patterns have been established to restore vegetation and eliminate poverty in the karst area in southwest China, the ecosystem services (ESs) of these patterns are still not fully understood. To compare the differences in seven typical monoculture patterns and three agroforestry patterns, their ESs and tradeoffs were analyzed within the Millennium Ecosystem Assessment Framework. Compared with the local traditional corn pattern, the marigold pattern improved provisioning, regulating, and cultural services by >100%. The pomegranate pattern provided far more provisioning services than the other patterns. The apple + soybean intercropping pattern reduced regulating services, and eventually, its Total ESs (TES) and ecosystem multifunctionality index (EMF) also decreased. Cultural services will be enhanced by the introduction of fruit trees, as well as intercropping. Orange + peach had the greatest negative tradeoffs between provisioning and regulating services (P-R), provisioning and supporting services (P-S), and provisioning and cultural services (P-C), which indicates that the provisioning services urgently require improvement. Peach + pumpkin intercropping decreased the negative tradeoffs of P-R, P-S, and P-C (all > 10%), while pomegranate + grass intercropping increased the negative tradeoffs of R-S and R-C (all > 100%). Our results suggest that all six of these patterns are worthy of promotion but the pomegranate pattern should be given priority. Among the three intercropping patterns studied herein, the apple + soybean pattern should be redesigned to improve performance.

1. Introduction

Ecosystem services (ESs) are broadly defined as the benefits that humans receive from natural ecological processes [1,2], which are generally classified into provisioning, regulating, supporting, and cultural services [3]. Previous research on ESs focused on the human–natural environment coupling system and involved, e.g., global, national, provincial, municipal, county, and river basin spatial scales, as well as, e.g., forest, grassland, farmland, wetland, and marine ecosystem types [4,5,6,7]. Mapping ESs provides important basal information for improving human wellbeing and ensuring the sustainable supply of ESs through, e.g., informing policy decisions and can also provide quantitative information for the sustainable management of ecosystems [8,9,10]. During the last decade, most of the evaluations and cartographic research on ESs were carried out at large spatial scales, which, to some extent, restricted the application of evaluation results to small and medium scales [11,12,13]. Therefore, there is an urgent need to further develop assessment and mapping methods to facilitate research on ESs at small and medium scales, which would provide a scientific basis for the coordinated development of regional natural–social–economic complex systems.
The interrelationship between ecosystem structure and processes is the basis of ecosystem ecology. Developing a robust understanding of the tradeoff and synergistic relationships between ESs can help to inform sustainable management decisions according to the needs of the population [14,15,16,17]. A tradeoff refers to a situation in which the change in one ES induces the opposite change in another ES, which is also known as conflict or competition. Synergy refers to a situation in which both ESs increase or decrease simultaneously. There are different tradeoffs/synergies between different types of ES at different spatial and temporal scales [18]. Natural ecosystems with high biodiversity have relatively high levels of regulation services (in particular) and cultural services. However, with the increase in human utilization (such as land use change), the levels of ecosystem regulation services gradually decrease [19,20]. Many previous studies have indicated that a win–win situation in ecosystem service functions was not universal, while tradeoffs were common in natural–economic–social systems [21,22]. Thus, research into the tradeoffs/synergies in ESs will not only help to deepen our understanding of the interaction factors and underlying mechanisms of different service types but also encourage the rational use of natural resources.
Owing to the interference of human activities and the combination of subtropical humid and semi-humid climate conditions, southwest China is suffering from rocky desertification, involving damage to surface vegetation, soil erosion, and extensive exposure of bedrock [23,24]. In particular, population pressure and economic development are forcing farmers to expand their land into valleys, lowlands, and slopes, which leads to a cycle of low food production, soil erosion, and increased expansion [25]. Therefore, a large number of ecological reconstruction projects have been proposed and implemented with a leading purpose to control or restore karst degradation from the late 1990s, such as the Natural Forest Protection Project and Grain for Green Program (GGP), to mitigate the effects of degradation and rebuild ESs by increasing vegetation cover [26,27,28,29,30]. During this period, many professional ecological management patterns have also been developed to produce greater value in karst environments. These patterns involved the use of limited water and soil resources at minimum cost, such as the Huajiang, Zhenfeng, and Bijie patterns in Guizhou province, and the Huanjiang and Mashan patterns in Guangxi province [31,32,33,34]. In Yunnan province, the planting area of, e.g., apple and pear trees has increased rapidly, especially in the rocky desertification areas, because many traditional sloping lands have been transformed into agroforestry. However, the ESs in karst areas have not been studied as a whole.
In the present study, the tradeoffs of ESs for seven typical monoculture patterns and three agroforestry patterns were evaluated and analyzed based on field data. Our objectives were to (1) quantify the ESs of 10 land use patterns (seven monocultures and three agroforestry patterns), (2) quantify the tradeoffs between the ESs of each pattern, and (3) explore the underlying functional mechanisms of these tradeoffs. We propose recommendations for existing patterns and the improvement of the environmental and economic benefits of these patterns.

2. Materials and Methods
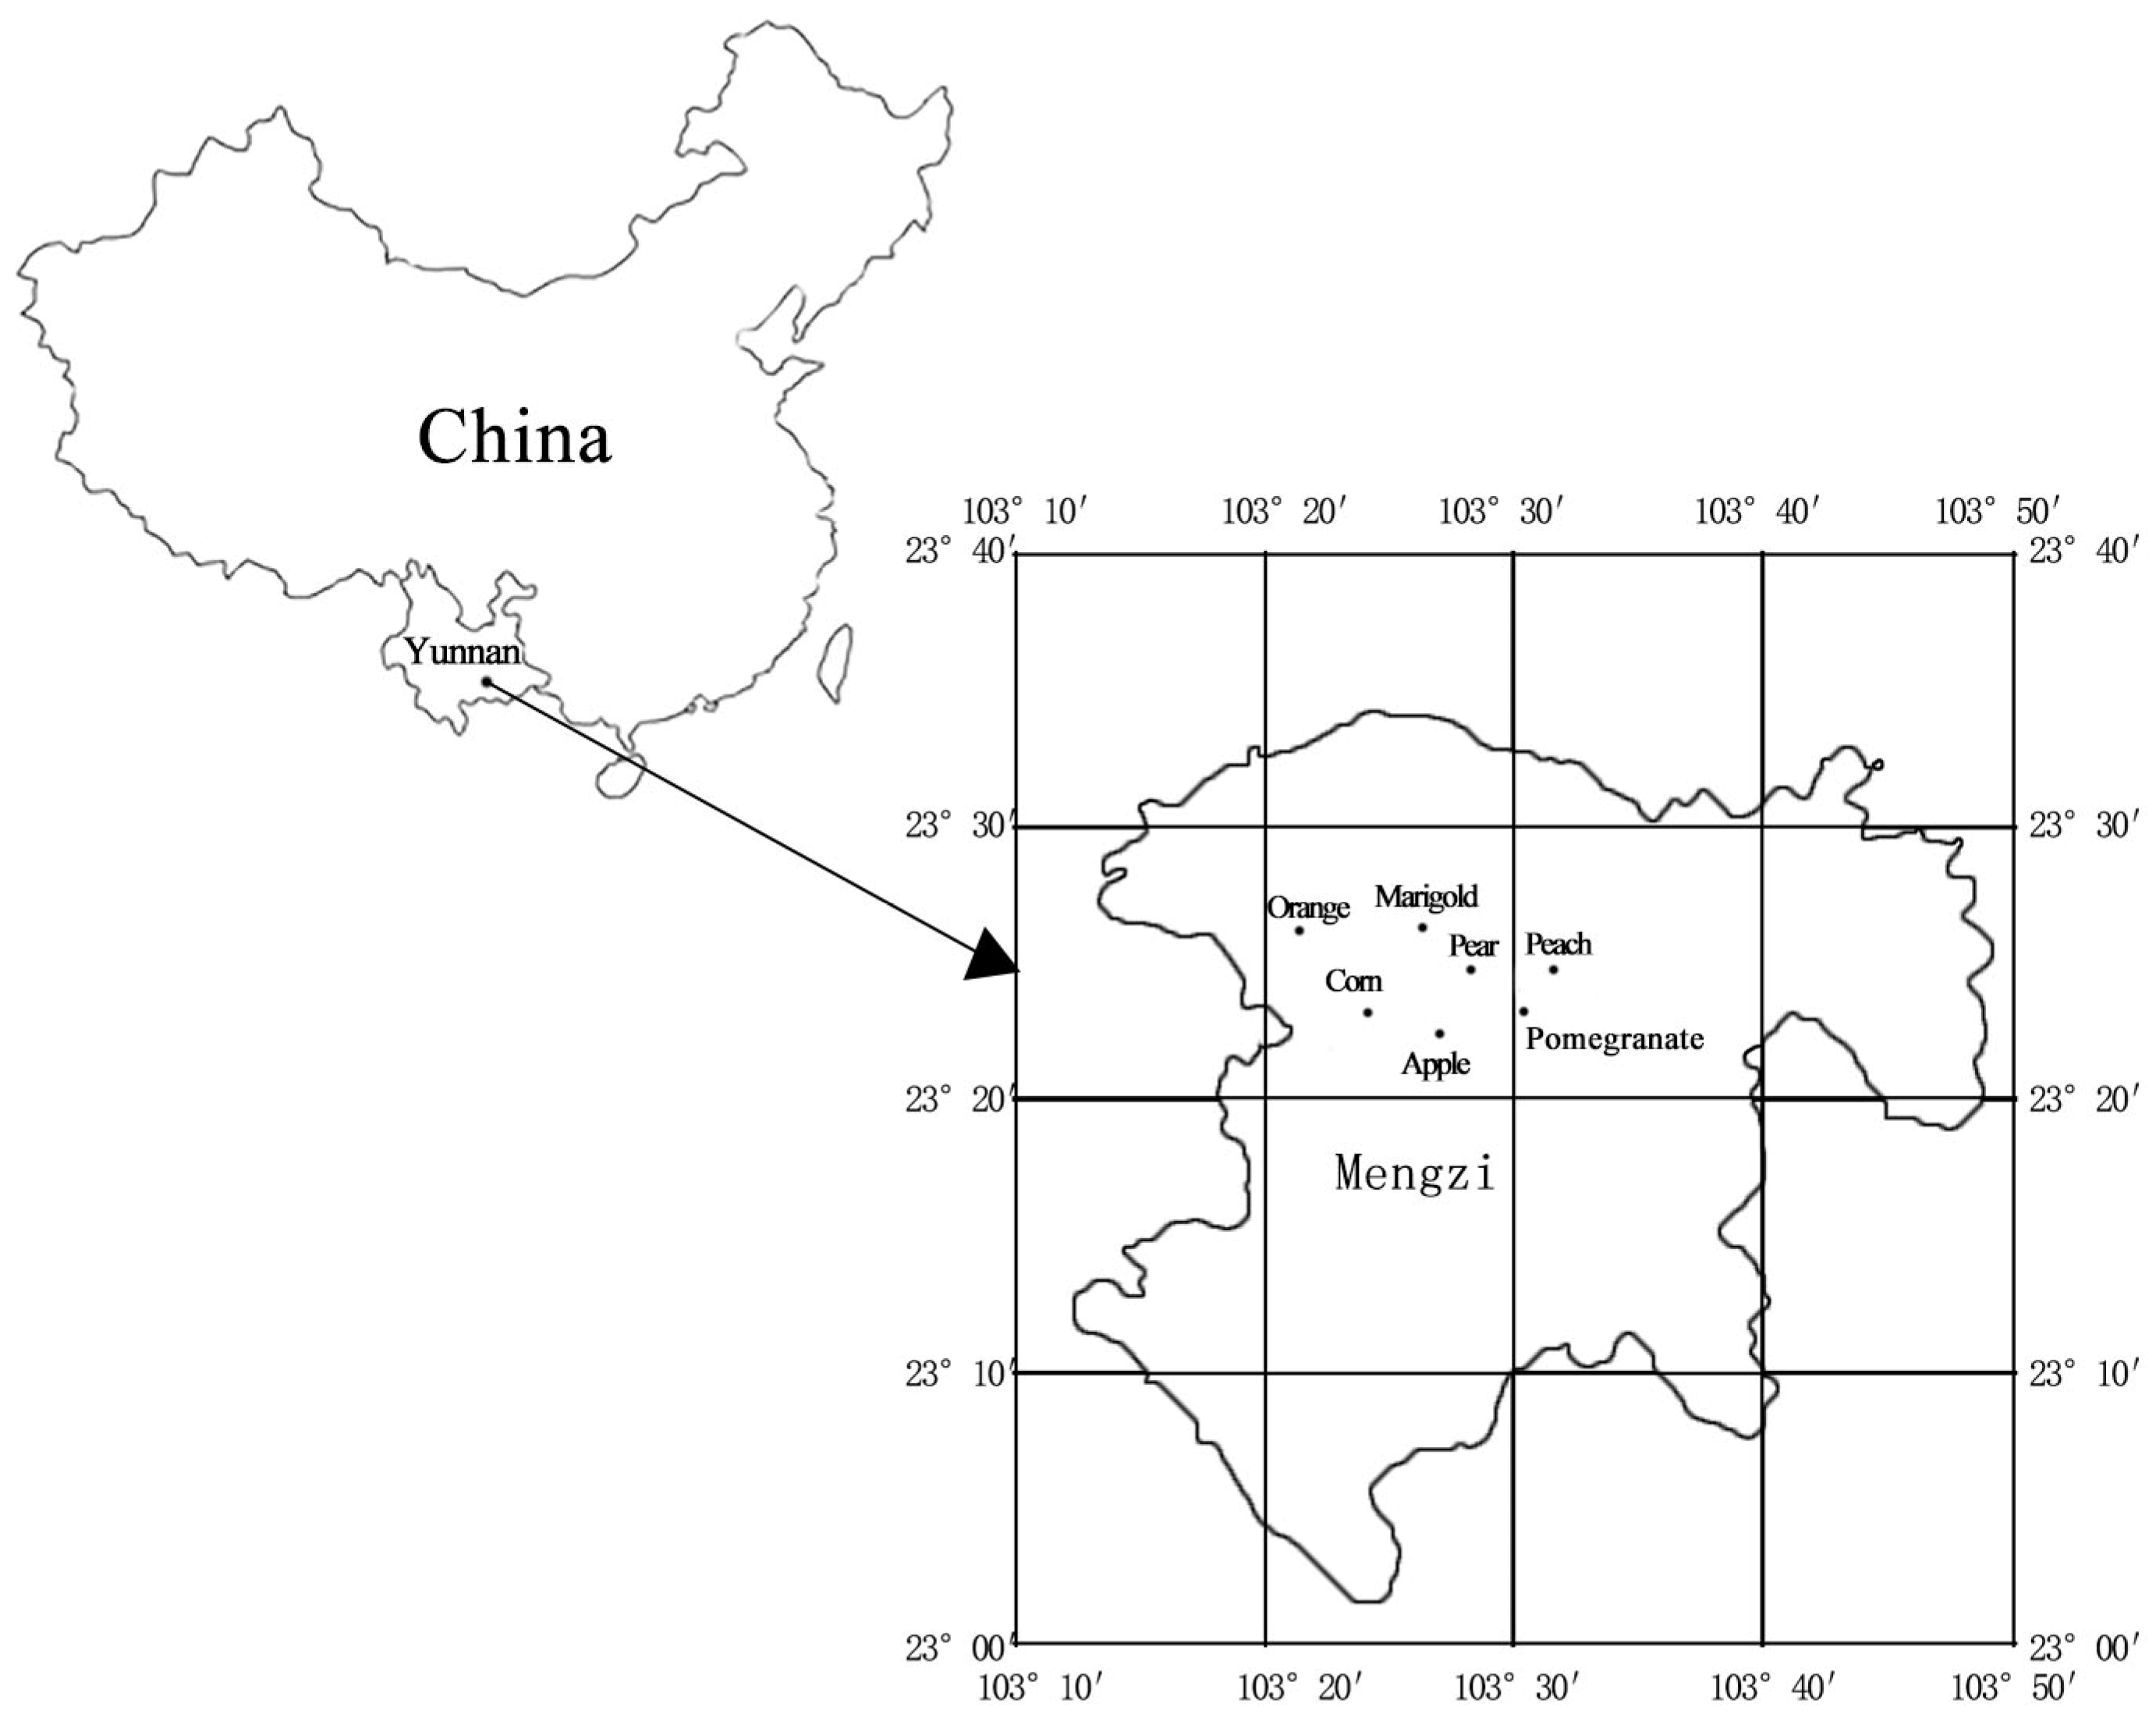
2.1. Research Area

The 10 land-use patterns, including seven monoculture patterns and three intercropping patterns, were located in Xibeile township, Mengzi City, Honghe Hani & Yi Autonomous Prefecture, Yunnan province, China (23°23′55″ N, 103°23′43″ E). The research area represents a typical karst area of faulted basins that has suffered from major rocky desertification. Xibeile township is located in mountains northeast of Mengzi at 1800–2400 m altitude. The climate is of a subtropical plateau monsoon climate, with an average annual temperature of 13.6 °C. The average annual sunshine hours are 1722 h. The average annual rainfall is 900–1000 mm.
Corn, which used to be an important economic food source for the local population, now has a plating area of about 800 ha. Over the past two decades, with the support of the government’s poverty alleviation policies, the apple industry has been developing continuously. The apple planting area reached 2200 ha, and the area of fruiting reached 700 ha, with the output value approaching 100 million yuan. At the same time, local farmers introduced soybeans to the monoculture apple pattern, forming the intercropping pattern of apple + soybean. Therefore, we selected the “Mountain Red” apple farm and its surrounding area in Xibeile township as the research area, and we selected 10 different land-use patterns (corn (Zea mays L.), marigold (Tagetes erecta L.), orange (Citrus reticulata Blanco.), pear (Pyrus spp.), peach (Amygdalus persica L.), peach + pumpkin (Cucurbita moschata.), apple (Malus pumila Mill.), apple + soybean (Glycine max Merr.), pomegranate (Punica granatum L.), and pomegranate + grass (Medicago sativa.)) according to our field survey data, government report data, and the statistical yearbook (Table 1; Figure 1 [35]). The local government provides training in the planting techniques for apples, pears, and pomegranates. Each farmer receives training in multiple aspects of the techniques, including accurate fertilization, field management, and simple disease prevention. The cultivation of marigold + orange is guided by the enterprise to conduct standardized daily management. Therefore, based on cooperation, communication and training, planting skills, and management, the skills of these farmers have been developed, and many farmers also understand online sales.
According to the evaluation framework for ESs provided by the Millennium Ecosystem Assessment and evaluation criteria for karst ecosystems services in China, we categorized the products into provisioning services; the reduction of topsoil loss, soil fertility maintenance, and photosynthetic carbon fixation as regulation services; photosynthetic oxygen release and nutrient retention as supporting services; and education as the cultural service (Table 2).

2.2. Soil Plant Sampling and Questionnaire Survey

In the selected study area, three 50 × 50 m quadrats were selected as replicates for each pattern, and five plants were sampled in an “S” shape in each quadrat. Each sample group included leaf, litter, and soil samples. Two 10 × 20 cm surfaces were randomly selected under the canopy projection to collect litter. The mixed soil samples of 0–50 cm were collected by randomly digging two soil profiles. The morphological parameters of each plant, including chest diameter and height, were measured to calculate biomass (Supplementary File 1).
The soil bulk density was measured by the ring knife method; the soil water content was determined by the drying method; total nitrogen and total phosphorus were digested with H2SO4 and measured by indophenol blue colorimetry and Mo-Sb colorimetry, respectively; total potassium was dissolved in acid for determination by ICP-OES Emission spectrometry (Agilent 720, Santa Clara, CA, USA); and the total organic carbon content was measured by K2Cr2O7 titration [36].
For the 10 land-use patterns, detailed production data in 2016 and 2017—including the inputs of pesticides, fertilizers, and labor, and the outputs of fruits/flowers—were collected through interviews with farmers. Then, the averages of those two years were used to calculate provisioning services. The fruit trees in our research sites were 5–6 years old, which means that they had reached a stable period, except for orange trees, which were 4 years old.

2.3. Data Analysis

Provisioning services were calculated using the market price method. The opportunity cost method and shadow price method were used to calculate the regulating services. The shadow price method was used to calculate supporting services. Replacement cost was used to calculate the value of education in cultural services (Table 2).
Then, the Ecosystem TradeOffs index (ETO) was calculated to classify and quantify the tradeoffs between these four ESs, using Equations (1) and (2) [37]:
ETO = l n R e l a t i v e   E S a R e l a t i v e   E S b
Relative   ES = E S i E S i m i n E S i m a x E S i m i n
where Relative ES is the value of one specific type of ES after standardization; ESi represents the actual total amount of ESs of type i in one quadrat, such as soil fertility maintenance; ESi-max is the maximum value of the actual total amount of type i ESs in all quadrats of all land-use patterns; and ESi-min is the minimum value under the same condition. Relative ESa is the standardized value of class a ESs such as provisioning services. The ETO ranges from negative infinity to positive infinity, where positive values mean that relative ESa dominates the tradeoffs, while a negative value means that relative ESb dominates. The absolute value of ETO represents the degree of the tradeoff level.
The calculation for the index of total ESs (TES) was modified based on Pan et al. [37]. The purpose of the modification was to equally weight all four categories of ES based on their contribution to TES. The modified index could eliminate the effect of differences in the number of types of service for each category (Formula (3)):
TES = i = 1 n R e l a t i v e   E S P n + j = 1 m R e l a t i v e   E S R m + j = 1 f R e l a t i v e   E S S f + j = 1 t R e l a t i v e   E S C t
where a larger TES indicates a higher level of total supplies of these four ESs; and n, m, f, and t are the total numbers of types of provisioning services, regulating services, supporting services, and culture services, respectively.
The ecosystem multifunctionality index (EMF) was also calculated for comparing with the TES using Equation (4):
EMF = i = 1 k R e l a t i v e   E S i k
where k is the total number of ES types.

3. Results

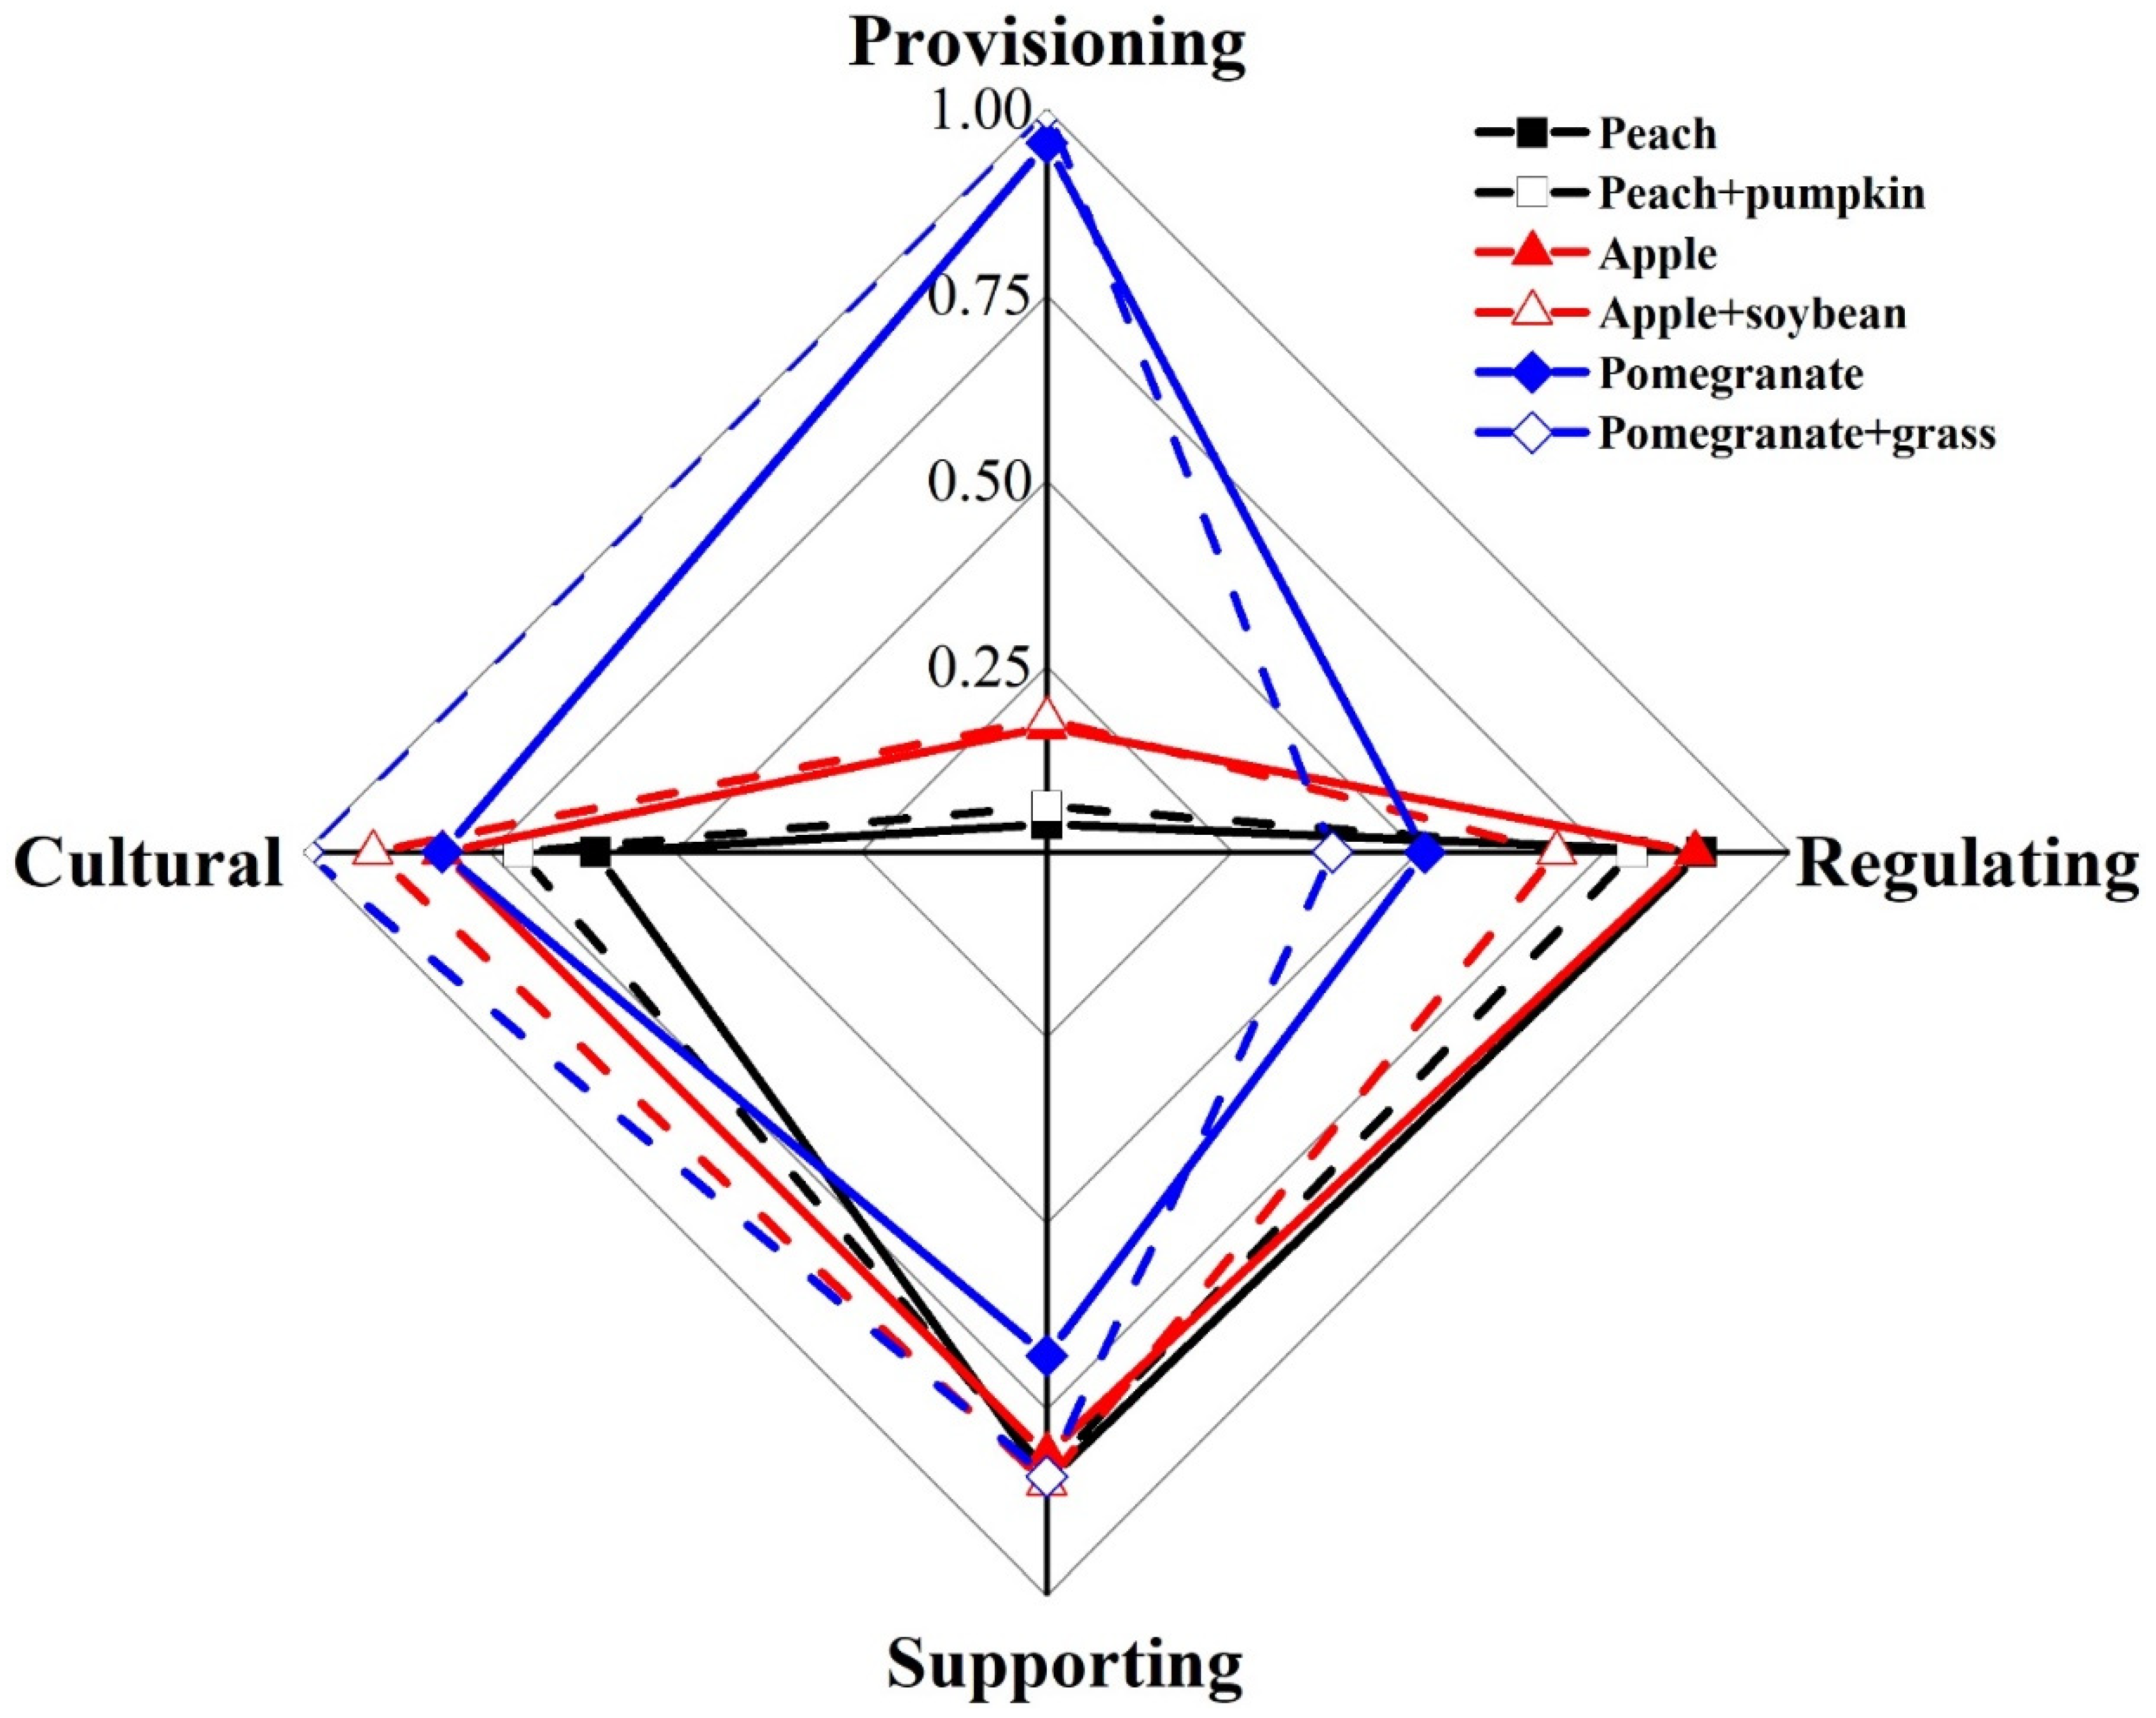
3.1. Ecosystem Services in Different Patterns

The seven patterns showed significant differences in the performance of ecosystem functions. The provisioning service of the seven monoculture patterns varied greatly. The pomegranate pattern (0.955) performed the best and provided 45.48 times as many provisioning services as the corn pattern (0.021), which had the worst performance. The marigold pattern provided 2.48 times more provisioning service than the corn pattern. Provisioning services in apple were 17.4% higher than those in pear. Regulating services were ranked from highest to lowest as follows: peach > apple > orange > pear > pomegranate > marigold > corn. Peach and apple, and orange and pear had similar performance gaps of <2%. The marigold pattern had the worst supporting services, which were 8.4% lower than those of the traditional corn pattern. The supporting services of the remaining patterns were ranked from highest to lowest as follows: peach > apple > pomegranate > pear > orange (Table 3).
When intercropping plants were added to the peach, apple, and pomegranate patterns, the ecosystem service performance of each pattern changed markedly. Adding soybean to the apple pattern increased the provisioning service slightly, as did adding the forage to the pomegranate pattern. However, adding pumpkin to the peach pattern increased the provisioning service by 63.2%. Compared with the monoculture pattern, the regulating services of the peach, apple, and pomegranate intercropping patterns decreased by 10.6%, 21.3%, and 24.2%, respectively. In terms of supporting services, introducing intercropping did not significantly change the performance of peach and apple. After planting undergrowth grass, the supporting services of pomegranate + grass exceeded that of pomegranate by 23.9%. After the intercropping plants were added, the culture services of the three intercropping patterns increased by 17.0%, 14.4%, and 22.9%, respectively (Figure 2).

3.2. TES and EMF in Different Patterns

Among the seven monoculture patterns, that of corn had the lowest TES and EMF. The pomegranate pattern had the highest TES but only the third highest EMF. The apple pattern’s TES was the second highest, but it had the highest EMF. The TES and EMF of the marigold pattern were 70% higher than those of the corn pattern. After introducing intercropping, the TES in pomegranate increased by 9.2%, but the TES in peach and apple did not change significantly. Meanwhile, the EMF of pomegranate increased by 9.9%, while the EMF of peach and apple did not change (Table 4). Therefore, the intercropping measures for the peach, apple, and pomegranate patterns can only obtain the result of compound demand by adding grass to the pomegranate pattern.

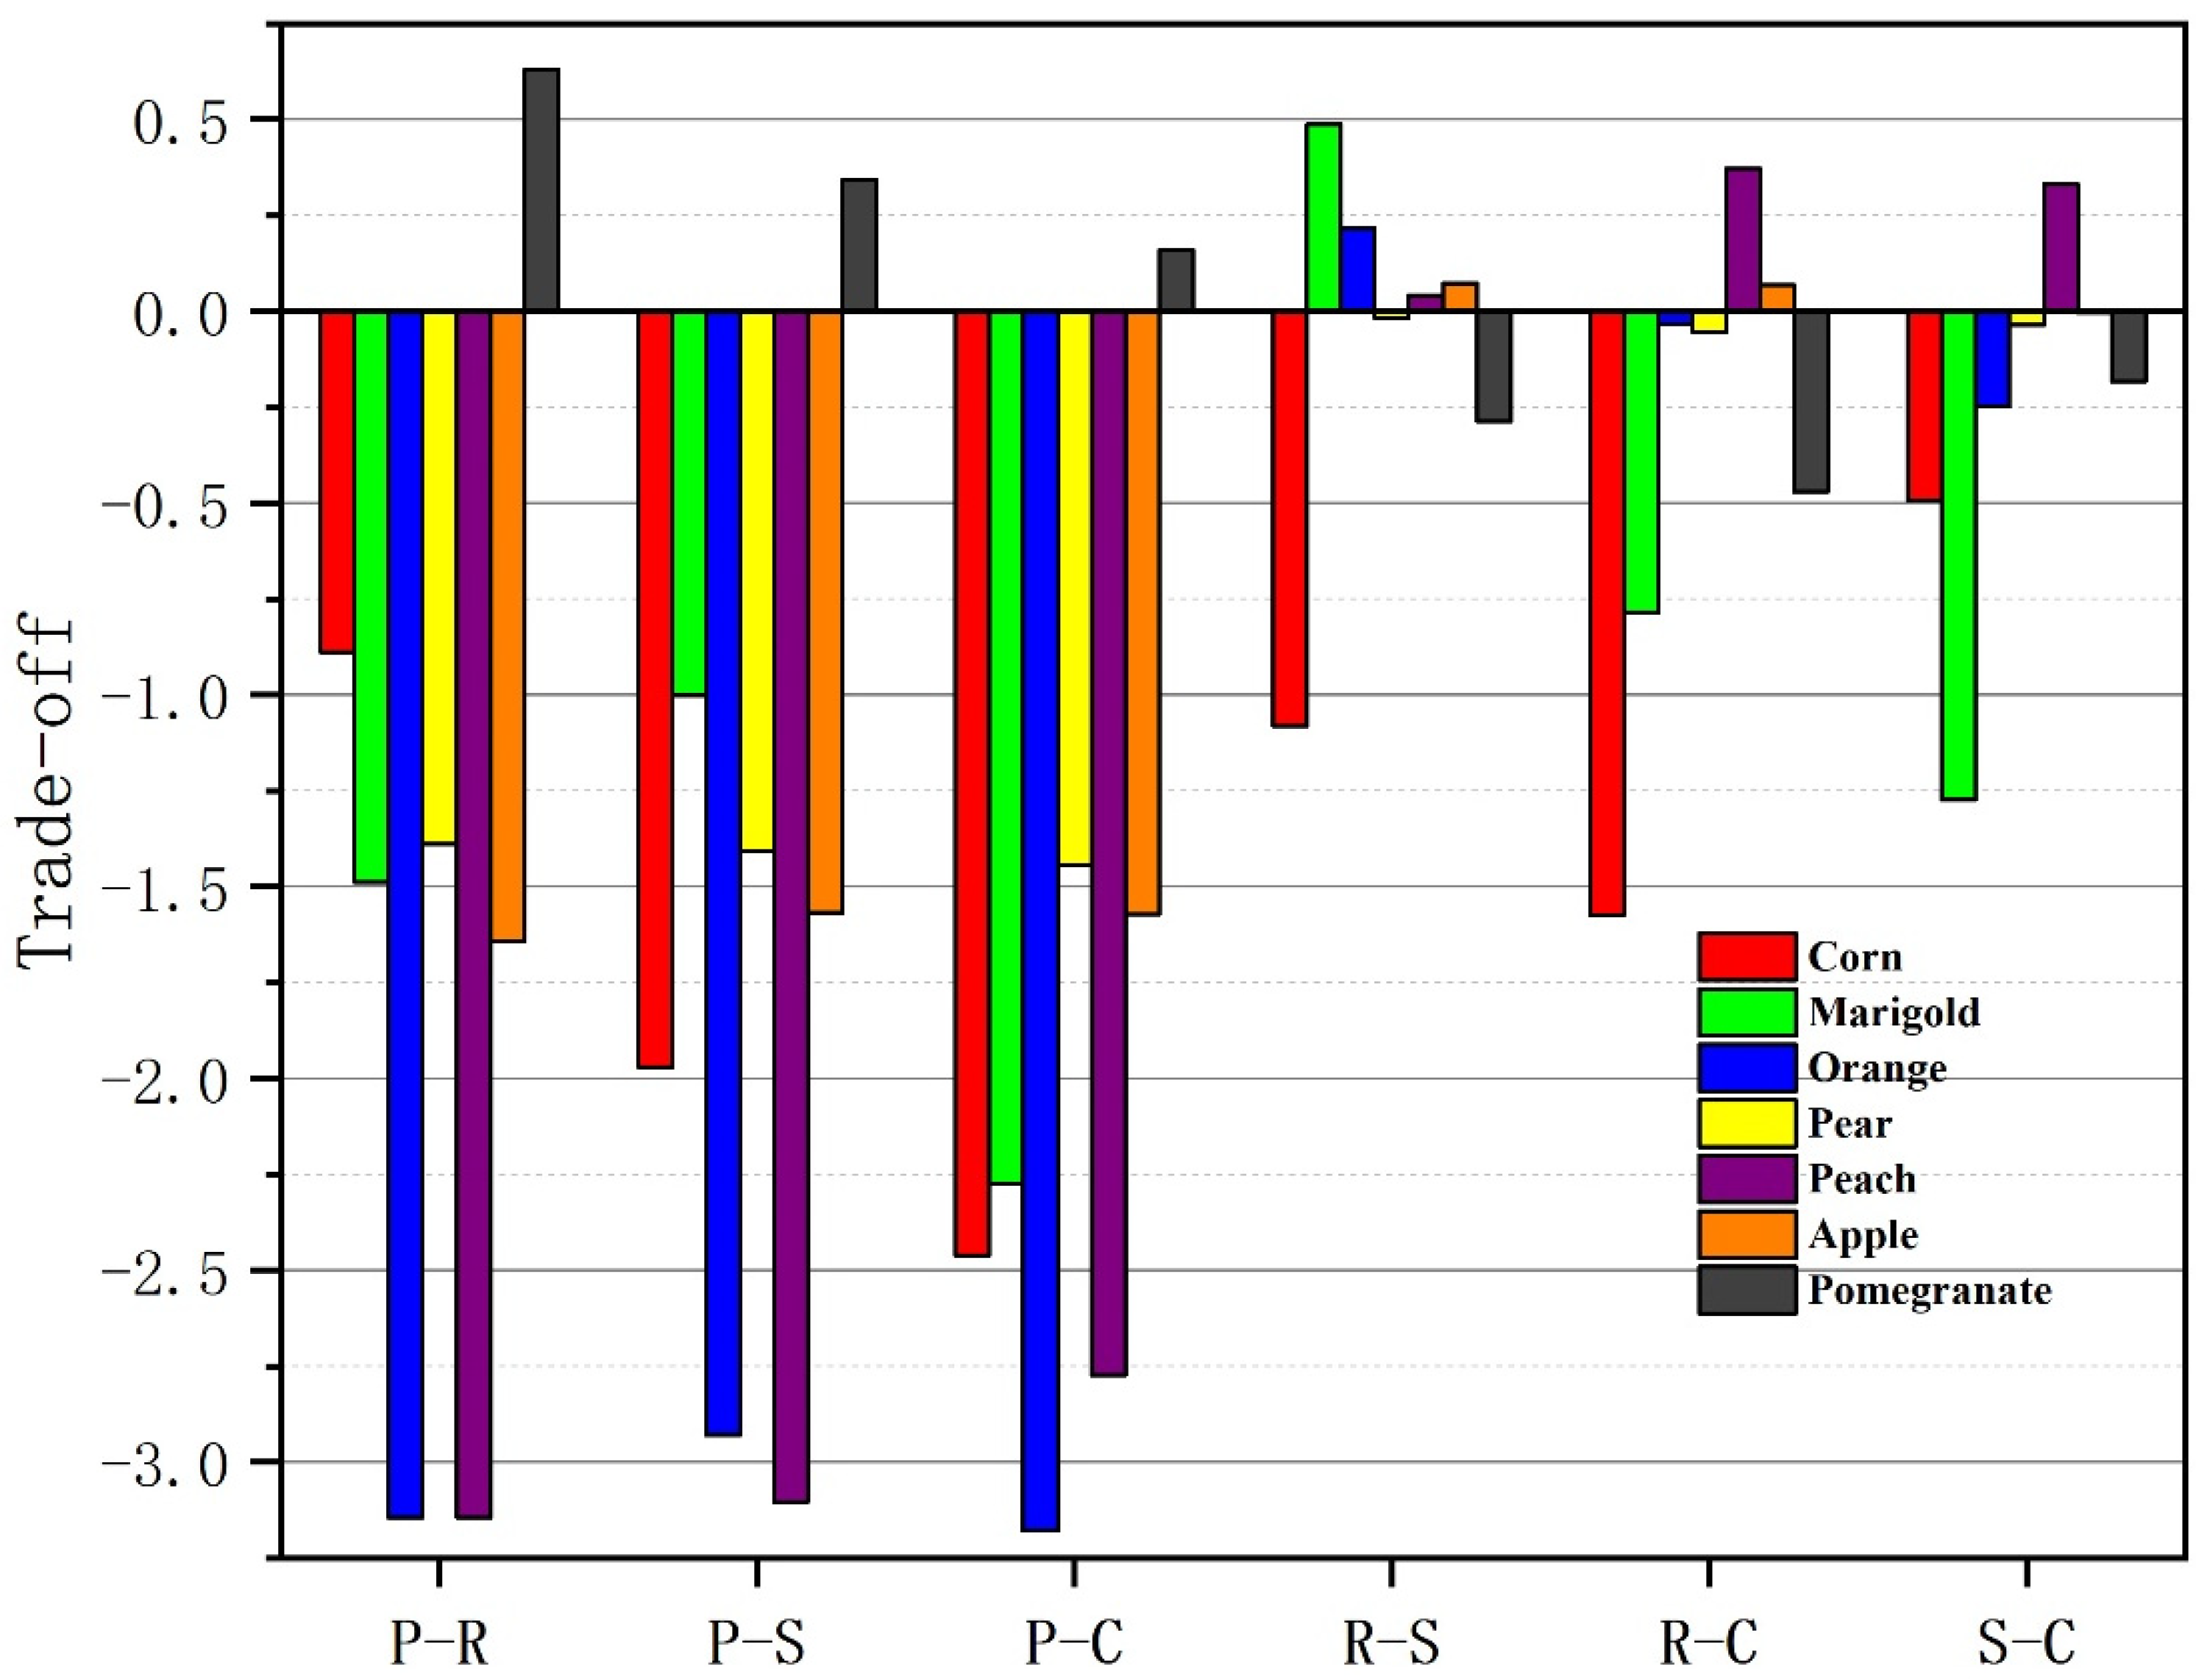
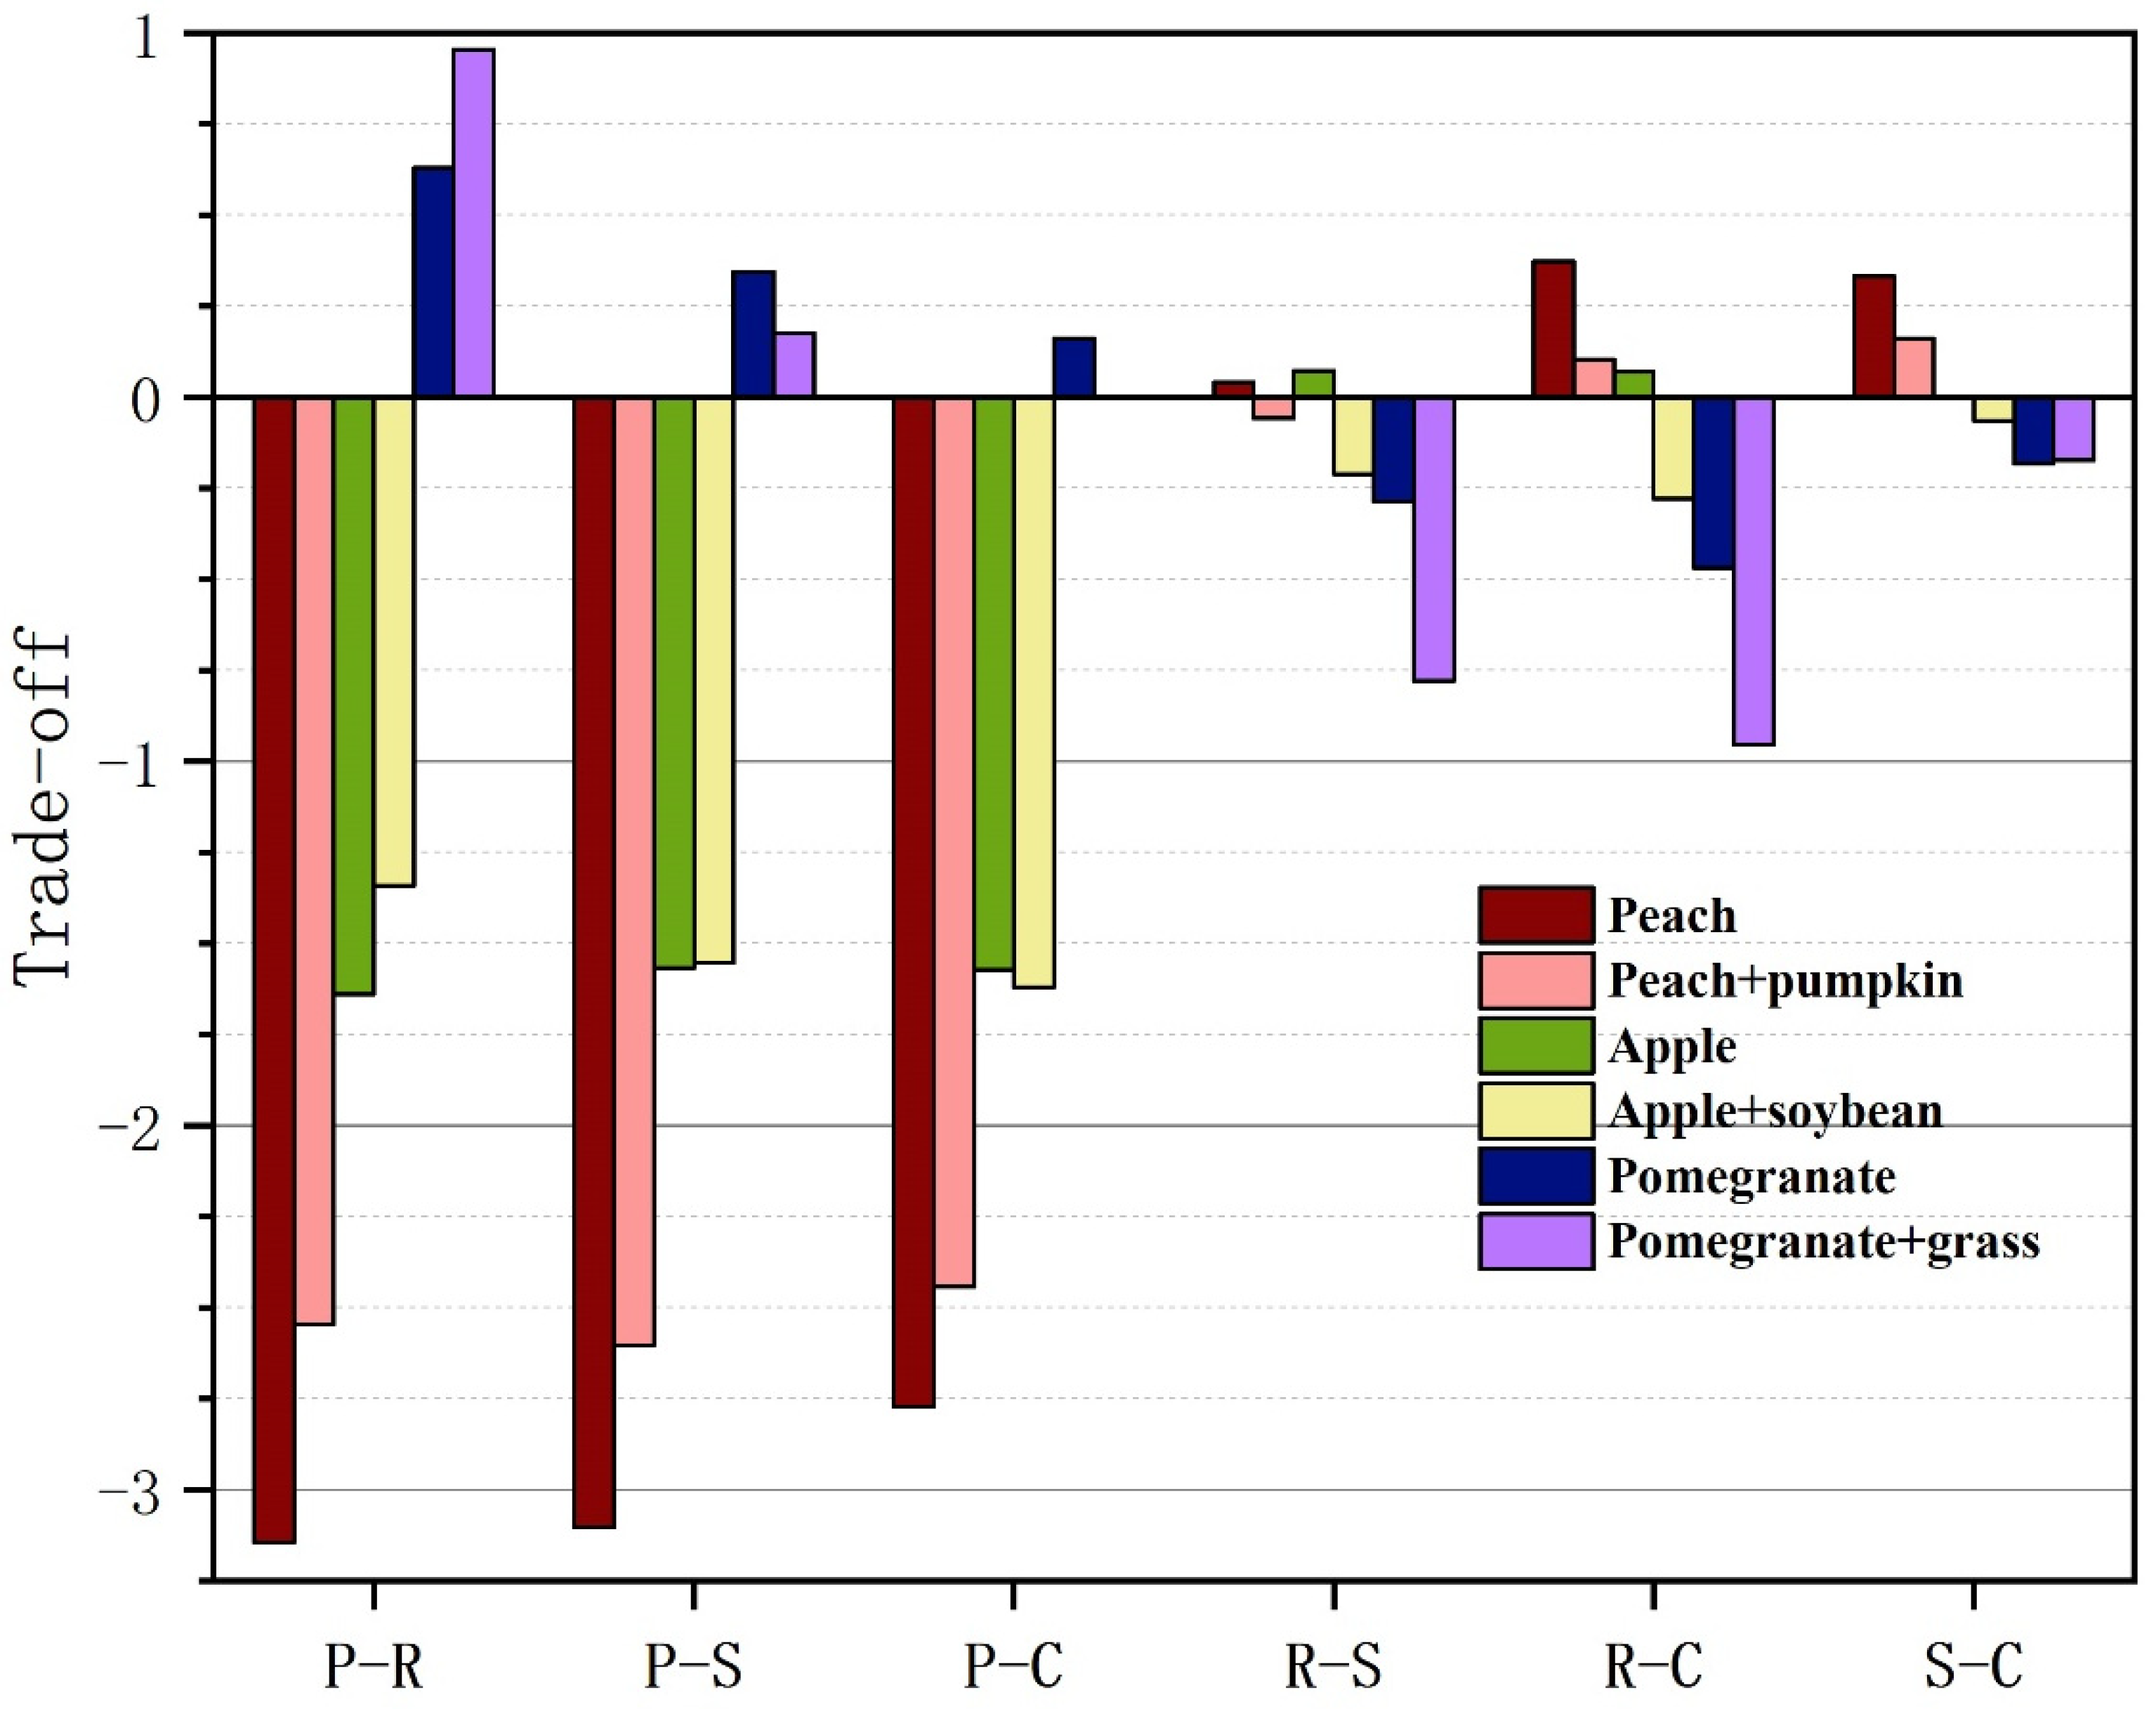
3.3. Tradeoffs of ESs in Different Patterns

The seven monoculture patterns, except that for pomegranate, exhibited negative tradeoffs between provisioning and regulating services (P-R), provisioning and supporting services (P-S), and provisioning and culture services (P-C). The P-R tradeoff in other patterns far outweighed that in the corn pattern (>50%), whereas that in orange and peach was the greatest of those in all patterns (Figure 3). The P-S tradeoff in all patterns was ranked from highest to the lowest as follows: peach > orange > apple > corn > pomegranate > pear > marigold. Except for the pomegranate and pear patterns, the P-C tradeoff in the other patterns exceeded 1.5, with the pomegranate pattern exhibiting the lowest, at 0.16, and the orange pattern the highest, at 3.2. The corn, pomegranate, and pear patterns exhibited negative R-S tradeoffs, and that in corn was the highest (>1), while those in the others were <0.5. As for the R-C tradeoff, only the peach and apple patterns exhibited positive tradeoffs, whereas those in orange, pear, and apple were very slight (<0.1). Except for in the marigold pattern, the S-C tradeoffs in the other patterns were <0.5.
When intercropping plants were added, the P-R tradeoffs in the peach and apple patterns decreased by 18.8% and 18.3%, respectively, whereas that in the pomegranate pattern increased by 51.6%. When adding pumpkin to peach and grass to pomegranate, the P-S tradeoff decreased significantly, but it did not decrease when soybean was added to apple. The effect of intercropping on the P-C tradeoff was similar to that on the P-S tradeoff. Intercropping increased the R-S and R-C tradeoffs in the apple and pomegranate patterns. Adding pumpkin decreased the R-C tradeoff in peach by 72.3%, whereas it had little effect on the R-S tradeoff (Figure 4).

4. Discussion

Based on the rough classification of land-use types (e.g., forest land, grassland, and farmland), the variation in multiple ESs was studied at different scales [38,39]. Meanwhile, ES evaluations and driving force analyses for specific regional or large-scale ecological projects have also been reported [40,41]. However, few studies have focused on the similarities and differences in ESs and their tradeoffs between different planting patterns, which is useful information for grassroots workers. In the present research, we compared four types of ES (seven indicators) with seven monoculture patterns and three intercropping patterns, and the results showed that the corn patterns performed the worst and the pomegranate + grass pattern performed the best.
The diversity of ESs is caused by a variety of drivers, including both natural and human factors. There was little difference in provisioning services between the orange and the corn patterns, which was probably because the orange orchard in the surveyed area had not reached peak yield at the time of the study. Meanwhile, to facilitate field management regarding, e.g., fertilization and pruning, the orange planting spacing in the study area is about 20% wider than in other areas, which reduces the canopy’s buffering effect on rainfall [42]. From a botanical point of view, apples and pears are expected to have similar ESs, but the pear pattern provides a lower provisioning service because pears have a lower market price than apples [43]. To offset this low price, the municipal government of Mengzi has combined flower-viewing with pear planting, similar to family farms with rural experiential tourism [44]. Previous studies have shown that converting annual crops to perennial grass increases above-ground biomass and the ability to retain soil but reduces annual income because the price per unit weight decreases [45,46]. The further conversion of grassland to forest will increase total soil nitrogen, litter, and soil microorganisms and significantly improve regulation and supporting services [47]. The transition from corn and marigold planting to fruit tree planting in our study confirmed this point. Together, the provisioning, regulating, and supporting services in agricultural ecosystems are mainly determined by product price, biomass, and litter. Intensive planting can improve the efficiency of orchard management within the region and thus improve provisioning services. In the karst areas, it has been reported that different tillage patterns can be used to optimize the performance of ESs for different crops, such as crop rotation and no-till sowing, which can improve the provisioning services of corn [48,49].
There is a general tradeoff between the provisioning services and other ESs [50,51]. The tradeoff in the corn pattern between regulation, supporting, and cultural services is greater than that in other patterns. However, despite corn’s large biomass, it is less effective at reducing soil loss owing to its annual tillage and lack of developed roots. The tradeoffs between provisioning, supporting, and regulating services in the peach pattern will decrease as planting years increase, due to increased cover layers, decomposition of litter, and yield [52]. Compared with those in the peach pattern, the tradeoffs in the pomegranate pattern were minimal, mainly owing to higher yields, higher prices, and a finer canopy. All of these results were similar to those obtained from research in European orchards, in which the tradeoffs between provisioning, supporting, and regulating services are closely related to yield, market price, and fertility management [53].
Previous studies have demonstrated that the use of intercropping or the coupling of farming patterns can improve the yield and nutrient-utilization efficiency of original farmland ecosystems to enhance the regulation and supporting services [54,55]. In our study, not all of the agroforestry patterns showed better ecosystem services compared with those of the monoculture system. The intercropping of soybean and apple was close to a retrogression, which was reflected in EMF and TES (Table 4). This may be due to any of the following reasons: firstly, as an annual crop, soybean tillage cannot maintain soil organic matter because straw is not returned to the field [45,56]; secondly, the continuous shading effect of apple trees on undergrowth partly reduces yield; and thirdly, planting under a forest may increase labor input, and soybeans are not priced high enough to cover the additional labor costs. Previous research has shown that interplanting soybeans with trees can increase soil nitrogen-use efficiency, reduce exogenous-nitrogen input, and improve supporting and regulation services [57]. These results are mainly associated with the microenvironment of forests, especially the understory planting density and the distance to the trunk [58]. The three interplants tested can significantly improve cultural services, which may be because the intercropping pattern requires more sophisticated management.
One limitation of our approach is that we did not find large-scale planting sites for the intercropping plants in our study in the same area, which prevented us from further studying the changes in the economic, biological, and ecological characteristics of intercropping to plants. In addition, a complete evaluation of the economic performance of fruit tree planting patterns needs to take into account more factors such as government subsidies, yield changes, variety replacement, etc., which makes it critical to monitor sample plots for 15 years or more, which may also be the future research direction of our team. More effort is needed to provide a robust tradeoff analysis of the multiple ESs of agricultural patterns, especially those that are widely promoted in major ecological projects. Firstly, we recognize that although the seven types of ecosystem service studied in this article are highly representative (Supplementary Figure S1), there are more ESs linked to agricultural land use patterns, including greenhouse gases, pests, water quality, heavy metals, and even aesthetics; these have not been universally accepted or properly measured [59,60] and are therefore not included in the current study. Secondly, the agricultural ecosystem itself is dynamic in terms of change and development, and the performance of its ESs in the short and long term differs [61]. Meanwhile, tradeoffs also exist across different spatial and temporal scales [62]. A well-designed comparative framework is the core of studying multi-species, multi-spatio-temporal-scale ESs and tradeoffs. For instance, measures such as irrigation, fertilization, and crop rotation can also change the performance of ESs in agricultural ecosystems, which requires further research in Yunnan province [63]. Thirdly, further studies are needed to develop a more comprehensive and predictable evaluation of agricultural land-use patterns at different scales [64,65,66].

5. Conclusions

In conclusion, our study found that existing agroforestry patterns do provide better ESs overall, especially pomegranate patterns. Intercropping with perennial grass has a positive effect on agroforestry systems. At the same time, we suggest that land users should include more ecological management measures, such as using organic manure. Policymakers and scientists should note the decisive effect of market price on agroforestry systems.

Supplementary Materials

The following are available online at https://www.mdpi.com/1999-4907/11/4/451/s1, File S1: Calculation methods. Figure S1: Correlations between pairs of ecosystem services among different planting patterns.

Author Contributions

Conceptualization, H.Z. and Z.Z. (Zhigang Zou); methodology, K.W. and F.Z.: investigation, H.Z. and Z.Z. (Zhaoxia Zeng); writing—original draft preparation, H.Z., H.T. and Z.Z. (Zhigang Zou); writing—review and editing, H.Z. and Z.Z. (Zhigang Zou); funding acquisition, F.Z. All authors have read and agreed to the published version of the manuscript.

Funding

This research was funded by the National Key Research and Development Program (2016YFC0502505, 2016YFC0502400); National Science and Technology Support Plan (2015BAD06B04); National Natural Science Foundation of China (31870712); Guangxi Innovation-driven Development Program (AA18118015), Guangxi Key Research and Development Program (AB17129002, AB17292064), Innovation Research Team Project of Institute of Subtropical Agriculture, Chinese academy of sciences (2017QNCXTD_XXL) and Guangxi Provincial Program of Distinguished Experts in China.

Acknowledgments

We acknowledge the technical and field work support from Jianyun Zhang, Songlian Bao.

Conflicts of Interest

The authors declare no conflict of interest.

References

  1. Costanza, R.; Darge, R.; Degroot, R.; Farber, S.; Grasso, M.; Hannon, B.; Limburg, K.; Naeem, S.; Oneill, R.V.; Paruelo, J.; et al. The values of the world’s ecosystem services and natural capital. Nature 1997, 387, 253–260. [Google Scholar] [CrossRef]
  2. Millenium Ecosystem Assessment. Ecosystems and Human Well-Being: Biodiversity Synthesis; World Resources Institute: Washington, DC, USA, 2005. [Google Scholar]
  3. Wallace, K.J. Classification of ecosystem services: Problems and solutions. Biol. Conserv. 2007, 139, 235–246. [Google Scholar] [CrossRef] [Green Version]
  4. Alamgir, M.; Turton, S.M.; Macgregor, C.J.; Pert, P.L. Ecosystem services capacity across heterogeneous forest types: Understanding the interactions and suggesting pathways for sustaining multiple ecosystem services. Sci. Total Environ. 2018, 566, 584–595. [Google Scholar] [CrossRef] [PubMed]
  5. Lafortezza, R.; Chen, J.Q. The provision of ecosystem services in response to global change: Evidences and applications. Environ. Res. 2016, 147, 576–579. [Google Scholar] [CrossRef] [PubMed]
  6. Zhang, Y.R.; Zhou, D.M.; Liu, M. Ecosystem service valuation research of chinese inland wetlands based on case study. Acta Ecol. Sin. 2015, 35, 4279–4286. (In Chinese) [Google Scholar]
  7. Levin, P.S.; Fogarty, M.J.; Murawski, S.A.; Fluharty, D. Integrated ecosystem assessments: Developing the scientific basis for ecosystem-based management of the ocean. PLoS Biol. 2015, 7, 23–28. [Google Scholar] [CrossRef] [PubMed] [Green Version]
  8. Reed, M.S.; Bonn, A.; Evans, C.; Glenk, K.; Hansjurgens, B. Assessing and valuing peatland ecosystem services for sustainable management. Ecosyst. Serv. 2014, 9, 1–4. [Google Scholar] [CrossRef] [Green Version]
  9. Tuinstra, J.; Van Wensem, J. Ecosystem services in sustainable groundwater management. Sci. Total Environ. 2014, 485–486, 798–803. [Google Scholar] [CrossRef]
  10. Wu, J.G. Landscape sustainability science: Ecosystem services and human well-being in changing landscapes. Landsc. Ecol. 2013, 28, 999–1023. [Google Scholar] [CrossRef]
  11. Yang, G.M.; Li, W.H.; Min, Q.W.; Zhen, L.; Mario, L. Reflection on the limitation of ecological service studies in china and suggestion for future research. China Popul. Resour. Environ. 2007, 17, 85–91. (In Chinese) [Google Scholar]
  12. Schroter, M.; Stumpf, K.H.; Loos, J.; Van Oudenhoven, A.P.E.; Bohnke-henrichs, A.; Abson, D.J. Refocusing ecosystem services towards sustainability. Ecosyst. Serv. 2017, 25, 35–43. [Google Scholar] [CrossRef]
  13. McDonough, K.; Hutchinson, S.; Moore, T.; Hutchinson, J.M.S. Analysis of publication trends in ecosystem services research. Ecosyst. Serv. 2017, 25, 82–88. [Google Scholar] [CrossRef]
  14. Zhang, W.; Ricketts, T.H.; Kremen, C.; Carney, K.; Swinton, S.M. Ecosystem services and dis-services to agriculture. Ecol. Econ. 2007, 64, 253–260. [Google Scholar] [CrossRef] [Green Version]
  15. Maseyk, F.J.F.; Mackay, A.D.; Possingham, H.P.; Dominati, E.J.; Buckley, Y.M. Managing natural capital stocks for the provision of ecosystem services. Conserv. Lett. 2017, 10, 211–220. [Google Scholar] [CrossRef]
  16. Ruhl, J.B. Adaptive management of ecosystem services across different land use regimes. J. Environ. Manag. 2016, 183, 418–423. [Google Scholar] [CrossRef] [PubMed]
  17. Bennett, E.M.; Peterson, G.D.; Gordon, L.J. Understanding relationships among multiple ecosystem services. Ecol. Lett. 2009, 12, 1394–1404. [Google Scholar] [CrossRef] [PubMed]
  18. Lu, N.; Fu, B.J.; Jin, T.T.; Chang, R.Y. Trade-off analyses of multiple ecosystem services by plantations along a precipitation gradient across loess plateau landscapes. Landsc. Ecol. 2014, 29, 1697–1708. [Google Scholar] [CrossRef]
  19. Romeu-Dalmau, C.; Gasparatos, A.; von Maltitz, G.; Graham, A.; Almagro-Garcia, J.; Wilebore, B.; Willis, K.J. Impacts of land use change due to biofuel crops on climate regulation services: Five case studies in malawi, mozambique and Swaziland. Biomass Bioenergy 2018, 114, 30–40. [Google Scholar] [CrossRef]
  20. Li, F.; Zhang, S.W.; Yang, J.C.; Bu, K.; Wang, Q.; Tang, J.M.; Chang, L.P. The effects of population density changes on ecosystem services value: A case study in western Jilin, China. Ecol. Indic. 2016, 61, 328–337. [Google Scholar] [CrossRef]
  21. Zou, Z.G.; Zeng, F.P.; Wang, K.L.; Zeng, Z.X.; Zhao, L.L.; Du, H.; Zhang, F.; Zhang, H. Emergy and economic evaluation of seven typical agroforestry planting patterns in the karst region of southwest China. Forests 2019, 10, 138. [Google Scholar] [CrossRef] [Green Version]
  22. Tian, Y.C.; Wang, S.J.; Bai, X.Y.; Luo, G.J.; Xu, Y. Trade-offs among ecosystem services in a typical karst watershed, sw China. Sci. Total Environ. 2016, 566, 1297–1308. [Google Scholar] [CrossRef] [PubMed]
  23. Liu, F.Y.; Xiong, K.N.; Lan, A.J.; Zhan, F.L.; You, P.Y.; Ai, Y. Correlation between rocky desertification and water and soil loss in the karst area of Guizhou. Res. Soil Water Conserv. 2015, 22, 6–71. (In Chinese) [Google Scholar]
  24. Li, S.; Wei, X.H.; Huang, J.G.; Wang, X.Z.; Lu, G.Y.; Li, H.X. The causes and processes responsible for rocky desertification in karst areas of southern China. Sci. Cold Arid Reg. 2009, 1, 80–90. (In Chinese) [Google Scholar]
  25. Wang, S.J.; Li, Y.B. Problems and development trends about researches on karst rocky desertification. Adv. Earth Sci. 2007, 22, 573–582. (In Chinese) [Google Scholar]
  26. Li, Y.B.; Wang, S.J.; Rong, L. Prospect of the study on rock desertification and its restoration in southwest karst mountains. Chin. J. Ecol. 2004, 23, 85–88. (In Chinese) [Google Scholar]
  27. Liao, C.J.; Yue, Y.M.; Wang, K.; Fensholt, R.; Tong, X.W.; Brandt, M. Ecological restoration enhances ecosystem health in the karst regions of southwest China. Ecol. Indic. 2018, 90, 416–425. [Google Scholar] [CrossRef]
  28. Ouyang, Z.; Zheng, H.; Xiao, Y.; Polasky, S.; Liu, J.; Xu, W.; Wang, Q.; Zhang, L.; Xiao, Y.; Rao, E.M.; et al. Improvements in ecosystem services from investments in natural capital. Science 2016, 352, 1455–1459. [Google Scholar] [CrossRef]
  29. Xu, W.H.; Xiao, Y.; Zhang, J.J.; Yang, W.; Zheng, H.; Liu, J.G.; Polasky, S.; Jiang, L.; Xiao, Y.; Shi, X.W.; et al. Strengthening protected areas for biodiversity and ecosystem services in China. Proc. Natl. Acad. Sci. USA 2017, 114, 1601–1606. [Google Scholar] [CrossRef] [Green Version]
  30. Zhao, Y.Z.; Zou, X.Y.; Hong, C.; Jia, H.K.; Wu, Y.Q.; Wang, G.Y.; Zhang, C.L.; Gao, S.Y. Assessing the ecological security of the Tibetan plateau: Methodology and acase study for lhaze county. J. Environ. Manag. 2006, 80, 120–131. [Google Scholar] [CrossRef]
  31. Su, W.C.; Yang, H. A study on the models of eco-agricultural development in typical karst gorge region-a case study from Ding Tan district of Hua Jiang gorge in Guizhou province. Chin. J. Eco-Agric. 2005, 13, 217–220. (In Chinese) [Google Scholar]
  32. Bai, X.Y.; Xiong, K.N.; Su, X.L.; Lan, A.J. The ecological effects of karst rocky desertification landscape and lands—A case study in Zhen Feng county, Guizhou province. Carsologica Sin. 2005, 24, 276–281. (In Chinese) [Google Scholar]
  33. Zhou, W.; Xiong, K.N.; Gao, J.F. Research on control way for cultivated land in karst rocky desertification basin -a case in Shiqiao basin, Bijie city and Mugong basin, Guan ling city in Guizhou province. Carsologica Sin. 2010, 29, 419–424. (In Chinese) [Google Scholar]
  34. Wu, K.Y.; Jiang, Z.C.; Deng, X.H.; Ye, Y. Ecosystem service value of restored secondary forest in the Karstic-rocky hills—A case study of Nongla National Medicine Nature Reserve, Guangxi Zhuang Autonomous. Reg. Chin. J. Eco-Agric. 2008, 16, 1011–1014. (In Chinese) [Google Scholar] [CrossRef]
  35. Statistics Bureau of Yunnan Province. Statistical Yearbook of Yunnan Province. 2017. Available online: http://stats.yn.gov.cn/tjsj/tjnj/201810/t20181030_809120.html (accessed on 19 October 2019).
  36. Bao, S.D. Soil Agrochemical Analysis, 3rd ed.; China Agriculture Press: Beijing, China, 2000; pp. 145–196. [Google Scholar]
  37. Pan, Y.; Wu, J.X.; Xu, Z.R. Analysis of the tradeoffs between provisioning and regulating services from the perspective of variedshare of net primary production in an alpine grassland ecosystem. Ecol. Complex. 2013, 17, 79–86. [Google Scholar] [CrossRef]
  38. Sutter, L.; Albrecht, M. Synergistic interactions of ecosystem services: Florivorous pest control boosts crop yield increase through insect pollination. Proc. R. Soc. B-Biol. Sci. 2016, 283. [Google Scholar] [CrossRef] [Green Version]
  39. Smith, P.; Ashmore, M.R.; Black, H.I.J.; Burgess, P.J.; Evans, C.D.; Quine, T.A.; Thomson, A.M.; Hicks, K.; Orr, H.G. The role of ecosystems and their management in regulating climate, and soil, water and air quality. J. Appl. Ecol. 2013, 50, 812–829. [Google Scholar] [CrossRef]
  40. Xu, Z.H.; Fan, W.G.; Wei, H.J.; Zhang, P.; Ren, J.H.; Gao, Z.C.; Ulgiati, S.; Kong, W.D.; Dong, X.B. Evaluation and simulation of the impact of land use change on ecosystem services based on a carbon flow model: A case study of the Manas River Basin of Xinjiang, China. Sci. Total Environ. 2019, 652, 117–133. [Google Scholar] [CrossRef]
  41. Bukvareva, E.; Zamolodchikov, D.; Grunewald, K. National assessment of ecosystem services in russia: Methodology and main problems. Sci. Total Environ. 2019, 655, 1181–1196. [Google Scholar] [CrossRef]
  42. Alva, A.K.; Prakash, O.; Fares, A.; Hornsby, A.G. Distribution of rainfall and soil moisture content in the soil profile under citrus tree canopy and at the dripline. Irrig. Sci. 1999, 18, 109–115. [Google Scholar] [CrossRef]
  43. Government Work Report. Website of the People’s Government of MengZi Municipality. 2017. Available online: http://www.mz.hh.gov.cn/ (accessed on 13 March 2019).
  44. Genovese, D.; Culasso, F.; Giacosa, E.; Battaglini, L.M. Can livestock farming and tourism coexist in mountain regions? A new business model for sustainability. Sustainability 2017, 9, 2021. [Google Scholar] [CrossRef] [Green Version]
  45. Meehan, T.D.; Gratton, C.; Diehl, E.; Hunt NDMooney, D.F.; Ventura, S.J.; Barham, B.L.; Jackson, R.D. Ecosystem-service tradeoffs associated with switching from annual to perennial energy crops in riparian zones of the US Midwest. PLoS ONE 2013, 8, 11. [Google Scholar] [CrossRef]
  46. Wilson, G.L.; Dalzell, B.J.; Mulla, D.J.; Dogwiler, T.; Porter, P.M. Estimating water quality effects of conservation practices and grazing land use scenarios. J. Soil Water Conserv. 2014, 69, 330–342. [Google Scholar] [CrossRef]
  47. Deng, L.; Shangguan, Z.P. Afforestation srives soil carbon and nitroget changes in China. Land Degrad. Dev. 2017, 28, 151–165. [Google Scholar] [CrossRef] [Green Version]
  48. Li, X.D.; Zhang, D.Q.; Wang, H.F.; Shao, Y.H.; Fang, B.T.; Yue, J.Q.; Lu, F.R.; Ma, F.J.; Qin, F.; Yang, C. Evaluation of ecosystem services of wheat-maize cropping system under different farming modes in the rain-fed area of southern henan province. Chin. J. Ecol. 2015, 34, 1270–1276. (In Chinese) [Google Scholar]
  49. Qin, L.Y.; Bai, X.Y.; Wang, S.J.; Zhou, D.Q.; Li, Y.; Peng, T.; Tian, Y.C.; Luo, G.J. Major problems and solutions on surface water resource utilisation in karst mountainous areas. Agric. Manag. Water Qual. 2015, 159, 55–65. [Google Scholar] [CrossRef]
  50. Le, H.; Lautenbach, S. A quantitative review of relationships between ecosystem services. Ecol. Indic. 2016, 66, 340–351. [Google Scholar] [CrossRef]
  51. Pan, Y.; Xu, Z.R.; Wu, J.X. Spatial differences of the supply of multiple ecosystem services and the environmental and land use factors affecting them. Ecosyst. Serv. 2013, 5, E4–E10. [Google Scholar] [CrossRef]
  52. Montanaro, G.; Xiloyannis, C.; Nuzzo, V.; Dichio, B. Orchard management, soil organic carbon and ecosystem services in mediterranean fruit tree crops. Sci. Hortic. 2017, 217, 92–101. [Google Scholar] [CrossRef]
  53. Pantera, A.; Burgess, P.J.; Losada, R.M.; Moreno, G.; Lopez-Diaz, M.L.; Corroyer, N.; Mcadam, J.; Rosati, A.; Papadopoulos, A.M.; Graves, A.; et al. Agroforestry for high value tree systems in Europe. Agrofor. Syst. 2018, 92, 945–959. [Google Scholar] [CrossRef] [Green Version]
  54. Du, S.N.; Bai, G.S.; Yu, J. Soil properties and apricot growth under intercropping and mulching with erect milk vetch in the loess hilly-gully region. Plant Soil 2015, 390, 431–442. [Google Scholar] [CrossRef]
  55. Zhang, J.E.; Gao, A.X.; Xu, H.Q.; Luo, M.Z. Effects of maize/peanut intercropping on rhizosphere soil microbes and nutrient contents. Pestic. Environ. Their Eff. Wildl. Proc. Adv. Study Inst. 2009, 20, 1597–1602. (In Chinese) [Google Scholar]
  56. Schulte, L.A.; Niemi, J.; Helmers, M.J.; Liebman, M.; Arbuckle, J.G.; James, D.E.; Kolka RKl O’Neal, M.E.; Tomer, M.D.; Tyndall, J.C.; Asbjornsen, H.; et al. Prairie strips improve biodiversity and the delivery of multiple ecosystem services from corn–soybean croplands. Proc. Natl. Acad. Sci. USA 2017, 114, 11247–11252. [Google Scholar] [CrossRef] [PubMed] [Green Version]
  57. Nourbakhsh, F.; Koocheki, A.; Mahallati, M.N. Investigation of biodiversity and some of the ecosystem services in the intercropping of corn, soybean and marshmallow. Int. J. Plant Prod. 2019, 13, 35–46. [Google Scholar] [CrossRef]
  58. Ripoche, A.; Achard, R.; Laurens, A.; Tixier, P. Modeling spatial partitioning of light and nitrogen resources in banana cover-cropping systems. Eur. J. Agron. 2012, 41, 81–91. [Google Scholar] [CrossRef]
  59. Foti, M.C.; Rostas, M.; Peri, E.; Park, K.C.; Slimani, T.; Wratten, S.D.; Colazza, S. Chemical ecology meets conservation biological control: Identifying plant volatiles as predictors of floral resource suitability for an egg parasitoid of stink bugs. J. Pestic. Sci. 2017, 99, 299–310. [Google Scholar] [CrossRef]
  60. Machado, F.H.; Mattedi, A.P.; Dupas, F.A.; Silva, L.F.; Vergara, F.E. Estimating the opportunity costs of environmental conservation in the Feijão River watershed (São Carlos-SP, Brazil). Braz. J. Microbiol. 2016, 76, 28–35. [Google Scholar] [CrossRef] [Green Version]
  61. Ripoche, A.; Celette, F.; Cinna, J.P.; Gary, C. Design of intercrop management plans to fulfil production and environmental objectives in vineyards. Eur. J. Agron. 2010, 32, 30–39. [Google Scholar] [CrossRef]
  62. Fu, B.; Yu, D. Trade-off analyses and synthetic integrated method of multiple ecosystem services. Resour. Sci. 2016, 38, 1–9. (In Chinese) [Google Scholar]
  63. Rapidel, B.; Ripoche, A.; Allinne, C.; Metay, A.; Deheuvels, O.; Lamanda, N.; Blazy, J.M.; Valdes-Gomez, H.; Gary, C. Analysis of ecosystem services trade-offs to design agroecosystems with perennial crops. Agron. Sustain. Dev. 2015, 35, 1373–1390. [Google Scholar] [CrossRef]
  64. Huang, C.H.; Yang, J.; Zhang, W.J. Development of ecosystem services evaluation models: Research progress. Chin. J. Ecol. 2013, 32, 3360–3367. (In Chinese) [Google Scholar]
  65. Butsic, V.; Shapero, M.; Moanga, D.; Larson, S. Using InVEST to assess ecosystem services on conserved properties in sonoma county, CAYY. Calif. Agric. 2017, 71, 81–89. [Google Scholar] [CrossRef] [Green Version]
  66. Yan, Y.Y.; Guan, Q.S.; Wang, M.; Su, X.L.; Wu, G.J.; Chiang, P.C.; Cao, W.Z. Assessment of nitrogen reduction by constructed wetland based on InVEST: A case study of the Jiulong River watershed, China. Mar. Pollut. Bull. 2018, 133, 349–356. [Google Scholar] [CrossRef] [PubMed]
Figure 1. The location of each pattern. Note: the intercropping pattern is in the same location as the corresponding monoculture pattern.
Forests 11 00451 g001
Figure 2. The relative ecosystem services (RES) of the three pairs in different agroforestry patterns.
Forests 11 00451 g002
Figure 3. The tradeoffs of the different monoculture patterns. P: Provisioning services; R: Regulating services; S: Supporting services; C: Cultural services; P-R: the trade-off between provisioning services and regulating services.
Forests 11 00451 g003
Figure 4. The tradeoffs of the three pairs in different agroforestry patterns.
Forests 11 00451 g004
Table 1. The background of the seven typical monoculture patterns.
TypePre-InvestmentPlanting AreaHarvest Period
CornAlmost none800 haJuly and August
MarigoldAlmost none330 haAugust and September
OrangeThe first two years require some fertilizer and labor input each year100 haJanuary to April
PeachThe first three years require some fertilizer and labor input each year3300 ha (700 ha fruiting)July to November
PearThe first three years require some fertilizer and labor input each year3000 haJuly to November
AppleThe first three years require some fertilizer and labor input each year2200 haJuly to November
PomegranateThe first four years require some input of fertilizer and labor each year 3400 haJuly to November
Note: More details about each pattern can been seen in Zou et al., 2019.
Table 2. Ecosystem service types and evaluation methods.
TypeFunctionEvaluation MethodFormula
Provisioning ServicesProvide fruit/flowersMarket price methodYield of fruit/flowers (kg) × market price (yuan/kg)
Regulating ServicesReduce topsoil lossOpportunity cost methodThe area of equivalent reserved land (ha) × normal income per unit area (yuan/yuan)
Soil fertility maintenanceShadow price methodThe amount of nutrient loss (kg) × market price of fertilizer (yuan/kg)
Photosynthetic carbon fixationShadow price methodThe fixed amount of carbon dioxide (kg) × carbon tax (yuan)
Supporting ServicesPhotosynthetic oxygen releaseShadow price methodThe amount of oxygen released (m3) × unit cost of industrial oxygen production (yuan/m3)
Nutrient retentionShadow price methodEquivalent retention of N, P and K fertilizer (kg) × market price of fertilizer (yuan/kg)
Cultural ServicesEducationReplacement cost methodEstimate the replacement cost according to the equivalent education level of training (Supplementary File 1)
Table 3. The relative ecosystem services (RES) of the seven typical monoculture patterns.
RESCornMarigoldOrangePearPeachApplePomegranate
Provisioning0.0210.052 0.0250.1440.0380.1690.955
Regulating0.0520.230 0.5870.5760.8810.8720.508
Supporting0.1540.141 0.4730.5860.8460.8110.678
Cultural0.2520.504 0.6070.6070.6070.8140.814
Table 4. The total ecosystem services index (TES) and the ecosystem multifunctionality index (EMF) of the different patterns.
IndexCornMarigoldOrangePearPeachApplePomegranatePeach+Apple+Pomegranate+
TES0.4800.9271.6931.9132.3722.6662.9542.3942.6223.225
EMF0.1200.2060.4610.5230.7070.7370.6880.6930.7150.756

