Article

Distribution Pattern of Endangered Plant Semiliquidambar cathayensis (Hamamelidaceae) in Response to Climate Change after the Last Interglacial Period

1
College of Forestry, Fujian Agriculture and Forestry University, Fuzhou, Fujian 350002, China
2
College of life sciences, Shanxi normal university, Linfen, Shanxi 041000, China
3
College of Agriculture, Guangxi University, Nanning, Guangxi 530000, China
4
Fujian Research Institute of Forestry, Fuzhou, Fujian 350012, China
*
Author to whom correspondence should be addressed.
Forests 2020, 11(4), 434; https://doi.org/10.3390/f11040434
Submission received: 18 February 2020 / Revised: 10 April 2020 / Accepted: 10 April 2020 / Published: 10 April 2020
(This article belongs to the Special Issue Climatic Variability Anticipation and Adaptation of Forest)

Abstract

:
Semiliquidambar cathayensis is a special and endangered plant in China, used for traditional Chinese medicine and in landscape applications. Predicting the impact of climate change on the distribution of S. cathayensis is crucial for its protection and the sustainable use of resources. We used the maximum entropy (MaxEnt) model optimized by the ENMeval data packet to analyze the potential geographic distribution changes of S. cathayensis in 12 provinces of Southern China for the different periods since the last interglacial period (LIG, 120–140 ka). Considering the potential geographic distribution changes in the province, and based on the two climate scenarios of Representative Concentration Pathways (RCP) 2.6 and RCP 8.5, the distribution range of S. cathayensis was analyzed and we predicted the range for the 2050s (average for 2041–2060) and 2070s (average for 2061–2080). The area under AUC (Area under the receiver operating characteristic (ROC) curve) is 0.9388 under these parameters, which indicates that the model is very accurate. We speculate that the glacial period refugia were the Nanling and Wuyi Mountains for S. cathayensis, and central and Western Fujian and Taiwan are likely to be the future climate refugia. In the mid-Holocene (MH, 6 ka), the growth habitat was 32.41% larger than the modern habitat; in the 2050s and 2070s (except RCP2.6–2070s), the growth habitat will shrink to varying degrees, so efforts to support its in situ and ex situ conservation are urgently needed. The jackknife test showed that the main factors affecting the geographical distribution of S. cathayensis were annual precipitation, precipitation of the wettest month, and precipitation of the driest month. The annual precipitation may be the key factor restricting the northward distribution of S. cathayensis. In general, the centroid of the distribution of S. cathayensis will move northward. The centroid of the adaptive habitats will move northward with the highest degree of climate abnormality. We think that Hainan Island is the most likely origin of S. cathayensis. These findings provide a theoretical basis for the establishment of genetic resources protection measures, the construction of core germplasm resources, and the study of the formation and evolution of Hamamelidaceae.

1. Introduction

The evolutionary direction, ecological habits, and geographical distribution of species are affected, constrained, and driven by the changing climate and human activities, which in turn affects ecosystem structure and biodiversity, except for human influence [1,2,3]. Periodic reciprocating oscillations, such as the glacial and interglacial periods and other sudden events in geological history, have led to regional differences in biodiversity; the last interglacial (LIG, 120–140 ka) is most closely related to modern times [4]. In the last glacial maximum (LGM, 22 ka), due to the rapid deterioration of the climate, several species have become extinct, and the distribution of most surviving species has shrunk sharply. As such, many biological refugia have appeared in many regions around the world [5,6,7]. The surviving terrestrial plants spread from their refuge under the conditions of post-glacial climate warming, and then redistributed. Climate change directly affects the distribution pattern of global plants, especially that of endangered plants [8,9,10]. Climate warming will gradually spread the centroid of the species distribution toward the north or the south as the suitable habitats migrate to higher latitudes and higher altitudes [11]. Li et al. used a combination of molecular markers and maximum entropy (MaxEnt) to determine how severe climate change may affect the spatial pattern of species distribution [12]. Juniperus drupacea, which is distributed in the Middle East and Greek Mountains, still had a wide habitats species in the LGM. With increasing climate change and human activities, habitat fragmentation is serious, and the species is now on the verge of extinction [13]. The extinction of species on earth is continually increasing, and 112,432 species have been listed on the International Union for Conservation of Nature (IUCN) Red List of threatened species [14]. The latest research reported that with the continuous development of industrialization, climate warming is becoming increasingly intense, and the frequency of El Niño and other extreme weather is also increasing [15]. China will have more extreme weather, and as endangered plants have more stringent requirements on habitat, studying the impact of climate change on the distribution of endangered plants is essential [16,17].
Species distribution models (SDMs), based on niche theory, are the main method used to evaluate the impact of climate change on species distribution using the known population distribution points of species and their associated climate factor data [18]. One of the various SDMs is maximum entropy (MaxEnt) [19,20,21]. However, each model has its own advantages and disadvantages. Through the research and comparison of various models, MaxEnt model was found to have better prediction ability, so is also one of the most widely used models [22,23]. At present, MaxEnt has been applied to a variety of aquatic and terrestrial animals to predict the change trend of potential distribution habitats [24], especially for invasive organisms, infectious diseases, and endangered species, such as Spartina alterniflora [25], Hex khasiana [26], and Thuja sutchuenensis [27]. MaxEnt can also use climate data to project to the past (such as the LIG and LGM) and the future to help determine the location of ice age shelters and the path of species migration and diffusion. MaxEnt can be used to provide auxiliary information for understanding species formation and differentiation, palynology, genetics, and species protection strategy formulation [28], which is important theoretical research and production practice.
Semiliquidambar cathayensis (Figure 1a–d) is a grade-2 protected plant in China. Study of its distribution pattern is essential for the phylogeny of Hamamelidaceae [29]. The whole plant is treasured in China. The roots, flowers, and leaves can be used in traditional medicine, with 85 kinds of active chemicals in the roots [30]. The extract and active components of the roots has inhibitory effects on cholinesterase and viral hepatitis antigen, respectively [31]. The plant is also one of the few colorful-leaved trees in South China and is used in landscape application. However, S. cathayensisis is on the verge of extinction, and most of whatever remains can be found in the south mountain area of China, with a fragmented distribution, so it needs to be protected. We found that the requirements for water, light, and heat of S. cathayensisis significantly differed between growth stages during the observation period in Tiantai mountain, Shaxian County (26°39’38” N, 117°49’32”E). The species likes shade and is sun-intolerant when young; it likes light and heat, and humid, fertile, and loose soil environment when adult. However, a wet winter and spring causes the seeds of S. cathayensisis to rot and deteriorate, resulting in few surrounding seedlings, indicating that climate change has considerably impacted the growth of S. cathayensisis. At present, reports are lacking on the response of Hamamelidaceae plants to climate and environment. The findings reported here can provide a reference for the protection and use of phylogeny of S. cathayensisis and Hamamelidaceae.
In this study, based on the EMNeval-data-package-assisted selection of MaxEnt optimal parameter settings, the potential distribution habitats of S. cathayensisis in the LIG, LGM, middle Holocene (6 ka), modern, Representative Concentration Pathways (RCP)2.6–2050s, RCP2.6–2070, RCP8.5–2050s, and RCP8.5–2080s were simulated and inferred [32]. Applying percent contribution and permutation importance comparison, we synthetically used the jackknife test to evaluate the main factors restricting modern geographical distribution and used response curves to determine the appropriate interval of environmental variables. The objectives of this study were to: (1) reconstruct the history of the change in the geographical distribution pattern of S. cathayensisis since the LIG, (2) understand the restrictive mechanism of environmental factors on the potential geographic distribution of S. cathayensisis, (3) provide a scientific basis for the germplasm resources protection and management of S. cathayensisis, and (4) lay a theoretical foundation for the study on the formation and evolution of South China flora and Hamamelidaceae.

2. Materials and Methods
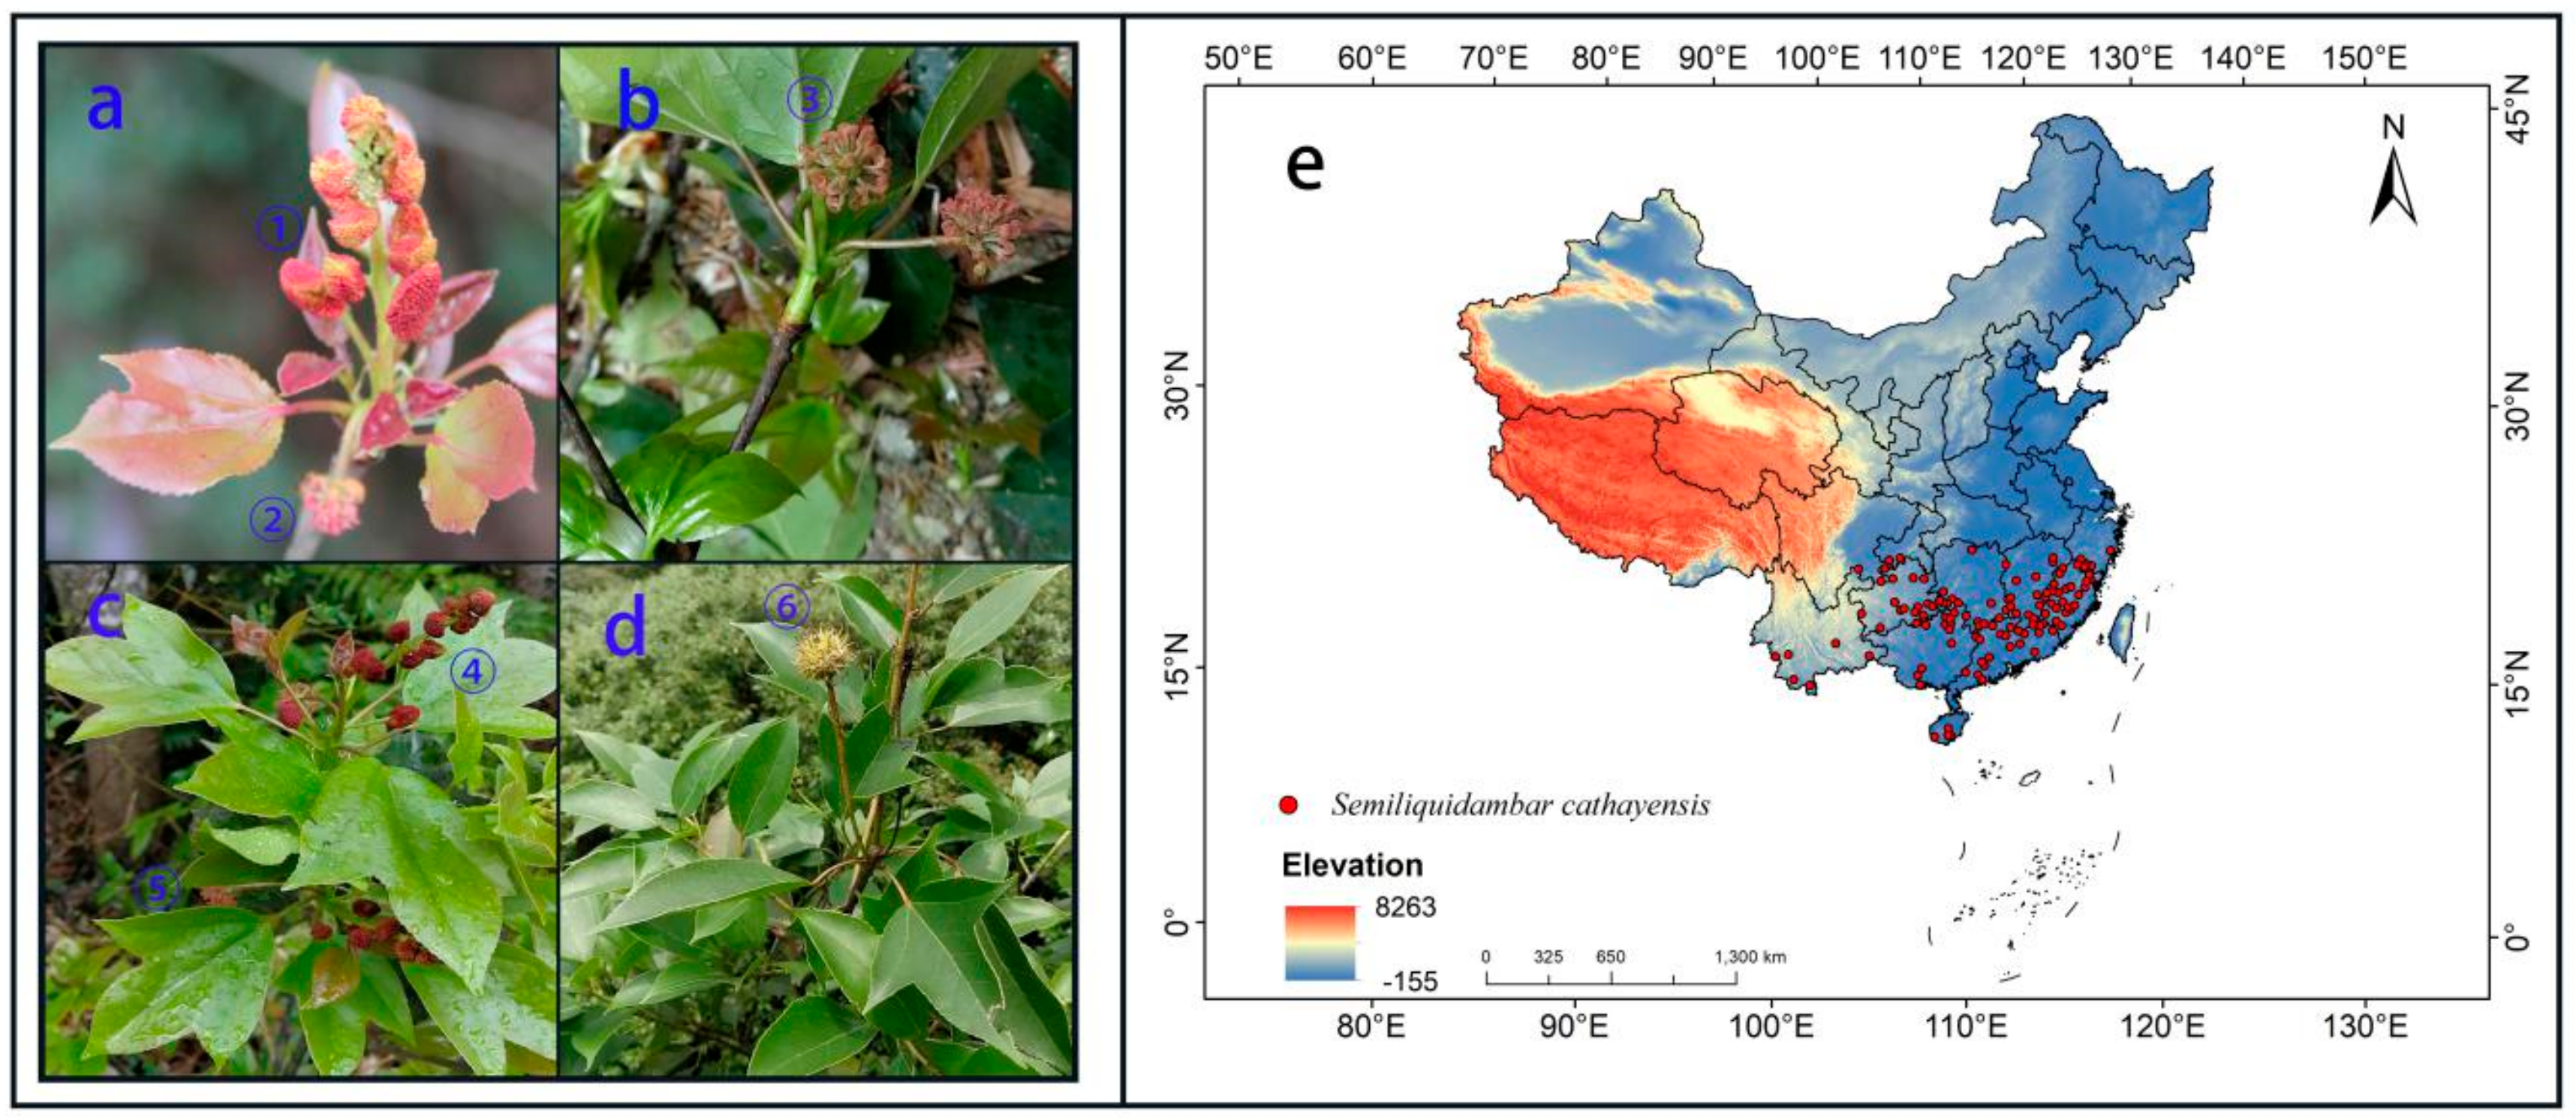
2.1. Study Area

S. cathayensisis is currently on the verge of extinction and remains only in the mountainous areas of Southern China [33]. The north boundary of its distribution is the Yangtze River, and the south boundary is Jianfengling National Nature Reserve of Hainan Island. The east boundary ranges from Wuyanling National Nature Reserve in Taishun County, Zhejiang, and Zhouning counties in Fujian and Daiyun Mountains Nature Reserve; the west boundary range from Cangyuan County in Yunnan-Guizhou Plateau to Gulin County in Sichuan [34,35]. The geographical coordinates of S. cathayensisis natural distribution area range from 18°41’38” to 29°7’44” N and 99°11’39” to 119°40’12” E.

2.2. Collection and Screening of Sample Data

In 2017–2019, our research team conducted field surveys of S. cathayensisis natural populations in 7 provinces of Fujian, Zhejiang, Jiangxi, Hunan, Guangxi, Guangdong, and Hainan, and collected 68 distribution records. We collected 17 distribution records of S. cathayensisis by consulting the published literature; we searched global species diversity information base [36], Specimen Resources Sharing Platform for Education [37], Chinese herbarium of nature [38], and Chinese Virtual Herbarium [39], collecting 13, Chinese herbarium of nature, 816, and 184 S. cathayensis specimen records, respectively, for a total of 1136. According to the method reported by Zhang et al. [40], all the above records were filtered, non-natural records were removed, and redundant data were deleted. To reduce the error caused by the cluster effect, each grid (10 × 10 km) retained only one distribution point, and finally 120 valid samples were obtained (Table S1; Figure 1e).

2.3. Environmental Variable Screening and Data Processing

The main determinant of species niche is climate variables, which are often used for plant niche modeling [41,42]. The LIG, LGM, MH, current and future climate data were downloaded from the WorldClim database [43]. Modern climate data are based on monthly meteorological data from different weather stations around the world from 1950 to 2000 and are generated by interpolation within a grid with a spatial resolution of 30 arc-second (about 1 km2 on the ground).The climate data of the LGM, MH, and the year 2070 were generated by the Community Climate System Model version 4 (CCSM4), in which the future greenhouse gas emission scenario is a typical concentration target (RCP2.6 and RCP8.5) [44,45]. The selection of environmental factors is based on the essential variables of growth and development of S. cathayensis. First, bio5, bio6, and bio12 are selected. Then, the correlation analysis is carried out for all factors, and the most important environmental factor with a correlation greater than 0.8 is selected [46]. Then, the variance iflation factor (VIF) analysis is carried out for all factors, and the factor with a VIF value less than 10 is selected, and seven environmental variables were finally selected (Table 1) [47].

2.4. Model Establishment, Optimization, and Evaluation

In this study, MaxEnt3.4.1 [48] software was used to simulate and predict the potential geographical distribution probability of S. cathayensis under the LIG, the LGM, MH, current, and the 4 future scenarios (RCP2.6–2050s, RCP2.6–2070s, RCP8.5–2050s, and RCP8.5–2070s). To ensure the probability of S. cathayensis distribution appear close to normal, we selected 75% of the data for model training and the remaining data for model testing. Other values were set to default [49]. We used the package ENMeval in R v. 3.6.1 [50] to optimize the MaxEnt model, set the regulatory multiplier (RM) to 0.5–8, and each interval was 0.5, for a total of 16 regulatory multipliers [48,51]. We used 9 feature combinations (FCs): L, LQ, H, LQH, LQHP, LQHPT, QHP, QHPT, and HPT(The MaxEnt model provides 5 features, which are linear features (L), quadratic features (Q), segmented features (H), product features (P), and Threshold features (T)) [52,53]. The ENMeval data package was used to test the above 144 parameter combinations, and we finally used the Akaike Information Criterion (AIC) model of the Akaike information criterion, and used 10% training omission rate (OR10) and the difference between the AUC values (AUCDIFF) to check the fit and complexity of the model (Table S2) [50].
After the optimization was completed, the optimized parameters were used to simulate and predict the suitable growth habitat of S. cathayensis in different periods. The area under AUC (Area under the receiver operating characteristic (ROC) curve) was used to assess the accuracy of MaxEnt predictions [54]. The range of AUC values is (0, 1). The higher the AUC value, the higher the credibility of distinguishing between suitable and unsuitable habitats. An AUC less than 0.8 indicates that the reliability is low; 0.9–1.0 is extremely accurate [54]. We divided the suitability into four grades (I, 0%–20%; II, 20%–50%; III, 50%–70%; IV, 70%–100%), which respectively indicate unsuitable, less suitable, middle suitable, and highly suitable habitats, and the number of grids at each level was calculated to determine the percentage of area change.

2.5. Multi-Environment Similarity Surface (MESS) and the Most Dissimilar (MoD) Variable Analysis

Based on China’s environmental variables as reference layers, the MESS and MoD were used to analyze the abnormal climate areas in the past and future situations and the key factors that caused the change of potential geographical distribution [32]. The multivariate similarity of each distribution point is the minimum of the similarity of each variable, and this variable is the MoD [55]. A negative multiple similarity value means that at least one variable value of the point exceeds the range of the reference layer, which is called a climate abnormal point and is expressed in blue. If it is positive, as the value becomes larger, the probability of a climate anomaly is lower, it is expressed in light blue, turquoise, and orange. The higher the score, the darker the color, the more normal the climate of the point. When the score is 100, the climate of the point is completely normal [56].

2.6. Analysis of Spatial Pattern Changes

We redefined spatial units with a species existence probability value of ≥0.5 as a suitable S. cathayensis habitat, and the spatial units with a species distribution probability value <0.5 as unsuitable habitats [32,57] so as to establish the existence / nonexistence (0,1) matrix of S. cathayensis under the past, current and future climate change scenarios. Based on the (0,1) matrix table, the pattern changes of suitable distribution areas of S. cathayensis under past and future climate change scenarios were further analyzed. The past and future area changes were calculated based on the current area of S. cathayensis suitable habitats. A matrix value 0 → 1 indicates the newly added suitable habitats, 1 → 0 indicates the lost suitable habitats, 1 → 1 is the reserved suitable habitats, and 0 → 0 is the unsuitable habitats. Finally, the matrix change values were loaded into Arc GIS 10.4.1 to create visualizations of the spatial pattern changes in suitable S. cathayensis habitats.

2.7. The core Distributional Shifts

The trends in the changes in suitable habitats were also calculated and the centroids were compared for the LGM, MH, and current and future suitable habitats using ZonalGeometry tool in Arc GIS 10.4.1, and the center points of the suitable regions in regions were compared [57]. We considered the suitable S. cathayensis habitat as a whole and reduced it to a vector particle and used the change of the position of the centroid to reflect the size and direction of the species’ suitable habitat. Finally, we tracked the centroid with different SDMs to examine the centroid of S. cathayensis in different periods and under different climatic conditions to evaluate the migration distance of the suitable S. cathayensis zone in latitude and longitude coordinates [40].

3. Results

3.1. Analysis of the Accuracy of the Model

Based on 120 distribution points and seven climate variables of S. cathayensis, we used the MaxEnt niche model to predict the potential geographical distribution of S. cathayensis. The default settings were RM = 1, FC = LQPHT, for which the minimum information criterion AICc value was 53.545. The difference between the training set and the test set AUC was 0.020149. When Feature Combination (FC) = LQ, Regularization Multiplier (RM) = 1.5, and ΔAICc = 0, the model was the optimal, and the difference between the model training set AUC and the test set AUC was 0.0198 (Table 2), which is 17.04% lower than with the default settings. The optimized ΔAICc and avg. diff. AUC (The average difference of AUC) values are lower than the default settings. The results showed that the optimized parameters reduce the fitting degree and complexity of the model. Therefore, FC = LQ and RM = 1.5 were selected as the parameter settings of the model. Under these parameter settings, we used MaxEnt to predict the modern potential distribution area. The average AUC value of 10 times of repeated training was 0.9388 and the average AUC value of the test data was 0.931, which shows that this model is accurate for S. cathayensis prediction.

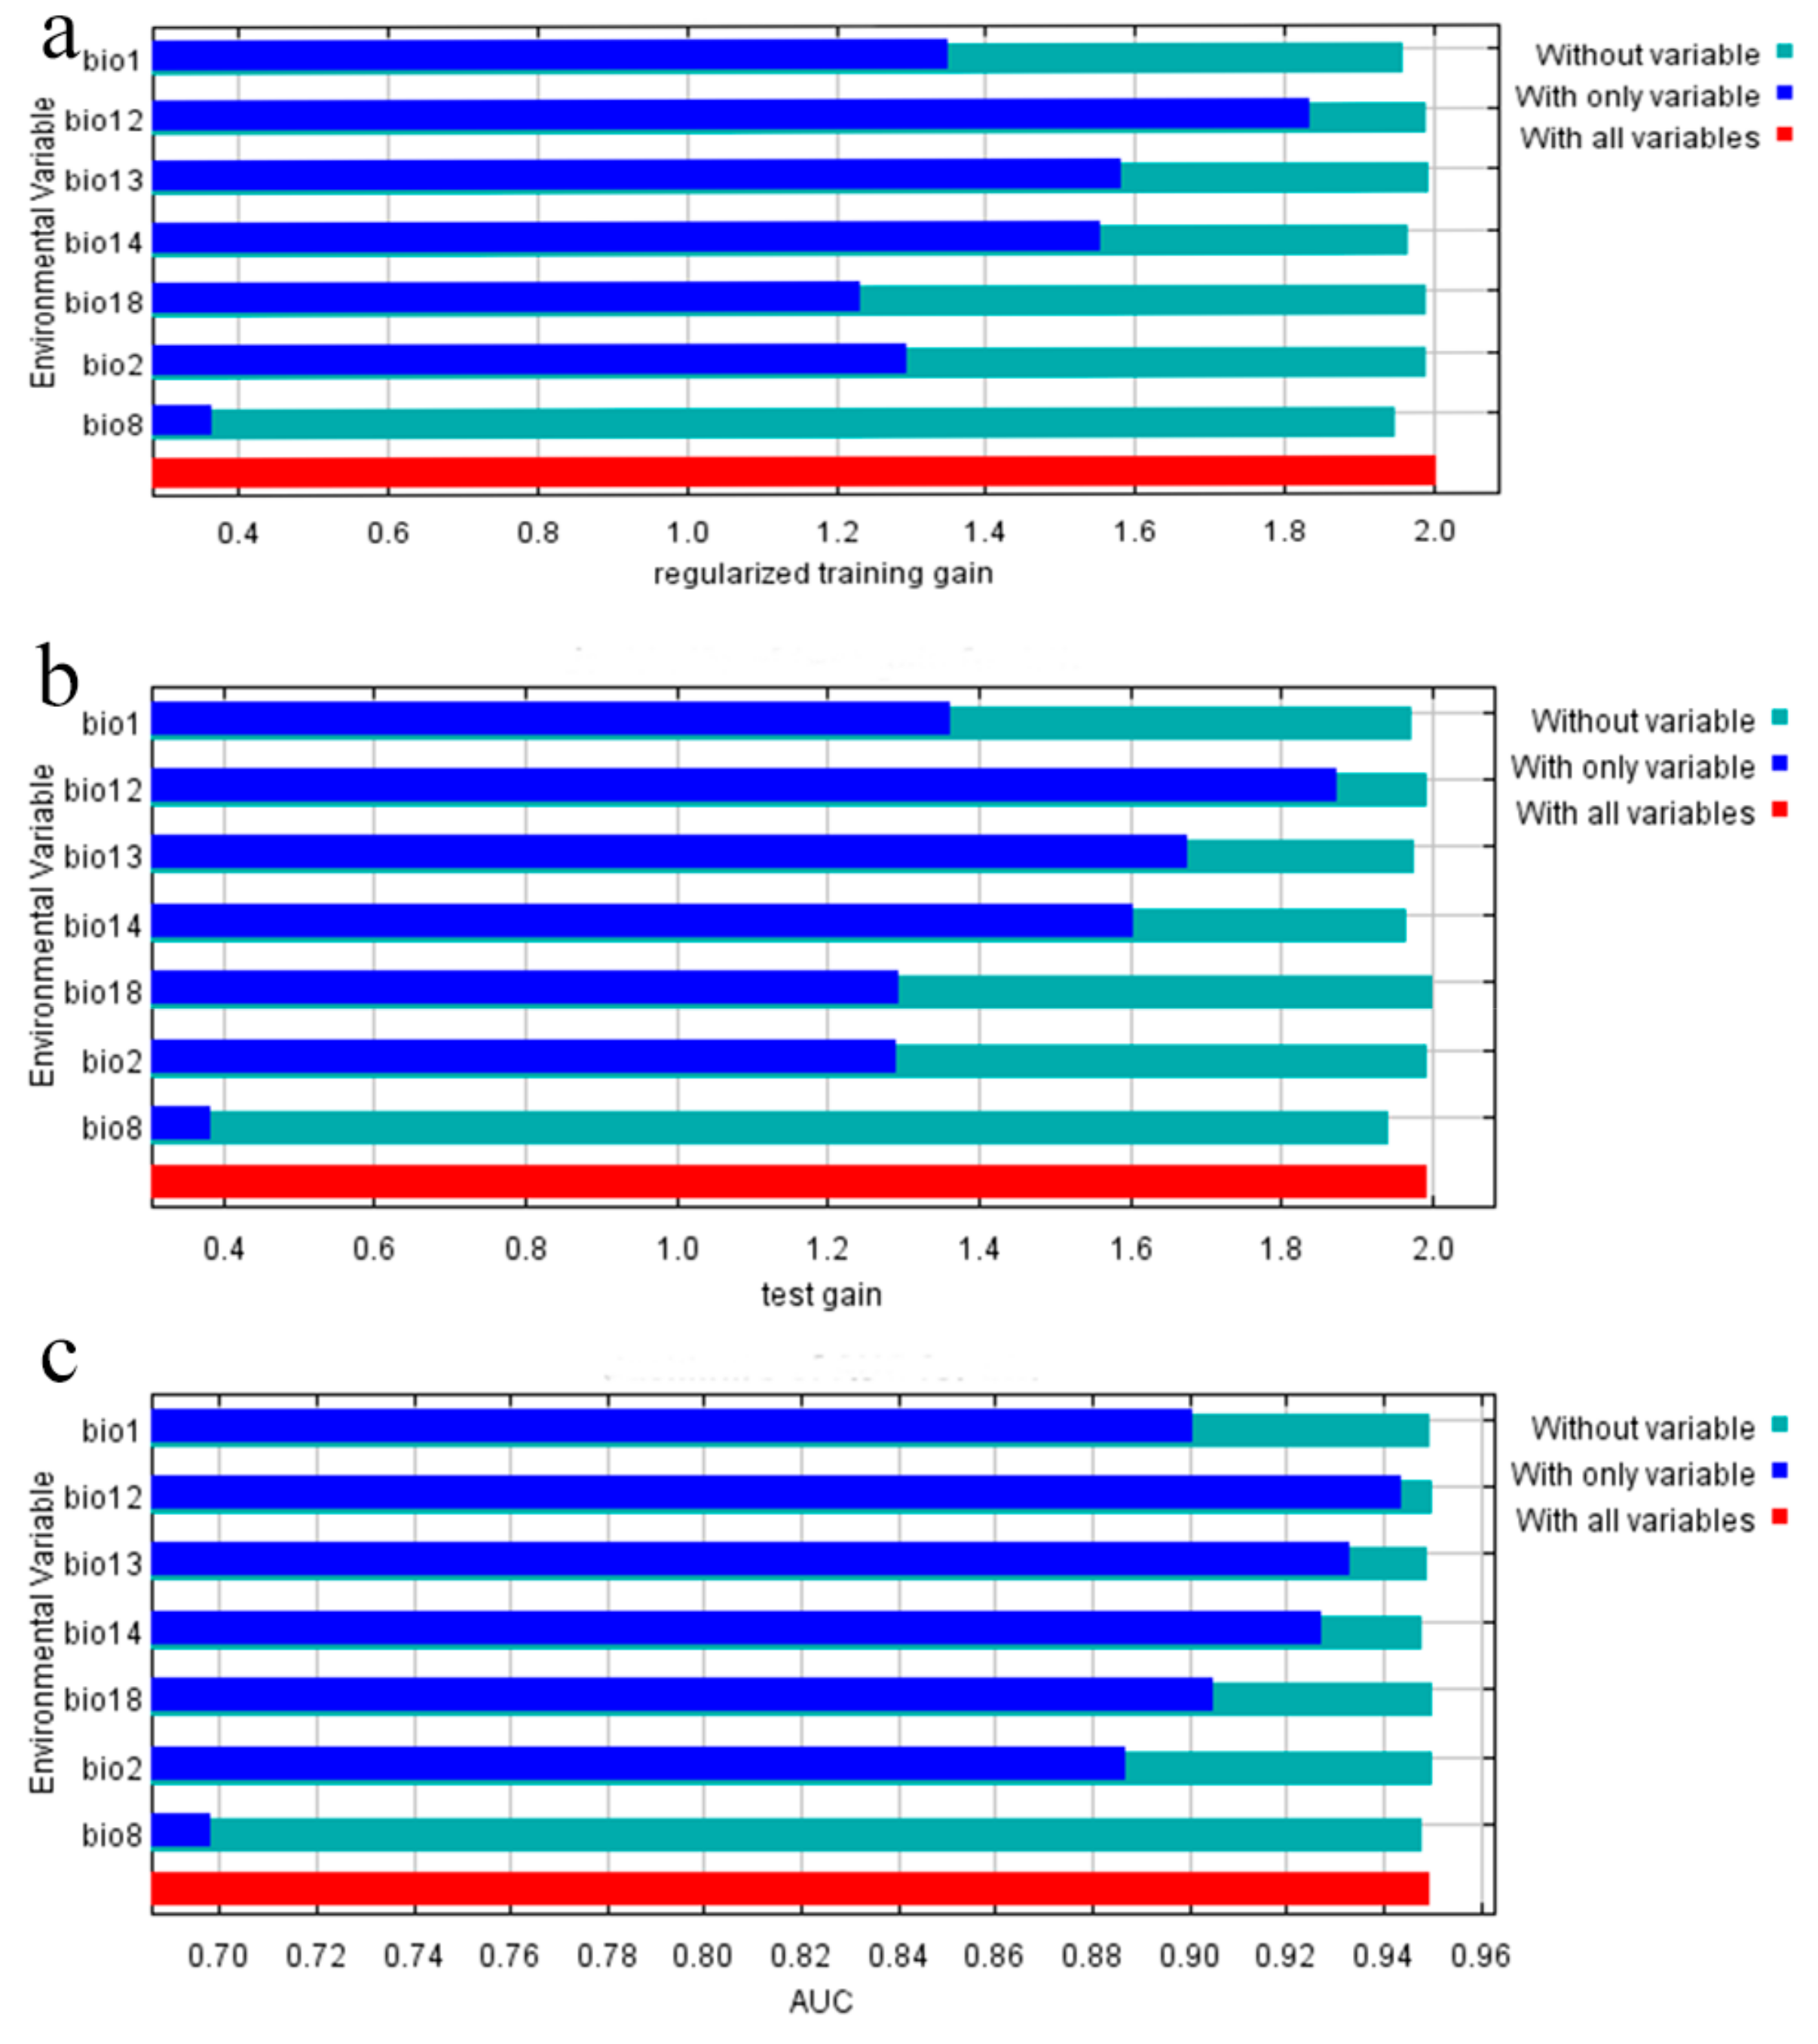
3.2. Contribution Analysis of Environmental Variables

Using the response curve (Figure 2), we obtained the thresholds of the seven main bioclimatic parameters (existence probability n > 0.2). These seven response curves were all single peak and nearly normal in distribution, which indicated that the prediction of S. cathayensis was successful. Annual mean temperature (bio1) ranged from 129 to 297 (12.9–29.7 °C), mean diurnal range (bio2) ranged from 39 to 98 (3.9–9.8 °C), mean temperature of wettest quarter (bio8) ranged from 149 to 346 (14.9–34.6 °C), annual precipitation (bio12) ranged from 1239 to 2940 mm, precipitation of the wettest month (bio13) ranged from 204 to 677 mm, precipitation of driest month (bio14) ranged from 20 to 61, and precipitation of warmest quarter (bio14) ranged from 431 to 1669 mm.

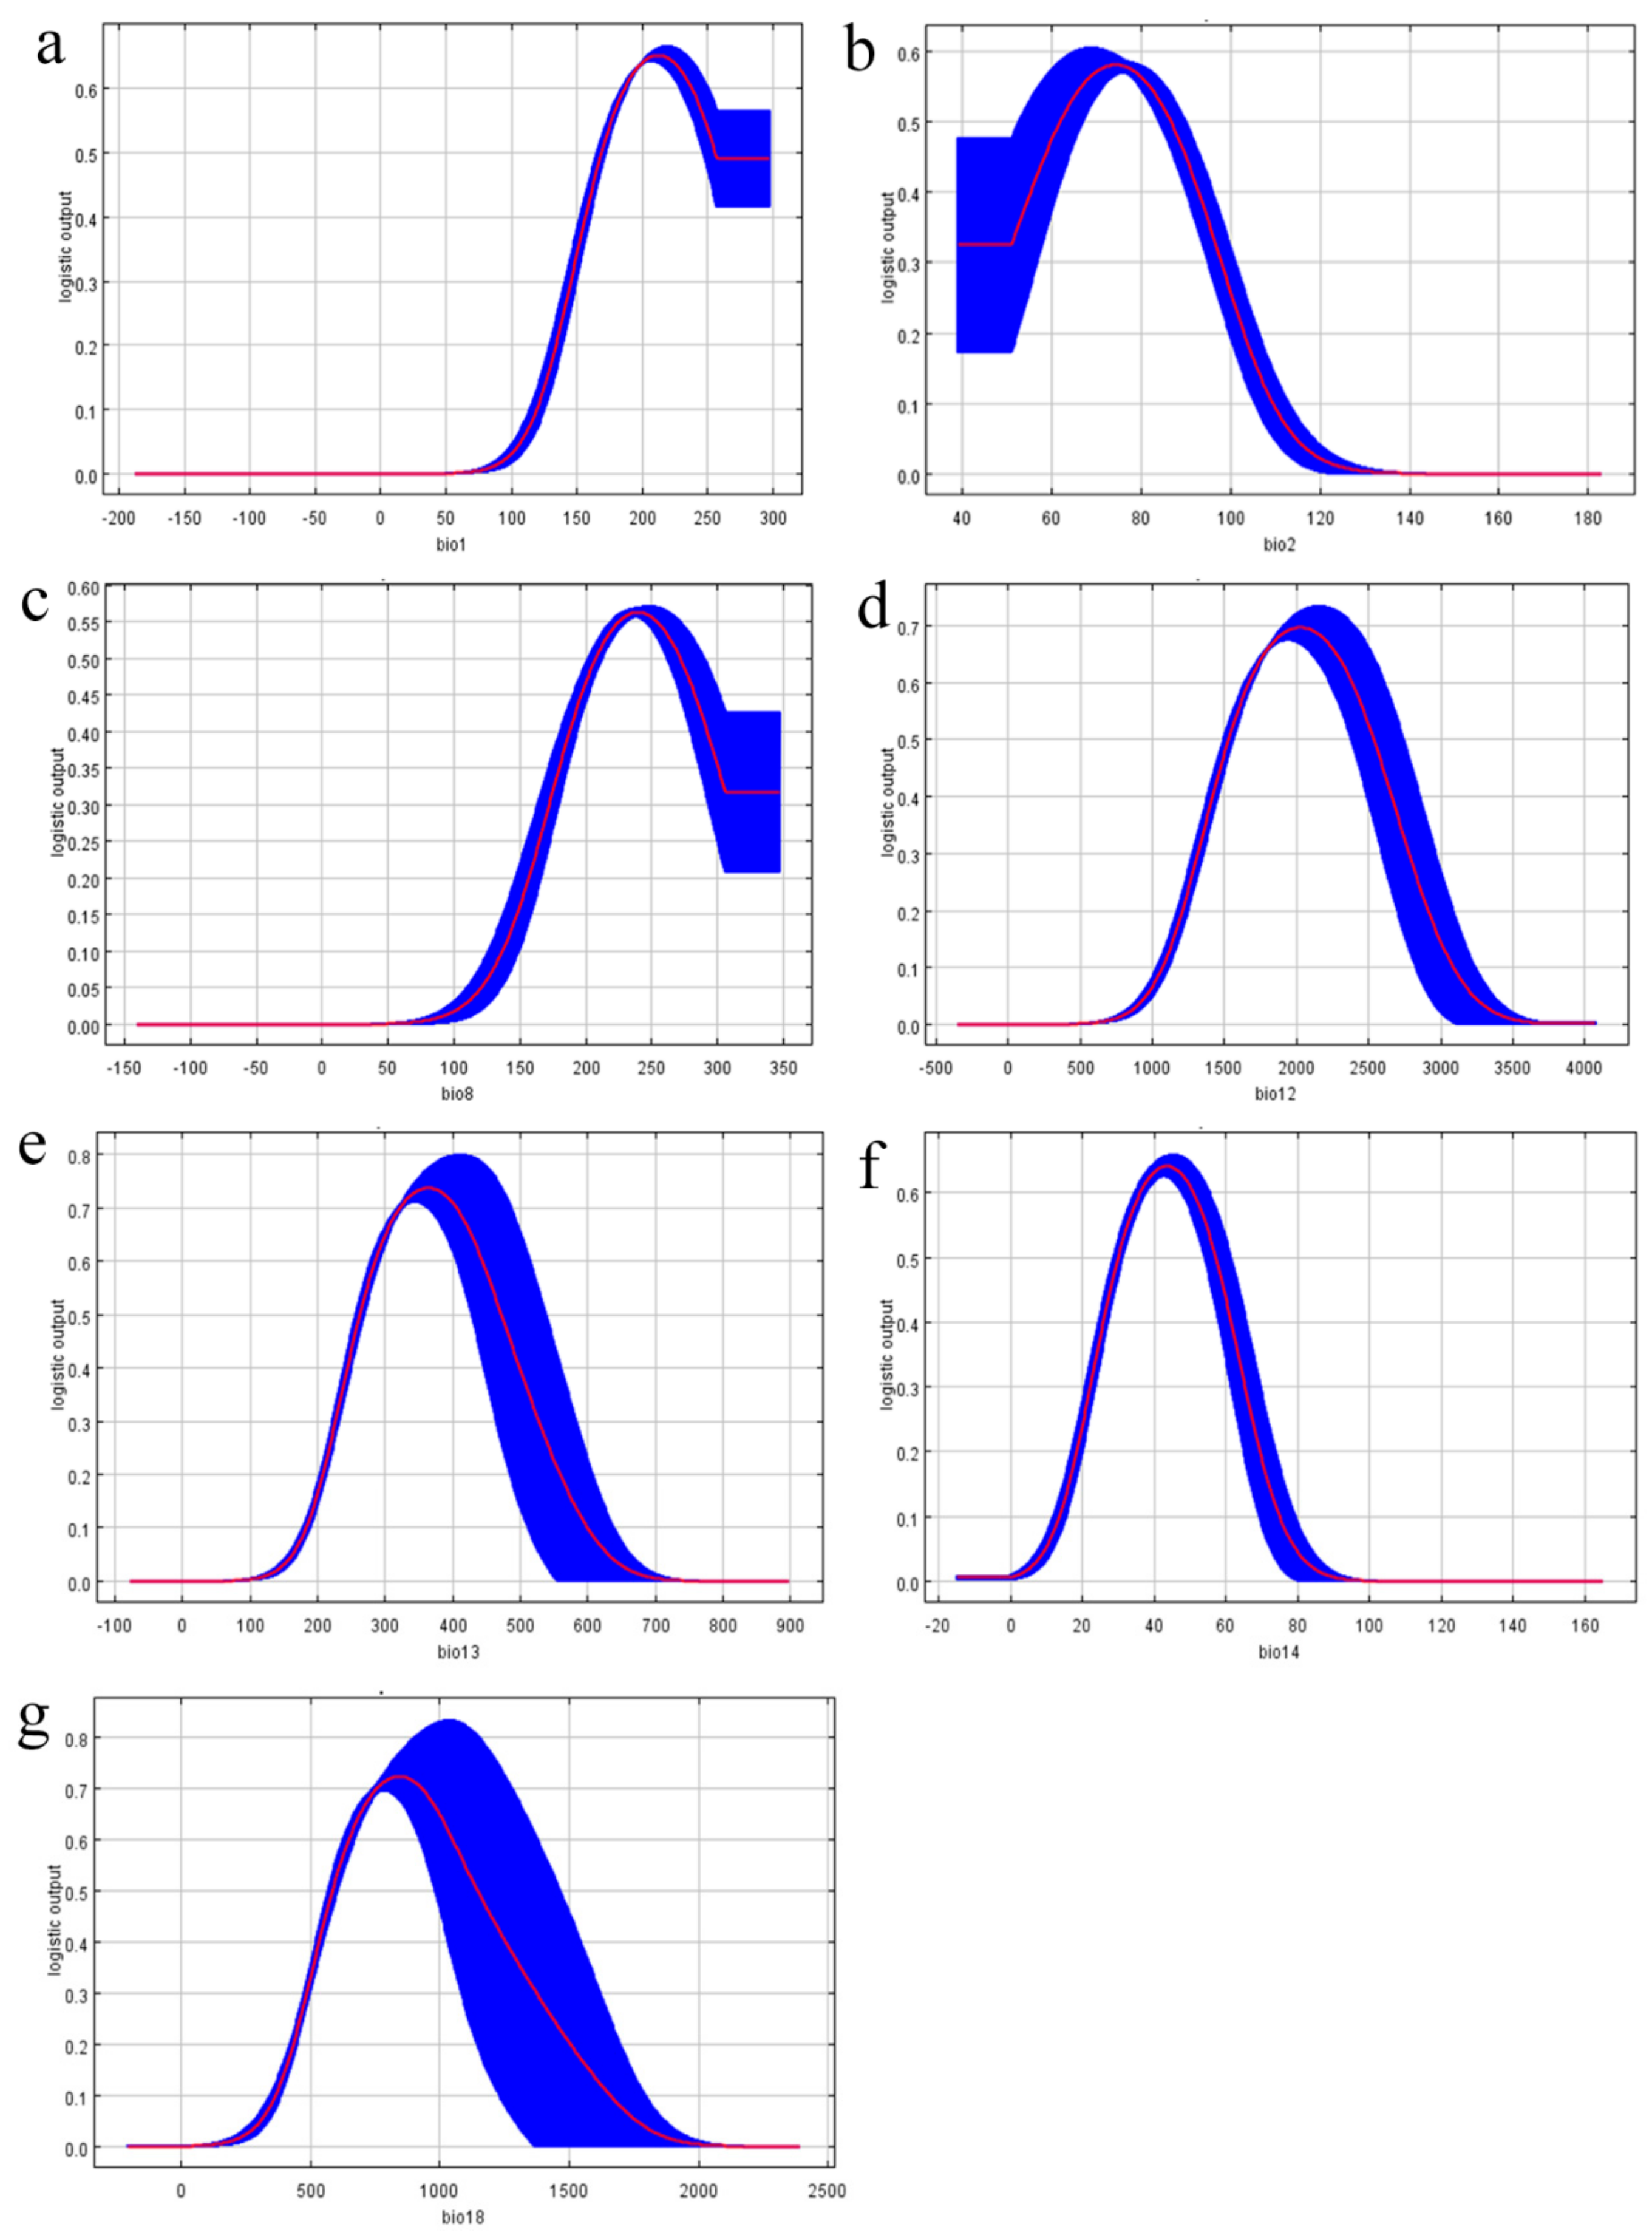
3.3. Environmental Variables Analysis

Among the seven environmental variables screened, the contributions of annual mean temperature (bio1, 37.3% of variation), mean diurnal range (bio2, 23% of variation), and annual precipitation (bio12, 17.8% of variation) were much larger than those of other environmental factors, and their cumulative contribution rate was as high as 78.1% (Table 1). The cumulative contribution rate of the temperature-dependent annual mean temperature and mean diurnal range was 60.3%. The top three important variables were annual mean temperature (bio1), annual precipitation (bio12), and mean temperature of wettest quarter (bio8), with a cumulative value of 64.4%. Figure 3 shows that when only individual variables were used, the regularization training gain, test gain, and the three variables with the highest AUC values were ranked the same. Annual mean temperature (bio12) and precipitation of warmest quarter (bio13) were the two variables that declined the most in the regularized training gain, test gain, and AUC values. Based on the above analysis, the main factors affecting the modern geographical distribution of S. cathayensis are precipitation factors (annual precipitation, precipitation of wettest month and precipitation of driest month) and temperature factors (annual mean temperature, mean diurnal range, and mean temperature of wettest quarter).

3.4. Modern Potential Distribution Areas

Our model prediction results show that the average suitability of the 120 current distribution records was 0.512, with the highest value being 0.826 (Lingshui Li Autonomous County, Hainan) and the lowest value was 0.048 (Yuxi City, Yunnan), of which the area of middle-high suitable habitat was 344,530 km2. Currently, the suitable habitats of S. cathayensis include most of Fujian, Guangdong, Jiangxi, Hunan, Guangxi and Hainan, south central Zhejiang, Southern Guizhou and Chongqing, parts of Southeast and Southwest Hubei, Southern Anhui, a few areas in south central Sichuan, a few low-altitude areas in south and west of Yunnan, and Southern Tibetan Valley in China (Figure 4A). The highly suitable habitats are central and Western Fujian, Northeast Guangdong, central and Eastern Hainan, central and Northern Taiwan, a few areas in the south of Zhejiang, and a few areas in the east of Jiangxi, including Wuyi, Daiyun, Nanling, Central, and Wuzhi Mountains.

3.5. Potential Distribution Area in the Past

Our models predicted, during the LIG, the area of the middle–highly suitable habitats increased slightly compared with modern times, which was 369,965 km2, which is a growth of 7.38%. The original highly suitable habitats area of Hainan, Northeast Guangdong, and midwest Fujian became moderately suitable habitats or even unsuitable; the number of highly suitable areas in Hunan, Taiwan, and Jiangxi increased significantly (Figure 4A). During the LGM, the middle to highly suitable habitats of S. cathayensis decreased significantly, leaving only 118,66 km2, which is only 3.44% of the modern medium-high suitable potential distribution area; the suitability of the suitable habitats at that time was significantly lower, and the original highly suitable habitats became moderately suitable or even unsuitable. The highly suitable habitats only included central and Southern Taiwan (Figure 4B). In the MH, the area of suitable S. cathayensis habitat increased significantly compared with modern times, which was 456,208 km2, with is a growth of 32.41%. The highly suitable habitats in Hainan almost all became moderately suitable habitats, whereas the highly suitable habitats in Guangdong increased significantly. Highly suitable habitats appeared at the junction of Anhui, Zhejiang, and Jiangxi, and the area of low-grade suitable habitats in Yunnan increased slightly (Figure 4C).
By comparing the four maps in Figure 5A–D, the areas that four historical periods were ecological stable the eastern part of Hainan Island and central Taiwan Island. Since the LIG, central and Western Fujian, Eastern Jiangxi, and Northern Guangdong have been stable ecological regions of S. cathayensis, and these regions may be the climate refugia S. cathayensis. In Northern Guangxi, Western Hunan, and Southern Hunan, the LGM and MH were middle–highly suitable S. cathayensis habitats, whereas in modern times, these habitats are low suitable. Combining Figure 2 and Figure 4, we find that these regions, especially Guangxi and Guizhou, will gradually become unsuitable for S. cathayensis.

3.6. Future Changes in Suitable Habitat Area

Our model predicted the suitable habitat of S. cathayensis in four different climate scenarios in the future, and then conducts comparative analysis(Table 3, Figure 4 and Figure 5). The results are as follows:
Under the RCP2.6–2070s emission scenario, the habitats increase the most, by 31.64%, and the new habitats are mainly concentrated in the northwest of central and Western Hunan; the size of the middle–highly suitable habitats is about 419,908 km2, which is an increase of 21.88%, which indicates that many low-growth habitats under this scenario might be replaced by the middle–highly suitable habitats. This is the climate scenario where the future loss of habitat is the least, only 31,110.1 km2, and the loss rate is about 9.04%.
Under the RCP2.6–2050s emission scenario, the least amount of new habitat is added, with an increase rate of about 5.48%. The newly added habitats are mainly concentrated in Hainan Island, and the suitable habitats in other areas decrease, with an area of about 220,149 km2 of middle–highly suitable habitat, about 63.90% of the area in the modern era. The area of suitable habitat loss is about 143,719 km2, the loss rate is about 41.76%, and the main loss habitats are Southern Hunan, Southern Guizhou, and Western, central, and Eastern Guangxi.
The distribution of newly added habitats is also larger under the RCP8.5–2050s emission scenario, but slightly smaller than under the RCP2.6–2070s emission scenario, which is an increase of 24.27%. The newly increased habitats are mainly concentrated in central Hunan and the border area between Hunan and Jiangxi; the middle to highly suitable habitats occupy about 321,938 km2, which is about 93.44% of the modern extent, and the suitable habitats shrink slightly compared with modern times. The habitat loss is large, concentrated in the border area of three provinces, Zhejiang, Anhui, and Jiangxi, and the border area of the two provinces of Guangdong and Jiangxi, about 107,810 km2, which is a loss rate of approximately 31.32%.
Under the RCP8.5–2070s scenario, the loss of habitat is the most severe, about 183,657 km2, which is a loss of 53.36%. The new suitable habitats under this scenario are relatively small, mainly concentrated in Southwestern Hunan, the border region of Hubei and Chongqing, and the border region of Hunan and Jiangxi. The increase is about 9.04%. The suitable habitats in Guangdong and Hainan are almost exhausted, as have the low-suitable habitats in Guangxi and Guizhou. This indicates that S. cathayensis suitable habitats will shrink extremely, and suitable habitat will only remain in most of Fujian and Northeastern Jiangxi under this scenario.

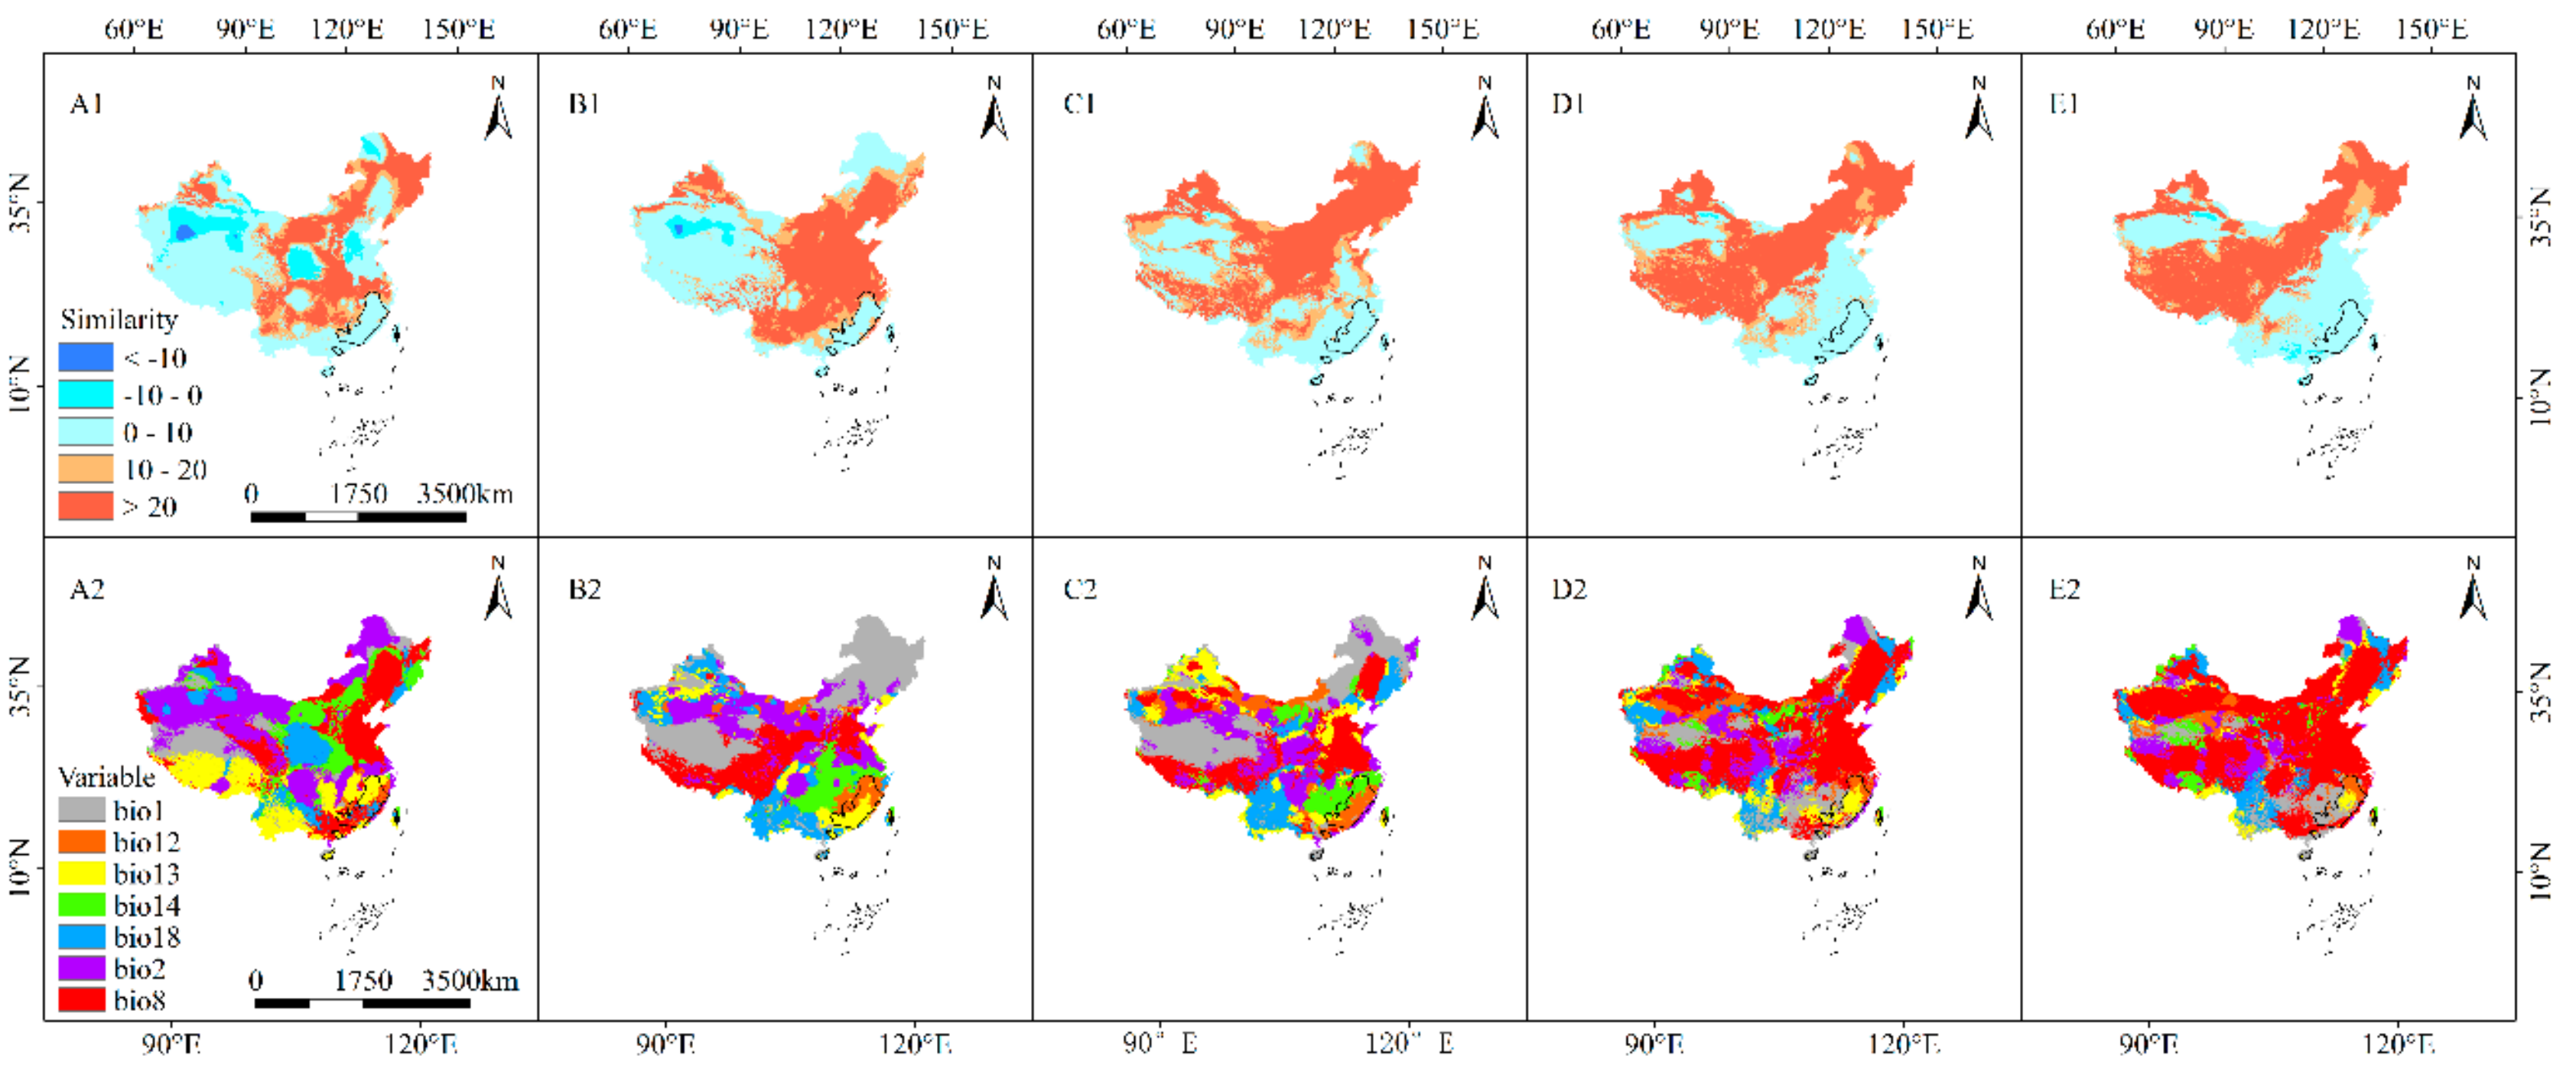
3.7. MESS and MoD Variable Analysis

In LIG, LGM, MH, RCP8.5–2050s, and RCP8.5–2070s, the average multivariate similarities of the 120 modern distribution points of S. cathayensis were 7.63, 10.22, 5.19, 4.21, and 3.45, respectively. Only in the RCP8.5–2070s scenario did a distribution point with a negative multivariate similarity value indicate that the degree of climate anomaly is not optimistic. The most dissimilar variables were precipitation of wettest month, annual precipitation, and annual mean temperature (Figure 6).

3.8. Shift in the Distribution Center of the Suitable Habitat

The current distribution center of S. cathayensis is located at 26°3’32.63” N and 114°50’19.35” E (Figure 7B). The distribution centers of S. cathayensis during the LIG, LGM, and MH were located in Wuping County (24°58’20.01” N, 115°58’2.22” E) in Fujian, Chongyi (25°39’53.85” N,113°56’58.71” E) in Jiangxi, and Guidong in Hunan (25°50’6.83” N, 113°47’3.39” E), respectively. Under RCP2.6, by 2050s, the center of suitable habitats will move northeast to Wan’an County, Jiangxi (26°9’57.07” N, 115°1’59.94” E). The migration distance is 22.78 km; by 2070s, it will move northwest to Suichuan County, Jiangxi (26°6’44.50” N, 114°16’3.93” E), which is a migration distance of 57.43 km. At the same time, it is predicted that under RCP8.5, the center of suitable habitats will move southwest to Shangyou County (25°58’36.44” N, 114° 16’3.93” E) of Jiangxi in 2050s, with a migration distance of 49.25 km, and northeast to Jishui County (27°16’6.24”n, 115°16’53.81” E) of Jiangxi in 2070s, with a migration distance of 141.06 km.

4. Discussion

4.1. Bioclimatic Predictors and Model Performance

In this study, the results showed that the AUC given FC = LQ, RM = 1.5 for the parameter ROC curve was 0.9388, which is higher than that of Atrium brevifrons (0.901) [58], Tags lucida (0.92) [54], Homoia riparia (0.899) [59], and Phenacoccus madeirensis (0.9177) [60], which indicates that the simulation effect of the MaxEnt model of the potential geographical distribution area of S. cathayensis is accurate and reliable. In order to reduce errors, 144 combinations of features in ENMeval data packets were called in R software. In previous similar studies, the ENMeval data package was rarely used for optimization, and even the relevant studies that used ENMeval packets generally considered less than 96 parameter combinations. Therefore, after comparing 144 optimized combinations, the conclusions are relatively accurate [61].

4.2. Changes in Potential Distribution Areas

MaxEnt predicted that the highly suitable S. cathayensis habitat in the LIG was located in the central part of Taiwan Island and the eastern part of Hainan Island, but the suitable habitat was much smaller than that in contemporary times. This may have been caused by weather instability events, such as intense cold events, during the LIG. The average temperature of the extreme coldest month that can be tolerated by S. cathayensis is from 3 to 5 °C. Extreme cold events led to the rapid reduction of the suitable habitats of S. cathayensis. The LIG (120–140 ka) experienced cold events, and the average precipitation of the LIG was 557 mm, which was far lower than the requirements of S. cathayensis, which directly led to the prediction of the suitable habitats of S. cathayensis in the LIG being significantly smaller than currently [32]. Existing plants of the Hamamelis family originated in the eastern subtropical region, with an origin time in about the middle Cretaceous, and the northward diffusion occurred during the Upper Cretaceous, Paleozoic Eocene, and Oligocene. Molecular markers, related leaf fossils, and inflorescences have proven that S. cathayensis originated from the cross between Liquidambar and Altingia. Hainan Island is also an important distribution area for Liquidambar and Altingia [34]. Therefore, we speculate that Hainan Island, and even Southeast Asia, are likely to be important origin centers of S. cathayensis [62,63]. In the last glacial maximum, the Wuyi, Nanling, Hengshan, and Central Taiwan Mountain ranges were the most suitable habitats. It is generally thought that the large-scale climate shock in the last glacial maximum had a huge impact on the distribution of species, rapidly shrinking the distribution of species [64,65]. However, we found that LGM climate had little impact on the distribution of S. cathayensis, which is similar to Larrix laricina [66,67]. The results showed that the simulation error of LGM precipitation is larger than that of temperature, and the distribution of evergreen broad-leaved trees may be more sensitive to low precipitation than to low temperature due to the limitation of precipitation [68,69]. In the south of China, the LGM climate was much drier than the present, and the temperature, solar radiation, and other conditions were more unsuitable for the growth and development of S. cathayensis [70]. In the middle Holocene (MH, 6 ka), the suitable habitat of S. cathayensis was larger than during the other predicted periods, which may be related to the period (8.6–4.4 ka) when the East Asia hydrology created the most suitable habitat during the Holocene (13.1–2.5 ka), whereas the other periods of the Holocene were relatively dry [25]. The average annual temperature in the middle Holocene was slightly higher than that in the modern age, which led to the best survival period of S. cathayensis in the MH. The most suitable habitat for the growth of S. cathayensis obviously expanded to low altitude areas, which may be due to the increase in monsoon areas and precipitation by 10.7% and 18.7% respectively, during the MH compared with that in modern China [71].
The current middle–highly suitable habitat of S. cathayensis is 344,529.9 km2, and the highly suitable habitat is mainly concentrated in the middle and east of Hainan, mountainous areas in the middle and west of Fujian, and the Nanling Mountains in Guangdong. However, many large populations of S. cathayensis can be found in the Shiwandashan Nature Reserve of Guangxi, which is not in line with our expectations [33].
The findings showed that if the climate continues to warm, the potential distribution areas of S. cathayensis will shrink to varying degrees. We simulated the effects of RCP2.6 and RCP8.5 on S. cathayensis for two typical periods: 2050s and 2070s. Among them, under RCP2.6, S. cathayensis will first decrease and then increase; under the RCP8.5, the suitable habitat of S. cathayensis will continue to decrease and will be smaller than current. This result is consistent with the conclusion that, for the endangered plants of the same family Disanthus, the suitable habitats will shrink to different degrees [72]. The most suitable habitat, Nanling Mountain, will gradually shrink, especially in RCP8.5–2070s, with areas in Guangdong and Hainan, and the suitable habitat of S. cathayensis obviously moves northward. S. cathayensis is an excellent landscape tree species. As long as S. cathayensis is located in suitable habitats at present and in the future, many cities in Southern China can introduce S. cathayensis as urban street and ornamental trees.

4.3. Refugia from Climate Change

We classified the climate refugia of S. cathayensis as areas likely to have been or will be suitable from the LIG through to current and until at least the 2050s and 2070s. The Quaternary climate change had a profound impact on the historical space and population dynamics of the ancient S. cathayensis [73]. Although some errors may exist in the distribution during three historical periods since the LIG, we learned that the eastern part of Hainan Island, the central mountains of Taiwan, and Wuyi Mountains provide important biological shelters [74]. By comparing the changes under the five scenarios, the current, RCP2.6–2050s, RCP2.6–2070s, RCP8.5–2050s, and RCP8.5–2070s, we found that the central and western regions of Fujian (especially the Wuyi Mountains), the northeastern part of Jiangxi, and the middle part of Taiwan are middle to highly suitable habitats of S. cathayensis. We think that the above areas will be the future climate refugia for S. cathayensis.
However, we did not identify any distribution of S. cathayensis on Taiwan Island. The flora in Taiwan and mainland China are separated by the Taiwan Strait (200–410 km wide). With no artificial introduction, it is difficult to establish future climate refugia for S. cathayensis in Taiwan. We only predict possible climate refugia. Some of the above areas may not have S. cathayensis because other ecological factors will limit the distribution in these areas [73,75].

4.4. Restriction of Climate Variables on Geographical Distribution

Both the contribution rate and the permutation importance value indicate that the annual mean temperature and the annual precision are the most important variables affecting the distribution of S. cathayensis. The regularized training gain, test gain, and AUC value all indicates that annual precipitation (bio12), precision of wettest month (bio13), and precision of driest month (bio14) are the most important factors restricting the distribution of S. cathayensis. This is consistent with the results of the field surveys, where S. cathayensis populations were found to be mostly distributed on sunny slopes or semi-sunny slopes; with good water and fertilizer conditions; warm, humid, and loose soil; and in woodland environments, indicating that ambient temperature and humidity have a limiting effect on the distribution of S. cathayensis. Therefore, we think that the geographical distribution pattern of S. cathayensis is mainly restricted by two environmental factors: annual mean temperature (bio1, 12.9–29.7 °C) and annual precipitation (bio12, 1239–2940 mm). The results of MaxEnt analysis showed that the temperature and precipitation factors jointly limit the potential distribution pattern of S. cathayensis. The precipitation of driest month (bio14, 20–61 mm) is also one of the important factors affecting the distribution of S. cathayensis, both in terms of actual surveys and in the results of this simulation, as its seeds may decay in over-humid conditions per information from actual surveys or the simulation results.
However, climate factors do not affect the suitable S. cathayensis habitat independently. According to the MEES and MoD analyses, the climate change in RCP8.5–2070s is the most severe, and the suitability S. cathayensis habitat obviously reduces. The most dissimilar variable is annual mean temperature. The climate anomalies of RCP8.5–2050s, MH, LIG, and LGM decreased successively, with the most dissimilar variables being precipitation of wet month and annual precipitation. However, the change in the distribution of S. cathayensis is the result of multiple factors (especially during the LIG), and temperature and precipitation factors restrict the change in geographical distribution.

4.5. Protection of Genetic Resources

For the newly suitable habitats, as they are mostly distributed in the open forests on sunny slopes or semi-sunny slopes, a reasonable and sustainable land use plan should be formulated accordingly, and sufficient space should be reserved for its relocation. The newly suitable habitats are scattered in the marginal areas of the suitable habitats, which should reduce the human interference activities and increase the possibility of the immigration of S. cathayensis. The fruit of S. cathayensis is a capsule and its seeds are flat, light, and less viability, so artificial migration is required with its diffusion and colonization [76].
For the loss of suitable habitats, ex situ conservation measures should be taken, botanical gardens and core germplasm banks should be established, and S. cathayensis should be transplanted into an artificial environment for cultivation, conservation, and preservation. In addition, in situ protection is also important for the populations in the loss of suitable habitats, especially the small populations such as Leigong Mountain, Taiping Mountain, Yueliang Mountain, Le’an county, and Fanjing Mountain [77].
For the reserved suitable habitats can be protected to provide a safe place and refuge for S. cathayensis to cope with future climate change. Therefore, more attention should be paid to the protection and management of reserved areas. Establishing a nature reserve is the most effective method to protect rare and endangered wildlife resources in situ. At present, S. cathayensis protection forests have been established in Wuyi Mountain Nature Reserve, Jianfengling Nature Reserve, Dutianhe Nature Reserve, and Taiping Mountain Nature Reserve [33,34]. However, no protection measures have been taken in Liancheng, Shiwandashan, or Shaxian counties, where S. cathayensis is concentrated. The above areas can be prioritized as protected habitats for S. cathayensis.
In our team’s field survey, S. cathayensis was rarely found to be concentrated; most of them were scattered or in isolated islands scattered in each mountain area, which complicates finding the distribution point of S. cathayensis, building its core germplasm resource bank, and protecting this important endangered plant. Our findings can provide basic reference data for these tasks.

5. Conclusions

In this study, the MaxEnt model was used to predict the response of the distribution pattern of S. cathayensis to climate change since the LIG, and to simulate the impact of climate change on its future distribution range under two representative concentration paths (RCP2.6 and RCP8.5). The results showed that S. cathayensis may have been formed by the differentiation of Liquidambar formosana and Altingia chinensis from the hybrid origin in Hainan Island to the present flora in South China. In the LIG, the most suitable habitats for the growth of S. cathayensis included the central part of Taiwan Island and the eastern part of Hainan Island, but the distribution range during the LGM was larger than that during the LIG. In the future, except for RCP2.6–2070s, the middle to highly potential suitable of S. cathayensis are predicted to shrink to different degrees, especially under the high emission scenario of RCP8.5–2070s, which is predicted to shrink by nearly 50%. In addition, we identified refugia for S. cathayensis under the future climate. These findings provide an important reference for the development of climate change adaptation strategies for S. cathayensis.

Supplementary Materials

The following are available online at https://www.mdpi.com/1999-4907/11/4/434/s1, Table S1: Point of distribution of Semiliquidambar cathayensis; Table S2: ENMeval-resultest.

Author Contributions

Author Contributions: Conceptualization, X.-z.Y., G.-h.Z., M.-z.Z., H.-h.F. and B.L.; Data curation, X.-z.Y., G.-h.Z. and M.-z.Z.; Formal analysis, X.-z.Y., G.-h.Z., M.-z.Z., and B.L.; Funding acquisition, H.-h.F. and B.L.; Investigation, X.-z.Y., G.-h.Z., M.-z.Z., H.-h.F. and B.L.; Methodology, X.-z.Y., G.-h.Z. and B.L.; Project administration, W.L., H.S. and X.-y.C.; Resources, X.-z.Y., G.-h.Z., M.-z.Z., H.-h.F. and B.L; Software, X.-z.Y., G.-h.Z. and M.-z.Z.; Supervision, H.-h.F.; B.L. and X.-z.Y.; Validation, X.-z.Y., G.-h.Z., M.-z.Z., H.-h.F. and B.L.; Visualization, X.-z.Y., G.-h.Z. and M.-z.Z.; Writing—original draft, X.-z.Y. and G.-h.Z.; Writing—review and editing, X.-z.Y., G.-h.Z., M.-z.Z., H.-h.F. and B.L. All authors have read and agreed to the published version of the manuscript.

Funding

This study was supported by the Third Round of Seed Industry Innovation and Industrialization Project in Fujian Province—the Germplasm Innovation and Industrialization Project for the special species Lindera communis and Semiliquidambar cathayensis (ZYCX-LY-2017002).

Acknowledgments

We are particularly grateful to the editor, chief editors and anonymous reviewers for their valuable comments on the manuscript. The authors thank Chenhua Lei, Dan Liu, Xiangsheng Li, Miaoqing Wang, Yinglin Li, Xinghao Tang, Tianyu Zhang, Shengsheng Tong, Kailin Yao, Wangli Yang, Shengfen Lu, and Lanyin Yao for assistance in the field and with locating populations.

Conflicts of Interest

The authors declare no competing interests.

References

  1. Waldvogel, A.M.; Feldmeyer, B.; Rolshausen, G.; Exposito-Alonso, M.; Rellstab, C.; Kofler, R.; Mock, T.; Schmid, K.; Schmitt, I.; Bataillon, T.; et al. Evolutionary genomics can improve prediction of species’ responses to climate change. Evol. Lett. 2020, 4, 4–18. [Google Scholar] [CrossRef] [PubMed]
  2. Warren, R.; Price, J.; VanDerWal, J.; Cornelius, S.; Sohl, H. The implications of the United Nations Paris Agreement on climate change for globally significant biodiversity areas. Clim. Chang. 2018, 147, 395–409. [Google Scholar] [CrossRef] [Green Version]
  3. Pecl, G.T.; Araujo, M.B.; Bell, J.D.; Blanchard, J.; Bonebrake, T.C.; Chen, I.C.; Clark, T.D.; Colwell, R.K.; Danielsen, F.; Evengard, B.; et al. Biodiversity redistribution under climate change: Impacts on ecosystems and human well-being. Science 2017, 355, 9. [Google Scholar] [CrossRef]
  4. Fackovcova, Z.; Senko, D.; Svitok, M.; Guttova, A. Ecological niche conservatism shapes the distributions of lichens: Geographical segregation does not reflect ecological differentiation. Preslia 2017, 89, 63–85. [Google Scholar] [CrossRef]
  5. Martinez-Freiria, F.; Velo-Anton, G.; Brito, J.C. Trapped by climate: Interglacial refuge and recent population expansion in the endemic Iberian adder Vipera seoanei. Divers. Distrib. 2015, 21, 331–344. [Google Scholar] [CrossRef]
  6. Zhang, Y.Z.; Zhu, R.W.; Zhong, D.L.; Zhang, J.Q. Nunataks or massif de refuge? A phylogeographic study of Rhodiola crenulata (Crassulaceae) on the world’s highest sky islands. BMC Evol. Biol. 2018, 18, 154. [Google Scholar] [CrossRef] [Green Version]
  7. Cubry, P.; De Bellis, F.; Pot, D.; Musoli, P.; Leroy, T. Global analysis of coffea canephora pierre ex froehner (Rubiaceae) from the guineo-congolese region reveals impacts from climatic refugia and migration effects. Genet. Resour. Crop Evol. 2013, 60, 483–501. [Google Scholar] [CrossRef]
  8. Garcia, R.A.; Cabeza, M.; Rahbek, C.; Araujo, M.B. Multiple dimensions of climate change and their implications for biodiversity. Science 2014, 344, 486. [Google Scholar] [CrossRef] [Green Version]
  9. Blois, J.L.; Zarnetske, P.L.; Fitzpatrick, M.C.; Finnegan, S. Climate change and the past, present, and future of biotic interactions. Science 2013, 341, 499–504. [Google Scholar] [CrossRef] [Green Version]
  10. Bennett, K.D.; Provan, J. What do we mean by ‘refugia’? Quat. Sci. Rev. 2008, 27, 2449–2455. [Google Scholar] [CrossRef]
  11. Thomas, C.D. Climate, climate change and range boundaries. Divers. Distrib. 2010, 16, 488–495. [Google Scholar] [CrossRef]
  12. Li, Y.; Zhang, X.W.; Fang, Y.M. Landscape features and climatic forces shape the genetic structure and evolutionary history of an oak species (quercus chenii) in East China. Front. Plant Sci. 2019, 10, 1060. [Google Scholar] [CrossRef] [PubMed]
  13. Walas, L.; Sobierajska, K.; Ok, T.; Donmez, A.A.; Kanoglu, S.S.; Dagher-Kharrat, M.B.; Douaihy, B.; Romo, A.; Stephan, J.; Jasinska, A.K.; et al. Past, present, and future geographic range of an oro-Mediterranean Tertiary relict: The juniperus drupacea case study. Reg. Envir. Chang. 2019, 19, 1507–1520. [Google Scholar] [CrossRef] [Green Version]
  14. Gristwood, A. Red lists, green lists and conservation an interview with Thomas Brooks, chief scientist, international union for the conservation of nature. EMBO Rep. 2020, 21, 4. [Google Scholar] [CrossRef]
  15. Ho, H.C.; Chan, T.C.; Xu, Z.W.; Huang, C.; Li, C. Individual-and community-level shifts in mortality patterns during the January 2016 East Asia cold wave associated with a super El Nino event: Empirical evidence in Hong Kong. Sci. Total Environ. 2020, 711, 135050. [Google Scholar] [CrossRef]
  16. Hu, T.; Sun, Y. Projected changes in extreme warm and cold temperatures in China from 1.5 to 5 °C global warming. Int. J. Climatol. 2019, 3. [Google Scholar] [CrossRef]
  17. Ha, Y.; Zhong, Z.; Zhang, Y.; Ding, J.F.; Yang, X.R. Relationship between interannual changes of summer rainfall over Yangtze River Valley and South China Sea-Philippine Sea: Possible impact of tropical zonal sea surface temperature gradient. Int. J. Climatol. 2019, 39, 5522–5538. [Google Scholar] [CrossRef] [Green Version]
  18. Schipper, A.M.; Posthuma, L.; de Zwart, D.; Huijbregts, M.A.J. Deriving field-based species sensitivity distributions (f-SSDs) from stacked species distribution models (S-SDMs). Environ. Sci. Technol. 2014, 48, 14464–14471. [Google Scholar] [CrossRef] [Green Version]
  19. Prieto-Torres, D.A.; Navarro-Siguenza, A.G.; Santiago-Alarcon, D.; Rojas-Soto, O.R. Response of the endangered tropical dry forests to climate change and the role of Mexican Protected Areas for their conservation. Glob. Change Biol. 2016, 22, 364–379. [Google Scholar] [CrossRef]
  20. La Marca, W.; Elith, J.; Firth, R.S.C.; Murphy, B.P.; Regan, T.J.; Woinarski, J.C.Z.; Nicholson, E. The influence of data source and species distribution modelling method on spatial conservation priorities. Divers. Distrib. 2019, 25, 1060–1073. [Google Scholar] [CrossRef] [Green Version]
  21. Benito, B.M.; Martinez-Ortega, M.M.; Munoz, L.M.; Lorite, J.; Penas, J. Assessing extinction-risk of endangered plants using species distribution models: A case study of habitat depletion caused by the spread of greenhouses. Biodivers. Conserv. 2009, 18, 2509–2520. [Google Scholar] [CrossRef]
  22. Pecchi, M.; Marchi, M.; Burton, V.; Giannetti, F.; Moriondo, M.; Bernetti, I.; Bindi, M.; Chirici, G. Species distribution modelling to support forest management. A literature review. Ecol. Model. 2019, 411, 1–12. [Google Scholar] [CrossRef]
  23. Phillips, S.J.; Dudik, M. Modeling of species distributions with Maxent: New extensions and a comprehensive evaluation. Ecography 2008, 31, 161–175. [Google Scholar] [CrossRef]
  24. Baldwin, R.A. Use of maximum entropy modeling in wildlife research. Entropy 2009, 11, 854–866. [Google Scholar] [CrossRef]
  25. Liu, H.Y.; Qi, X.Z.; Gong, H.B.; Li, L.H.; Zhang, M.Y.; Li, Y.F.; Lin, Z.S. Combined effects of global climate suitability and regional environmental variables on the distribution of an invasive marsh species spartina alterniflora. Estuaries Coasts 2009, 42, 99–111. [Google Scholar] [CrossRef]
  26. Adhikari, D.; Barik, S.K.; Upadhaya, K. Habitat distribution modelling for reintroduction of Ilex khasiana Purk., a critically endangered tree species of northeastern India. Ecol. Eng. 2012, 40, 37–43. [Google Scholar] [CrossRef] [Green Version]
  27. Qin, A.; Liu, B.; Guo, Q.; Bussmann, R.W.; Ma, F.; Jian, Z.; Xu, G.; Pei, S. Maxent modeling for predicting impacts of climate change on the potential distribution of Thuja sutchuenensis Franch., an extremely endangered conifer from southwestern China. Glob. Ecol. Conserv. 2017, 10, 139–146. [Google Scholar] [CrossRef]
  28. Huang, L.L.; Jin, J.H.; Quan, C.; Oskolski, A.A. Mummified Magnoliaceae woods from the upper Oligocene of South China, with biogeography, paleoecology, and wood trait evolution implications. J. Syst. Evol. 2020, 58, 89–100. [Google Scholar] [CrossRef]
  29. Zhang, M.Z.; Jiang, Y.T.; Ye, X.Z.; Chen, S.P.; Fan, H.H.; Liu, B. The complete chloroplast genome of Semiliquidambar cathayensis (Hamamelidaceae). Mitochondrial DNA Part B Resour. 2020, 5, 695–696. [Google Scholar] [CrossRef] [Green Version]
  30. Yagi, H.; Xu, J.; Moriguchi, N.; Miyagi, R.; Moritsuka, E.; Sato, E.; Sugai, K.; Setsuko, S.; Torimaru, T.; Yamamoto, S.; et al. Population genetic analysis of two species of Distylium: D. racemosum growing in East Asian evergreen broad-leaved forests and D. lepidotum endemic to the Ogasawara (Bonin) Islands. Tree Genet. Genomes 2019, 15, 77. [Google Scholar] [CrossRef]
  31. Sun, J.Z.; Zheng, X.L.; Cui, X.Z.; Meng, L. A study of inhibition effects on hepatitis B virus of Semi-cathayensis in vitro. Lishizhen Med. Mater. Med. Res. 2014, 25, 2391–2393. [Google Scholar] [CrossRef]
  32. Li, W.; Shi, M.; Huang, Y.; Chen, K.; Sun, H.; Chen, J. Climatic change can influence species diversity patterns and potential habitats of salicaceae plants in China. Forests 2019, 10, 220. [Google Scholar] [CrossRef] [Green Version]
  33. Shi, Y.C.; Duan, N.; Liu, B.B. Complete chloroplast genome sequence of Semiliquidambar cathayensis (Hamamelidaceae), a rare and endangered species endemic to China. Mitochondrial DNA Part B Resour. 2019, 4, 3252–3253. [Google Scholar] [CrossRef]
  34. Wu, W.; Zhou, R.C.; Huang, Y.L.; Boufford, D.E.; Shi, S.H. Molecular evidence for natural intergeneric hybridization between Liquidambar and Altingia. J. Plant Res. 2010, 123, 231–239. [Google Scholar] [CrossRef] [PubMed]
  35. Hu, J.; Zhao, Z.-G.; Liu, Q.; Chen, B.; Cheng, X.-Y. A New Record of the National Secondary Protection Species—Semiliquidambar cathayensis H. T. Chang in Sichuan Province. J. Sichuan For. Sci. Technol. 2018, 39, 63–65. [Google Scholar] [CrossRef]
  36. Global Biodiversity Information Facility. Available online: https://www.gbif.org (accessed on 2 February 2020).
  37. Specimen Resources Sharing Platform for Education. Available online: http://mnh.scu.edu.cn/main.aspx (accessed on 2 February 2020).
  38. Chinese herbarium of nature. Available online: http://www.cfh.ac.cn (accessed on 2 February 2020).
  39. Chinese Virtual Herbarium. Available online: http://www.cvh.org.cn (accessed on 2 February 2020).
  40. Zhang, K.; Yao, L.; Meng, J.; Tao, J. Maxent modeling for predicting the potential geographical distribution of two peony species under climate change. Sci. Total Environ. 2018, 634, 1326–1334. [Google Scholar] [CrossRef]
  41. Oldfather, M.F.; Kling, M.M.; Sheth, S.N.; Emery, N.C.; Ackerly, D.D. Range edges in heterogeneous landscapes: Integrating geographic scale and climate complexity into range dynamics. Glob. Chang. Biol. 2019, 26, 1055–1067. [Google Scholar] [CrossRef]
  42. Liao, Z.; Zhang, L.; Nobis, M.P.; Wu, X.; Pan, K.; Wang, K.; Dakhil, M.A.; Du, M.; Xiong, Q.; Pandey, B.; et al. Climate change jointly with migration ability affect future range shifts of dominant fir species in Southwest China. Divers. Distrib. 2019, 26, 1–16. [Google Scholar] [CrossRef] [Green Version]
  43. World Clim. Global Climate Data Free Climate Data for Ecological Modeling and GIS. Available online: http://worldclim.org (accessed on 2 February 2020).
  44. Hijmans, R.J.; Cameron, S.E.; Parra, J.L.; Jones, P.G.; Jarvis, A. Very high resolution interpolated climate surfaces for global land areas. Int. J. Climatol. 2005, 25, 1965–1978. [Google Scholar] [CrossRef]
  45. Harris, I.; Jones, P.D.; Osborn, T.J.; Lister, D.H. Updated high-resolution grids of monthly climatic observations-the CRU TS3.10 Dataset. Int. J. Climatol. 2014, 34, 623–642. [Google Scholar] [CrossRef] [Green Version]
  46. Radosavljevic, A.; Anderson, R.P. Making better MAXENT models of species distributions: Complexity, overfitting and evaluation. J. Biogeogr. 2014, 41, 629–643. [Google Scholar] [CrossRef]
  47. Ranjitkar, S.; Xu, J.; Shrestha, K.K.; Kindt, R. Ensemble forecast of climate suitability for the Trans-Himalayan Nyctaginaceae species. Ecol. Model. 2014, 282, 18–24. [Google Scholar] [CrossRef]
  48. Elith, J.; Phillips, S.J.; Hastie, T.; Dudik, M.; Chee, Y.E.; Yates, C.J. A statistical explanation of MaxEnt for ecologists. Divers. Distrib. 2011, 17, 43–57. [Google Scholar] [CrossRef]
  49. Muscarella, R.; Galante, P.J.; Soley-Guardia, M.; Boria, R.A.; Kass, J.M.; Uriarte, M.; Anderson, R.P. ENMeval: An R package for conducting spatially independent evaluations and estimating optimal model complexity for MAXENT ecological niche models. Methods Ecol. Evol. 2014, 5, 1198–1205. [Google Scholar] [CrossRef]
  50. Steen, B.; Cardoso, A.C.; Tsiamis, K.; Nieto, K.; Engel, J.; Gervasini, E. Modelling hot spot areas for the invasive alien plant Elodea nuttallii in the EU. Manag. Biol. Invasions 2019, 10, 151–170. [Google Scholar] [CrossRef] [Green Version]
  51. Guevara, L.; Gerstner, B.E.; Kass, J.M.; Anderson, R.P. Toward ecologically realistic predictions of species distributions: A cross-time example from tropical montane cloud forests. Glob. Chang. Biol. 2018, 24, 1511–1522. [Google Scholar] [CrossRef]
  52. Velasco, J.A.; Gonzalez-Salazar, C. Akaike information criterion should not be a “test” of geographical prediction accuracy in ecological niche modelling. Ecol. Inform. 2019, 51, 25–32. [Google Scholar] [CrossRef]
  53. Phillips, S.J.; Anderson, R.P.; Schapire, R.E. Maximum entropy modeling of species geographic distributions. Ecol. Model. 2006, 190, 231–259. [Google Scholar] [CrossRef] [Green Version]
  54. Kurpis, J.; Serrato-Cruz, M.A.; Arroyo, T.P.F. Modeling the effects of climate change on the distribution of Tagetes lucida Cav. (Asteraceae). Glob. Ecol. Conserv. 2019, 20, 11. [Google Scholar] [CrossRef]
  55. Li, Y.; Zhang, X.W.; Fang, Y.M. Responses of the distribution pattern of Quercus chenii to climate change following the Last Glacial Maximum. Chin. J. Plant Ecol. 2016, 40, 1164–1178. [Google Scholar] [CrossRef] [Green Version]
  56. Dhyani, S.; Kadaverugu, R.; Dhyani, D.; Verma, P.; Pujari, P. Predicting impacts of climate variability on habitats of Hippophae salicifolia (D. Don) (Seabuckthorn) in Central Himalayas: Future challenges. Ecol. Inform. 2018, 48, 135–146. [Google Scholar] [CrossRef]
  57. Elith, J.; Kearney, M.; Phillips, S. The art of modelling range-shifting species. Methods In Ecol. Evolution 2010, 1, 330–342. [Google Scholar] [CrossRef]
  58. Li, Y.; Cao, W.; He, X.Y.; Chen, W.; Xu, S. Prediction of suitable habitat for lycophytes and ferns in northeast China: A case study on athyrium brevifrons. Chin. Geogr. Sci. 2019, 29, 1011–1023. [Google Scholar] [CrossRef] [Green Version]
  59. Yi, Y.J.; Cheng, X.; Yang, Z.F.; Zhang, S.H. Maxent modeling for predicting the potential distribution of endangered medicinal plant (H. riparia Lour) in Yunnan, China. Ecol. Eng. 2016, 92, 260–269. [Google Scholar] [CrossRef]
  60. Wei, J.F.; Li, X.Z.; Lu, Y.Y.; Zhao, L.; Zhang, H.F.; Zhao, Q. Modeling the potential global distribution of phenacoccus madeirensis green under various climate change scenarios. Forests 2019, 10, 773. [Google Scholar] [CrossRef] [Green Version]
  61. Sony, R.K.; Sen, S.; Kumar, S.; Sen, M.; Jayahari, K.M. Niche models inform the effects of climate change on the endangered Nilgiri Tahr (Nilgiritragus hylocrius) populations in the southern Western Ghats, India. Ecol. Eng. 2018, 120, 355–363. [Google Scholar] [CrossRef]
  62. Xiang, X.G.; Xiang, K.L.; Ortiz, R.D.; Jabbour, F.; Wang, W. Integrating palaeontological and molecular data uncovers multiple ancient and recent dispersals in the pantropical Hamamelidaceae. J. Biogeogr. 2019, 46, 1–12. [Google Scholar] [CrossRef]
  63. Maslova, N.P.; Kodrul, T.M.; Song, Y.S.; Volkova, L.D.; Jin, J.H. Liquidambar maomingensis sp nov (Altingiaceae) from the late Eocene of South China. Am. J. Bot. 2015, 102, 1356–1370. [Google Scholar] [CrossRef] [Green Version]
  64. Jiang, X.L.; Xu, G.B.; Deng, M. Spatial genetic patterns and distribution dynamics of the rare oak quercus chungii: Implications for biodiversity conservation in Southeast China. Forests 2019, 10, 13. [Google Scholar] [CrossRef] [Green Version]
  65. Pellissier, L.; Eidesen, P.B.; Ehrich, D.; Descombes, P.; Schonswetter, P.; Tribsch, A.; Westergaard, K.B.; Alvarez, N.; Guisan, A.; Zimmermann, N.E.; et al. Past climate-driven range shifts and population genetic diversity in arctic plants. J. Biogeogr. 2016, 43, 461–470. [Google Scholar] [CrossRef]
  66. Wang, S.; Lu, H.; Han, J.; Chu, G.; Liu, J.; Negendank, J.F.W. Palaeovegetation and palaeoclimate in low-latitude southern China during the Last Glacial Maximum. Quat. Int. 2012, 248, 79–85. [Google Scholar] [CrossRef]
  67. Napier, J.D.; Fernandez, M.C.; de Lafontaine, G.; Hu, F.S. Ice-age persistence and genetic isolation of the disjunct distribution of larch in Alaska. Ecol. Evol. 2020, 10, 1692–1702. [Google Scholar] [CrossRef] [PubMed] [Green Version]
  68. Xu, Y.; Shen, Z.; Ying, L.; Zang, R.; Jiang, Y. Effects of current climate, paleo-climate, and habitat heterogeneity in determining biogeographical patterns of evergreen broad-leaved woody plants in China. J. Geogr. Sci. 2019, 29, 1142–1158. [Google Scholar] [CrossRef] [Green Version]
  69. Waltari, E.; Hijmans, R.J.; Peterson, A.T.; Nyari, A.S.; Perkins, S.L.; Guralnick, R.P. Locating pleistocene refugia: Comparing phylogeographic and ecological Niche model predictions. PloS ONE 2007, 2, 11. [Google Scholar] [CrossRef] [Green Version]
  70. Feng, G.; Mao, L.; Sandel, B.; Swenson, N.G.; Svenning, J.-C. High plant endemism in China is partially linked to reduced glacial-interglacial climate change. J. Biogeogr. 2016, 43, 145–154. [Google Scholar] [CrossRef]
  71. Tian, Z.P.; Jiang, D.B. Mid Holocene and last glacial maximum changes in monsoon are and precipitation over China (in Chinese). Chin. Sei. Bull. 2015, 60, 400–410. [Google Scholar] [CrossRef]
  72. Meng, Y.H.; Xu, X.; Jing, X.L.; Xu, G.B. Potential distribution modeling and analysis of Disanthus Maxim. Actae Ecol. Sin. 2018, 39, 2816–2825. [Google Scholar] [CrossRef]
  73. Morrison, B.D.; Heath, K.; Greenberg, J.A. Spatial scale affects novel and disappeared climate change projections in Alaska. Ecol. Evol. 2019, 9, 12026–12044. [Google Scholar] [CrossRef]
  74. Tian, B.; Fu, Y.; Milne, R.I.; Mao, K.S.; Sun, Y.S.; Ma, X.G.; Sun, H. A complex pattern of post-divergence expansion, contraction, introgression, and asynchronous responses to Pleistocene climate changes in two Dipelta sister species from western China. J. Syst. Evol. 2019, 59, 1–16. [Google Scholar] [CrossRef]
  75. Das, S.; Baumgartner, J.B.; Esperon-Rodriguez, M.; Wilson, P.D.; Yap, J.Y.S.; Rossetto, M.; Beaumont, L.J. Identifying climate refugia for 30 Australian rainforest plant species, from the last glacial maximum to 2070. Landsc. Ecol. 2019, 34, 2883–2896. [Google Scholar] [CrossRef]
  76. Zhao, H.R.; Hua, L.T.; Hong, Y.L.; Tao, L.; De, Q.P. Analysis of the Endangered causes of Semiliquidambar cathayensis H.T. Chang in Guizhou Province. Guizhou For. Sci. Technol. 2014, 42, 34–36. [Google Scholar]
  77. Shen, Y.M.; Jin, L.H.; Zhi, X.T.; Hou, L.W.; Wen, Q.T.; Jian, H.C. Studies on the rare, endangered and national key protected plants at Tianxin Natrual Reserves of Lianzhou, Guangdong. J. Guangzhou Univ. (Nat. Sci. Ed.) 2013, 12, 29–34. [Google Scholar]
Figure 1. (ad) photos of Semiliquidambar cathayensis in the field; staminate flower: ① and ④, pistillate flower: ②, ③ and ⑤, fruit: ⑥; (e) distribution records of Semiliquidambar cathayensis in China.
Forests 11 00434 g001
Figure 2. Response curves of eight environmental predictors used in the ecological niche model for S. cathayensis. (a): bio1; (b): bio2; (c): bio8; (d): bio12; (e): bio13; (f): bio14; (g): bio18.
Forests 11 00434 g002
Figure 3. Jackknife test of the importance of variables. Blue, green, and red bars represent running the MaxEnt model with the variable alone, without the variable, and with all variables, respectively. (a): regularization training gain,; (b): test gain; (c): AUC.
Forests 11 00434 g003
Figure 4. Potential distribution of S. cathayensis during different periods predicted by the MaxEnt model. (A) the last interglacial (LIG), (B) the last glacial maximum (LGM), (C) middle Holocene(MH), (D) current, (E) Representative Concentration Pathways (RCP)2.6–2050, (F) RCP8.5–2050, (G) RCP2.6–2070, and (H) RCP8.5–2070; ①Hainan province; ②Guangdong province; ③Taiwan province; ④Guangxi province; ⑤Yunnan province; ⑥Fujian province; ⑦Guizhou province; ⑧Hunan province; ⑨Jiangxi province; ⑩Zhejiang province.
Forests 11 00434 g004
Figure 5. The spatial pattern changes of S. cathayensis herbivore in different periods. (A) LIG, (B) LGM, (C) MH, (D) current, (E) RCP2.6–2050, (F) RCP8.5–2050, (G) RCP2.6–2070, and (H) RCP8.5–2070. The name of the serial number(①–⑩) is the same as in Figure 4.
Forests 11 00434 g005
Figure 6. Multi-Environment Similarity Surface (MESS) and the Most Dissimilar (MoD) variable analysis for S. cathayensis during different periods. The solid line represents the outline of modern suitable area. (A1) MESS and (A2) MoD for the LIM; (B1) MESS for and (B2) MoD for the LGM; (C1) MESS and (C2) MoD for MH; (D1) MESS and (D2) MoD for RCP8.5–2050s; and (E1) MESS and (E2) MoD for RCP8.5–2070s.
Forests 11 00434 g006
Figure 7. (A) Predicted current distribution model and (B) the core distribution shifts under eight climate scenarios/years for S. cathayensis. Arrows indicate the magnitude and direction of predicted change over time.
Forests 11 00434 g007
Table 1. Environmental variables and their contributions and suitable value ranges.
CodeEnvironmental VariableUnitPercent ContributionPermutation Importance
bio1Annual mean temperature10 °C37.325.9
bio2Mean diurnal range10 °C238.2
bio12Annual precipitationmm17.825.1
bio14Precipitation of driest monthmm10.910
bio8Mean temperature of wettest quarter10 °C6.613.4
bio18Precipitation of warmest quartermm2.66.6
bio13Precipitation of wettest monthmm1.910.9
Table 2. Evaluation metrics of maximum entropy (MaxEnt) model generated by ENMeval.
TypeFCRMOR10Δ AICcMean AUCavg.diff.AUC
defaultLQPHT10.1647353.5450.88550.020149
optimizedLQ1.50.13541500.93880.0198
FC: Feature Combination; RM: Regulatory Multiplier; OR10:10% training omission rate; AICc: the Akaike Information Criterion corrected; AUC: The area under the subject curve. The MaxEnt model provides 5 features, which are linear features (L), quadratic features (Q), segmented features (H), product features (P).
Table 3. Change rate of S. cathayensis living area in different periods (%).
ItemLIGLGMMH2050s2070s
RCP2.6RCP8.5RCP2.6RCP8.5
Unchanged rate2.33%79.65%91.78%57.98%69.13%90.81%46.41%
Contraction rate−1.12%−27.53%−40.81%−41.76%−31.32%−9.04%−53.36%
Expansion rate97.75%20.31%7.85%5.48%24.27%31.64%9.04%

