Article

Twenty-Five Years after Stand Thinning and Repeated Fertilization in Lodgepole Pine Forest: Implications for Tree Growth, Stand Structure, and Carbon Sequestration

by
Thomas P. Sullivan
1,*,
Druscilla S. Sullivan
2,
Pontus M.F. Lindgren
2,
Douglas B. Ransome
2 and
Lisa Zabek
3
1
Department of Forest and Conservation Sciences, Faculty of Forestry, University of British Columbia, 2424 Main Mall, Vancouver, BC V6T 1Z4, Canada
2
Applied Mammal Research Institute, 11010 Mitchell Ave., Summerland, BC V0H 1Z8, Canada
3
Ministry of Agriculture, 441 Columbia Street, Kamloops, BC V2C 2T3, Canada
*
Author to whom correspondence should be addressed.
Forests 2020, 11(3), 337; https://doi.org/10.3390/f11030337
Submission received: 22 January 2020 / Revised: 5 March 2020 / Accepted: 13 March 2020 / Published: 18 March 2020
(This article belongs to the Special Issue Application of Innovative Silvicultural Treatments in Pine Forests)

Abstract

:
Silvicultural practices such as pre-commercial thinning (PCT) and repeated fertilization have been used successfully around the world to increase forest biomass for conventional wood products, biofuels, and carbon sequestration. Two complementary studies were designed to test the hypotheses (H) that large-scale PCT and PCT with repeated fertilization of young (13–17 years old) lodgepole pine (Pinus contorta var. latifolia) stands, at 25 years after the onset of treatments, would enhance (H1) productivity and structural features (diameter and height growth, crown volume and dimensions) of crop trees; (H2) merchantable volume of crop trees, (H3) abundance of understory conifer, herb and shrub layers, and (H4) carbon storage (sequestration) of all layers. Results are from two studies in south-central British Columbia, Canada. The PCT study had three densities: 500, 1000, and 2000 stems/ha, an unthinned, and old-growth stand replicated at three areas. The PCT-FERT study had four densities: 250, 500, 1000, and 2000 stems/ha with and without a repeated fertilization treatment, and an unthinned-unfertilized stand, replicated at two areas. Heavily thinned (≤1000 stems/ha) and fertilized stands generally had larger mean diameters and crown dimensions than lightly thinned or unfertilized stands, whereas mean heights of crop trees remained relatively unaffected, and hence partial support for H1. Despite differences in stand density (4- and 8-fold) of original crop trees, ingress of intermediate crop trees over the 25 years changed density dramatically. There was no support for H2, as mean merchantable volume of total crop trees was similar across stand densities owing to ingress, and was also similar in fertilized and unfertilized stands. In stands thinned to ≤500 trees/ha, there is an anticipated increase in crop tree density of 2.2 to 4.3 times over 25 years compared with the original post-thinning densities. Mean abundance of understory conifers was generally similar among stands owing to successional development towards canopy closure, whereas herbs and shrubs persisted only in canopy gaps in heavily thinned stands, thereby providing no support for H3. Mean carbon storage was similar across densities in both studies with ingress contributing a considerable amount to carbon sequestration at the lower densities. Fertilization increased (1.4 times) mean carbon storage significantly among total crop trees, total conifers, and the grand total of all layers, thereby providing partial support for H4. Thus, much of the potential above-ground carbon storage lost by thinning was restored in the heavily thinned stands at 25 years post-treatment.

1. Introduction

Forest biomass production is being increased to meet the global demand for wood products, wood fiber for bioenergy production, and carbon sequestration to help mitigate greenhouse gas emissions [1,2]. Concurrent with this production imperative are conservation strategies that seek to increase the size of protected areas, restore old-growth structural attributes, and conserve forest biodiversity [3]. In addition, there is an ongoing and unpredictable loss of forest cover from wildfire, insect outbreaks, windthrow, land clearing, and drought [4,5,6,7]. The silvicultural practices of stand thinning and fertilization have been used successfully around the world to increase biomass production in existing forests [8,9]. Intensive silviculture using these treatments is conducted in northern Europe [10,11], and North America in general [12,13,14,15,16]. Lodgepole pine (Pinus contorta Dougl. ex Loud. var. latifolia Engelm.) stands in inland areas of the Pacific Northwest (PNW) of North America have been the focus of wood production and development of stand structural diversity [17,18,19].
There is much potential for intensive management in young lodgepole pine forests to generate, relatively rapidly, forest biomass in terms of tree growth, development of overstory and understory coniferous stand structure, as well as understory herb and shrub vegetation. Lodgepole pine has a wide ecological amplitude and dominates 26 million ha of forests throughout the PNW of North America, including a large proportion of the interior of British Columbia (BC) [20,21]. Extensive lodgepole pine forests are usually maintained through repeated fire disturbance, and therefore often occupy sites of low-nitrogen status [22]. Positive growth responses to conventional (single) and repeated applications of nitrogen fertilizer have been reported for lodgepole pine [23,24] and other Pinus species [9,25,26].
Because stand thinning and operational-scale repeated fertilization are applied over 10s to 100s of ha, these practices have the potential to significantly increase stand-level biomass in terms of wood production and structural diversity. Positive biomass responses of understory vegetation have been reported following stand thinning [27,28,29,30] and fertilization [31,32]. As discussed by [33], there is a dearth of actual silvicultural treatments designed to grow timber rapidly while simultaneously enhancing other forest values such as biodiversity conservation, old-growth structural attributes, and carbon sequestration. Enhanced biomass production of trees and understory vegetation in sustainably managed forests may help to mitigate climate change by providing a steadily increasing carbon sink [34,35]. As regenerating forests continue to grow, they sequester carbon from the atmosphere during photosynthesis and store it in biomass above- (stem, branches, and leaves) and below-ground (roots). While trees are only one component of carbon storage, they provide 74% of all above-ground terrestrial carbon, and therefore are an important sink for atmospheric carbon dioxide (CO2) [36]. Large trees that are the most prominent structural features of forests, whether old- or second-growth, are considered to be globally important carbon sinks [37,38].
Increasing the productivity of forest stands, stand thinning and fertilization also have the potential to accelerate carbon sequestration as an ecosystem service [39,40,41]. Another major addition to calculations of carbon storage in coniferous trees involves the response of crowns of crop trees to thinning and fertilization. Crown volume of crop trees increased dramatically in heavily (≤1000 stems/ha) thinned stands with fertilization [19] and without fertilization [42] and likely contributed to the substantial diameter growth. Other similar reports for greater crown size and foliage production included thinned-fertilized lodgepole pine [43], thinned versus unthinned stands of western larch (Larix occidentalis Nutt.) [44] and Douglas-fir (Pseudotsuga menziesii var. glauca (Beissn.) Franco) [45,46]. To our knowledge, measurement of crown volume in thinned and fertilized stands for degree of carbon storage in branches and needles has not been done.
Thus, this study was designed to test the hypotheses (H) that large-scale PCT (particularly heavy thinning to ≤1000 stems/ha) and repeated fertilization, at 25 years after the onset of treatments, would enhance: (1) Productivity and structural features (diameter and height growth, tree crown volume and dimensions) of crop trees (those dominant trees destined for harvest); (2) merchantable volume of crop trees; (3) abundance of understory conifer, herb and shrub layers; and (4) carbon storage (sequestration) of all layers.

2. Materials and Methods

2.1. Experimental Design and Study Areas

Data from two separate long-term studies with 25-year datasets in naturally regenerated post-harvest lodgepole pine stands were used to test our study hypotheses: (1) PCT only (1988–2013) and (2) PCT with fertilization (PCT+FERT) (1993–2018). The PCT study was located at each of three regional replicate areas in south-central BC, Canada: Penticton Creek, Kamloops, and Prince George. In 1988, stands were PCT to target densities of 500 (low), 1000 (medium), and 2000 (high) stems/ha, an unthinned stand with densities >3000 stems/ha (unthinned), and an old-growth (120–167 years old) stand (790–1480 stems/ha) (old-growth). Treatments were assigned to stands in a randomized complete block design. Unfortunately, overstory trees at the Kamloops and Prince George areas were devastated by the mountain pine beetle (MPB) (Dendroctonus ponderosae Hopk.) in 2005. The Penticton area was unaffected, and hence represents an undisturbed replicate block to be combined with the 25-year period of two replicate blocks in the PCT+FERT study.
The PCT+FERT study had four densities: 250 (very low), 500 (low), 1000 (medium), and 2000 stems/ha (high) with and without a repeated fertilization treatment, and an unthinned-unfertilized stand replicated initially at each of three areas: Summerland, Kelowna, and Cariboo. Treatments were assigned to stands in a randomized complete block design. Unfortunately, the Cariboo replicate was decimated by MPB in 2005, and hence was not part of this study. The Summerland area was essentially unaffected by MPB and represented an undisturbed complete replicate block over the 25-year period. An epidemic of MPB in 2008, and a ground fire in 2009, resulted in partial disturbance of the Kelowna area, leaving small (≤0.50 ha) “islands” of relatively undisturbed forest. These stands provided supplemental data for those datasets collected from the Summerland area. The unthinned and old-growth pine stands acted as controls for the managed stands in both studies.
Pruning (3-m lift) was done in the low-density stand at Penticton in 1992 and in all stands with densities <2000 stems/ha in 1998 in the Summerland and Kelowna areas. For the purposes of this paper, data from Penticton, Summerland, and Kelowna were utilized to yield n = 3 replicate stands for the PCT study and n = 2 (Summerland and Kelowna) replicate stands for the PCT+FERT study.
The Penticton Creek study area is located 15 km northeast of Penticton (49°34′ N; 119°27′ W). All stands were located in the dry and cool Interior Douglas-fir (IDFdk) biogeoclimatic zone [47], were 0.2–2.3 km apart, ranged in area from 20 ha (each of the thinned stands) to 100+ ha (unthinned and old-growth stands), and were 17 years old in 1988. The Summerland study area was located 25 km west of Summerland, BC (49°40′ N; 119°53′ W), and the Kelowna study area 37 km northwest of Kelowna, BC (50°04′ N; 119°34′ W) in the dry and mild Montane Spruce (MSdm) biogeoclimatic subzone [47]. Area of stands ranged from 4.4 to 11.3 ha at Summerland and from 9.5 to 12.6 ha at Kelowna, and all stands were 13 years old in 1993.
Dominant tree species in these stands included lodgepole pine with a minor component of Douglas-fir, interior hybrid spruce (Picea glauca (Moench) Voss X P. engelmannii Parry), subalpine fir (Abies lasiocarpa (Hook.) Nutt.), western larch, trembling aspen (Populus tremuloides Michx.), and black cottonwood (P. trichocarpa Torr. and A. Gray ex. Hook.). Dominant understory vegetation included willow (Salix L. spp.), Sitka alder (Alnus sinuata (Regel) Rydb.), twinflower (Linnaea borealis L.), grouseberry (Vaccinium scoparium Leib. ex. Coville), fireweed (Epilobium angustifolium L.), pine grass (Calamogrostis rubescens L.), and Arctic lupine (Lupinus arcticus S. Wats.).
Characteristics of the stands at each area at 25 years after initiation of treatments are listed in Table 1. Lodgepole pine stands and crowns in 2018 for the Summerland area are illustrated in Figure 1 and Figure 2. Further details of study stands are given in [24,28].

2.2. Density and Fertilization Treatments

The initial treatment was PCT of pine in autumn of 1988 at Penticton (17-year-old stands) and 1993 at Summerland and Kelowna (13-year-old stands). Fertilization treatments were initiated during the fall of 1994 and designed as large-scale optimum nutrition applications using a blended fertilizer formulated to provide 100 kg/ha N (100 N) (urea), 100 kg/ha Phosphorus (100 P), 100 kg/ha Potassium (100 K), 50 kg/ha Sulfur (50 S), 25 kg/ha Magnesium (25 Mg), and 1.5 kg/ha Boron (1.5 B). The objective was to maintain a foliar N level of 1.3%, with foliar levels of all other nutrients in proportional balance with foliar N concentration. The blended product was applied by helicopter at a rate of 906 kg/ha to each of the four fertilized stands at the two study areas. Foliar sampling was conducted in the year after fertilization to monitor the nutrient status of the crop trees and develop appropriate multi-nutrient formulations for subsequent fertilizer applications. Treatments were repeated at two-year intervals for a total of five applications: fall 1994, spring 1997, fall 1998, fall 2000, and spring 2003. One hundred, 200, 150, 150, and 150 for a total of 750 kg N/ha were applied. Other nutrients (Phosphorus, Potassium, Sulfur, Magnesium, and Boron) were applied with Nitrogen as prescribed from the foliar analyses. Complete descriptions of fertilization treatments are provided in [24]. In commercial forests, a typical stand density after pre-commercial thinning is 2000 stems/ha, followed by one fertilization treatment. Our experiment expanded the range of stand densities considerably followed by an optimum nutrition regime of fertilization treatments [23,33]. Typical rotation times for intensively managed stands such as these would be 40–50 years in commercial forests of southern BC.

2.3. Growth and Size of Crop Trees

Diameter, height, and crown dimensions of crop trees were evaluated to determine the 25-year growth response to stand density and fertilization treatments. Merchantable volume and basal area (BA) of stands was estimated to determine the potential economic impact of these treatments. Sampling of lodgepole pine crop trees was done with permanent variable-radius plots, systematically located in each of the four (PCT) and nine (PCT-FERT) young pine stands, to accommodate variations in stand density. Plot density was 20 per managed stand at Penticton (PENT) and ranged from 11 to 29 at Summerland (SUM) and 2 to 3 at Kelowna (KEL) depending on stand area. The 10 crop trees closest to each plot center were permanently tagged in all stands immediately after thinning to represent the “original” crop trees. In the unthinned stands, crop trees (dominant or co-dominant stems of good form) were chosen on the basis that those trees would be left as the future crop if the stand was thinned. Measurement of the total height (m) and dbh (cm) at a permanent reference point was done at the initial sampling period after the growing season in 1988 (PCT-PENT) and 1993 (PCT+FERT-SUM and KEL). Diameter, height, and crown re-measurements were conducted after the growing season in 2013 (PENT) and 2018 (SUM+KEL) to provide 25-year growth responses. Measurement of tree heights in 2013 and 2018 were to the nearest 0.1 m using a digital hypsometer (Forestor Vertex). Height (m) and width (m) of tree crowns were measured for all sample crop trees in every other plot in all stands.
Total and merchantable tree volume were calculated using the equations of [48]. Merchantable volume is total volume minus the volume of the stem below stump height (30 cm) and above the point where the stem has a diameter of 10 cm. At the stand level, total and potentially merchantable volume/ha were estimated by multiplying the mean tree values by an estimate of density (stems/ha) for each stand. Initial stand density was determined immediately following PCT in 1988 and 1993.
Stand densities in 2013 (PENT) and 2018 (SUM+KEL) were estimated based on the observed percentage of dead trees among the permanently tagged crop trees. This estimate of mortality was used to adjust the initial stand density by a percentage assumed to be representative of the mortality experienced throughout a given stand. Although some minor mortality did occur, stand-level estimates of merchantable volume/ha in treatment stands included ingress of large trees (intermediate crop trees) that were added to the residual cohort of lodgepole pine crop trees selected during PCT.
Height (m) and width (m) of tree crowns were measured for all sample crop trees in every other plot in the managed stands, and in every plot in the unthinned and old-growth stands, at each study area. Crown volume (CRVOL) was represented by a cone shape and was calculated by:
CRVOL (m3) = 1/3 ((h) (π r2))
where h = height of crown (m), π = 3.14, and r = one-half diameter of crown at the widest point (m).
In each of the three old-growth stands, ten temporary plots were located every 50 or 100 m in a grid pattern throughout the stand to provide measurements of mean DBH, total top height, and crowns for comparison of tree size dimensions with the young pine stands. The original old-growth stand at Kelowna was harvested in 2015, and no other pine stands were available. Thus, an additional old-growth stand was added at Penticton, in the same MSdm ecological subzone as Kelowna, to replace this lost stand.

2.4. Stand Structure Measurements

Sampling of coniferous tree species in layers in 0–1, 1–2, 2–3, and 3–6 m (understory trees), and >12 m (crop trees) height classes was done in a 5.64-m radius circular plot (100 m2) located in the center of each crop tree plot in fall 2013 and 2018. Understory trees were seedlings (0–1 m), small saplings (1–2 m), or large saplings (2–3 and 3–6 m). To provide estimates of potentially merchantable volume and carbon storage for large ingress trees, two additional height classes (6–9 and 9–12 m) of “intermediate crop trees” were included in the sampling conducted in all stands in 2019. Mean total abundance per ha was calculated for all seven classes. In fall 2013 and 2018, in the interval between the central plot tree and its nearest neighbor, percent canopy closure (CC) was estimated by four spherical densiometer measurements, one in each of the four cardinal directions [49].
Understory vascular plants were sampled on three 25-m transects, consisting of five plots, each containing two sizes of nested subplots: a 3-m × 3-m subplot for sampling shrubs and a 1-m × 1-m subplot for sampling herbs, systematically located in each stand following the method of [32]. Herb and shrub layers were subdivided into six height classes: 0–0.25, 0.25–0.5, 0.5–1.0, 1.0–2.0, 2.0–3.0, and 3.0–5.0 m. A visual estimate of percentage cover of the ground was made for each species height class combination within the appropriate nested subplot by the same observer. These data were then used to calculate crown volume index (m3/0.01 ha) (abundance) for each plant species. The product of percent cover and representative height gives the volume of a cylindroid which represents the space occupied by the plant in the community. Crown volume index values were then averaged by species for each plot size and converted to 0.01-ha base for each species and layer. Sampling was done in July–August 2013 and 2018 and plant species were identified in accordance with [50].

2.5. Estimating Stand-Level Carbon Storage

Mean diameters of original crop trees, intermediate crop trees, and understory conifers in relation to height classes, were used to estimate biomass of trees in all stands. Regression relationships were used to estimate diameters for understory conifers (height classes 0–1, 1–2, 2–3, and 3–6 m) in all stands. There was a strong and significant positive power relationship relating tree height classes to diameter for coniferous trees in thinned (y = 0.3672x1.7137; R2 = 0.94; p < 0.01) and unthinned (y = 0.4087x1.2996; R2 = 0.79; p < 0.01) stands. For all trees, the weighted mean carbon concentration used to convert biomass to carbon content was 53.62% for stems, 53.49% for branches and foliage, and 51.74% for roots [51].
Biomass (kg) of above-ground tree components (stem, branches and foliage) was determined using species-specific equations presented by [52]:
M = aDb
where M = oven dried kg, a and b = parameters, and D = DBH (cm).
Where different equations were available for a specific range of tree sizes (DBH), then the appropriate equations used were based on actual tree size. These calculations were done for all lodgepole pine crop (height class > 12 m), intermediate ingress (height classes 6–9 and 9–12 m), and understory trees (height classes 1 to 4) as per the diameter measurements and distributions noted above. Biomass of other tree species were also calculated using these same relationships.
Estimation of above-ground tree biomass needed to accommodate substantial increases in crown volume of lodgepole pine crop trees in heavily thinned and fertilized stands. Presumably the carbon storage in branches and foliage was greater in these stands than those in the unthinned stands. Therefore, we compared the degree of difference (multiplication factor) from the estimate of mean crown volume of pine crop trees in each treatment stand with that in the unthinned stand at each study area. This factor was then used to adjust the biomass values of the branches and foliage to reflect the differences in crown volume among treatment stands.
Biomass (kg) of total below-ground tree root mass was calculated using the equation: Total root mass = 0.222 x total aboveground biomass (stem + branches + foliage) developed by [53].

2.6. Estimating Biomass for Herbs and Shrubs

Crown volume index of herbs and shrubs approximates the cylindrical space occupied by a plant rather than biomass. Thus, we needed to convert volume to biomass to provide an estimate of carbon storage in these plant layers. Regression equations found strong and significant correlations between crown volume index and biomass for graminoids, total herbs, and for dwarf, low, and tall shrubs [32]. Conversion factors of 41% and 47% were used to estimate carbon content from herb and shrub biomass, respectively [54].

2.7. Statistical Analysis

In the PCT study, a randomized block one-way analysis of variance (ANOVA) [55] was conducted to determine the effect of stand treatment (3 levels of PCT: 500, 1000, and 2000, plus unthinned and old-growth) on mean values for diameter, height, canopy closure, crown volume, merchantable volume, and basal area of crop trees, abundance of understory conifers and vascular plants, and carbon storage (sequestration) of all layers.
In the PCT-FERT study, a two-factor ANOVA was conducted to determine the effects of stand treatments (thinning and fertilization) on these same parameters in the young, managed lodgepole pine stands. To increase replication in the PCT-FERT study, we investigated unfertilized vs. fertilized stands regardless of stand density. This approach to the PCT-FERT analysis increased replication from 2 to 8. Our original experimental design was unbalanced because there were no unthinned, fertilized stands. In addition, we added an old-growth stand at each study area. Therefore, to maintain a balanced design, the unthinned level of the density treatment and the old-growth stand were omitted from all statistical analyses of the PCT-FERT study. Data from stands in both of these treatments are presented in graphs to allow for a visual comparison with managed stands.
Homogeneity of variance was assessed with Levene’s test of equality of error variances. Proportional data were transformed by arcsin square root [56]. Duncan’s multiple range test (DMRT), with multiple contrasts, was used to compare mean values whenever a significant difference was found based on ANOVA results [57]. In all analyses, the level of significance was at least p = 0.05 [58].

3. Results

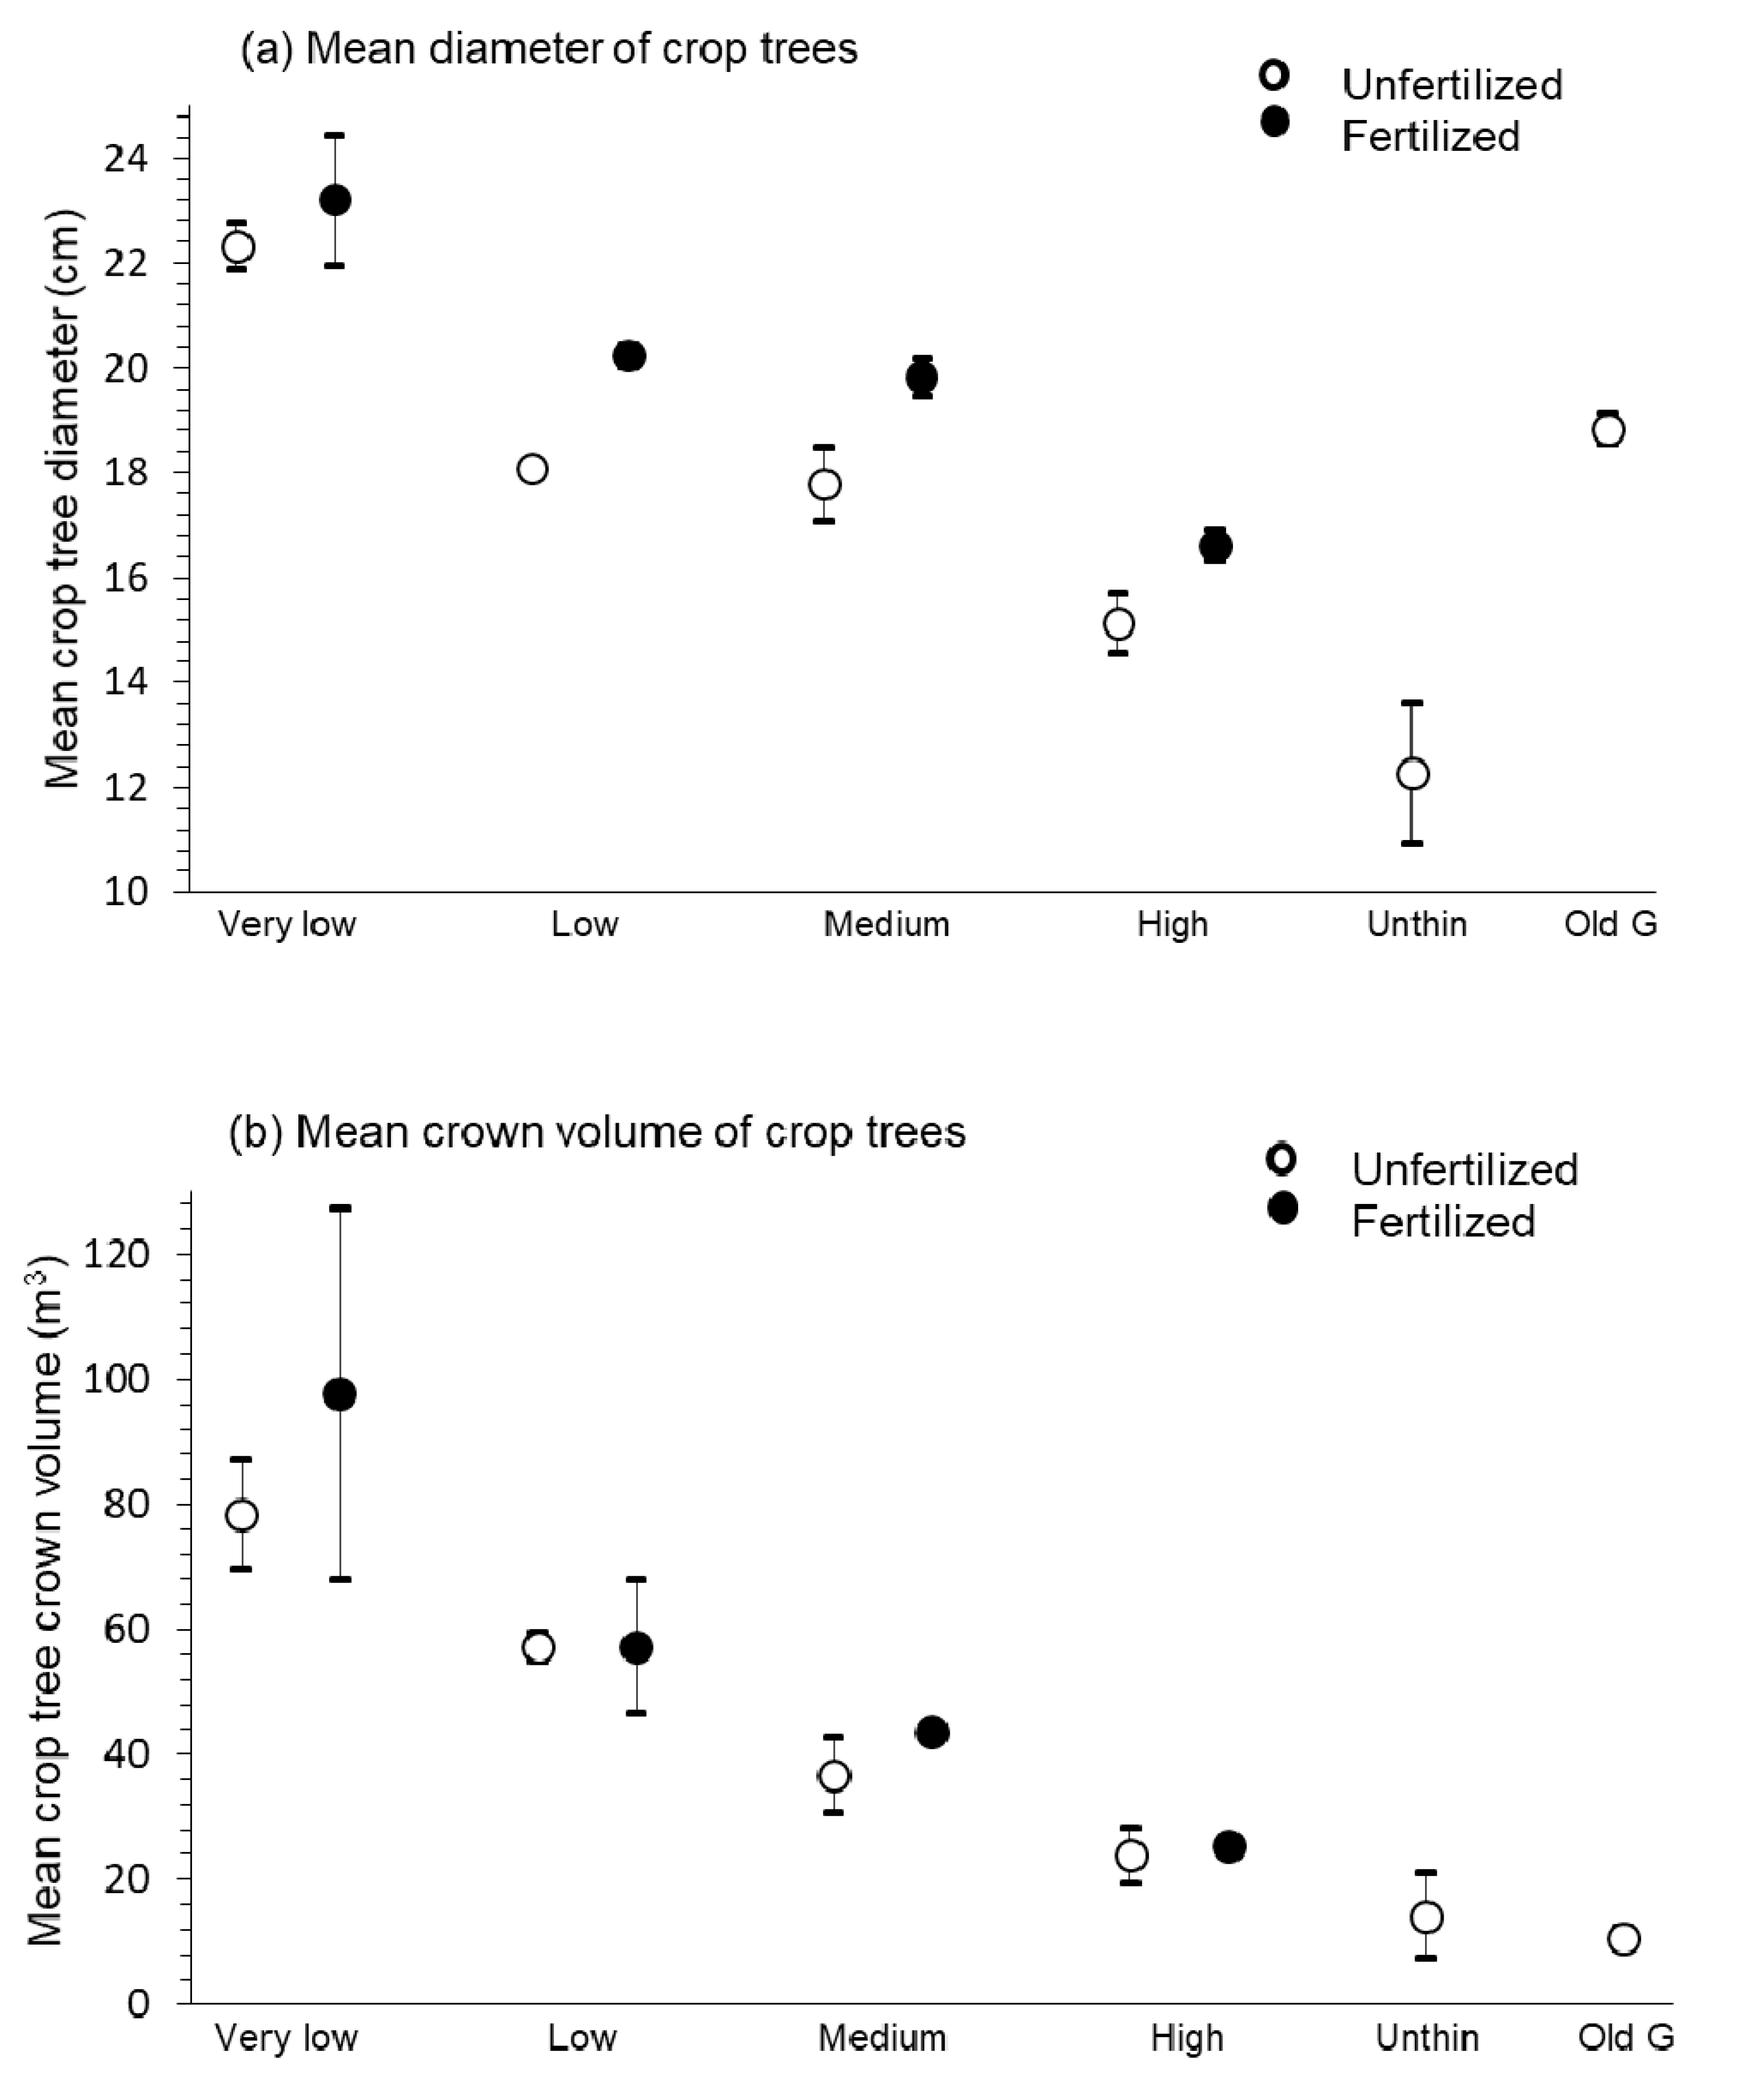
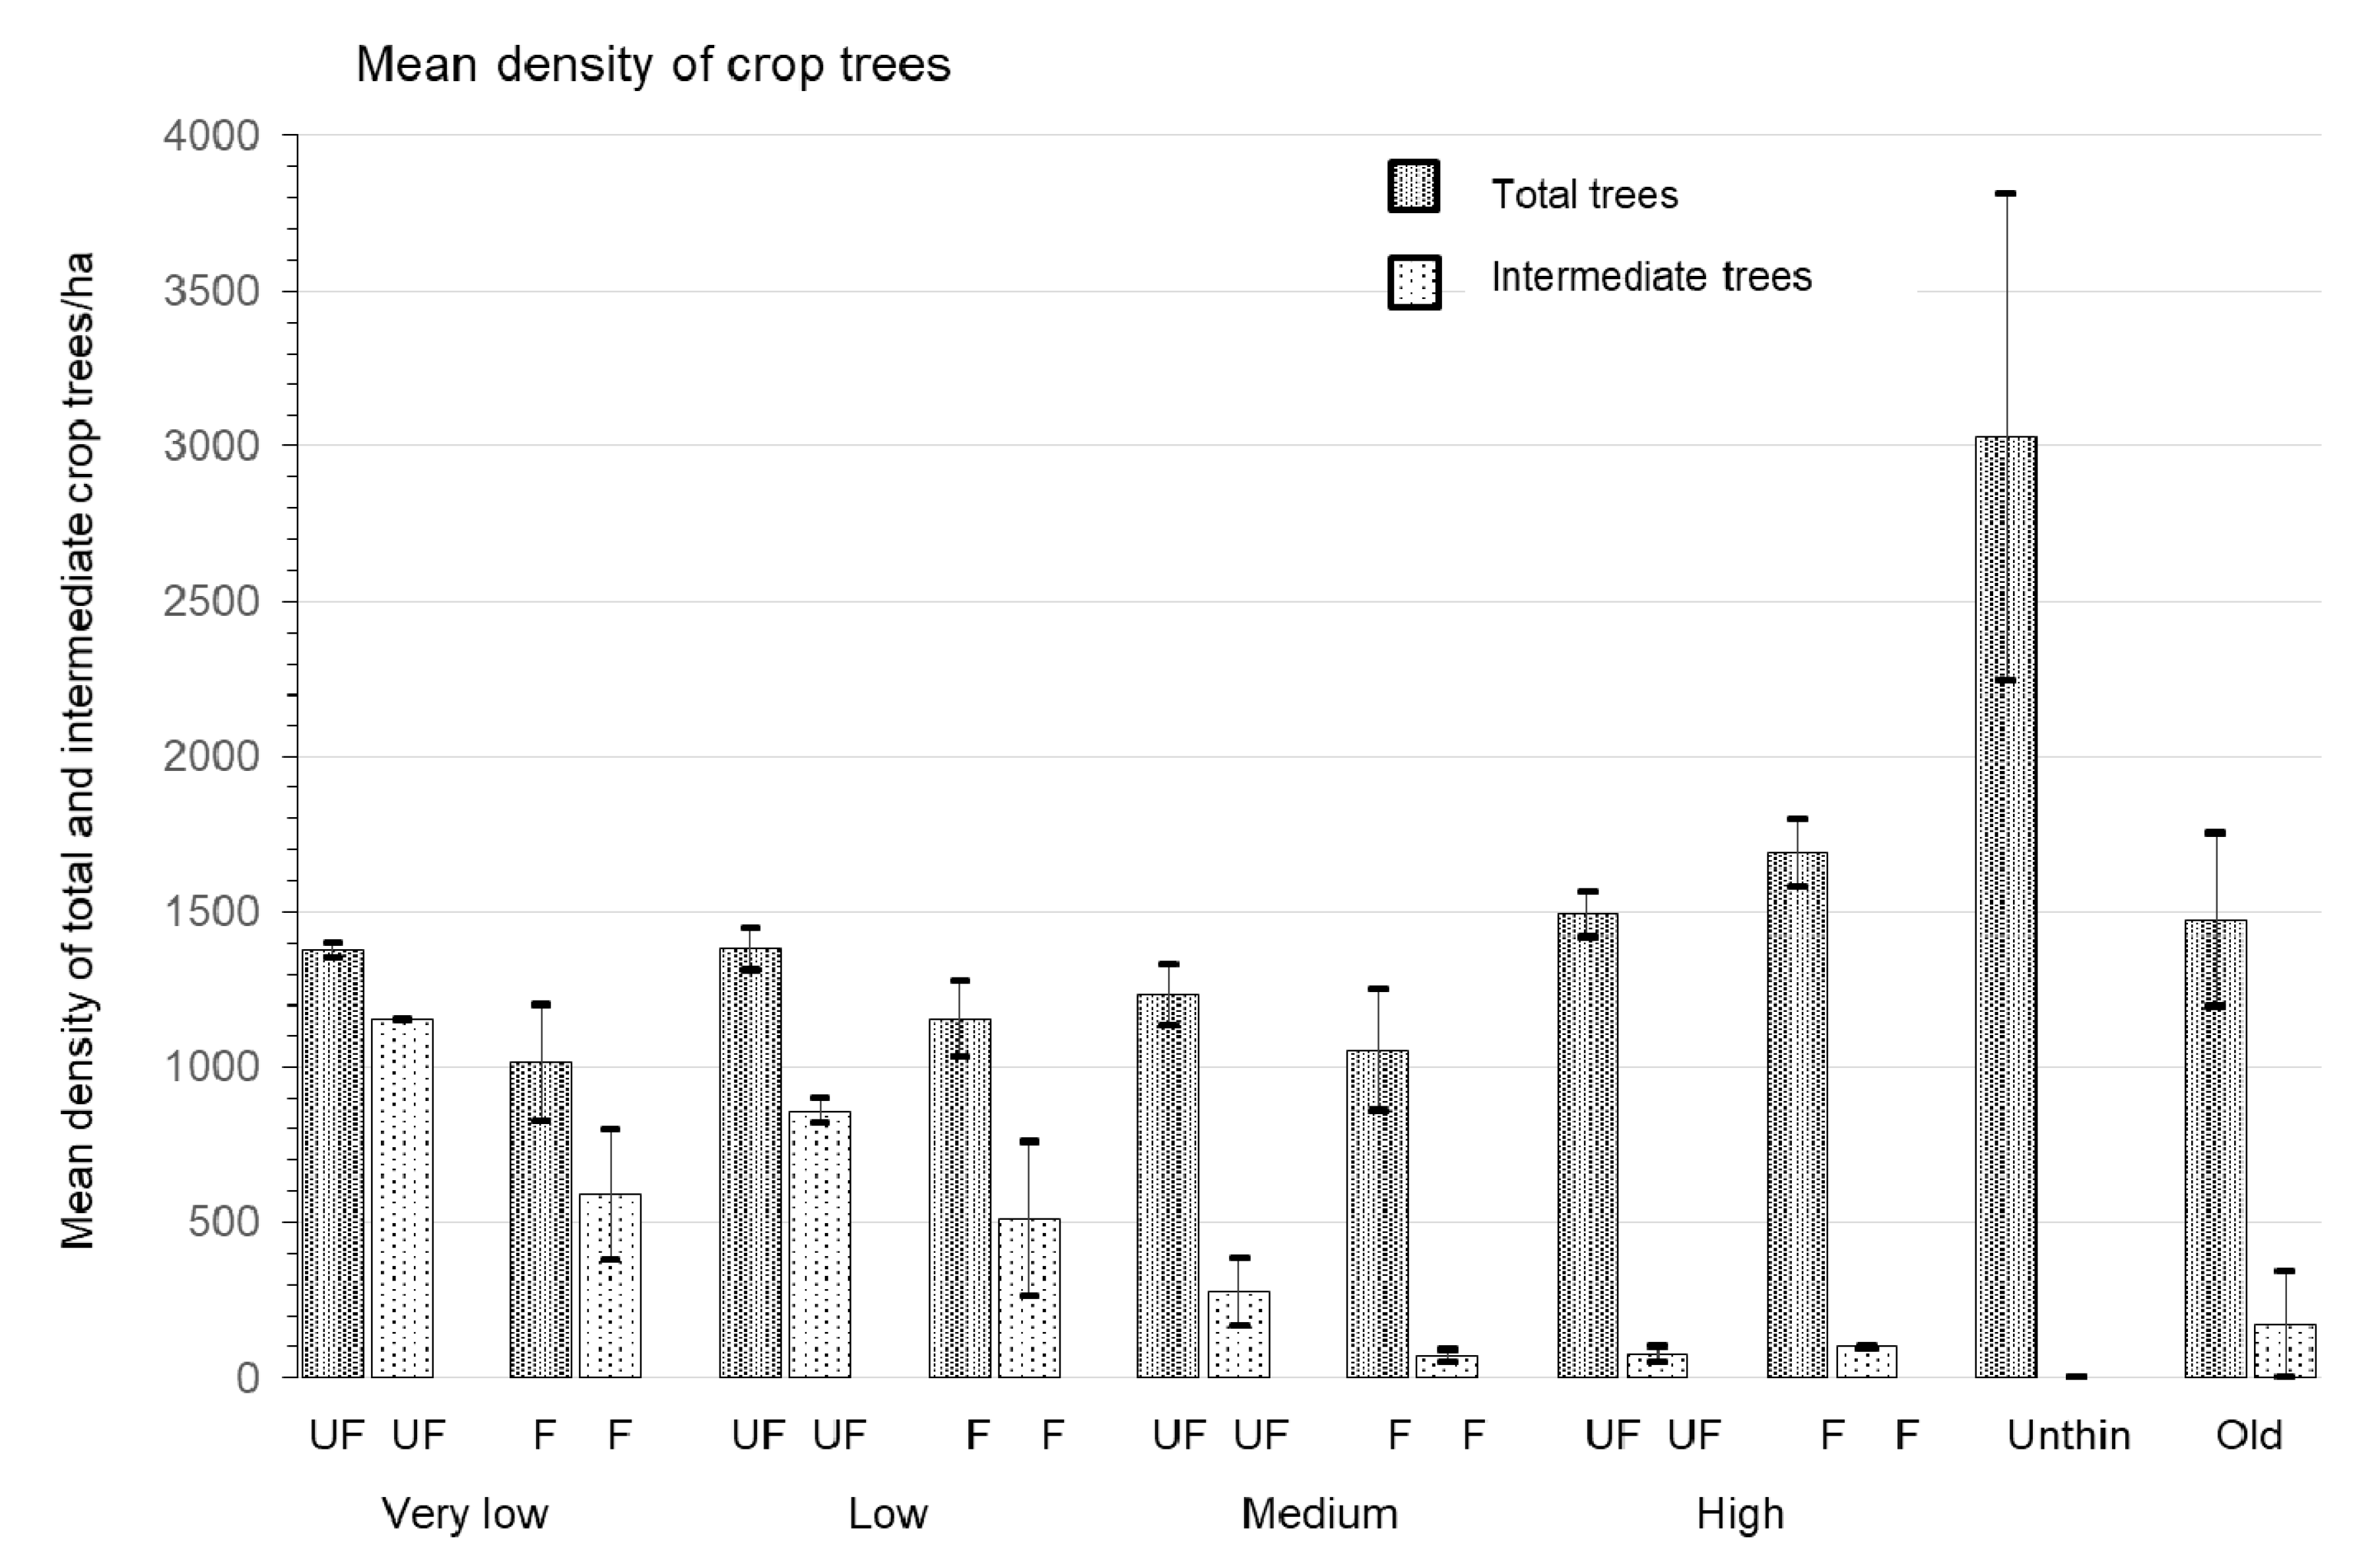
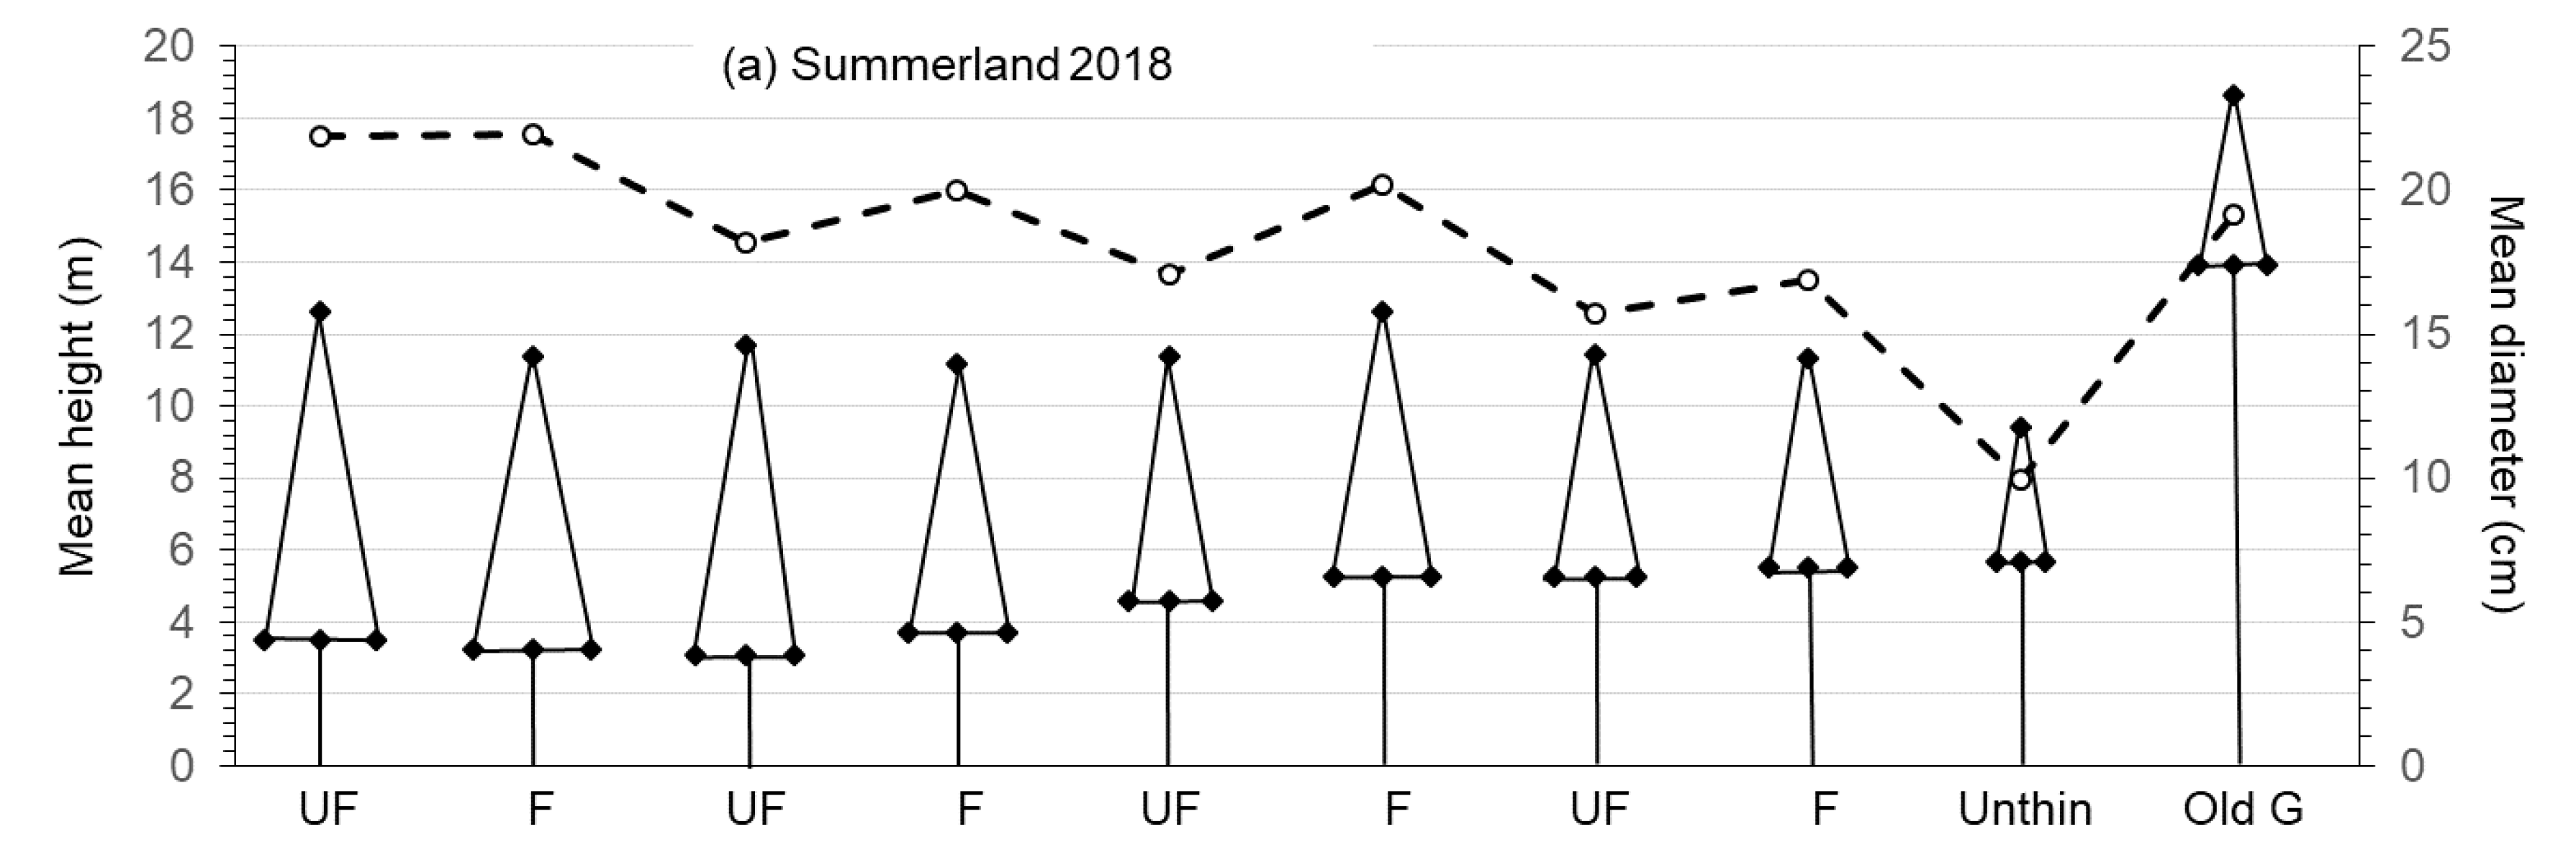
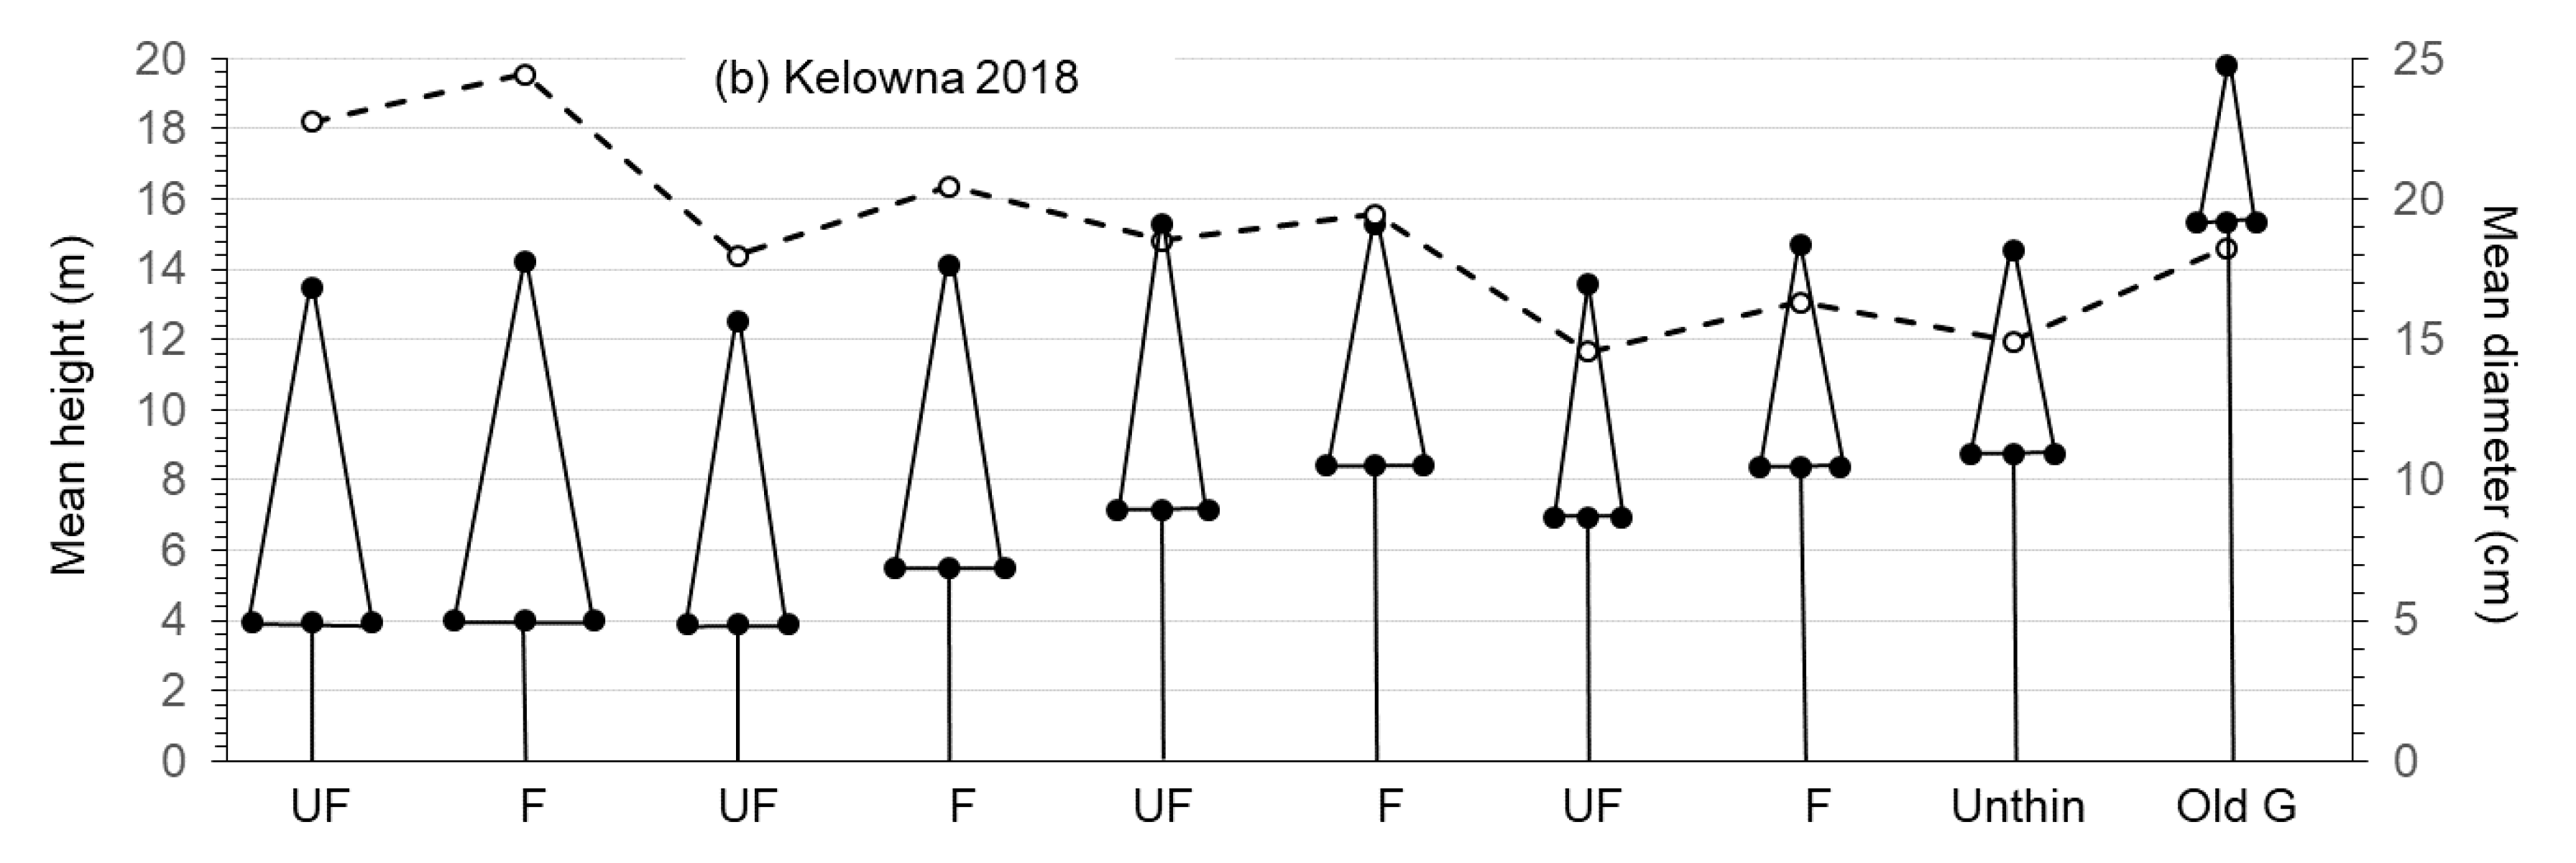
3.1. Growth and Size of Crop Trees

In the PCT study, mean diameter of lodgepole pine crop trees was significantly (F4,8 = 9.29; p < 0.01) different among stands (Table 2) with the three thinned and old-growth stands having diameters 1.3 to 1.6 times larger (DMRT; p = 0.05) than the unthinned stands. Mean diameters of intermediate crop trees were similar (p ≥ 0.50) among stands ranging from 6.9 to 8.4 cm and 10.1 to 10.5 cm, for height classes 5 and 6, respectively. Mean height of crop trees was significantly (F4,8 = 26.29; p < 0.01) different among stands with the old-growth stands 1.4 to 1.6 times higher (DMRT; p = 0.05) than the younger pine stands (Table 2). Mean density of lodgepole pine crop trees was significantly (F4,8 = 5.29; p = 0.02) different among stands with the unthinned stands having the highest (DMRT; p = 0.05) number (2899/ha) compared with the other stands (mean of 1040/ha) (Table 2). Mean density of other species of crop trees was similar (p ≥ 0.57) among stands ranging from 25 to 138 trees/ha. Mean density of intermediate crop trees was significantly (F4,8 = 6.99; p = 0.01) different among stands with the highest (DMRT; p = 0.05) number appearing in the low-density stands at 678 stems/ha followed by similar numbers in the other stands (Table 2). Comparison of mean number of total (original and intermediate) crop trees of all species approached significance (p = 0.06) with the unthinned stands at 3030 stems/ha and the other four stand treatments ranging from 1242 to 1557 stems/ha.
In the PCT-FERT study, mean diameter was significantly (F3,8 = 44.80; p < 0.01) different among stands with the very low-density (22.76 cm) being highest (DMRT; p = 0.05), followed by the low- and medium-density stands, and then the high-density stands (Table 3; Figure 3a). Similarly, mean diameter of crop trees was significantly (F1,8 = 14.93; p < 0.01) higher in the fertilized than unfertilized stands. Mean diameters of intermediate crop trees were similar (p ≥ 0.30) among stands for both density and fertilization ranging from 7.4 to 11.6 cm. Among these young pine stands, mean height of original crop trees of lodgepole pine was similar (p ≥ 0.72) for both density and fertilization (Table 3).
Mean density of lodgepole pine crop trees, total intermediate crop trees, and total crop trees (all species) were significantly (p ≤ 0.03) different in the PCT-FERT study (Table 3). Mean density (stems/ha) of pine crop trees followed closely the original post-thinning densities from lowest (256) to highest (1451). Total intermediate crop trees showed the most dramatic difference with the very low- and low-density stands at 871 and 687 stems/ha, respectively. This ingress of conifers resulted in relatively similar mean densities of total crop trees/ha ranging from 1144 to 1270 in the very low- to medium-density stands, all less (DMRT; p = 0.05) than the high-density stand at 1592 (Table 3; Figure 4). Only the mean number of total intermediate crop trees was significantly (F1,8 = 10.01; p = 0.01) different with respect to fertilization with a higher (DMRT; p = 0.05) number of trees/ha in the unfertilized (592) than fertilized (318) stands.

3.2. Architecture of Tree Crowns

In the PCT study, mean crown volume of lodgepole pine crop trees was significantly (F4,8 = 11.26; p < 0.01) different among stands with the low-density stands 2.0 to 6.3 times higher (DMRT; p = 0.05) than the other treatment stands (Table 2). Mean canopy closure was similar (p = 0.28) among stands ranging from 85% to 90% (Table 2).
In the PCT-FERT study, mean crown volume of lodgepole pine crop trees was significantly different among stands for density (p < 0.01) but not fertilization (p = 0.44). The very low-density stand had mean volume per tree measurements that were 1.5 to 3.6 times higher (DMRT; p = 0.05) than the other stands (Table 3, Figure 3b). Mean canopy closure among stands was significantly different with respect to density (p = 0.03) but not fertilization (p = 0.09) (Table 3). Mean crown architecture of crop trees at 25 years PT clearly showed the low-density stands to dominate in crown size and diameter when compared with the other managed and unmanaged stands at both Summerland and Kelowna (Figure 5).

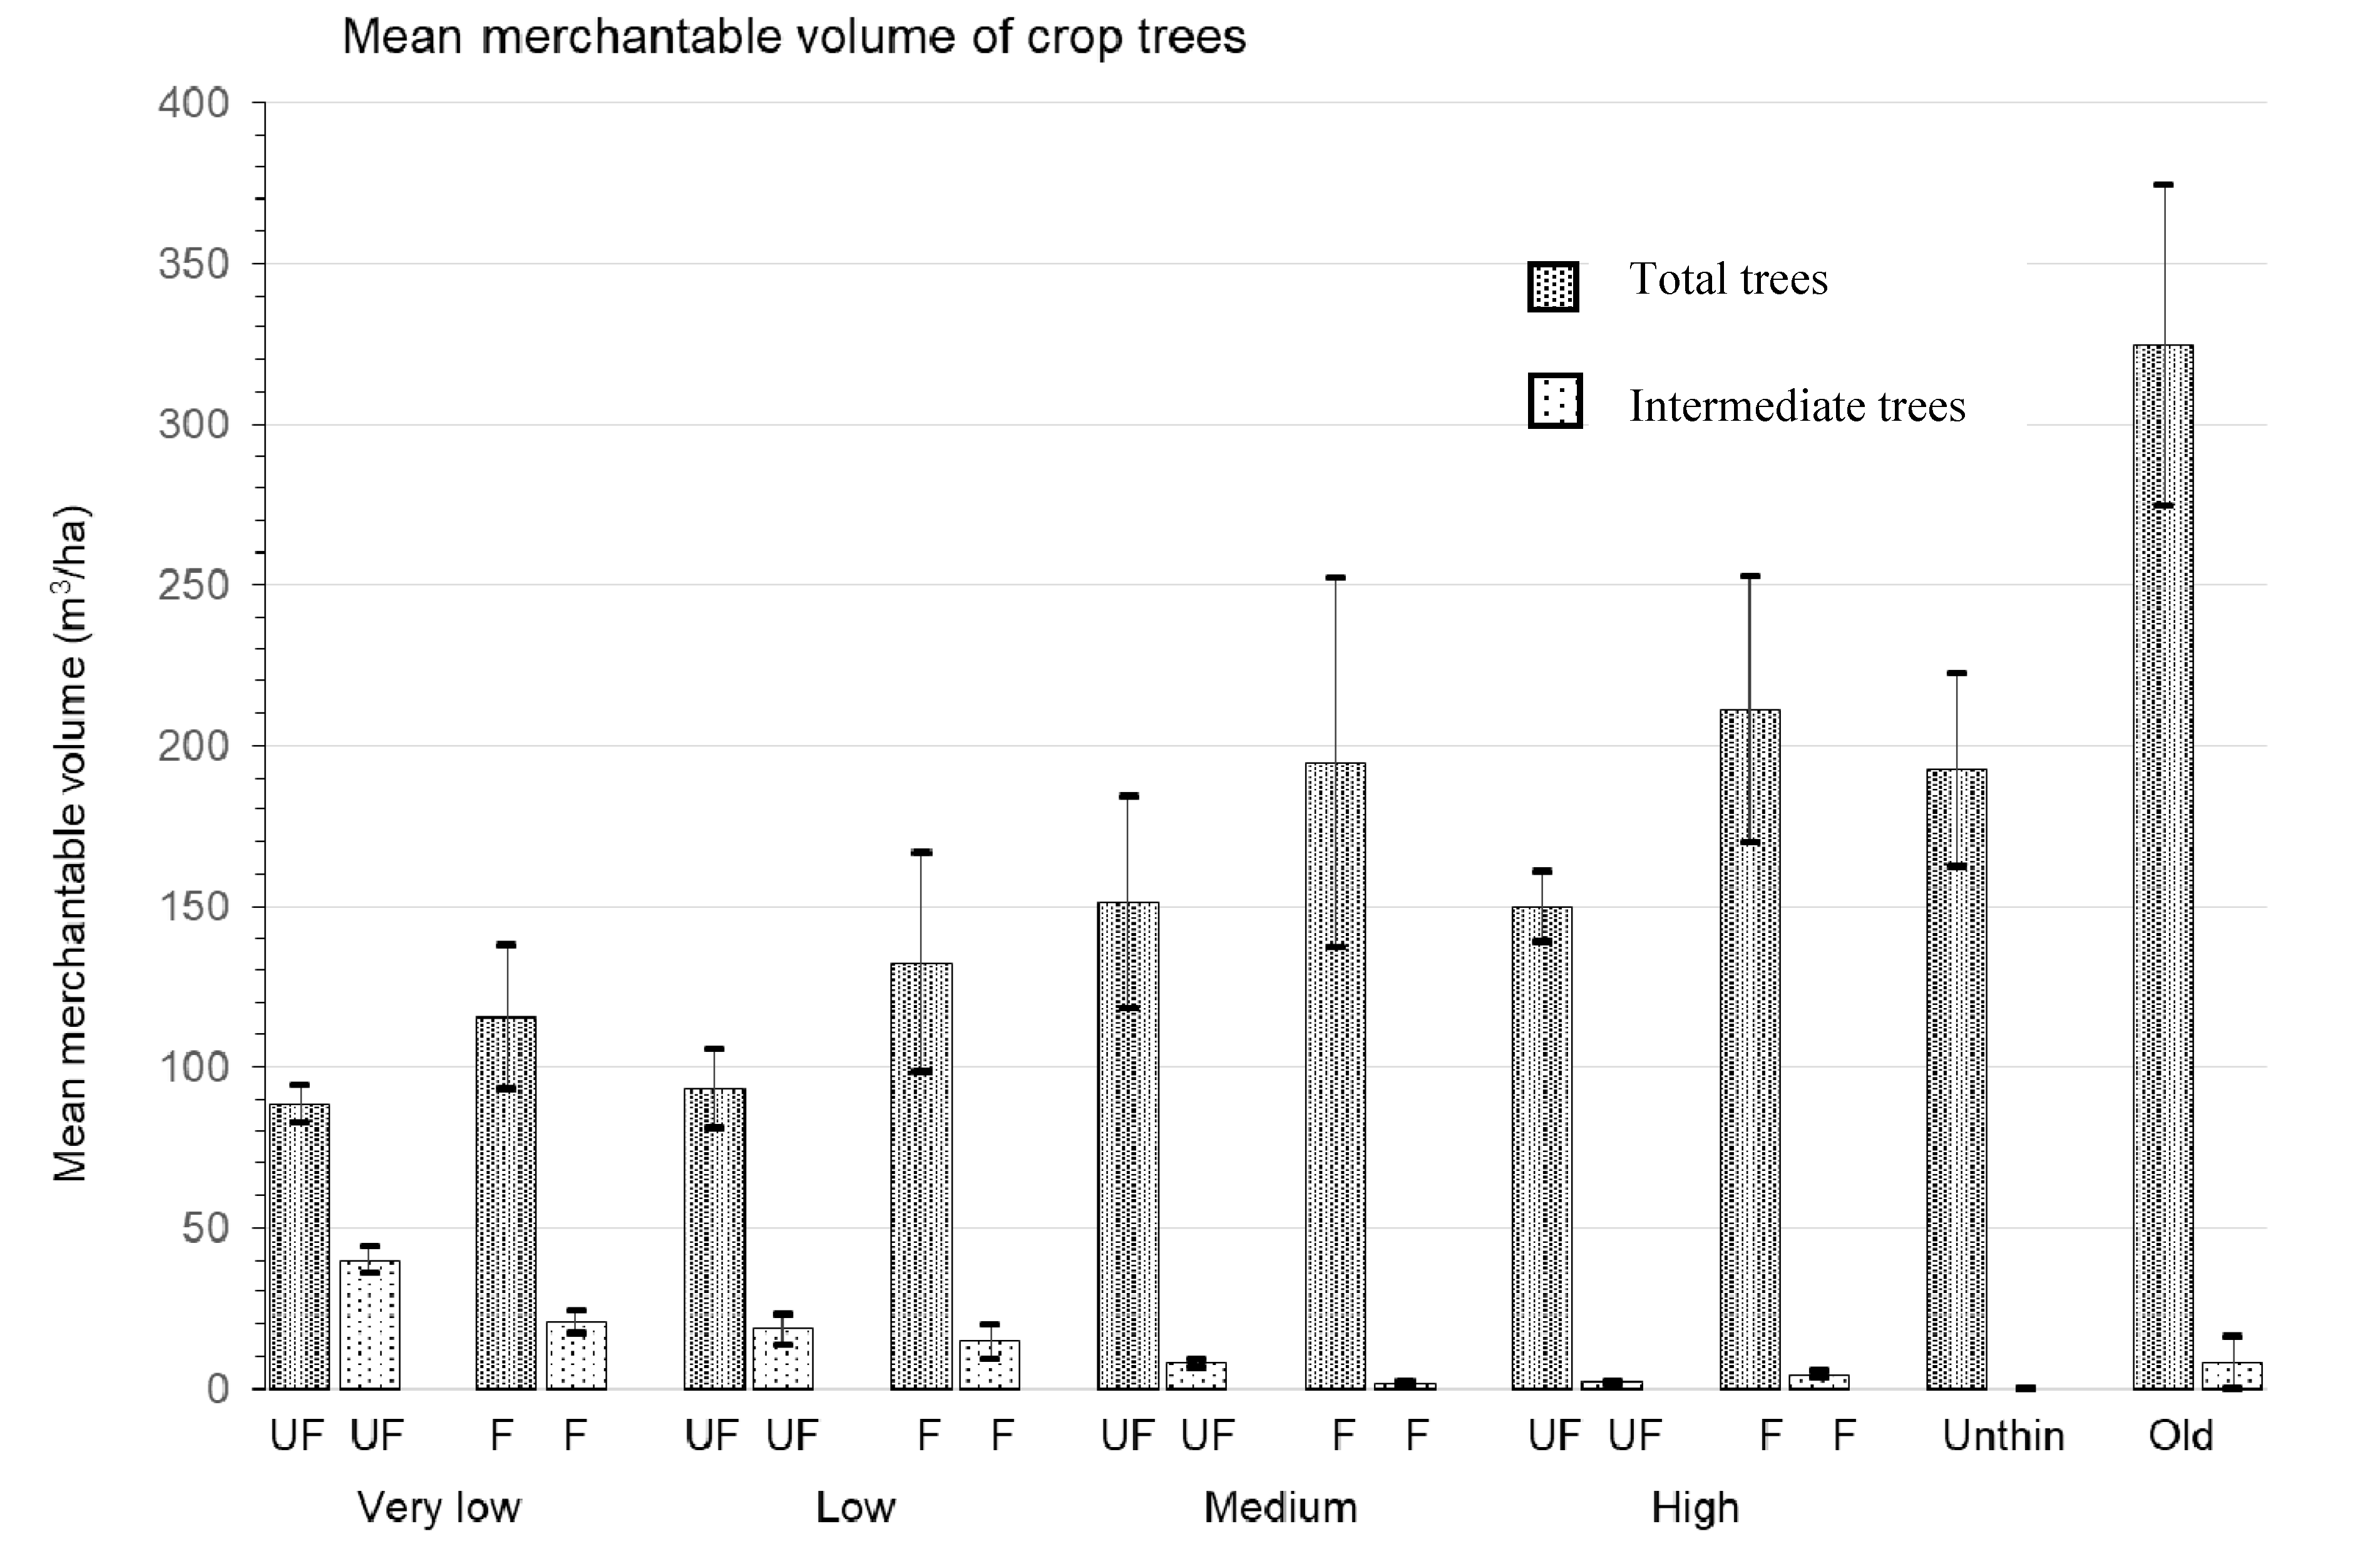
3.3. Merchantable Volume

In the PCT study, comparison of mean total merchantable volume of all crop trees was marginally significant (F4,8 = 3.76; p = 0.053) among stands with the four young pine stands similar (DMRT; p = 0.05) and ranging from 113 to 192 m3/ha (Table 2). The old-growth stand was also similar to the medium-density and unthinned stands, but higher (DMRT; p = 0.05) than the low- and high-density stands. Clearly, the availability of growing space allowed ingress of trees with a doubling of merchantable volume in the low-density stands over the 25-year period. Despite the high number of crop trees in the unthinned stands, the estimated merchantable volume was similar to the thinned stands because of the relatively small mean diameters of crop trees in the unthinned stands (Table 2). Mean merchantable volume at 325 m3/ha in the old-growth stands was still substantially higher than the young pine stands. However, mean basal area of total crop trees was similar (F4,8 = 1.45; p = 0.30) among stands ranging from 19.4 to 34.0 m2/ha.
In the PCT-FERT study, mean total merchantable volume of all crop trees was similar (p ≥ 0.08) among stands with respect to both density and fertilization. Mean total merchantable volume (m3/ha) ranged from 102 (very low-density) to 181 (high-density) and from 121 (unfertilized) to 164 (fertilized) despite the eight-fold difference in density at the initial time of thinning in 1993 (Table 3). The contribution of intermediate crop trees to total merchantable volume was greatest in the very low- and low-density stands, as noted above, due to the significantly higher density of these trees (Figure 6). Mean total basal area of crop trees was significantly (p ≤ 0.03) different among stands with respect to both density and fertilization, ranging from 17.5 to 29.5 m2/ha (Table 3). For density, the medium- and high-density stands were similar and higher (DMRT; p = 0.05) than the very low-density stands; the very low- and low-density stands were also similar. Mean total basal area (m2/ha) of crop trees was higher (DMRT; p = 0.05) in the fertilized (26.2) than unfertilized (20.8) stands.

3.4. Understory Conifers and Vascular Plants

In the PCT study, mean density (stems/ha) of understory conifers was significantly (F4,8 = 5.80; p = 0.02) different among stands with the thinned stands ranging from 1343 to 2138, similar to the unthinned stands at 2621, but lower (DMRT; p = 0.05) than that of the old-growth stands at 17535 (Table 2). This high level of understory conifers in the old-growth stands was at least partly related to the very high abundance of subalpine fir in the 0-1 m layer in two of three stands. Mean abundance of herbs was also significantly (F4,8 = 4.17; p = 0.04) different among stands with the three thinned stands all higher (DMRT; p = 0.05) than the old-growth stands, and the unthinned and old-growth stands similar in mean abundance. Mean abundance of shrubs was similar (F4,8 = 1.24; p = 0.37) statistically among stands, however, the low-density stands had relatively more (1.8 to 3.4 times) shrub volume than the other stands (Table 2).
In the PCT-FERT study, mean density (stems/ha) of understory conifers was similar (p ≥ 0.11) among stands with respect to both density and fertilization, ranging from 2283 to 3388 (Table 3). Mean abundance of herbs was also similar (p ≥ 0.40) among stands for both factors, whereas mean abundance of shrubs was significantly (F3,8 = 4.16; p = 0.05) different among stands with respect to density but not fertilization (Table 3). Mean shrub abundance was highest (DMRT; p = 0.05) in the very low- and medium-density stands, the latter of which was similar to the other two densities. This level of shrub growth was 1.4 to 2.3 times higher in the very low-density than other stands (Table 3).

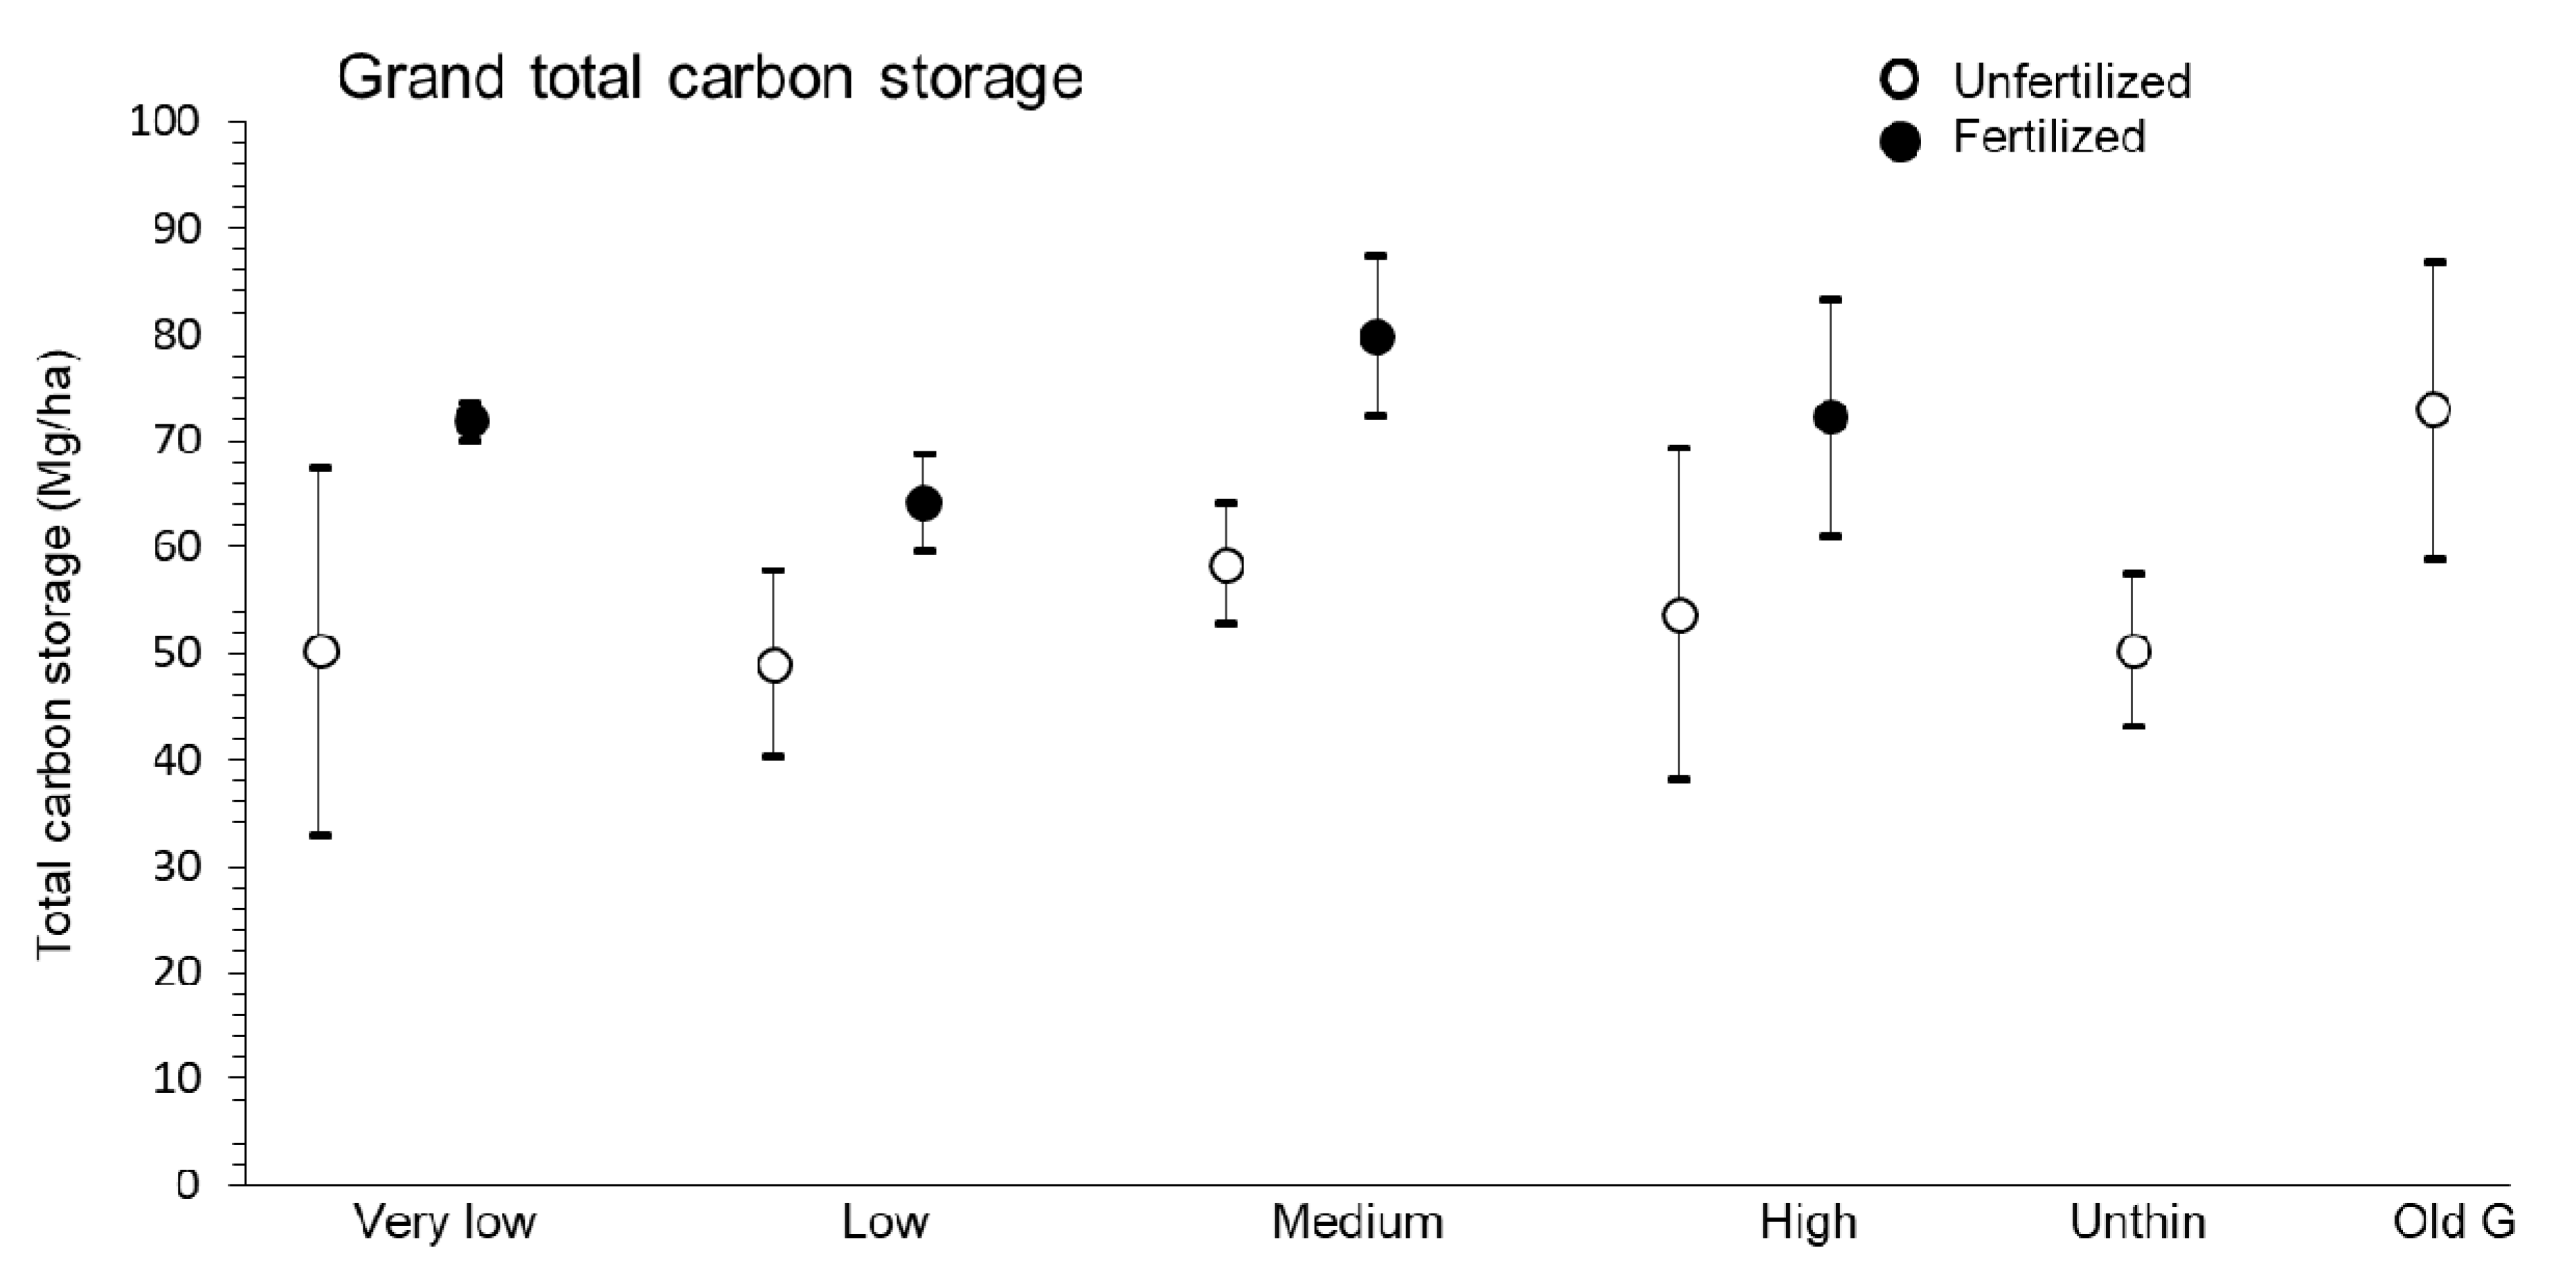
3.5. Stand-Level Carbon Storage

Mean above- and below-ground carbon storage (Mg/ha) of crop trees of lodgepole pine, other coniferous species, and total crop trees was generally similar (p ≥ 0.54) among stands at 25 years after post-thinning in the PCT study (Table 4). Mean carbon storage of intermediate crop trees and total conifers also followed this pattern. However, mean carbon storage (Mg/ha) of understory conifers was significantly (F4,8 = 4.47; p = 0.03) different among stands ranging from 0.71 in the high-density stand to 5.94 in the unthinned stand (Table 4). Mean carbon storage of understory vegetation was also similar among stands for all components, but with herbs approaching significance (p = 0.07) with the young pine stands at 1.2 to 1.6 times higher storage than the old-growth stands (Table 4). Mean grand total (understory and overstory) of above- and below-ground carbon storage (Mg/ha) was similar (F4,8 = 0.54; p = 0.71) among stands with the three thinned and old-growth stands ranging from 72 to 76 Mg/ha, and the unthinned at 50 Mg/ha.
In the PCT-FERT study, mean carbon storage of lodgepole pine crop trees, total crop trees, and total conifers was similar (p ≥ 0.07) among stands with respect to density, but fertilized pine and total crop trees had significantly (p ≤ 0.02) greater (1.4 times) carbon storage than unfertilized trees at 25 years after the initiation of stand treatments (Table 5). Mean carbon storage of total intermediate crop trees was significantly (F3,8 = 12.71; p < 0.01) different among stands with respect to density with the highest (DMRT; p = 0.05) level in the very low- and low-density stands where ingress was substantial through time (Figure 4). Mean carbon storage of understory conifers, grasses, herbs, and shrubs were all similar for both density (p ≥ 0.09) and fertilization (p ≥ 0.35) (Table 5).
The general similarity among stands with respect to density was reflected in the mean carbon storage of total conifers (Mg/ha) which ranged from 56 to 69 over the four densities, despite an 8-fold difference after PCT in 1993. These measurements were also well within the range of carbon estimates (Mg/ha) for total conifers for the unthinned (50) and old-growth (73) stands (Table 4). Mean grand total (understory and overstory) of above- and below-ground carbon storage with respect to density was similar (p = 0.69) among stands with the same pattern and magnitude of differences as that noted for total conifers (Table 5; Figure 7). The significantly (p = 0.03) greater level (1.4 times) of carbon storage in fertilized than unfertilized stands was maintained for total conifers and the grand total (Figure 7).
There were no significant density × block nor density × fertilization interaction effects for any of the tree or carbon measurements.

4. Discussion

4.1. Growth and Size of Crop Trees

The significantly larger diameters of lodgepole pine crop trees in thinned than unthinned stands at 25 years PCT followed that of earlier re-measurements in these same stands and other pine species [13,19,24,42,59] and others. Heavily thinned (≤1000 stems/ha) and fertilized stands generally had larger diameters than lightly thinned or unfertilized stands. Initial differences in stand density: 4-fold for the PCT study and 8-fold for the PCT-FERT study provided a wide range of conditions for variable growth rates and sizes of crop trees in these managed stands. Comparable mean diameters in thinned and thinned-fertilized stands with those in old-growth stands was maintained as reported earlier. However, mean heights of crop trees remained relatively unaffected by thinning or fertilization in the young managed stands and were significantly higher in the old-growth stands.
Despite differences in stand density of original crop trees, ingress of intermediate crop trees over the 25 years changed density dramatically, and hence mean total merchantable volume. For example, in the PCT study, stand density increased 2.3 (low) and 1.4 (medium) times owing to ingress of coniferous crop trees; the high-density stands declined (0.9 times) in tree density owing to mortality, over the 25 years since PCT. Similarly, in the PCT-FERT study, compared with the original post-thinning densities, these stands increased 4.3 (very low), 2.2 (low), and 1.2 (medium) times owing to ingress of coniferous crop trees; the high density stands declined (0.9 times) in tree density owing to mortality. Thus, in stands thinned to ≤500 trees/ha, there may be an anticipated increase in crop tree density of 2.2 to 4.3 times over 25 years. There were still high numbers of crop trees in the unthinned stands but the estimated merchantable volume was similar to the thinned stands because of the relatively small mean diameters of crop tree classes in these unmanaged stands.
As predicted by [19] at the 15-year re-measurement in the PCT-FERT study, the contribution of ingress to stand volume may be substantial as ingress trees approach a merchantable size. These authors reported that thinning increased the proportional contribution of ingress to total stand volume by as much as 47% within the 250 stems/ha unfertilized stands, and that this proportion decreased with increasing crop tree density. Although the fertilizer effect on total stand volume appeared to be negligible [19], a density effect was evident that tended to fit the results of our study at 25-years post-thinning. There were mean estimates (%) of 23, 13, 3, and 2 of the total merchantable volume attributed to ingress in the very low-, low-, medium-, and high-density stands, respectively, when averaged across unfertilized and fertilized stands. Thus, initial stand-level productivity of crop trees in heavily thinned stands should not be interpreted as total productivity at crop rotation, as ingress will clearly mitigate some of the stand volume losses resulting from intensive PCT, as evidenced by our comparison of total merchantable volume among stands in the two studies.

4.2. Architecture of Tree Crowns

Another aspect of the available growing space in the heavily thinned stands was the significant and consistently larger volume of tree crowns than in the higher-density stands. The enhanced structural development of crowns likely contributed to the substantial diameter growth of crop trees [18,60]. Thus, our results provided partial support for H1 that large-scale PCT (particularly heavy thinning to ≤ 1000 stems/ha) and repeated fertilization, at 25 years after the onset of treatments, would enhance productivity and structural features of crop trees: mean diameter growth in heavily thinned and fertilized stands and mean crown volume in heavily thinned stands. However, mean height growth was unaffected.

4.3. Merchantable Volume

Mean merchantable volume of total crop trees was similar across stand densities owing to ingress of intermediate crop trees, and also similar between unfertilized and fertilized stands. Thus, H2, that large-scale PCT (particularly heavy thinning to ≤ 1000 stems/ha) and repeated fertilization would enhance merchantable volume, was not supported. The continued enhanced diameter and crown sizes of crop trees within the heavily thinned stands seemed to be maintained during the 15 years (2003 to 2018) since the last application of fertilizer. These large trees likely have considerable implications through time for development of old-growth structural attributes [42,59], as well as future wood supply and enhanced carbon storage [37,38].

4.4. Stand Thinning and Ecosystem Services

Incremental silviculture treatments may enhance carbon sequestration, as well as contribute to resilience of managed stands to the potentially difficult growing conditions predicted as a result of climate change [40,41,61]. In a global overview, [6] discussed the risk of drought and heat-induced mortality for the world’s forests from climate change. In terms of mitigation, [62] concluded that stand thinning in north temperate forest ecosystems generally enhanced drought resistance and resilience. However, lower-density stands showed greater resistance and resilience at younger (49 years) than older ages (76 years), likely owing to larger tree sizes and water demands. In addition, heavy thinning, in particular, was reported to improve the growth response of conifers to drought conditions [63]. A similar scenario was reported for Scots pine (P. sylvestris L.) in relation to environmental pollution and drought in central Europe [64]. Thinning to low density may also help recharge ground water reserves due to snow accumulating on the ground versus being captured in canopies of dense stands where it sublimates directly into the atmosphere [65]. Reduction in fire fuels and future fuel loading in heavily thinned stands may reduce risk and severity of wildfire [66]. Thus, density management may be a means to moderate drought impacts on tree growth, ground water supplies, and risk of wildfire particularly in many dry ecosystems of the PNW of North America and elsewhere, but with a caveat on tree size, stand age, and stand structure. In addition, losses to MPB may be reduced or avoided with stand treatments such as thinning and fertilization that increase tree vigor, at least in moderate outbreaks of this insect [67,68].

4.5. Understory Conifer, Herb, and Shrub Layers

Stand thinning has generally increased the biomass of understory vegetation, at least in coniferous forest ecosystems with sufficient moisture [27,30,31]. This pattern seemed to fit results from our PCT study where mean abundance of herbs was significantly higher in the young thinned and unthinned pine stands than old-growth stands. However, [32] reported no statistical effect of stand density on abundance of herbs in the early years of the PCT-FERT study. A caveat was that abundance of herbs in the very low-density stands was twice that in the unthinned stands, thereby suggesting a biologically important difference. Fertilization had a very great positive influence on abundance of herbs during the 10-year fertilization period (1993–2003) but declined dramatically thereafter likely owing to termination of the nutrient additions and the structural advance towards canopy closure [32]. Thus, H3 that large-scale PCT (particularly heavy thinning to ≤1000 stems/ha) and repeated fertilization, at 25 years since initiation of treatments, would enhance abundance of understory conifers and vascular plants was not supported. Mean canopy closure at 83% in the very low-density stands (PCT-FERT) may have maintained shrub growth via canopy gaps, whereas crop trees in the higher-density stands likely limited development of this understory component. Thinning has been discussed as a tool to create gaps for understory development in young boreal forests [69] and for variable abundance of shrubs in young (40-year-old) Douglas-fir forests at 20 years post-thinning [70].

4.6. Stand-Level Carbon Storage

The vast majority of carbon storage was provided by the tree layer (99%) in all stands in both studies. On a relative basis, carbon storage was similar across densities in both studies with ingress contributing a considerable amount to carbon at the lower densities. Much of the potential carbon storage lost by thinning (removal of coniferous trees) was restored in the heavily thinned stands at 25 years post-thinning. Fertilization did increase (1.4 times) carbon storage significantly among total crop trees and total conifers and this response fit the predictions of several studies [40,69,71,72]. Indeed, [73] and [35] indicated that fertilization was one of the best methods of forest management to increase carbon sequestration. According to [74], the potential to increase carbon storage capacity in forests was often limited by poor nutrient availability, and hence fertilization tailored to such sites may be particularly meaningful for carbon sequestration.
Thus, H4, that PCT (particularly heavy thinning to ≤1000 stems/ha) and repeated fertilization at 25 years since the initiation of treatments, would enhance carbon storage in tree layers and the overall stand level, was supported. The heavily thinned stands had high levels of coniferous ingress to match levels of carbon storage in total crop trees in the higher-density or unmanaged young stands. Fertilization had a significant effect on carbon storage for total conifers and the grand total of all layers. Carbon storage in the herb and shrub component was minimal compared with that in the tree layers.

4.7. Study Limitations

To increase the degree of replication in our analyses and provide a potentially wider scope of inferences (i.e., to include unthinned and old-growth stands), we combined the relevant replicate stands from the PCT and PCT-FERT studies to investigate the influence of stand density on carbon sequestration in herbs, shrubs, and trees. Thus, the two studies were in stands of slightly different ages and the thinning treatments started at different times. However, to keep the overall post-treatment responses consistent, we conducted measurements at 25-years since the initiation of treatments. The experimental design for the fertilization study was limited by replication and stand disturbance. However, these limitations needed to be balanced with the long-term (25 years) measurements of stand responses and the intensity of repeated fertilization treatments (5 times). The time-line and degree of treatments were unique, at least in western North America, and provided meaningful results in this context. The results from the limited sample of trees at Kelowna followed the same pattern as those from Summerland, thereby providing some degree of replication. To increase replication in the PCT-FERT study, we investigated unfertilized vs. fertilized stands regardless of stand density. This approach to the PCT-FERT analysis increased replication from 2 to 8 but did not include the unthinned or old-growth stands. These unmanaged stands (controls) were included in the PCT analysis of stand density and for comparison purposes with the results of the PCT-FERT study. Extrapolation of results was limited to lodgepole pine stands in the southern interior of BC.
Estimates of biomass and carbon content in the various tree components (e.g., stems, branches, foliage, and roots) were all based on DBH measurements. It is not surprising then that, despite slight differences in carbon storage within the various tree components, proportion of carbon allocation throughout the tree components remained very consistent among treatment stands. These calculations assumed a standard tree form for the unthinned and old-growth stands and took into account the very large size of tree crowns, and potentially root masses, that develop over time in heavily thinned stands. Thus, although the greatest amount of carbon storage was in tree stems, the estimates for branches and foliage for trees with large crowns may have contributed to more realistic measures of overall tree carbon storage in these intensively managed stands. We have assumed that the equations used to estimate carbon storage of herbs, shrubs, and trees, developed in similar ecosystems, were relevant to our study areas. Also, we did not have measurements of soil carbon which is another major source of potential sequestration.

5. Conclusions

To our knowledge, this is the first reporting of the 25-year responses of tree growth metrics and stand development in thinned and fertilized stands of lodgepole pine across a wide range of densities. In addition, this is the first full accounting of above- and below-ground carbon storage for all coniferous tree species and layers (overstory and understory) in intensively managed forests, with comparison to unmanaged stands.
Heavily thinned and fertilized stands generally had larger diameters than lightly thinned or unfertilized stands; mean heights of crop trees remained relatively unaffected by thinning or fertilization. Despite differences in stand density of original crop trees, ingress of intermediate crop trees over the 25 years changed density dramatically, and hence mean total merchantable volume was similar across stand densities. In stands thinned to ≤500 trees/ha, there may be an anticipated increase in crop tree density of 2.2 to 4.3 times over 25 years.
The continued enhanced diameter and crown sizes of crop trees within the heavily thinned stands seemed to be maintained during the 15 years (2003 to 2018) since the last application of fertilizer. These large trees likely have considerable implications through time for development of old-growth structural attributes, as well as future wood supply and enhanced carbon storage. The vast majority of carbon storage was provided by the tree layer (99%) in all stands in both studies. On a relative basis, mean levels of carbon storage in the very low- and low-density stands was comparable to that in higher-density stands owing to coniferous ingress. Thus, much of the potential carbon storage lost by thinning (removal of coniferous trees) was restored and even surpassed in the heavily thinned stands at 25 years since the onset of treatments.

Author Contributions

Conceptualization, T.P.S., D.S.S., D.B.R., P.M.F.L., L.Z.; methodology, T.P.S., D.S.S., P.M.F.L.; formal analysis, T.P.S., P.M.F.L.; investigation, T.P.S., D.B.R.; resources, D.B.R., L.Z.; writing, original draft, T.P.S., D.S.S.; review and editing, P.M.F.L., D.B.R., L.Z. All authors have read and agreed to the published version of the manuscript.

Funding

This research was funded by the Resources Practices Branch, BC Ministry of Forests, Lands, Natural Resource Operations and Rural Development, Victoria, BC, and the BC Forest Enhancement Society, the BC Ministry of Agriculture, Agriculture and Agri-Food Canada, Growing Forward: a federal-provincial-territorial initiative, and the Agricultural Greenhouse Gases Program.

Acknowledgments

We thank H. Sullivan for assistance with fieldwork.

Conflicts of Interest

The authors declare no conflict of interest. The funders had no role in the design of the study; in the collection, analyses, or interpretation of data; in the writing of the manuscript, or in the decision to publish the results.

References

  1. Nabuurs, G.J.; Pussinen, A.; van Brusselen, J.; Schelhaas, M.J. Future harvesting pressure on European forests. Eur. J. For. Res. 2007, 126, 391–400. [Google Scholar] [CrossRef]
  2. Raunikar, R.; Buongiornoa, J.; Turnerb, J.A.; Zhu, S. Global outlook for wood and forests with the bioenergy demand implied by scenarios of the Intergovernmental Panel on Climate Change. For. Pol. Econ. 2010, 12, 48–56. [Google Scholar] [CrossRef]
  3. Hunter, M.L.; Schmiegelow, F.K.A. Wildlife, Forests, and Forestry, 2nd ed.; Prentice Hall: Upper Saddle River, NJ, USA, 2011; 259p. [Google Scholar]
  4. Agee, J.K. Fire Ecology of Pacific Northwest Forests; Island Press: Washington, DC, USA, 1993. [Google Scholar]
  5. Walton, A.; Hughes, J.; Eng, M.; Fall, A.; Shore, T.; Riel, B.; Hall, P. Provincial –level Projection of the Current Mountain Pine Beetle Outbreak; British Columbia Ministry of Forests and Range: Victoria, BC, Canada, 2009. [Google Scholar]
  6. Allen, C.D.; Macalady, A.K.; Chenchouni, H.; Bachelet, D.; Mcdowell, N.; Vennetier, M.; Kitzberger, T.; Rigling, A.; Breshears, D.D.; Hogg, E.H. A global overview of drought and heat-induced tree mortality reveals emerging climate change risks for forests. For. Ecol. Manag. 2010, 259, 660–684. [Google Scholar] [CrossRef] [Green Version]
  7. Lavoie, S.; Ruel, J.-C.; Bergeron, Y.; Harvey, B.D. Windthrow after group and dispersed tree retention in eastern Canada. For. Ecol. Manag. 2012, 269, 158–167. [Google Scholar] [CrossRef]
  8. Moore, S.E.; Allen, H.L. Plantation Forestry. In Maintaining Biodiversity in Forest Ecosystems; Hunter, M.L., Jr., Ed.; Cambridge University Press: New York, NY, USA, 1999; pp. 400–433. [Google Scholar]
  9. Albaugh, T.J.; Allen, H.L.; Dougherty, P.M.; Johnsen, K.H. Long term growth responses of loblolly pine to optimal nutrient and water resource availability. For. Ecol. Manag. 2004, 192, 3–19. [Google Scholar] [CrossRef]
  10. Nohrstedt, H.O. Response of coniferous forest ecosystems on mineral soils to nutrient additions: A review of Swedish experiences. Scand. J. For. Res. 2001, 16, 555–573. [Google Scholar] [CrossRef]
  11. Bergh, J.; Nilsson, U.; Grip, H.; Hedwall, P.O.; Lundmark, T. Effects of frequency of fertilization on production, foliar chemistry, and nutrient leaching in young Norway spruce stands in Sweden. Silva. Fenn. 2008, 42, 721–733. [Google Scholar] [CrossRef] [Green Version]
  12. Fox, T.R.; Jokela, E.A.; Allen, H.L. The development of pine plantation silviculture in the southern United States. J. For. 2007, 105, 337–347. [Google Scholar]
  13. Jokela, E.J.; Martin, T.A.; Vogel, J.G. Twenty-five years of intensive management with southern pines: Important lessons learned. J. For. 2010, 108, 338–347. [Google Scholar]
  14. Riffell, S.; Verschuyl, J.; Miller, D.; Wigley, T.B. Biofuel harvests, coarse woody debris, and biodiversity–A meta-analysis. For. Ecol. Manag. 2011, 261, 878–887. [Google Scholar] [CrossRef]
  15. Verschuyl, J.; Riffell, S.; Miller, D.; Wigley, T.B. Biodiversity response to intensive biomass production from forest thinning in North American forests—A meta-analysis. For. Ecol. Manag. 2011, 261, 221–232. [Google Scholar] [CrossRef]
  16. Demarais, S.; Verschuyl, J.P.; Roloff, G.J.; Miller, D.A.; Wigley, T.B. Tamm review: Terrestrial vertebrate biodiversity and intensive forest management in the U.S. For. Ecol. Manag. 2017, 385, 308–330. [Google Scholar] [CrossRef] [Green Version]
  17. Cole, D.M.; Koch, P. Managing Lodgepole Pine to Yield Merchantable Thinning Products and Attain Sawtimber Rotations; Research Paper INT-RP-482; USDA Forest Service Intermountain Research Station: Ogden, UT, USA, 1996. [Google Scholar]
  18. Koch, P. Lodgepole Pine Commercial Forests: An Essay Comparing the Natural Cycle of Insect Kill and Subsequent Wildfire with Management for Utilization and Wildlife; INT-GTR-342; USDA Forest Service Intermountain Research Station: Ogden, UT, USA, 1996. [Google Scholar]
  19. Lindgren, P.M.F.; Sullivan, T.P. Long-term responses of tree and stand growth of young lodgepole pine to pre-commercial thinning and repeated fertilization. For. Ecol. Manag. 2013, 307, 155–164. [Google Scholar] [CrossRef]
  20. Lotan, J.E.; Critchfield, W.B. Pinus contorta ssp. murrayana–lodgepole pine forest. In Silvics of North America, Volume 1. Conifers. Agriculture Handbook 654; Burns, R.M., Honkala, B.H., Eds.; Tech. Coord. USDA Forest Service: Washington, DC, USA, 1990; pp. 302–313. [Google Scholar]
  21. Koch, P. Lodgepole Pine in North America; Forest Production Society: Madison, WI, USA, 1996. [Google Scholar]
  22. Brockley, R.P.; Trowbridge, R.L.; Ballard, T.M.; Macadam, A.M. Nutrient Management in Interior Forest Types. Proceedings Forest Fertilization: Sustaining and Improving Nutrition and Growth of Western Forests, Seattle, WA, USA, 12–14 February 1991; University of Washington Institute of Forest Resources Contribution 73: Seattle, WA, USA, 12 February 1992; pp. 43–64. [Google Scholar]
  23. Brockley, R.P. Effects of post-thinning density and repeated fertilization on the growth and development of young lodgepole pine. Can. J. For. Res. 2005, 35, 1952–1964. [Google Scholar] [CrossRef]
  24. Lindgren, P.M.F.; Sullivan, T.P.; Sullivan, D.S.; Brockley, R.P.; Winter, R. Growth response of young lodgepole pine to thinning and repeated fertilization treatments: 10-year results. Forestry 2007, 80, 587–611. [Google Scholar] [CrossRef] [Green Version]
  25. Malkonen, E.; Kukkola, M. Effect of long-term fertilization on the biomass production and nutrient status of Scots pine stands. Fertilizer Res. 1991, 27, 113–127. [Google Scholar] [CrossRef]
  26. Tamm, C.O.; Aronsson, A.; Popovic, B.; Flower-Ellis, J. Optimum Nutrition and Nitrogen Saturation in Scots Pine Stands; Studia Forestalia Suecica: Uppsala, Sweden, 1999; p. 206. [Google Scholar]
  27. Thysell, D.R.; Carey, A.B. Manipulation of density of Pseudotsuga menziesii canopies: Preliminary effects on understory vegetation. Can. J. For. Res. 2001, 31, 1513–1525. [Google Scholar] [CrossRef] [Green Version]
  28. Sullivan, T.P.; Sullivan, D.S.; Lindgren, P.M.F. Stand structure and small mammals in young lodgepole pine forest: 10-year results after thinning. Ecol. Appl. 2001, 11, 1151–1173. [Google Scholar] [CrossRef]
  29. Lindgren, P.M.F.; Ransome, D.B.; Sullivan, D.S.; Sullivan, T.P. Plant community attributes 12 to 14 years following pre-commercial thinning in a young lodgepole pine forest. Can. J. For. Res. 2006, 36, 48–61. [Google Scholar] [CrossRef] [Green Version]
  30. Cole, E.C.; Hanley, T.A.; Newton, M. Influence of precommercial thinning on understory vegetation of young-growth Sitka spruce forests in southeastern Alaska. Can. J. For. Res. 2010, 40, 619–628. [Google Scholar] [CrossRef]
  31. Thomas, S.C.; Halpern, C.B.; Falk, D.A.; Liguori, D.A.; Austin, K.A. Plant diversity in managed forests: Understorey responses to thinning and fertilization. Ecol. Appl. 1999, 9, 864–879. [Google Scholar] [CrossRef]
  32. Lindgren, P.M.F.; Sullivan, T.P. Influence of stand thinning and repeated fertilization on plant community abundance and diversity in young lodgepole pine stands: 15-year results. For. Ecol. Manag. 2013, 308, 17–30. [Google Scholar] [CrossRef]
  33. Sullivan, T.P.; Sullivan, D.S.; Lindgren, P.M.F.; Ransome, D.B. Stand structure and small mammals in intensively managed forests: Scale, time, and testing extremes. For. Ecol. Manag. 2013, 310, 1071–1087. [Google Scholar] [CrossRef]
  34. Ter-Mikaelian, M.T.; Colombo, S.J.; Chen, J. Fact and fantasy about forest carbon. For. Chron. 2008, 84, 166–171. [Google Scholar] [CrossRef] [Green Version]
  35. Hedwall, P.-O.; Gong, P.; Ingerslev, M.; Bergh, J. Fertilization in northern forests–biological, economic and environmental constraints and possibilities. Scand. J. For. Res. 2014, 29, 301–311. [Google Scholar] [CrossRef]
  36. Birdsey, R.A. Carbon Storage and Accumulation in United States Forest Ecosystems; GGeneral Technical Report WO-59; USDA Forest Service: Washington, DC, USA, 1992. [Google Scholar]
  37. Luyssaert, S.; Schultze, E.-D.; Borner, A.; Knohl, A.; Hessenmoller, D.; Law, B.E.; Clais, P.; Grace, J. Old-growth forests as global carbon sinks. Nature 2008, 455, 213–215. [Google Scholar] [CrossRef]
  38. Ishii, H.R.; Sillett, S.C.; Caroll, A.L. Crown dynamics and wood production of Douglas-fir trees in an old-growth forest. For. Ecol. Manag. 2017, 384, 157–168. [Google Scholar] [CrossRef]
  39. Adams, A.B.; Harrison, R.B.; Sletton, R.S.; Strahm, B.D.; Turnblom, E.C.; Jensen, C.M. Nitrogen-fertilization impacts on carbon sequestration and flux in managed coastal Douglas-fir stands of the Pacific Northwest. For. Ecol. Manag. 2005, 220, 313–325. [Google Scholar] [CrossRef]
  40. Shryock, B.; Littke, K.; Ciol, M.; Briggs, D.; Harrison, R. The effects of urea fertilization on carbon sequestration in Douglas-fir plantations of the coastal Pacific Northwest. For. Ecol. Manag. 2014, 318, 341–348. [Google Scholar] [CrossRef]
  41. Marchi, M.; Paletto, A.; Cantiani, P.; Bianchetto, E.; De Meo, I. Comparing thinning system effects on ecosystem services provision in artificial black pine (Pinus nigra J.F. Arnold) forests. Forests 2018, 9, 188. [Google Scholar] [CrossRef] [Green Version]
  42. Sullivan, T.P.; Sullivan, D.S. Acceleration of old-growth structural attributes in lodgepole pine forest: Tree growth and stand structure 25 years after thinning. For. Ecol. Manag. 2016, 365, 96–106. [Google Scholar] [CrossRef]
  43. Blevins, D.P.; Prescott, C.E.; Allen, H.L.; Newsome, T.A. The effects of nutrition and density on growth, foliage biomass, and growth efficiency of high-density fire-origin lodgepole pine in central British Columbia. Can. J. For. Res. 2005, 35, 2851–2859. [Google Scholar] [CrossRef]
  44. Schmidt, W.C.; Seidel, K.W. Western larch and space: Thinning to optimize growth. In Proceedings of the Future Forests of the Mountain West: A Stand Culture Symposium, Missoula, MT, USA, 29 September–3 October 1986; General Technical Report INT-243. U.S. Forest Service, Intermountain Research Station: Missoula, MT, USA, 1988. [Google Scholar]
  45. Bailey, J.D.; Tappeiner, J.C. Effects of thinning on structural development in 40- to 100-year-old Douglas-fir stands in western Oregon. For. Ecol. Manag. 1998, 108, 99–113. [Google Scholar] [CrossRef]
  46. Newton, M.; Cole, L. Overstory development in Douglas-fir-dominant forests thinned to enhance late-seral features. For. Sci. 2015, 61, 809–816. [Google Scholar] [CrossRef] [Green Version]
  47. Meidinger, D.; Pojar, J. Ecosystems of British Columbia; Special Report Series No. 6; Research Branch, Ministry of Forests: Victoria, BC. Canada, 1991. [Google Scholar]
  48. Nigh, G.D. Total and Merchantable Volume Equations for Common Tree Species in British Columbia: By Region and Biogeoclimatic Zone; Technical Report 106, British Columbia Province; Region and Biogeoclimatic Zone: Victoria, BC, Canada, 2016; 22p. [Google Scholar]
  49. Englund, S.R.; O’Brien, J.J.; Clark, D.B. Evaluation of digital and film hemispherical photography and spherical densiometry for measuring forest light environments. Can. J. For. Res. 2000, 30, 1999–2005. [Google Scholar] [CrossRef]
  50. Parish, R.; Coupe, R.; Lloyd, D. Plants of Southern Interior British Columbia; Lone Pine Publishing: Vancouver, BC, Canada, 1996; 464p. [Google Scholar]
  51. Bert, D.; Danjon, F. Carbon concentration variation in the roots, stem and crown of mature Pinus pinaster (Ait.). For. Ecol. Manag. 2006, 222, 279–295. [Google Scholar] [CrossRef]
  52. Ter-Mikaelian, M.T.; Korzukhin, M.D. Biomass equations for sixty-five North American tree species. For. Ecol. Manag. 1997, 97, 1–24. [Google Scholar] [CrossRef] [Green Version]
  53. Li, Z.; Kurz, W.A.; Apps, M.J.; Beukema, S.J. Belowground biomass dynamics in the Carbon Budget Model of the Canadian Forest Sector: Recent improvements and implications for the estimation of NPP and NEP. Can. J. For. Res. 2003, 33, 126–136. [Google Scholar] [CrossRef]
  54. Jain, T.; Graham, R.T.; Adams, D. Carbon concentrations and carbon pool distributions in dry, moist, and cold mid-aged forests of the Rocky Mountains. In Integrated management of carbon sequestration and biomass utilization opportunities in a changing climate; Proceedings of the 2009 National Silviculture Workshop, Fort Collins, CO, USA, 15–18 June 2009; Jain, T.B., Graham, R.T., Sandquist, J., Eds.; Boise, ID. Proceedings RMRS-P-61; Department of Agriculture, Forest Service, Rocky Mountain Research Station: Fort Collins, CO, USA, 2010; pp. 39–59. [Google Scholar]
  55. IBM Corp. Inc. IBM SPSS Statistics for Windows; Version 25.0; IBM Corp: Armonk, NY, USA, 2017. [Google Scholar]
  56. Fowler, J.; Cohen, L.; Jarvis, P. Practical Statistics for Field Biology, 2nd ed.; John Wiley and Sons: Chichester, UK, 1998; 259p. [Google Scholar]
  57. Saville, D.J. Multiple comparison procedures: The practical solution. Amer. Stat. 1990, 44, 174–180. [Google Scholar]
  58. Zar, J.H. Biostatistical Analysis; Prentice-Hall, Inc.: Englewood Cliffs, NJ, USA, 1999; 663p. [Google Scholar]
  59. Sullivan, T.P.; Sullivan, D.S. Old-growth characteristics 20 years after thinning and repeated fertilization of lodgepole pine forest: Tree growth, structural attributes, and red-backed voles. For. Ecol. Manag. 2017, 391, 207–220. [Google Scholar] [CrossRef]
  60. Hess, A.F.; da Silveira, A.C.; Krefta, S.M.; dos Santo, D.V.; Filho, M.D.; Atanzio, K.A.; Schorr, L.P.B.; dos Santo, I.A.; Borsoi, G.A.; Stepka, T.F.; et al. Crown dynamics of Brazilian pine (Aracauria angustifolia) in Santa Catarina region of Brazil. Austr. J. Crop Sci. 2018, 12, 449–457. [Google Scholar] [CrossRef]
  61. Millar, C.I.; Stephenson, N.L.; Stephens, S.L. Climate change and forests of the future: Managing in the face of uncertainty. Ecol. Appl. 2007, 17, 2145–2151. [Google Scholar] [CrossRef] [PubMed]
  62. D’Amato, A.W.; Bradford, J.B.; Fraver, S.; Palik, B.J. Effects of thinning on drought variability and climate response in north temperate forest ecosystems. Ecol. Appl. 2013, 23, 1735–1742. [Google Scholar]
  63. Sohn, J.A.; Saha, S.; Bauhus, J. Potential of forest thinning to mitigate drought stress: A meta-analysis. For. Ecol. Manag. 2016, 380, 261–273. [Google Scholar] [CrossRef]
  64. Vacek, S.; Vacek, Z.; Bilek, L.; Simon, J.; Remes, J.; Hunova, I.; Kral, J.; Putalova, T.; Mikeska, M. Structure, regeneration and growth of Scots pine (Pinus sylvestris L.) stands with respect to changing climate and environmental pollution. Silva Fenn 2016, 50. [Google Scholar] [CrossRef] [Green Version]
  65. Podolak, K.; Edelson, D.; Kruse, S.; Aylward, B.; Zimring, M.; Wobbrock, N. Estimating the Water Supply Benefits from Forest Restoration in the Northern Sierra Nevada; The Nature Conservancy and Ecosystem Economics: San Francisco, CA, USA, 2015. [Google Scholar]
  66. Stephens, S.L.; McIver, J.D.; Boerner, R.E.J.; Fettig, C.J.; Fontaine, J.B.; Hartsough, B.R.; Kennedy, P.L.; Schwilk, D.W. The effects of forest fuel reduction treatments in the United States. BioScience 2012, 62, 549–560. [Google Scholar] [CrossRef] [Green Version]
  67. Amman, G.D.; McGregor, M.D.; Schmitz, R.F.; Oakes, R.D. Susceptibility of lodgepole pine to infestation by mountain pine beetles following partial cutting of stands. Can. J. For. Res. 1988, 18, 688–695. [Google Scholar] [CrossRef] [Green Version]
  68. Whitehead, R.J.; Russo, G.L. “Beetle-Proofed” Lodgepole Pine Stands in interior British Columbia Have Less Damage from Mountain Pine Beetle; Report BCX-402; Natural Resources Canada, Canadian Forest Service, Pacific Forestry Centre: Victoria, BC, Canada, 2005; 18p. [Google Scholar]
  69. Widenfalk, O.; Weslien, J. Plant species richness in managed boreal forests – Effects of stand succession and thinning. For. Ecol. Manag. 2009, 257, 1386–1394. [Google Scholar] [CrossRef]
  70. Lindh, B.C.; Muir, P.S. Understory vegetation in young Douglas-fir forests: Does thinning help restore old-growth composition? For. Ecol. Manag. 2004, 192, 285–296. [Google Scholar] [CrossRef]
  71. Sathre, R.; Gustavsson, L.; Bergh, J. Primary energy and greenhouse gas implications of increasing biomass production through forest fertilization. Biomass Bioenergy 2010, 34, 572–581. [Google Scholar] [CrossRef]
  72. Albaugh, T.J.; Vance, E.D.; Gaudreault, C.; Fox, T.R.; Allen, H.L.; Stape, J.L.; Rubilar, R.A. Carbon emissions and sequestration from fertilization of pine in the southeastern United States. For. Sci. 2012, 58, 419–429. [Google Scholar] [CrossRef]
  73. Hoen, H.F.; Solberg, B. Potential and economic efficiency of carbon sequestration in forest biomass through management. For. Sci. 1994, 40, 429–451. [Google Scholar]
  74. Huettl, R.F.; Zoettl, H.W. Forest fertilization: Its potential to increase the CO2 storage capacity and to alleviate the decline of the global forests. Water Air Soil Poll. 1992, 64, 229–249. [Google Scholar] [CrossRef]
Figure 1. Photographs of lodgepole pine stands: four densities (stems/ha) of thinned, an unthinned stand, and an old-growth stand at Summerland in summer 2018, 25 years after initiation of treatments.
Forests 11 00337 g001aForests 11 00337 g001b
Figure 2. Photographs of crowns of lodgepole pine stands: four densities of thinned, an unthinned stand, and an old-growth stand at Summerland in summer 2018, 25 years after initiation of treatments.
Forests 11 00337 g002aForests 11 00337 g002b
Figure 3. Mean (n = 2, 3 replicate study areas; ± SE) (a) diameter (cm) and (b) crown volume (m3/tree) of crop trees in the very low-, low-, medium-, and high-density stands of lodgepole pine with and without fertilization, and unthinned (Unthin) and old-growth (Old G) stands, 25 years after initiation of treatments.
Forests 11 00337 g003
Figure 4. Mean (n = 2,3 replicate study areas; ± SE) density/ha of total crop trees and intermediate (ingress) crop trees in the very low-, low-, medium-, and high-density stands of lodgepole pine with (F) and without (UF) fertilization, and in unthinned (Unthin) and old-growth (Old G) stands, 25 years after initiation of treatments.
Forests 11 00337 g004
Figure 5. Mean crown architecture of crop trees in the 10 treatment stands at (a) Summerland and (b) Kelowna 25 years after initiation of treatments. Mean tree height (m) is represented by the top of each tree depiction, and mean tree diameter (cm) is represented by the connected open circle data points. Mean crown width is based on a relative scale among treatment stands. Very low-, low-, medium-, and high-density stands of lodgepole pine with (F) and without (UF) fertilization, and in unthinned (Unthin) and old-growth (Old G) stands.
Forests 11 00337 g005aForests 11 00337 g005b
Figure 6. Mean (n = 2, 3 replicate study areas; ± SE) merchantable volume (m3/ha) of total crop trees and intermediate (ingress) crop trees in the very low-, low-, medium-, and high-density stands of lodgepole pine with (F) and without (UF) fertilization, and in unthinned (Unthin) and old-growth (Old G) stands, 25 years after initiation of treatments.
Forests 11 00337 g006
Figure 7. Mean (n = 2, 3 replicate study areas; ± SE) total carbon storage (Mg/ha) of total crop trees and intermediate (ingress) crop trees in the very low-, low-, medium-, and high-density stands of lodgepole pine with (F) and without (UF) fertilization, and in unthinned (Unthin) and old-growth (Old G) stands, 25 years after initiation of treatments.
Forests 11 00337 g007
Table 1. Experimental design and characteristics of lodgepole pine stands for the pre-commercial thinning (PCT) and PCT with fertilization (PCT+FERT) studies, 25 years after initiation of treatments.
Density (stems/ha)Pine Crop Trees
(Mean ± SE)
Study Area and StandOriginal Pine Crop Trees 1Crop Trees Other SpeciesTotal Intermediate Crop Trees 2Total Crop Trees All Species 3DBH (cm)Height (m)Total Canopy Closure (%)
PCT study
Penticton
 Low5509531596021.8 ± 0.313.9 ± 0.187.4 ± 1.3
 Medium1190240190162018.7 ± 0.215.4 ± 0.189.8 ± 0.7
 High1670150168516.9 ± 0.214.7 ± 0.192.3 ± 0.5
 Unthinned4462400450210.6 ± 0.311.7 ± 0.288.9 ± 1.4
 Old-growth7903600115019.3 ± 0.521.0 ± 0.387.3 ± 1.7
Summerland
 Low4950820131518.2 ± 0.411.7 ± 0.288.6 ± 1.5
 Medium9357389133117.1 ± 0.211.4 ± 0.185.7 ± 1.1
 High13065954141915.7 ± 0.411.4 ± 0.285.6 ± 2.1
 Unthinned26361200275611.3 ± 0.29.9 ± 0.189.0 ± 1.2
 Old-growth148040510203019.2 ± 0.718.7 ± 0.786.5 ± 1.8
Kelowna
 Low5500900145018.0 ± 2.412.5 ± 0.494.3 ± 0.5
 Medium800167166113318.5 ± 0.515.3 ± 0.287.2 ± 3.2
 High14670100156714.6 ± 0.513.6 ± 0.192.1 ± 2.6
 Unthinned16002330183314.9 ± 1.014.5 ± 0.392.6 ± 1.2
 Old-growth 4124300124318.3 ± 0.519.8 ± 0.680.5 ± 1.4
PCT-FERT study
Summerland
 Very low210401155140521.9 ± 0.312.6 ± 0.281.6 ± 3.0
 Very low F26518038082522.0 ± 0.311.4 ± 0.180.4 ± 3.1
 Low F50515760128020.0 ± 0.411.2 ± 0.291.4 ± 1.1
 Medium F 745279086220.2 ± 0.412.6 ± 0.389.0 ± 2.3
 High F133015695158116.9 ± 0.411.3 ± 0.291.4 ± 1.1
Kelowna
 Very low20001150135022.8 ± 0.613.5 ± 1.780.9 ± 3.5
 Very low F35050800120024.5 ± 0.214.2 ± 0.488.8 ± 1.8
 Low F70067266103320.4 ± 1.014.1 ± 1.393.9 ± 1.6
 Medium F1200050125019.5 ± 0.115.3 ± 0.293.2 ± 1.6
 High F17000100180016.3 ± 1.114.7 ± 0.593.5 ± 0.5
1 Original crop trees of lodgepole pine were those trees retained during the PCT treatment. 2 Intermediate crop trees were those trees appearing as ingress after the PCT treatment. 3 Includes intermediate crop trees. 4 Old-growth stand from Penticton study area to replace lost Kelowna stand. F = fertilized stand.
Table 2. Mean (n = 3 replicate study areas) ± SE 25-year responses (1993 to 2018) of overstory and understory attributes for young lodgepole pine stands with three pre-commercial thinning densities, unthinned, and old-growth treatments at the Penticton, Summerland, and Kelowna areas. Results of analysis of variance (ANOVA) are also provided. Within a row, mean values with different letters are significantly different by Duncan’s multiple range test. Significant values in bold text.
Stand AttributeTreatmentANOVA
LowMediumHighUnthinnedOld-GrowthF4,8p
DBH (cm) (Original pine crop trees)19.33 ± 1.23ab18.09 ± 0.50ab15.76 ± 0.70b12.27 ± 1.35c18.84 ± 0.29ab9.29<0.01
Height (m) (Original pine crop trees)12.70 ± 0.64b14.00 ± 1.30b13.23 ± 0.96b12.05 ± 1.34b19.72 ± 0.59a26.29<0.01
Pine crop trees/ha531.7 ± 18.3b975.0 ± 114.3b1481.0 ± 105.3b2899.3 ± 836.6a1171.0 ± 202.4b5.290.02
Other species of crop trees/ha31.7 ± 31.7138.0 ± 68.824.7 ± 17.7131.0 ± 56.0133.3 ± 113.90.780.57
Total intermediate crop trees/ha678.3 ± 183.1a248.3 ± 70.7b51.3 ± 28.9b0 ± 0b170.0 ± 170.0b6.990.01
Total crop trees/ha1241.7 ± 146.11361.3 ± 141.41557.0 ± 77.03030.3 ± 782.61474.3 ± 279.13.510.06
Canopy closure (%)90.1 ± 2.187.6 ± 1.290.0 ± 2.290.2 ± 1.284.8 ± 2.11.540.28
Crown volume
(m3/tree)
67.75 ± 10.47a33.52 ± 4.73b26.19 ± 3.49b14.24 ± 6.74b10.74 ± 1.70b11.26<0.01
Total merchantable
volume (m3/ha)
113.3 ± 21.4b195.5 ± 48.4ab185.7 ± 36.4b192.4 ± 30.2ab324.6 ± 49.9a3.760.053
Total basal area (m2/ha) 19.4 ± 1.926.9 ± 3.529.6 ± 4.131.2 ± 4.134.0 ± 7.01.450.30
Understory conifers
(trees/ha)
2138 ± 209b1420 ± 158b1343 ± 429b2621 ± 649b17535 ± 6644a5.800.02
Abundance of herbs (m3/0.01 ha)5.45 ± 1.13a5.37 ± 0.80a3.92 ± 0.82a3.52 ± 1.49ab0.42 ± 0.11b4.170.04
Abundance of shrubs (m3/0.01 ha)29.87 ± 16.2414.98 ± 2.5310.14 ± 4.6417.02 ± 11.888.77 ± 1.631.240.37
Table 3. Mean (n = 2 replicate study areas) ± SE 25-year responses (1993 to 2018) of overstory and understory attributes for young lodgepole pine stands among four post-thinning (PCT) densities and two fertilization (FERT) treatments. Results of analysis of variance (ANOVA) are provided. Within a row, mean values with different letters are significantly different by Duncan’s multiple range test. Significant values in bold.
ANOVA
DensityFertilizerDensity × Fertilizer
Mean ValuesF3,8pF1,8pF3,8p
DBH (cm) (Original pine crop trees)very lowlowmediumhigh44.80<0.0114.93<0.010.460.72
22.76 ± 0.60a19.16 ± 0.62b18.81 ± 0.67b15.88 ± 0.50c
unfertilized fertilized
18.33 ± 0.99b 19.97 ± 0.92a
Height (m) (Original pine crop trees)very lowlowmediumhigh0.320.810.140.720.050.99
12.93 ± 0.6112.38 ± 0.6513.65 ± 0.9812.76 ± 0.84
unfertilized fertilized
12.76 ± 0.47 13.10 ± 0.60
Pine crop trees/havery lowlowmediumhigh38.61<0.011.590.240.010.99
256 ± 34d562 ± 47c920 ± 101b1451 ± 90a
unfertilized fertilized
745 ± 167 849 ± 180
Other species of crop trees/havery lowlowmediumhigh0.330.800.650.441.090.41
67 ± 3921 ± 1651 ± 3954 ± 37
unfertilized fertilized
34 ± 21 62 ± 25
Total intermediate crop treesvery lowlowmediumhigh19.60<0.0110.010.012.000.19
871 ± 183a687 ± 143a174 ± 76b87 ± 11b
unfertilized fertilized
592 ± 165a 318 ± 108b
Total crop treesvery lowlowmediumhigh5.370.032.690.141.910.21
1195 ± 131b1270 ± 87b1144 ± 102b1592 ± 78a
unfertilized fertilized
1371 ± 44 1229 ± 119
Canopy closure (%)very lowlowmediumhigh5.330.033.610.090.200.89
82.9 ± 2.0b92.1 ± 1.3a88.8 ± 1.6ab90.7 ± 1.7a
unfertilized fertilized
87.0 ± 1.6 90.2 ± 1.6
Crown volume (m3/tree)very lowlowmediumhigh10.44<0.010.660.440.270.85
88.04 ± 13.76a57.32 ± 4.50b40.06 ± 3.19bc24.61 ± 1.99c
unfertilized fertilized
49.09 ± 8.16 55.93 ± 11.69
Total merch volume (m3/ha)very lowlowmediumhigh3.230.083.640.090.100.96
102.0 ± 12.2112.8 ± 18.7172.9 ± 29.9180.60 ± 24.9
unfertilized fertilized
120.6 ± 13.3 163.5 ± 21.7
Total BA/ha (m2)very lowlowmediumhigh7.76<0.017.290.030.510.69
17.46 ± 1.74c20.34 ± 1.83bc26.78 ± 3.04ab29.50 ± 2.62a
unfertilized fertilized
20.82 ± 1.45b 26.23 ± 2.70a
Understory conifers (trees/ha)very lowlowmediumhigh1.690.253.280.110.470.71
3388 ± 6833046 ± 4002283 ± 2852546 ± 411
unfertilized fertilized
3252 ± 259 2379 ± 345
Herbs (grasses+forbs) (m3/0.01ha)very lowlowmediumhigh1.130.400.380.550.310.82
5.80 ± 0.595.03 ± 0.905.81 ± 0.783.96 ± 0.59
unfertilized fertilized
5.40 ± 0.66 4.89 ± 0.41
Shrubs (m3/0.01ha)very lowlowmediumhigh4.160.050.010.931.220.36
22.98 ± 3.09a12.33 ± 0.92b16.57 ± 1.33ab9.82 ± 4.34b
unfertilized fertilized
15.56 ± 2.89 15.29 ± 2.33
Table 4. Mean (n = 3 replicate study areas) ± SE 25-year responses (1993 to 2018) of above- and below-ground carbon storage (Mg/ha) for lodgepole pine stands with three post-thinning (PCT) densities, unthinned, and old-growth treatments. Results of analysis of variance (ANOVA) are provided. Within a row, mean values with different letters are significantly different by Duncan’s multiple range test. Significant values in bold text.
Stand AttributeTreatmentANOVA
LowMediumHighUnthinnedOld-GrowthF4,8p
Pine crop trees63.64 ± 24.6261.74 ± 12.6467.40 ± 18.3641.37 ± 6.51 60.15 ± 14.510.530.72
Other species of crop trees3.72 ± 3.729.17 ± 5.913.03 ± 1.902.81 ± 1.66 6.16 ± 4.720.840.54
Total intermediate crop trees 5.25 ± 0.792.70 ± 0.140.35 ± 0.180 ± 02.32 ± 2.323.440.07
Total crop trees72.62 ± 27.8973.61 ± 17.3970.77 ± 20.0844.18 ± 6.8468.63 ± 15.220.660.64
Understory conifers2.77 ± 0.86abc1.57 ± 0.28bc0.71 ± 0.21c5.94 ± 0.68a4.15 ± 1.65ab4.470.03
Total conifers75.39 ± 27.0375.18 ± 17.2471.48 ± 19.9950.12 ± 7.1372.78 ± 14.050.540.71
Grasses0.07 ± 0.010.06 ± 0.020.06 ± 0.010.06 ± 0.010.03 ± 0.001.940.20
Herbs (grasses+forbs)0.12 ± 0.010.11 ± 0.010.10 ± 0.010.10 ± 0.020.06 ± 0.0013.310.07
Shrubs0.09 ± 0.040.06 ± 0.010.04 ± 0.010.06 ± 0.030.04 ± 0.0041.330.34
Grand total75.61 ± 27.0675.35 ± 17.2471.62 ± 20.0250.28 ± 7.1372.89 ± 14.040.540.71
Table 5. Mean (n = 2 replicate study areas) ± SE 25-year responses (1993 to 2018) of above- and below-ground carbon storage (Mg/ha) for young lodgepole pine stands among four post-thinning densities (PCT) and two fertilization (FERT) treatments. Results of analysis of variance (ANOVA) are provided. Within a row, mean values with different letters are significantly different by Duncan’s multiple range test. Significant values in bold.
ANOVA
DensityFertilizerDensity × Fertilizer
Mean ValuesF3,8pF1,8pF3,8p
Pine crop treesvery lowlowmediumhigh3.440.0711.030.010.230.88
39.55 ± 6.8047.37 ± 6.1163.40 ± 8.8558.34 ± 7.66
unfertilized fertilized
42.55 ± 5.17b 61.79 ± 4.34a
Other species of crop treesvery lowlowmediumhigh1.440.302.470.161.610.26
5.71 ± 2.620.97 ± 0.592.33 ± 1.562.85 ± 2.09
unfertilized fertilized
1.66 ± 0.88 4.27 ± 1.61
Total intermediate crop treesvery lowlowmediumhigh12.71<0.011.810.221.310.34
11.10 ± 2.35a5.55 ± 1.30b1.72 ± 0.67bc0.95 ± 0.25c
unfertilized fertilized
5.70 ± 2.08 3.95 ± 1.31
Total crop treesvery lowlowmediumhigh0.800.538.720.020.030.99
56.36 ± 8.5853.89 ± 6.4467.46 ± 7.4662.14 ± 9.42
unfertilized fertilized
49.91 ± 4.75b 70.01 ± 3.49a
Understory conifersvery lowlowmediumhigh3.050.090.990.350.210.89
4.45 ± 1.492.55 ± 0.631.51 ± 0.320.71 ± 0.14
unfertilized fertilized
2.76 ± 0.87 1.84 ± 0.58
Total conifersvery lowlowmediumhigh0.510.696.890.030.040.99
60.81 ± 9.4556.44 ± 5.9768.96 ± 7.2762.85 ± 9.46
unfertilized fertilized
52.68 ± 5.01b 71.85 ± 3.42a
Grassesvery lowlowmediumhigh0.460.720.590.460.640.61
0.070 ± 0.0040.059 ± 0.0130.055 ± 0.0180.050 ± 0.007
unfertilized fertilized
0.063 ± 0.008 0.054 ± 0.008
Herbs (grasses+forbs)very lowlowmediumhigh0.720.570.570.470.480.70
0.121 ± 0.0050.109 ± 0.0110.112 ± 0.0140.098 ± 0.007
unfertilized fertilized
0.114 ± 0.008 0.106 ± 0.007
Shrubsvery lowlowmediumhigh2.320.150.150.711.320.33
0.073 ± 0.0070.050 ± 0.0070.061 ± 0.0050.046 ± 0.012
unfertilized fertilized
0.059 ± 0.007 0.056 ± 0.006
Grand totalvery lowlowmediumhigh0.510.696.880.030.040.99
61.00 ± 9.4556.60 ± 5.9669.14 ± 7.2762.99 ± 9.46
unfertilized fertilized
52.85 ± 5.01b 72.01 ± 3.42a

