Article

Estimation of Tree Heights in an Uneven-Aged, Mixed Forest in Northern Iran Using Artificial Intelligence and Empirical Models

by
Mahmoud Bayat
1,*,
Pete Bettinger
2,
Sahar Heidari
3,
Azad Henareh Khalyani
4,
Meghdad Jourgholami
5 and
Seyedeh Kosar Hamidi
6
1
Research Institute of Forests and Rangelands, Agricultural Research, Education and Extension Organization (AREEO), Tehran 13185-116, Iran
2
Warnell School of Forestry and Natural Resources, University of Georgia, Athens, GA 30602, USA
3
Department of Environment, Faculty of Natural Resources, University of Tehran, Karaj 999067, Alborz, Iran
4
Department of Agriculture and Environmental Science, Lincoln University of Missouri, Jefferson City, MO 65101, USA
5
Department of Forestry and Forest Economics, Faculty of Natural Resources, University of Tehran, Karaj 999067, Alborz, Iran
6
Department of Forestry, Faculty of Natural Resources, Sari Agricultural Sciences and Natural Resources University, Sari 4818168984, Mazandaran, Iran
*
Author to whom correspondence should be addressed.
Forests 2020, 11(3), 324; https://doi.org/10.3390/f11030324
Submission received: 8 February 2020 / Revised: 10 March 2020 / Accepted: 12 March 2020 / Published: 14 March 2020
(This article belongs to the Section Forest Inventory, Modeling and Remote Sensing)

Abstract

:
The diameters and heights of trees are two of the most important components in a forest inventory. In some circumstances, the heights of trees need to be estimated due to the time and cost involved in measuring them in the field. Artificial intelligence models have many advantages in modeling nonlinear height–diameter relationships of trees, which sometimes make them more useful than empirical models in estimating the heights of trees. In the present study, the heights of trees in uneven-aged and mixed stands in the high elevation forests of northern Iran were estimated using an artificial neural network (ANN) model, an adaptive neuro-fuzzy inference system (ANFIS) model, and empirical models. A systematic sampling method with a 150 × 200 m network (0.1 ha area) was employed. The diameters and heights of 516 trees were measured to support the modeling effort. Using 10 nonlinear empirical models, the ANN model, and the ANFIS model, the relationship between height as a dependent variable and diameter as an independent variable was analyzed. The results show, according to R2, relative root mean square error (RMSE), and other model evaluation criteria, that there is a greater consistency between predicted height and observed height when using artificial intelligence models (R2 = 0.78; RMSE (%) = 18.49) than when using regression analysis (R2 = 0.68; RMSE (%) = 17.69). Thus, it can be said that these models may be better than empirical models for predicting the heights of common, commercially-important trees in the study area.

1. Introduction

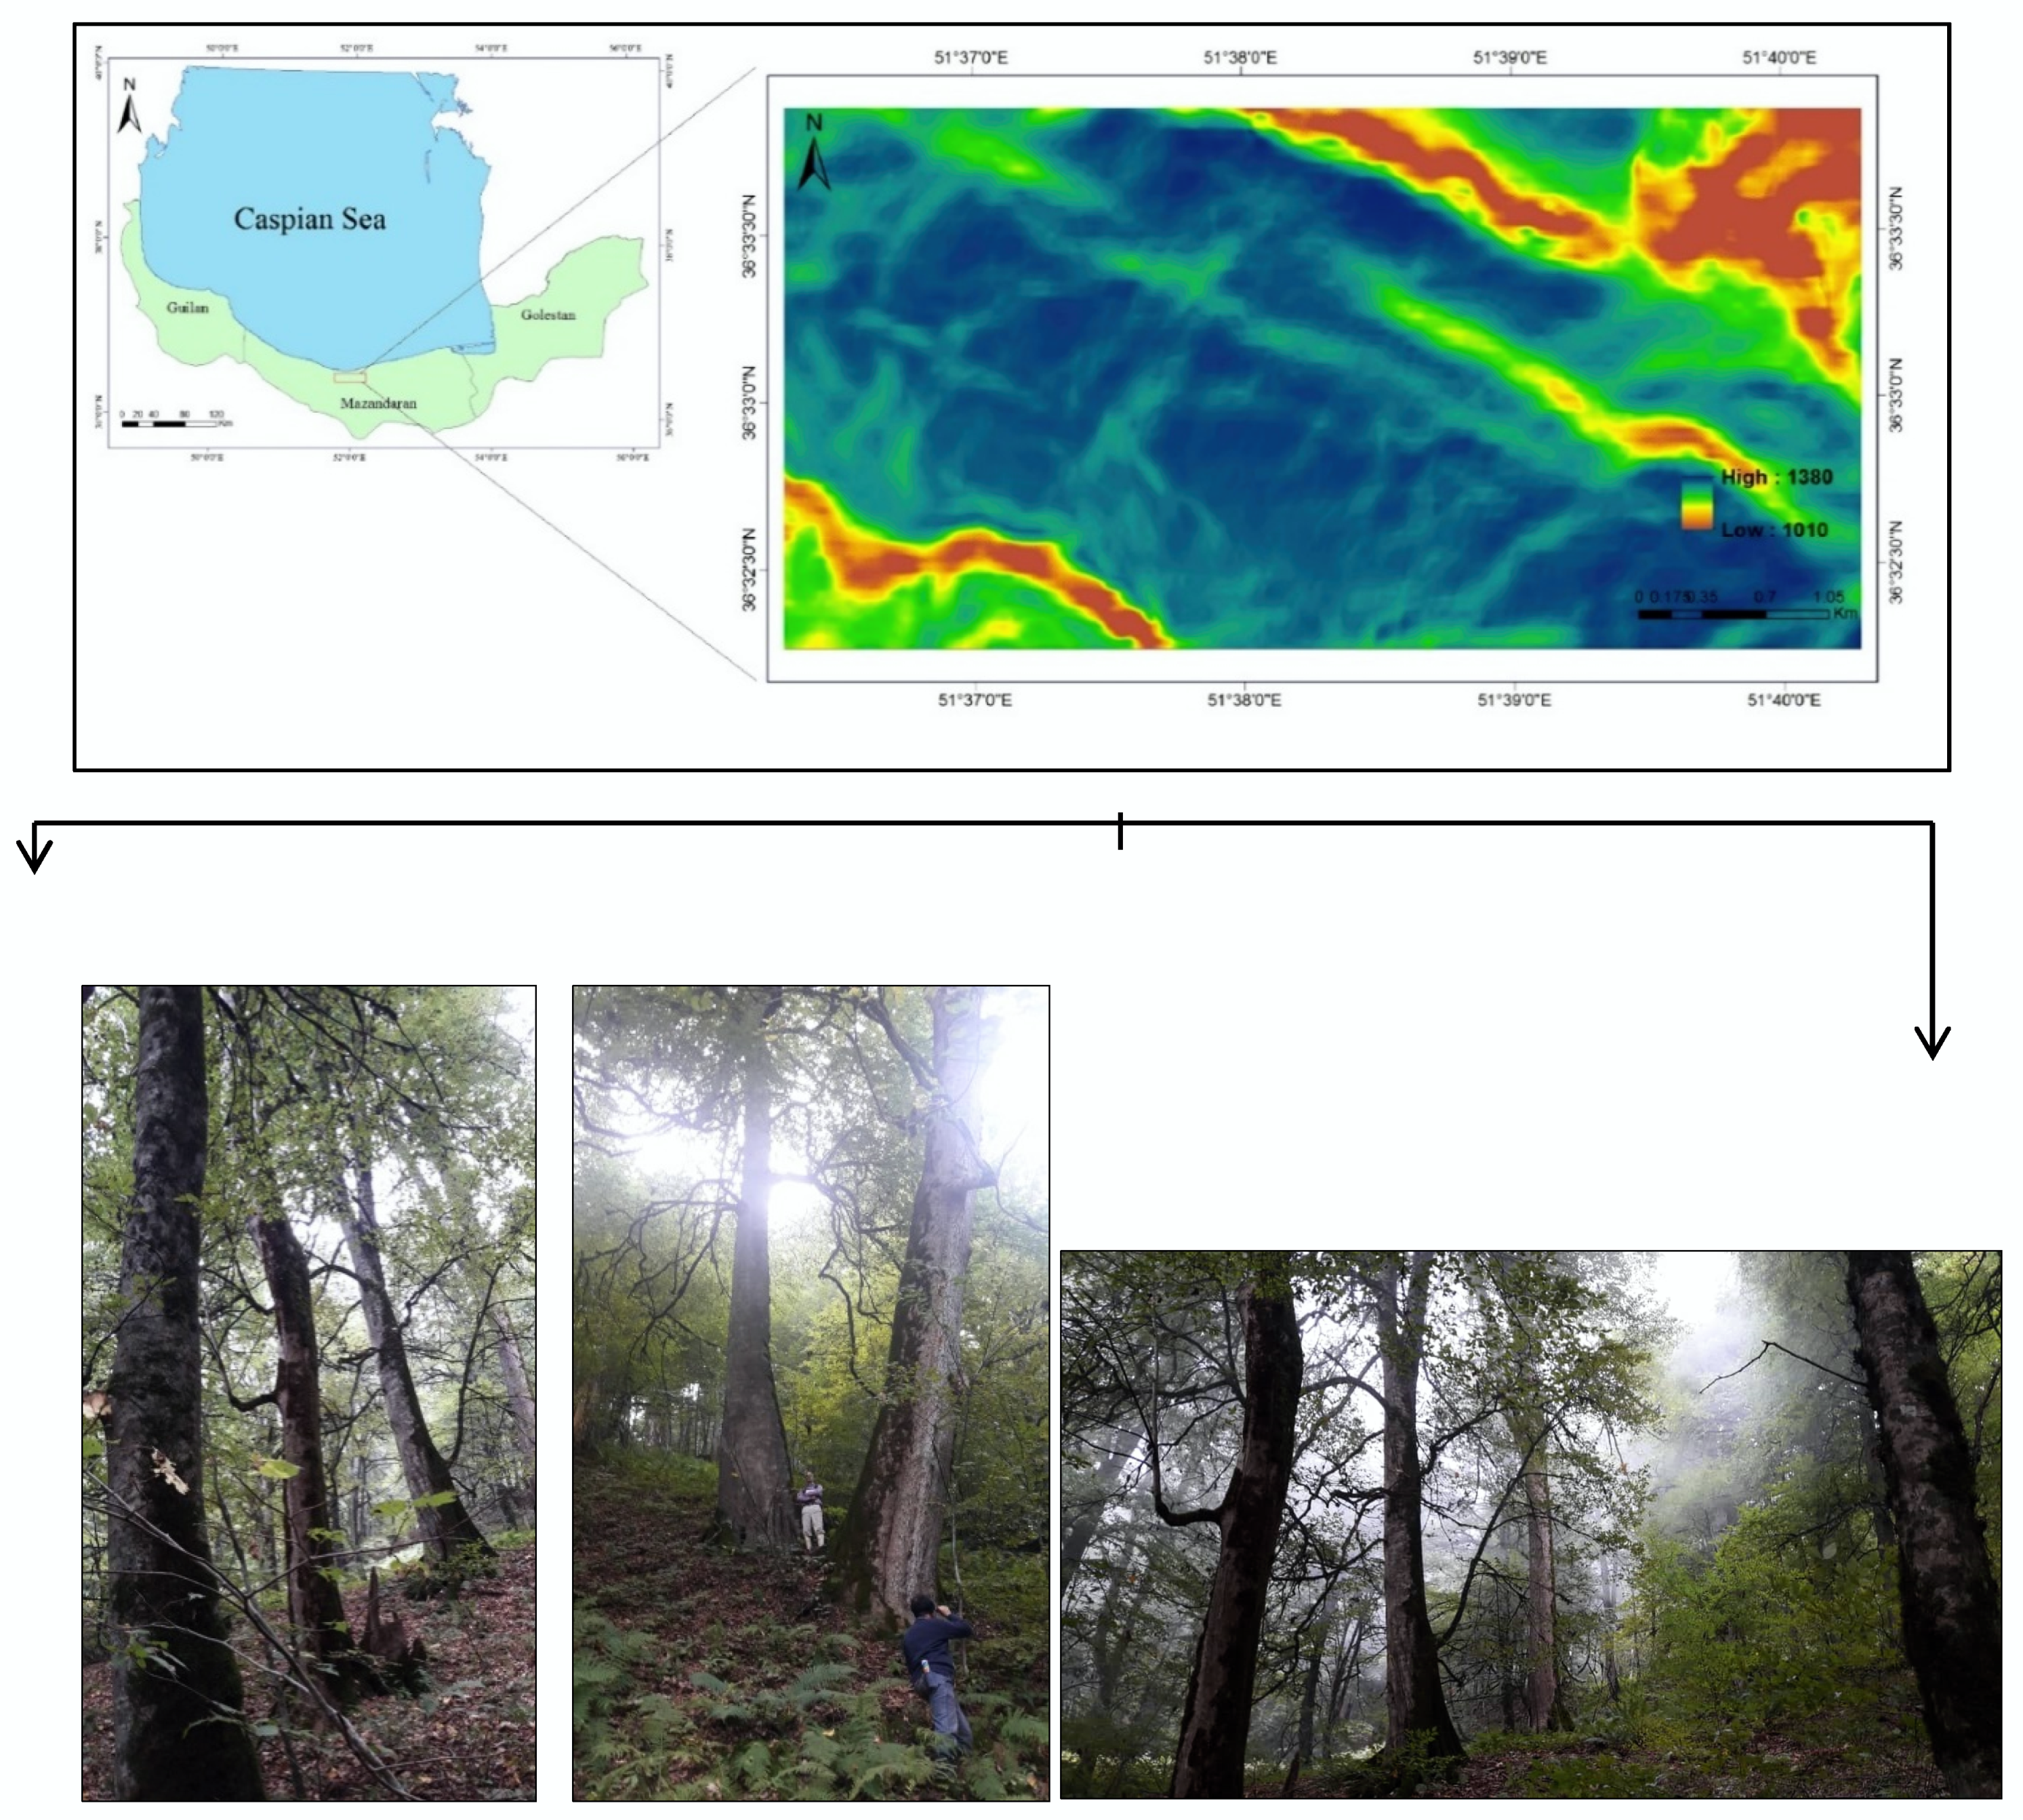
Hyrcanian forests, the only commercial forests in Iran, are considered complete biological communities. They have the highest degree of self-regulation and self-renewal among all natural ecosystems in Iran. Hyrcanian forests can be considered both as a starting point for efforts to maintain an ecological balance in nature, and as a model of irreplaceable pattern in forest science for the application of different methods of forestry [1,2,3]. In concert with new management approaches for forest ecosystems, which can be based on multipurpose forestry goals, managers need accurate and precise diameter–height relationships to assess growth and production in the sustainable management of these resources [4,5]. Hence, diameter–height models are essential to better understand different relationships in nature, as well as to describe and study the differences and effects on forest ecosystem development [4,6,7]. Further, the accuracy of such models is very important for the preparation of accurate volume tables and for the development of growth prediction models [8]. For this reason, forest managers need to be informed of the connection between the diameters and heights of trees, and be able to accurately estimate the heights of trees using diameter at breast height (DBH). Oriental beech (Fagus orientalis Lipsky), commonhornbeam (Carpinus betulus L.), Caucasian alder (Alnus subcordata C.A. Mey), velvetmaple (Acer velutinum Boiss.), and large-leaved lime tree (Tilia platyphyllos Scop.) are the main native species of the northern Hyrcanian forests of Iran, and are the most important and most valuable commercial species. Studying the height and diameter characteristics of these trees is very important and can provide valuable information for the management of these forests by future generations of society.
Total tree height is an important factor in forest management, as it is needed for determining many important forest-related indexes, such as growing stock volume, above-ground biomass, and carbon stock [9]. While total tree height can be directly measured with analog devices (clinometers) or lasers, there are several methods for estimating total tree height, and they fall into three common categories: empirical, process, and hybrid models. Biological factors such as age and diameter are the main inputs of empirical regression models to estimate tree height [10]. Process models can be created by including local indicators, such as precipitation, climate, and soil properties of the area, and other relevant factors to estimate total tree height. Hybrid models to estimate tree heights, through the integration of experimental models and process models, can also be created. These include mixed linear effects models and nonlinear mixed effects models, which may increase both accuracy and flexibility in modeling total tree height [11].
The use of artificial intelligence (AI) methods to estimate forest yield has been highlighted in recent years. Artificial neural networks (ANNs) are a group of AI methods that can be used as an alternative to traditional modeling techniques such as regression models [12], because they are more generalizable, and are less sensitive to noise and outliers. They can be more powerful than regression models when modeling nonlinear relationships unknown to modelers [13]. Importantly, the implementation of AI techniques in forestry has generally been limited to the use of ANNs and other similar methods, such as fuzzy logic and adaptive neuro-fuzzy inference systems (ANFIS). Results of different studies have illustrated satisfactory results for the prediction of landslides, wildfires, and forest road network suitability [14,15,16]. However, the use of ANNs to address nonlinear growth and yield problems has also become a very important issue [17]. These types of models are able to address problems with nonlinear relationships between model parameters, and they are not restricted by the assumptions of empirical models [8,18]. An ANFIS is a fuzzy system with a parallel structure, and neural network learning algorithms are used to adjust the fuzzy system parameters [13]. Although the use of ANFIS in many fields still is in early stages, in recent years good results have been realized when applying these methods to some forestry problems [19,20,21].
Different models of height and diameter relationships have been presented in the literature. For example, Özçelik et al. [8] modeled height–diameter relationships in southwestern Turkey using empirical models and neural networks. Their results showed that neural network models may be a good alternative to other methods for estimating tree heights. Ahmadi et al. [
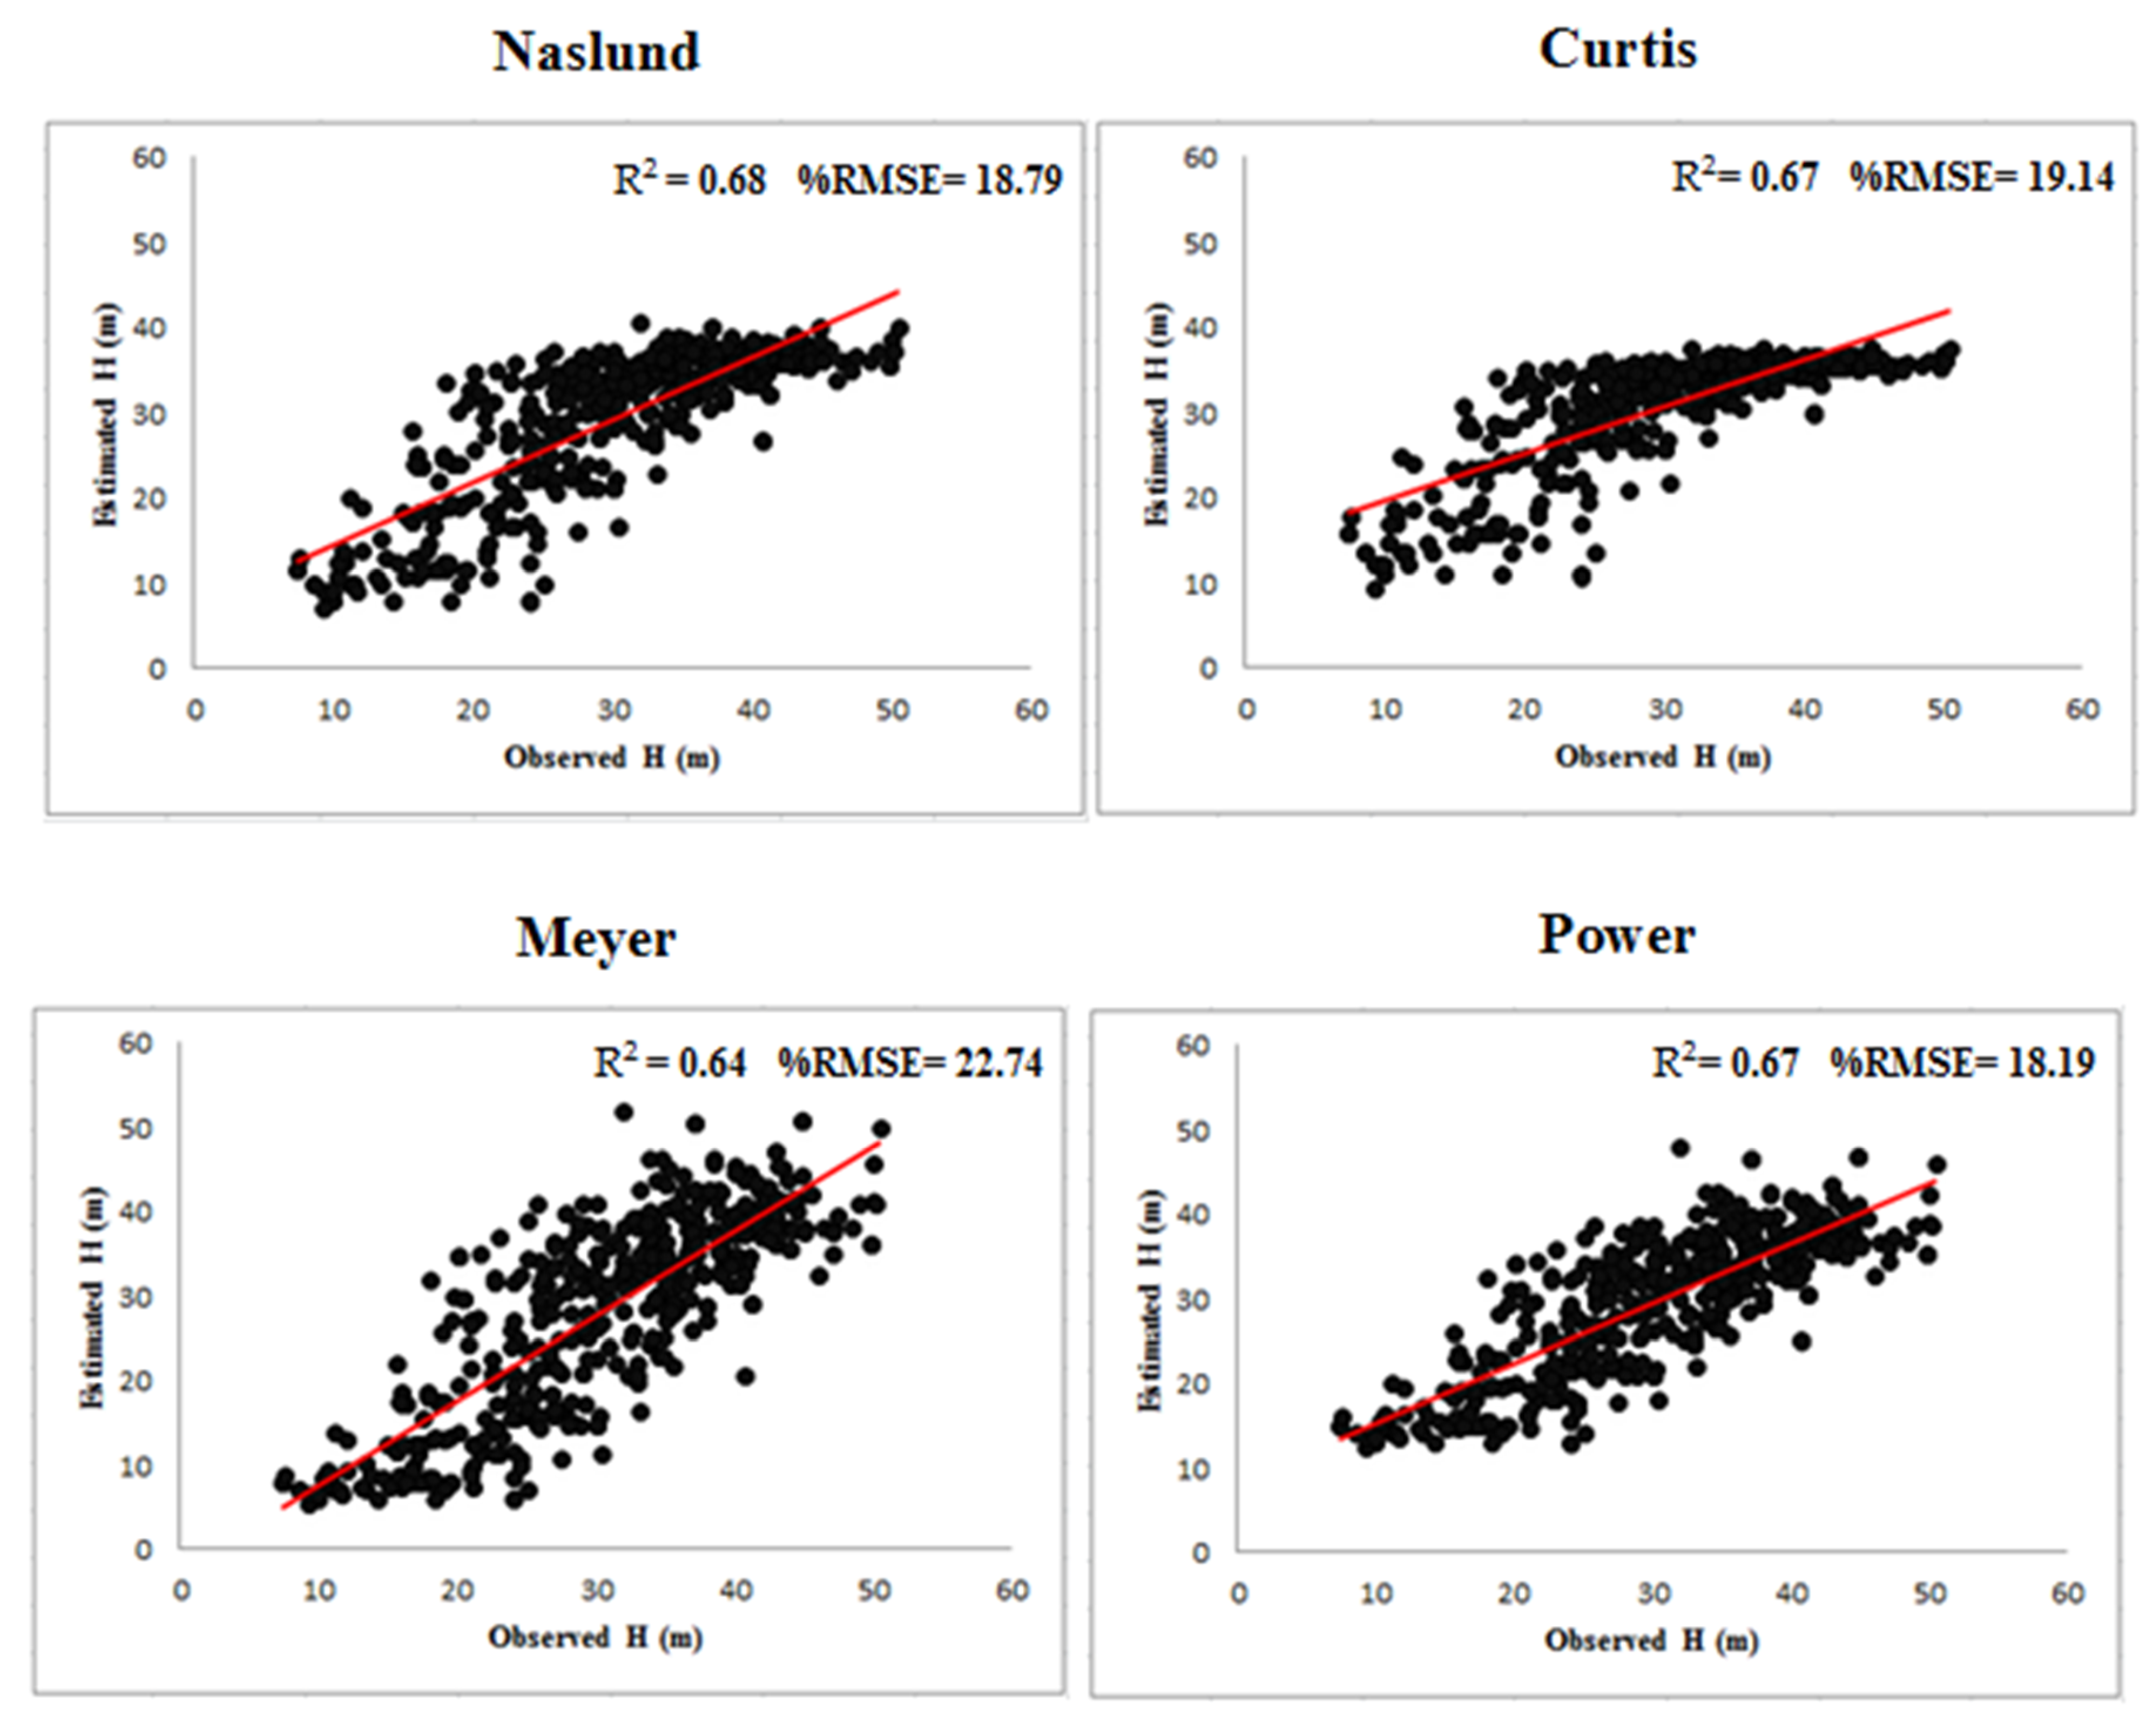
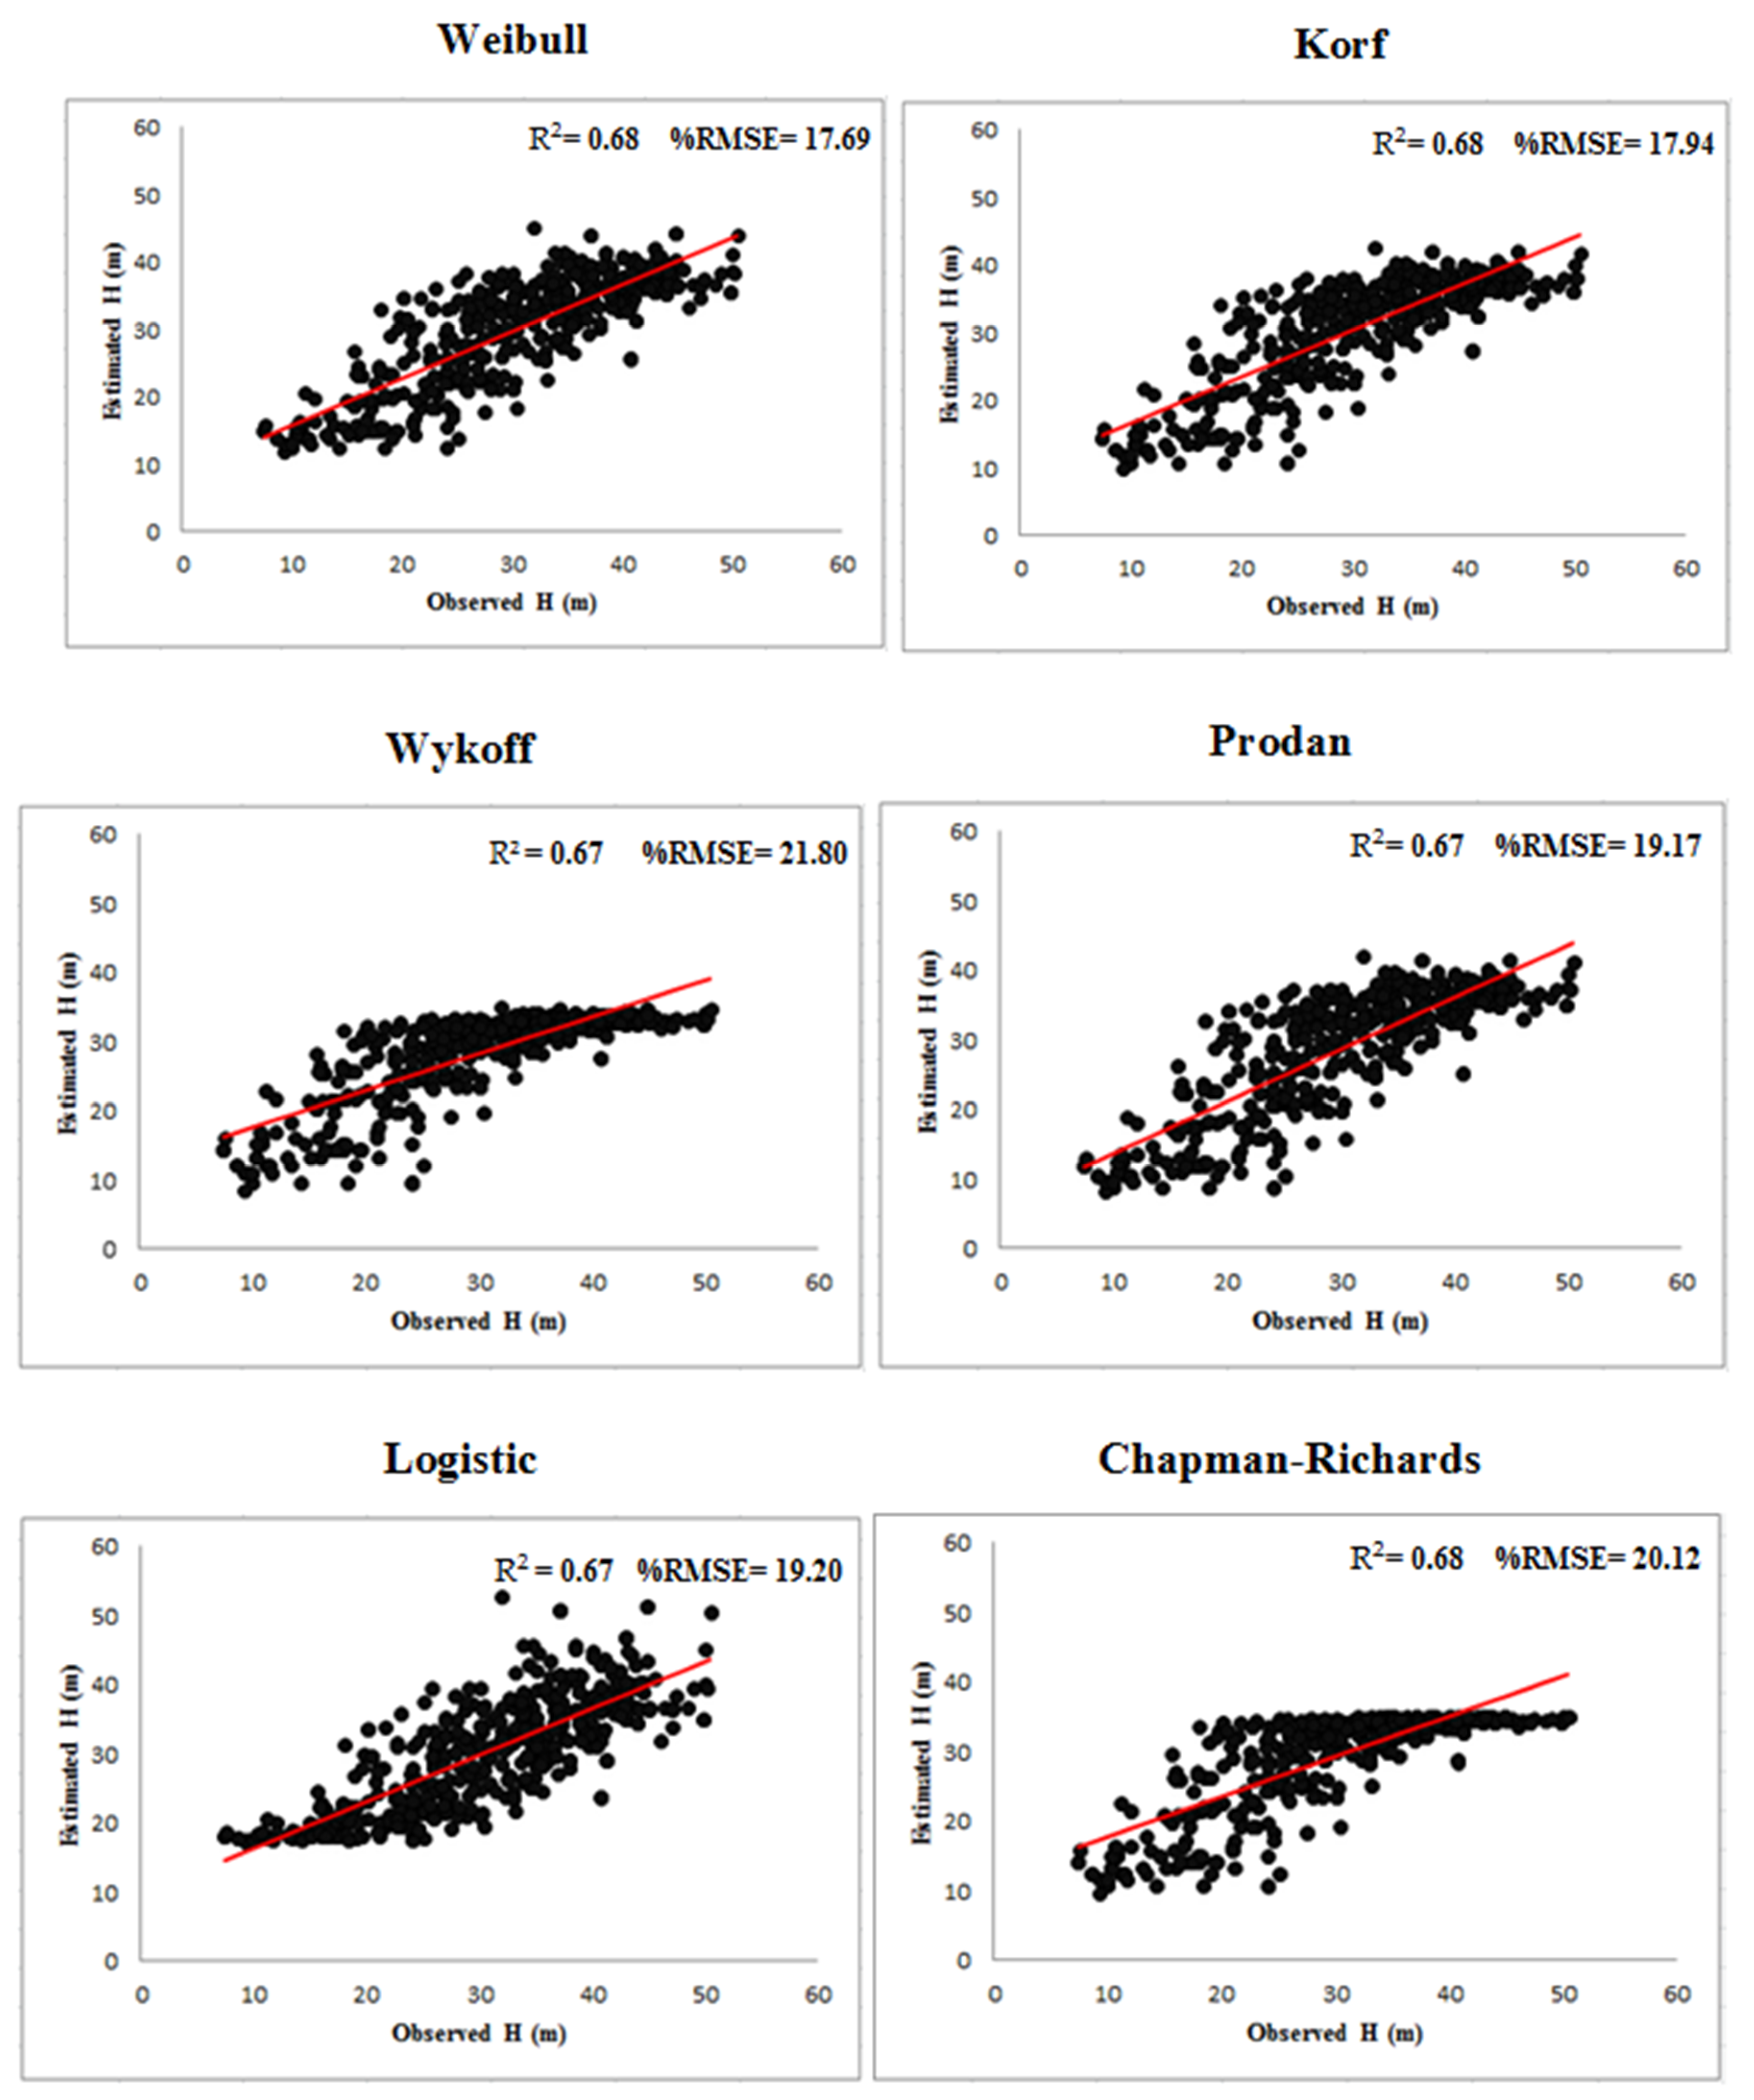
22] modeled height–diameter relationships in the educational and research forest of Tarbiat Modares University using Weibull, Schnute, and Richards forms of regression, and found that Richards’ model performed the best due to its greater efficiency. Bayat et al. [23] used diameter and height models to obtain the height of Fagus orientalis in the Gorazbon district of the Kheiroud educational research forest of Iran, and showed that the Prodan model had more acceptable results than others examined. Vieira et al. [13] used empirical models, ANNs, and ANFIS models to obtain the diameters and heights of trees of eucalyptus. They concluded that the ANN and the ANFIS models had greater accuracy than empirical models in diameter and height estimation. Nguyen Thanh et al. [24] examined the usefulness of nonlinear equations and ANN models for describing height–diameter relationships in three diverse stand densities of a Korean pine plantation, and found that while all models performed well in describing height–diameter relationships, ANN models could decrease the RMSE the greatest. Zhou et al. [11] estimated DBH in a forest area in China using multivariate linear regression and generalized regression neural network models, and found that the latter provided better results with stronger generalizability.
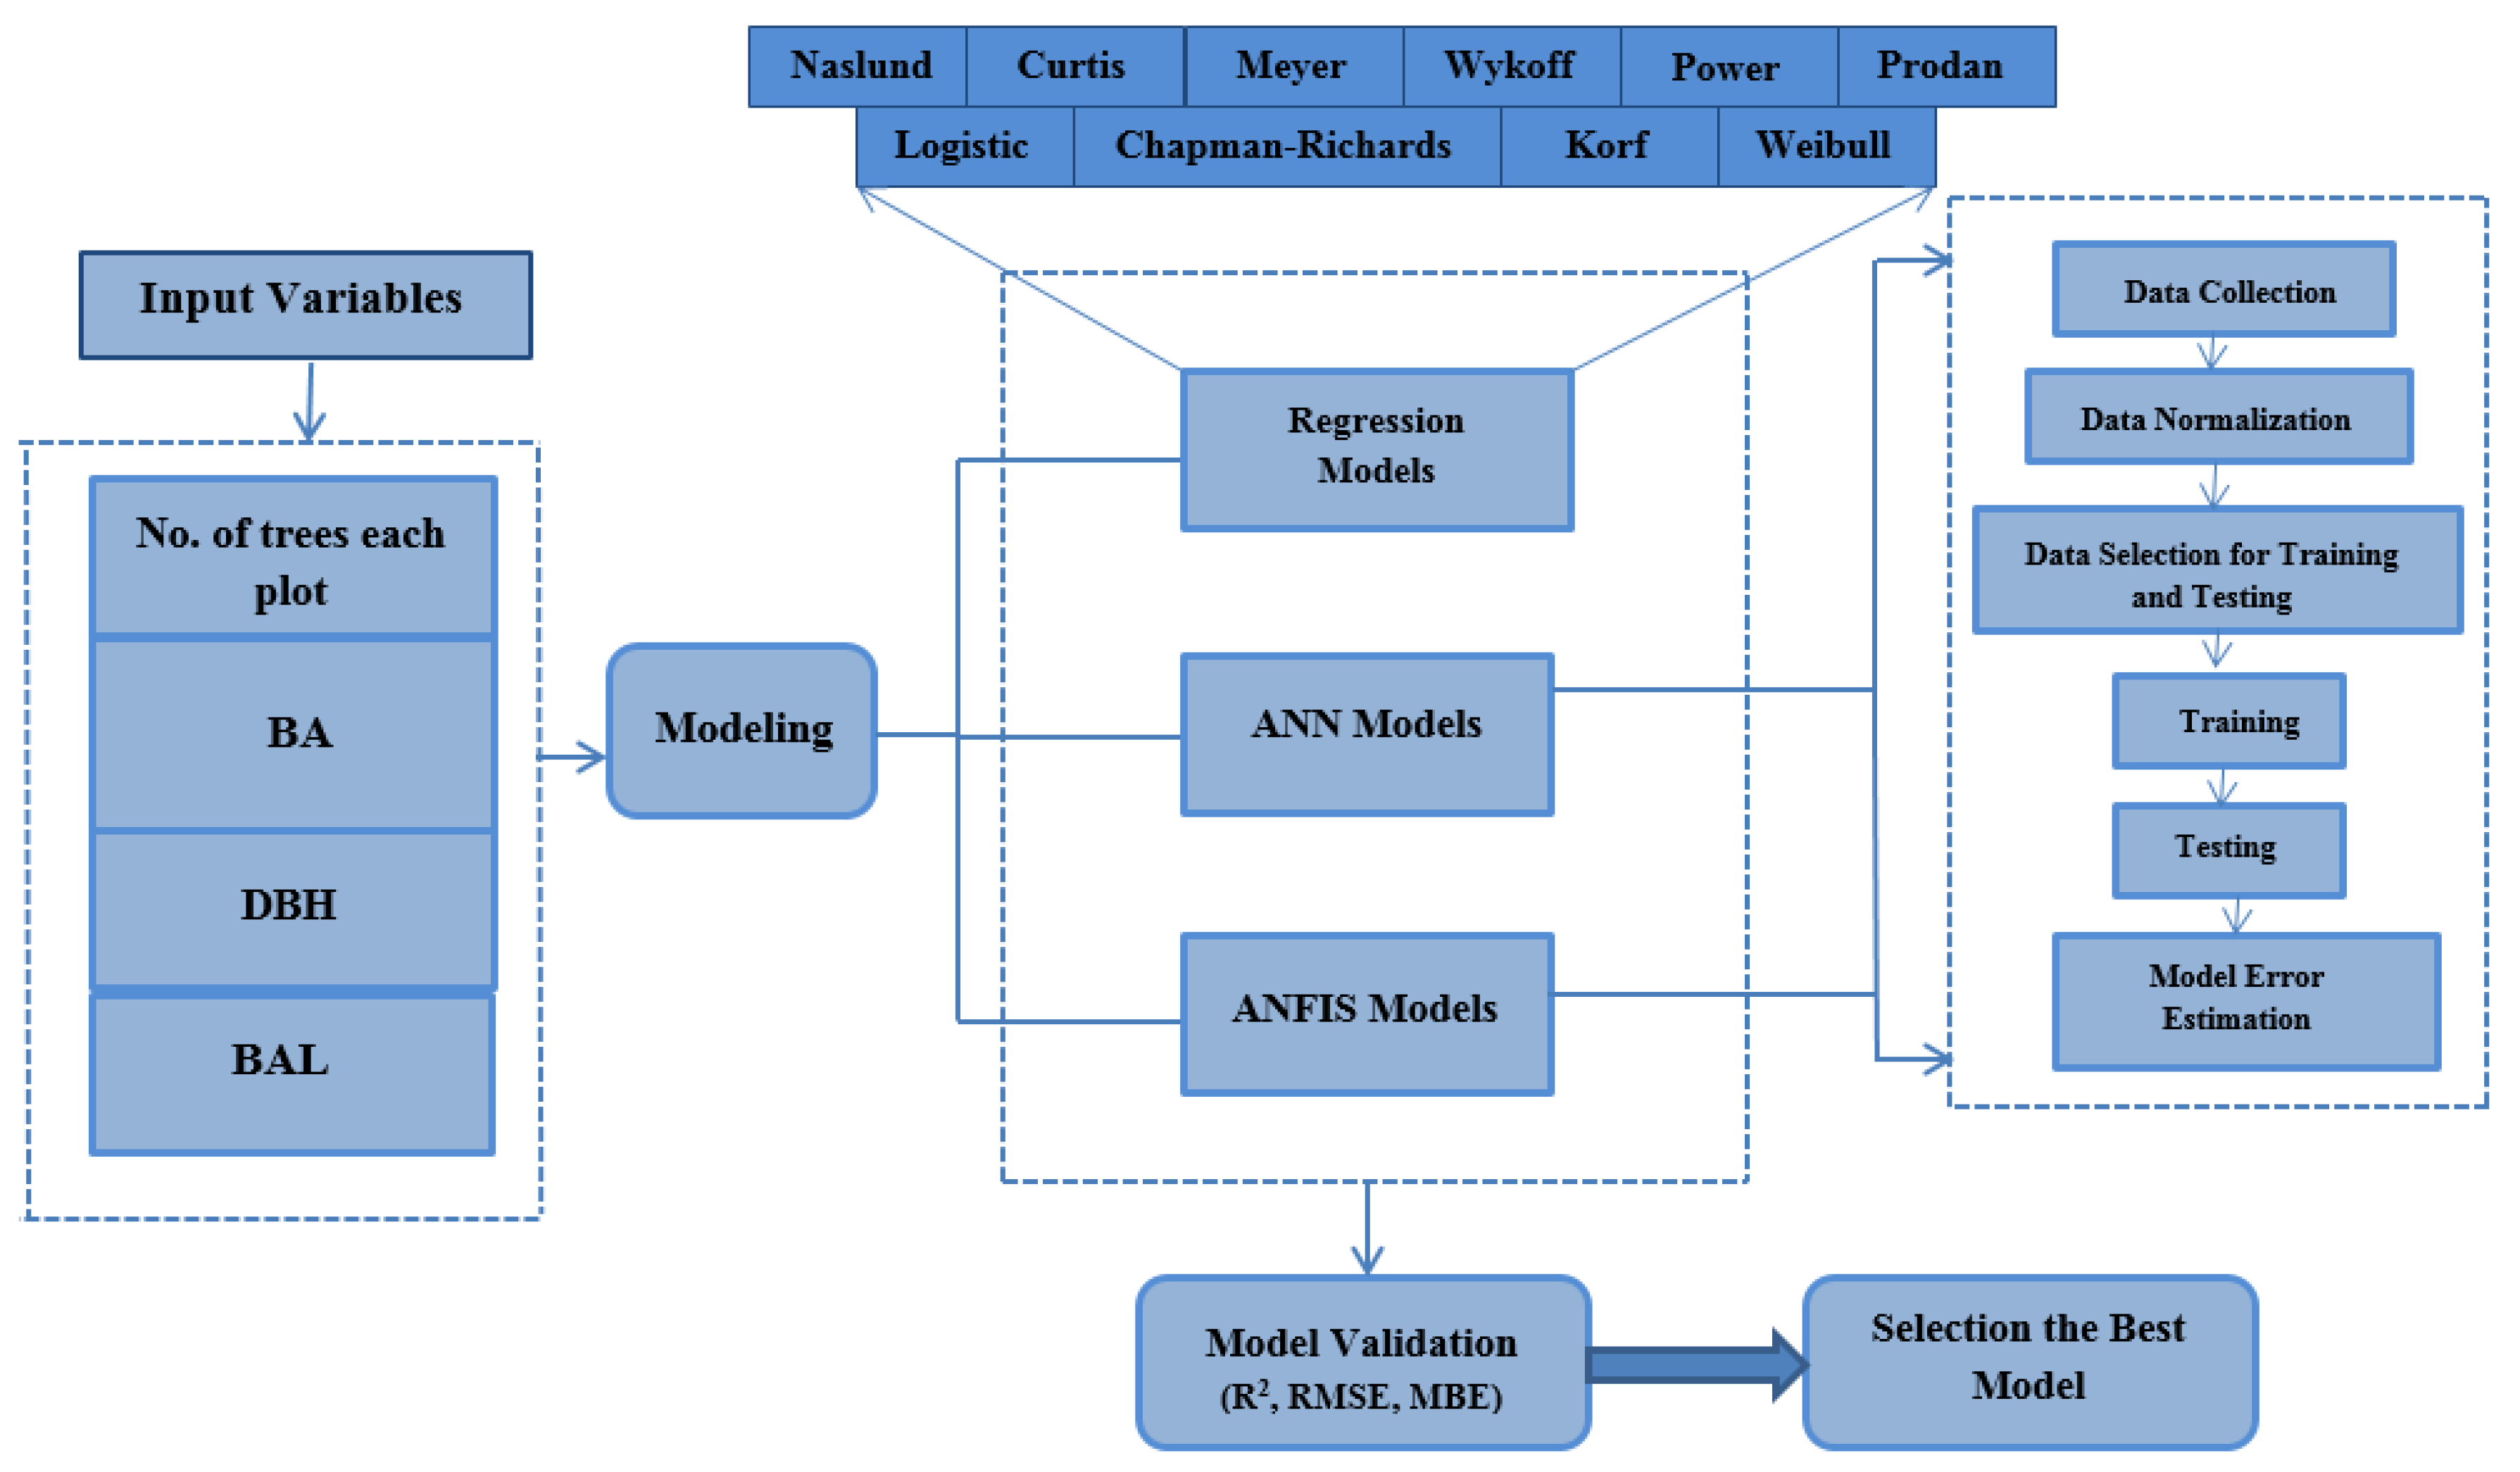
Generally, the above studies on the effectiveness of different height–diameter models indicated that results can vary for different habitats and species, and even in different conditions, such as different stand densities and relative positions of trees. The purpose of this paper is to examine the quality of results produced by estimating total tree height from DBH in Hyrcanian forests, using ANN and ANFIS models, so that the advantages and disadvantages of these methods can be compared against more traditional empirical models. Further, we hope to find an accurate and appropriate method for predicting tree heights for the most important and economically valuable species in the forests of northern Iran.

2. Materials and Methods

2.1. Study Area

The study was conducted in Kheyrud forest, which is an experimental forest located in an 80 km2, unmanaged section of the greater Hyrcanian forests in Mazandaran province in northern Iran (Figure 1). Kheyrud forest is located the 7 km east of Noshahr at 36°39′ N, 51°30′ E; datum WGS84. This forest has eight sections, one of which is the Gorazbon section [3]. These areas support about 80 native tree species and 50 native shrub species. The mean annual precipitation, temperature, and evaporation in this area are 1.397 mm, 15.5 °C, and 1.031 mm, respectively. The highest elevation for the Gorazben section is reported to be 1380 m AMSL and the lower northern boundary is located at about 1010 m AMSL. This area is also karst in character, and Calcisols are the main types of soils [23].
The Gorazbon section of Kheyroud is composed of an uneven-aged, mixed species forest, and in most parts has at least three stories. The main species of this section are oriental beech, common hornbeam, Caucasian alder, and Persian maple. In addition, due to the prevailing ecological conditions in this section, oak, hornbeam, maple, alder, alder, lily, and barangay forest stands have been introduced into the beech communities. In general, four forest vegetation communities were identified in the Gorazbon section: (1) a Querco-Carpinetum community, (2) a Fageto-Carpinetum community, (3) a Fagetum mix community, and (4) a Fagetum orientalis community. This forest is in the range of 0.5 to 1.5 for biodiversity indices such as the Shannon–Wiener index and the Simpson index [3].

2.2. Data Collection

The data collection effort was carried out in a systematic manner, by distributing 258 0.1-hectare fixed circular plots on a rectangular grid of 150 × 200 m throughout the study area. The DBHs of the trees before and after the growing season were measured in 2003 and 2012. In 2012, new trees (ingrowth), that were 8 cm or greater in diameter were added to the inventory, and their characteristics were recorded. The analysis of this study is partly based on data collected in 2003 and the mixed effect was not significant. The workflow associated with this project is illustrated in Figure 2.

2.3. The Tree Database

The diameters and heights of the largest (with respect to DBH according to [2]) trees closest to the center of each circular sample plot were measured. Diameters were measured using calipers, and as a result, 516 paired DBH and total tree height data points were available for the subsequent modeling efforts. For purposes of this study, 70% of the data (height-DBH pairs) was used for modeling and the remaining 30% was used for evaluating the resulting models. For 10 nonlinear empirical models, the relationship between total height (the dependent variable) and DBH (the independent variable) was considered and analyzed using R software. These measurements suggest that a high degree of variability exists in the tree density and the average size of trees (Table 1). The means, minima, maxima, and standard deviations of the diameter at the breast height and the height, respectively, of all trees in the study area, are shown in Table 1. There were wide ranges in diameters and heights of the sample trees, and therefore, there was a relatively high amount of variation in the data. The coefficient of variation in DBH measurements was over 52%, while the coefficient of variation in total tree height measurements was over 31%.

2.4. Input Variables of the Models

The variables used for predicting the heights of trees in this study were diameter at breast height (DBH, cm), basal area of the largest trees (BAL, m2ha−1), total basal area (BA, m2ha−1), and number of trees in each plot (NT). In our study, no site factors were included in any of the models. In initial tests, slope, elevation, and aspect were found to not be significant predictors of tree heights, most probably because the data were collected from a limited area [2].

2.5. Artificial Neural Network (ANN) Models

ANNs are widely used machine learning methods, and are inspired by the human brain’s nervous system and the massive set of parallel processing units, functioning as a collective system, which solves problems [25]. These models, like other artificial intelligence methods, can simplify complex, nonlinear relationships among phenomena. Multi-layer perceptron is a class of ANN that was used in this study because it has high efficiency when solving classification problems. A multi-layer perceptron ANN consists of neurons that contain input, hidden, and output layers that act in concert to converge on a minimum-error solution to a problem [25,26]. A feed-forward back-propagation algorithm is also used for regulating the relationship between neurosis and weights (Wi). Another algorithm employed which is commonly used in natural resource studies ([27,28] and references therein) is back propagation, in which a matrix of weights creates connections between neurons. The net input of each neuron (xi) is a function of an assumed weight matrix [18].

2.6. Adaptive Neuro-Fuzzy Inference System (ANFIS)

ANFIS is based on fuzzy logic and adheres to ANN principles to deal with the nonlinear functions and address turbulent time series data [29]. An ANFIS is thus an intelligent system derived from two important components (ANN and fuzzy logic), and is widely used in natural hazard prediction (e.g., [13] and references therein). Structurally, the ANFIS model has a layered network that includes an input layer of three neurons, a fuzzy layer with six membership functions, one layer with 9 fuzzy rules, a normalization layer with 9 neurons, and one final layer with a single neuron [19]. The full details of the ANFIS model can be found in related literature [29,30].
Input data for training and testing are required for each network. In the present study, 70% of data were for network training, 15% for validation, and 15% for testing purposes.
n e t = i = 1 n W i x i + θ
where, Wi is the weight and xi is the input; θ represents the bias weights; and net is the output of each neuron that is determined by the sigmoid transfer function (Equation (2)), which is the most common activation function in a back propagation training algorithm.
f ( n e t ) = 1 1 + exp ( n e t )
The details of the neural network method, including input, output, and activation functions, can be seen in Table 2.
The log-sigmoid activation function is:
f ( x ) = 1 1 + e x
where x is input information of neuron and f(x) is an activation function whose result ranges between 0 and 1 [31]. A hyperbolic tangent sigmoid function is related to a bipolar sigmoid function whose outputs range from −1 to 1 [32]. Subtractive clustering (SC) is an upgraded version of the mountain method, which depends heavily on data dimensions and network resolution, so it is not efficient for high-dimensional and high-resolution datasets [33]. The grid partition algorithm is limited to a few partition entries, because the number of rules increases exponentially with an increasing number of entries, causing difficulty in processing [34].

2.7. Performance Evaluation

To evaluate the quality of the method used, the indicators described in the Table 3 are assessed. In order to understand the relationship between the observed values and the modeled values, diagrams have been plotted, along with diagrams to visualize the residuals. The errors of observations are also expressed in percentages (Equation (3)).
Wherein: yi: observed value of the ith variable; ŷi: estimated value of the ith variable; ȳ: mean of the observed values of the variable; ŷm: mean of the estimated values of the variable; n: sample size
E ( % ) = y i y ι ^ y i × 100
where: E (%) = error of each observation; yi: observed value of the ith variable; ŷi: modeled value of the ith variable.

2.8. Estimation of Parameters and Comparison of Empirical Models

Traditional empirical prediction models examine the relationship between one or more independent variable (e.g., tree diameter, canopy width) and a dependent variable (e.g., tree height) for circumstances in which the cost of collecting the dependent variable data is very high. In this paper, 10 empirical diameter-height models were developed to predict the heights of trees in the study area (Table 4). These nonlinear empirical models included five models with two parameters, and five models with three parameters. The relationship between total tree height (the dependent variable) and DBH (the independent variable) was examined and analyzed using R software.

3. Results

3.1. Modeling and Prediction Based on Empirical Models

The coefficients of the empirical models are noted in Table 5; the modeling results indicate that the variation in the independent variable (DBH) described is about 64%–69% of the variation in total tree height. This reflects the development of moderately good models; however, the RMSE is quite large (18%–24%) for each model. According to the results, the Weibull model, with an R2 of 0.6875, an RMSE(%) of 18.28, and a BIAS of 1.28, seemed to be best able to estimate tree heights, even though the Curtis model had the lowest bias. When the models developed were applied to the evaluation data, the Weibull model also seemed to perform the best, as it had the highest R2 and lowest RMSE, even though the Curtis model once again had the lowest bias (Table 6). Figure 3 and Figure 4 illustrate the behaviors of the two and three-parametric models for estimating tree height based on DBH, and Figure 5 shows the behavior of the best model. Figure 6 shows the predicted height values against the actual heights obtained in the empirical models. The distributions of observed vs. estimated tree heights suggest that the power or the Weibull empirical models more reasonably estimate total tree heights from DBH measurements. The other eight models all displayed some problems in estimating either the maximum (seven of the models) or the minimum (the logistic model) total tree height. In summary, from this analysis, the Weibull model was selected as the best model among the 10 empirical models.

3.2. Modeling and Prediction Based on ANN and ANFIS Models

As can be seen in the Table 7, most of the parameters for validation using ANN and ANFIS models are very similar. Table 8 illustrates outcomes from the results of training and validation efficiency using the ANN and ANFIS models. In Figure 7 and Figure 8, the correlation between the observed and predicted height values, and the error rates of ANN and ANFIS models, are shown. The distribution among the estimated and observed total tree heights is reasonable, and does not display the problems noted earlier (related to maximum or minimum heights) with eight of the empirical models. Table 8 compares RMSE% and R2 between all three groups of models (empirical models, ANFIS and ANN). As it can be seen, the R2 is clearly higher when using the artificial intelligence models than the empirical models, and the RMSE is either similar or smaller than what was observed with the ten empirical models.

4. Discussion

All modeling methods that predict forest performance, such as regression models and artificial intelligence models, have their own strengths and weaknesses. Although traditional regression models are capable of providing specific formulas, and these may make it easier to understand the relationships between variables in these models, these models have many limitations, including being independent of the range of statistical assumptions, such as a normal distribution of data, independence of variables, and so on [18,49,50]. One of the advantages of artificial intelligence techniques in stubborn modeling is that in many cases they do not have the same limitations of empirical models. For example, some assumptions (data normality and others) can affect the quality of empirical models. Other advantages of artificial intelligence techniques are the ability to work with qualitative variables and the relative accuracy and precision of these models [
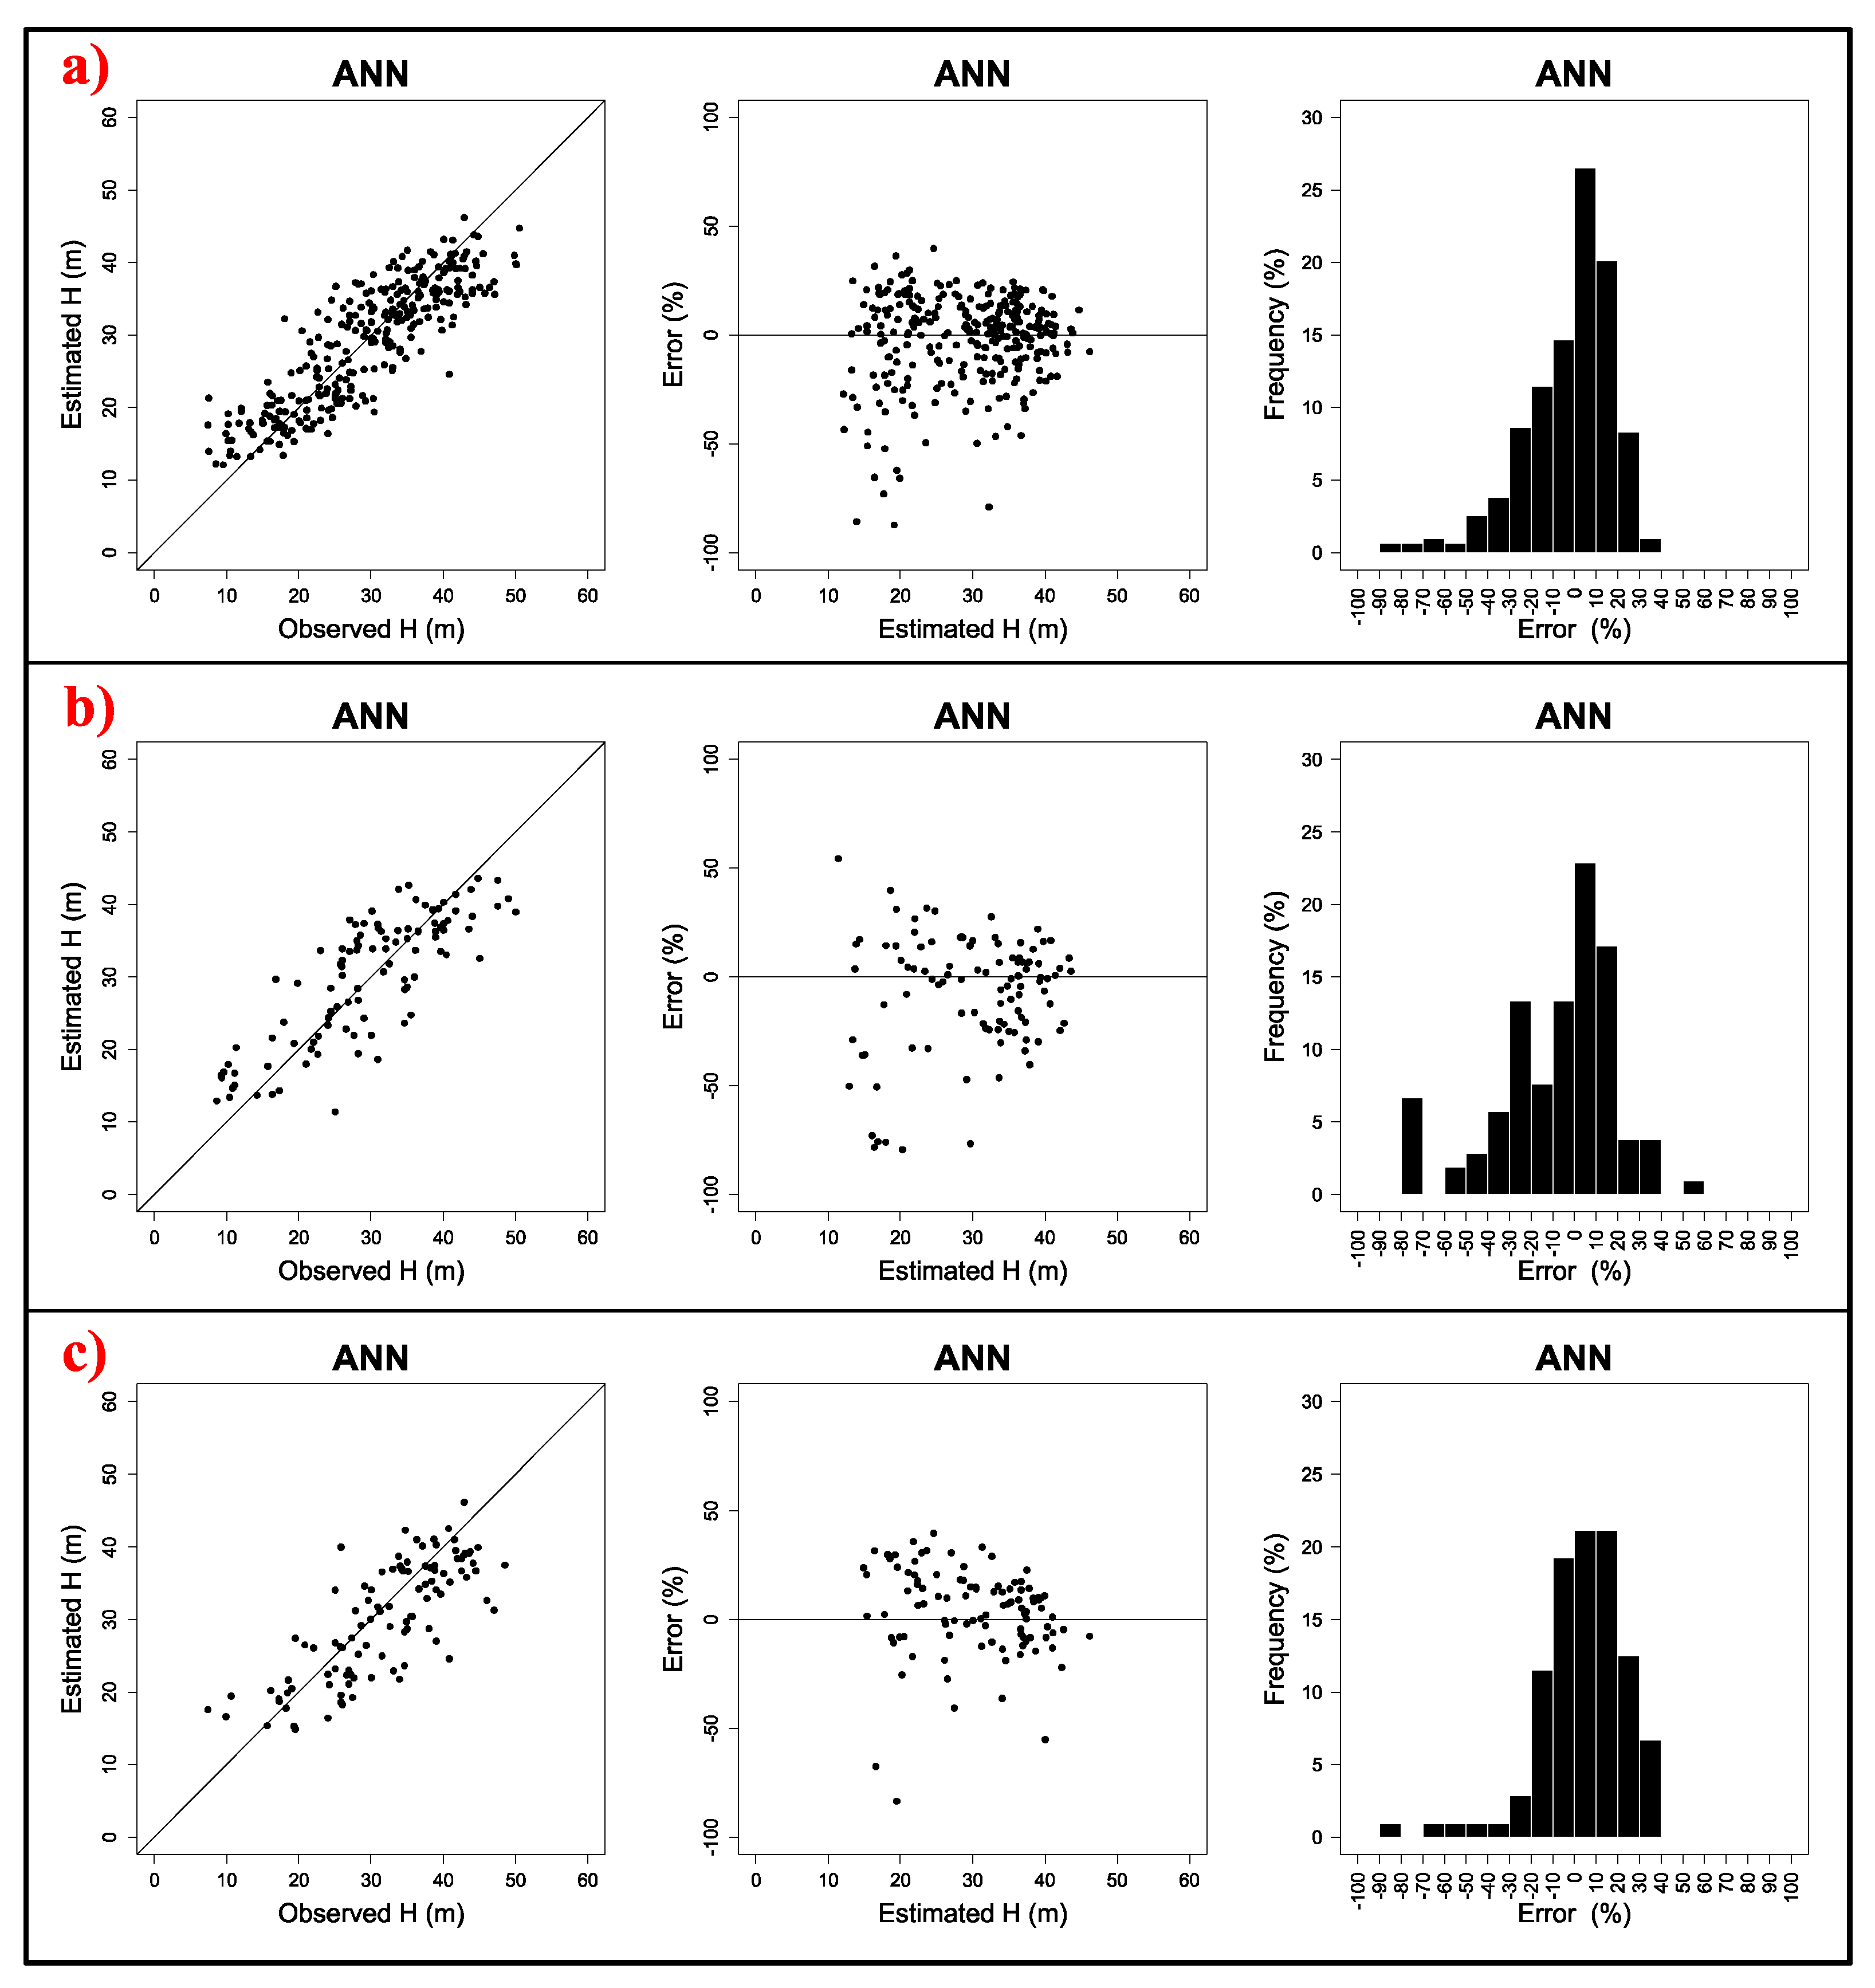
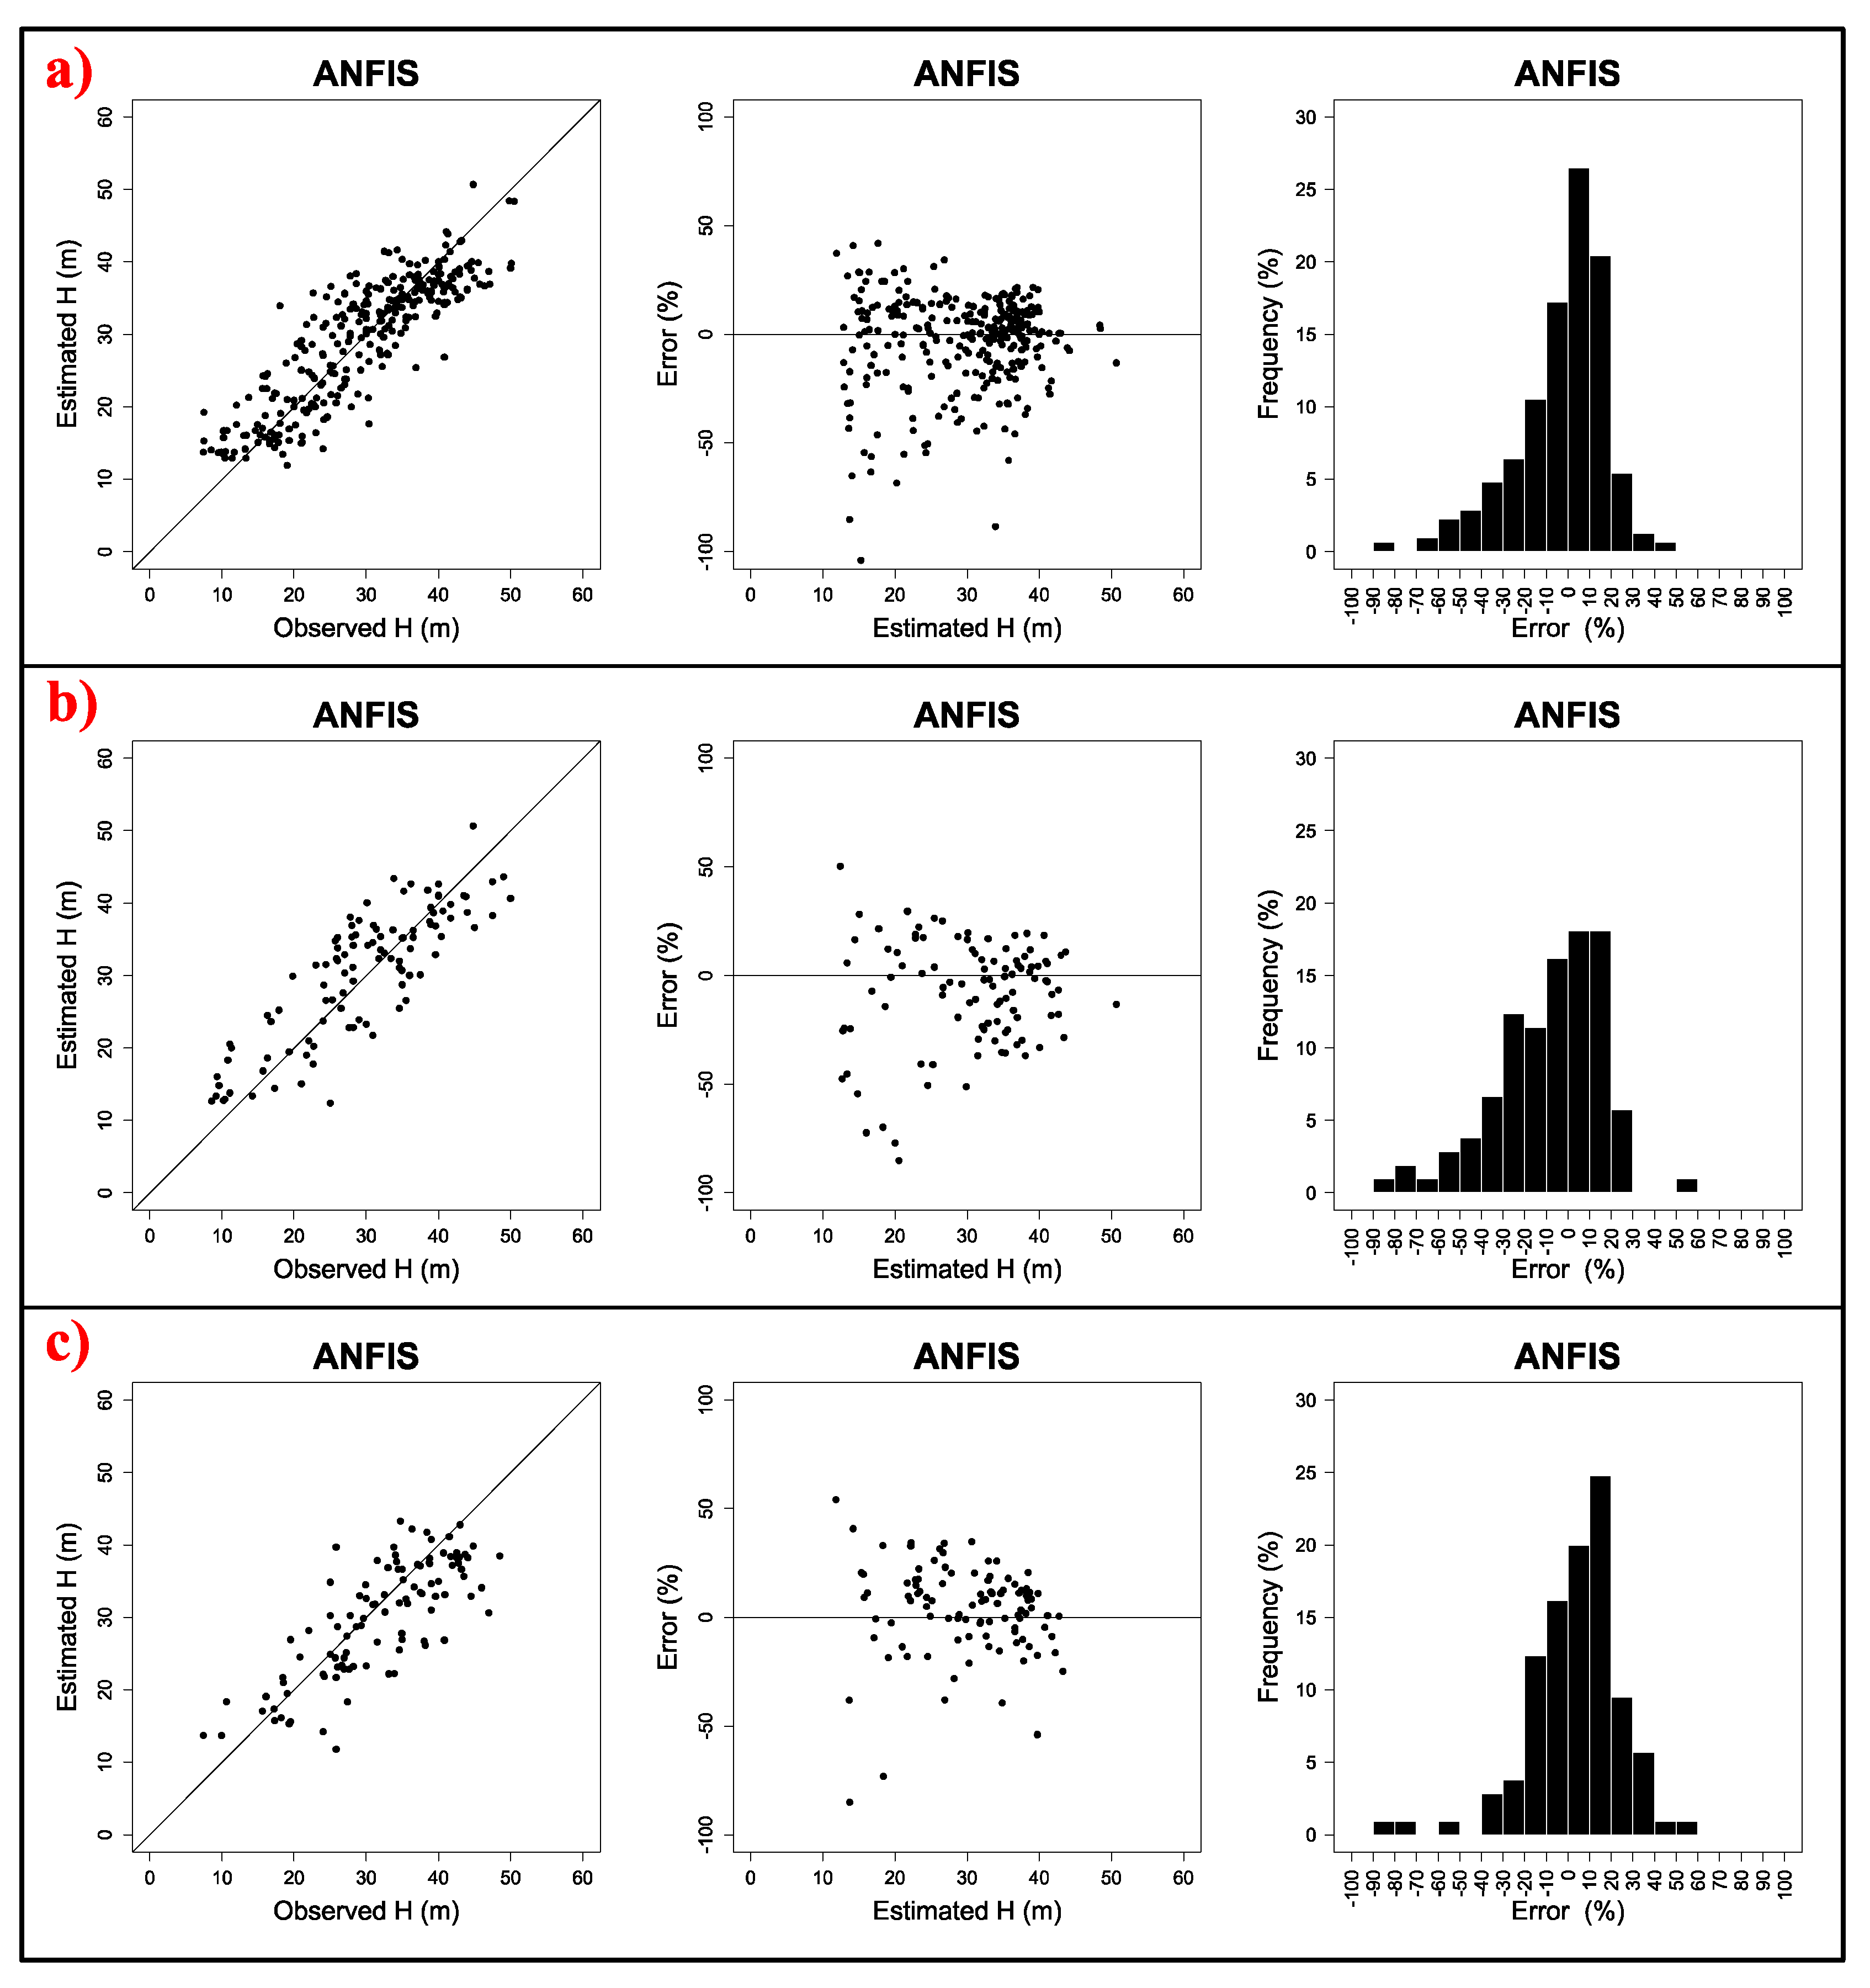
13], which are often well reported in predicting tree heights. According to our results (Table 7) artificial intelligence techniques had lower errors and more accurate estimations of tree heights in the study area, which is in line with the results of other studies [13,51,52,53,54,55].
The use of artificial intelligence techniques for forestry issues has become more and more popular recently, but is often limited to ANNs; other techniques such as ANFIS and fuzzy logic also have great potential for many forest modeling [13,56]. A t-test was performed to compare the results of R2 and RMSE, and according to our results (p ≥ 0.005), there was no significant difference between the accuracies of ANN and ANFIS models in estimating tree heights in the study area. This finding is consistent with the results of Vieira et al. [13], which concluded that artificial intelligence methods, including ANN and ANFIS models, can be of value for these purposes. In a study of the relationship between the diameters and heights of eucalyptus trees, Silva et al. [51] compared fuzzy logic and neuro-fuzzy models with classical mathematical models and concluded that neuro-fuzzy models had the highest accuracy and precision in predicting eucalyptus tree heights.
Our results complement prior research in this area. For example, Leite et al. [53] Diamantopoulou and Özçelik [55] used six nonlinear regression models as well as the GRNN (generalized regression neural network) method to estimate tree heights in the western Mediterranean Region Forests of Turkey. Consistent with the results of this study, validation statistics of their models showed that the GRNN model has both higher and lower error rates than other models. They attribute this to the ability to model nonlinear relationships to predict tree heights. Bayat et al. [18] used regression and ANN to predict the probability of tree survival in the Hyrcanian forests. They concluded based on model validation statistics, that ANN models were more accurate at predicting probability of survival and determining environmental affecting factors. These results are in line with the results of the present study. Zhou et al. [11] also reached a similar conclusion, and like the results of this study, they also concluded that the GRNN model had higher accuracy than the regression models in estimating DBH in the Zhejiang province in China. Lee et al. [57] used new three machine learning techniques, including support vector regression (SVR), modified regression trees (RT), and a random forest (RF) in South Korea to predict the heights of forest stands, and concluded that these three models were capable of estimating the height of stands well, and the estimates of these three models were not statistically significant. Finally, Bourque et al. [4] in Kheyrud forest used genetic programming to determine the relationship between height and diameter in beech forest and select the most environmental variables. In these studies, they proved the capability of AI approaches for prediction. Despite the differences in the types of neural network or artificial intelligence techniques used in all of these studies, or in the numbers of and types of model inputs, all of them are consistent with this research in illustrating the superiority of neural network and artificial intelligence methods over regression models.
To model the diameters and heights of Beech species in the northern forests of Iran, several different studies have been carried out, all of which used only nonlinear empirical models. Ahmadi et al. [22] used nineteen linear and eight nonlinear models for beech forest-type data and concluded these models could predict 70–76 percent of the variation in the dependent variable; among them Schnute, Weibull, and Richards models best predicted heights. Alijani et al. [58] used three diameter-height empirical models for beech species in unmanaged Kheyrud forests in northern Iran in three different successive stages. The results of this study indicate the suitability of relative function and Weibull models at early stages of forest development; the modified exponential at maturity; and Gompertz and Richards during the decay stage. Hamidi et al. [59] studied the diameter and height models of beech species in uneven-aged forest of northern Iran, and concluded that the Korf, Ratkowsky, Naslund, and Weibull models have good ability to accurately estimate beech tree heights. Therefore, nonlinear empirical models have often been used to investigate suitable models of beech height prediction in northern forests of Iran. However, the present study is unique in applying artificial intelligence methods to this purpose, which showed that ANN and ANFIS models are more capable of predicting the heights of beech species in northern Iran.

5. Conclusions

Forest management requires models that are accurate and capable of predicting important forest features, such as the diameters and heights of trees. According to our study and previous studies, artificial intelligence models have the potential to complement and replace empirical models in forest modeling. The accuracy and ability to model complex relationships among variables are the main characteristics of a good and suitable model. For the cases modeled here, ANN and ANFIS models have a higher accuracy than empirical models in estimating total tree height, which confirms other studies on this subject: AI techniques can substitute for empirical models in efforts where forest conditions need to be estimated. In addition to ANN and ANFIS models being more accurate in our case study, they are more capable of modeling complex and nonlinear interfaces, and also have greater flexibility. Any one type of diameter-height model may not always be suitable for all types of conditions where a particular tree species might be found, because site conditions can affect the diameter–height relationship.

Author Contributions

M.B. conceived and designed the experiments; M.B. and S.H. performed the experiments and analyzed the data; M.B., P.B., S.H., A.H.K., M.J. and S.K.H. writing—original draft preparation; M.B., S.H. and P.B. writing—review and editing. All authors have read and agreed to the published version of the manuscript.

Funding

This research received no external funding.

Acknowledgments

We acknowledge the anonymous editor and reviewers who provided many helpful comments and suggestions for improving this manuscript.

Conflicts of Interest

The authors declare no conflict of interest.

References

  1. Mosaddegh, A. Silviculture; Tehran University Press: Tehran, Iran, 2015; p. 496. [Google Scholar]
  2. Bayat, M.; Pukkala, T.; Namiranian, M.; Zobeiri, M. Productivity and optimal management of the uneven-aged hardwood forests of Hyrcania. Eur. J. For. Res. 2013, 132, 851–864. [Google Scholar] [CrossRef]
  3. Bourque, C.P.-A.; Bayat, M. Landscape Variation in Tree Species Richness in Northern Iran Forests. PLoS ONE 2015, 10, e0121172. [Google Scholar] [CrossRef] [PubMed]
  4. Bourque, C.P.-A.; Bayat, M.; Zhang, C. An assessment of height–diameter growth variation in an unmanaged Fagus orientalis-dominated forest. Eur. J. For. Res. 2019, 138, 607–621. [Google Scholar] [CrossRef]
  5. Bertini, G.; Becagli, C.; Chiavetta, U.; Ferretti, F.; Fabbio, G.; Salvati, L. Exploratory analysis of structural diversity indicators at stand level in three Italian beech sites and implications for sustainable forest management. J. For. Res. 2018, 30, 121–127. [Google Scholar] [CrossRef]
  6. Sirkiä, S.; Heinonen, J.; Miina, J.; Eerikäinen, K. Subject-Specific Prediction Using a Nonlinear Mixed Model: Consequences of Different Approaches. For. Sci. 2015, 61, 205–212. [Google Scholar] [CrossRef]
  7. Paulo, J.A.; Tomé, J.; Tomé, M. Nonlinear fixed and random generalized height–diameter models for Portuguese cork oak stands. Ann. For. Sci. 2011, 68, 295–309. [Google Scholar] [CrossRef] [Green Version]
  8. Özçelik, R.; Diamantopoulou, M.J.; Crecente-Campo, F.; Eler, U. Estimating Crimean juniper tree height using nonlinear regression and artificial neural network models. For. Ecol. Manag. 2013, 306, 52–60. [Google Scholar] [CrossRef]
  9. Zhou, R.; Wu, D.; Fang, L.; Xu, A.; Lou, X. A Levenberg–Marquardt Backpropagation Neural Network for Predicting Forest Growing Stock Based on the Least-Squares Equation Fitting Parameters. Forests 2018, 9, 757. [Google Scholar] [CrossRef] [Green Version]
  10. Xiong, B.M.; Wang, Z.X.; Li, Z.Q.; Zhang, E.; Tian, K.; Li, T.T.; Li, Z.; Song, C.L. Study on the correlation among age, DBH and tree height of the Pseudotsuga sinensis in Qizimei Mountain Nature Reserve. For. Resour. Manag. 2016, 4, 41–46. [Google Scholar]
  11. Zhou, R.; Wu, D.; Zhou, R.; Fang, L.; Zheng, X.; Lou, X. Estimation of DBH at Forest Stand Level Based on Multi-Parameters and Generalized Regression Neural Network. Forests 2019, 10, 778. [Google Scholar] [CrossRef] [Green Version]
  12. Van Dao, D.; Jaafari, A.; Bayat, M.; Mafi-Gholami, D.; Qi, C.; Moayedi, H.; Luu, C. A spatially explicit deep learning neural network model for the prediction of landslide susceptibility. Catena 2020, 188, 104451. [Google Scholar]
  13. Vieira, G.C.; De Mendonça, A.R.; Da Silva, G.F.; Zanetti, S.S.; Da Silva, M.M.; Dos Santos, A.R. Prognoses of diameter and height of trees of eucalyptus using artificial intelligence. Sci. Total Environ. 2018, 619, 1473–1481. [Google Scholar] [CrossRef] [PubMed]
  14. Chen, W.; Panahi, M.; Tsangaratos, P.; Shahabi, H.; Ilia, I.; Panahi, S.; Li, S.; Jaafari, A.; Bin Ahmad, B. Applying population-based evolutionary algorithms and a neuro-fuzzy system for modeling landslide susceptibility. Catena 2019, 172, 212–231. [Google Scholar] [CrossRef]
  15. Jaafari, A.; Zenner, E.K.; Panahi, M.; Shahabi, H. Hybrid artificial intelligence models based on a neuro-fuzzy system and metaheuristic optimization algorithms for spatial prediction of wildfire probability. Agric. For. Meteorol. 2019, 266, 198–207. [Google Scholar] [CrossRef]
  16. Buğday, E. Application of artificial neural network system based on ANFIS using GIS for predicting forest road network suitability mapping. Fresenius Environ. Bull. 2018, 27, 1656–1668. [Google Scholar]
  17. Sun, Y.; Jiang, S.; Chen, Z. Application of artificial neural network to forestry. World For. Res. 2019, 32, 7–12. [Google Scholar]
  18. Bayat, M.; Ghorbanpour, M.; Zare, R.; Jaafari, A.; Pham, B.T. Application of artificial neural networks for predicting tree survival and mortality in the Hyrcanian forest of Iran. Comput. Electron. Agric. 2019, 164. [Google Scholar] [CrossRef]
  19. Barenboim, M.; Masso, M.; Vaisman, I.; Jamison, D.C. Statistical geometry based prediction of nonsynonymous SNP functional effects using random forest and neuro-fuzzy classifiers. Proteins Struct. Funct. Bioinform. 2008, 71, 1930–1939. [Google Scholar] [CrossRef]
  20. Radovanović, M.M.; Vyklyuk, Y.; Milenković, M.; Vuković, D.B.; Matsiuk, N. Application of adaptive neuro-fuzzy interference system models for prediction of forest fires in the usa on the basis of solar activity. Therm. Sci. 2015, 19, 1649–1661. [Google Scholar]
  21. Wijayanto, A.K.; Sani, O.; Kartika, N.D.; Herdiyeni, Y. Classification Model for Forest Fire Hotspot Occurrences Prediction Using ANFIS Algorithm. IOP Conf. Ser. Earth Environ. Sci. 2017, 54, 12059. [Google Scholar] [CrossRef]
  22. Ahmadi, K.; Alavi, S.J.; Kouchaksaraei, M.T.; Aertsen, W. Non-linear height-diameter models for oriental beech (Fagus orientalis Lipsky) in the Hyrcanian forests, Iran. Biotechnol. Agron. Soc. Environ. J. 2013, 17, 431–440. [Google Scholar]
  23. Bayat, M.; Namiranian, M.; Zobeiri, M.; Omid, M.; Pukkala, T. Growth and yield models for uneven–aged and mixed broadleaf forest (Case study: Gorazbon District in Kheyroud Forest, North of Iran). Iran. J. For. Poplar Res. 2014, 22, 39–50. [Google Scholar]
  24. Thanh, T.N.; Tien, T.D.; Shen, H.L. Height-diameter relationship for Pinus koraiensis in Mengjiagang Forest Farm of Northeast China using nonlinear regressions and artificial neural network models. J. For. Sci. 2019, 65, 134–143. [Google Scholar] [CrossRef] [Green Version]
  25. Mitra, S.; Pal, S. Fuzzy multi-layer perceptron, inferencing and rule generation. IEEE Trans. Neural Netw. 1995, 6, 51–63. [Google Scholar] [CrossRef] [PubMed]
  26. Nasiri, V.; Darvishsefat, A.A.; Rafiee, R.; Shirvany, A.; Hemat, M.A. Land use change modeling through an integrated Multi-Layer Perceptron Neural Network and Markov Chain analysis (case study: Arasbaran region, Iran). J. For. Res. 2018, 30, 943–957. [Google Scholar] [CrossRef]
  27. Benali, L.; Notton, G.; Fouilloy, A.; Voyant, C.; Dizene, R. Solar radiation forecasting using artificial neural network and random forest methods: Application to normal beam, horizontal diffuse and global components. Renew. Energy 2019, 132, 871–884. [Google Scholar] [CrossRef]
  28. Janizadeh, S.; Avand, M.; Jaafari, A.; Van Phong, T.; Bayat, M.; Ahmadisharaf, E.; Prakash, I.; Pham, B.T.; Lee, S. Prediction Success of Machine Learning Methods for Flash Flood Susceptibility Mapping in the Tafresh Watershed, Iran. Sustainability 2019, 11, 5426. [Google Scholar] [CrossRef] [Green Version]
  29. Jang, J.-S. ANFIS: Adaptive-network-based fuzzy inference system. IEEE Trans. Syst. Man Cybern. 1993, 23, 665–685. [Google Scholar] [CrossRef]
  30. Chen, W.; Hong, H.; Panahi, M.; Shahabi, H.; Wang, Y.; Shirzadi, A.; Pirasteh, S.; Alesheikh, A.A.; Khosravi, K.; Panahi, S.; et al. Spatial Prediction of Landslide Susceptibility Using GIS-Based Data Mining Techniques of ANFIS with Whale Optimization Algorithm (WOA) and Grey Wolf Optimizer (GWO). Appl. Sci. 2019, 9, 3755. [Google Scholar] [CrossRef] [Green Version]
  31. Sorkhabi, O.M. Geoid determination based on log sigmoid function of artificial neural networks: (a case study: Iran). J. Artif. Intell. Electr. Eng. 2015, 3, 18–24. [Google Scholar]
  32. Dorofki, M.; Elshafie, A.H.; Jaafar, O.; Karim, O.A.; Mastura, S. Comparison of artificial neural network transfer functions abilities to simulate extreme runoff data. Int. Proc. Chem. Biol. Environ. Eng. 2012, 33, 39–44. [Google Scholar]
  33. Yang, P.; Zhu, Q.; Zhong, X. Subtractive Clustering Based RBF Neural Network Model for Outlier Detection. J. Comput. 2009, 4, 755–762. [Google Scholar] [CrossRef]
  34. Wei, M.; Bai, B.; Sung, A.H.; Liu, Q.; Wang, J.; Cather, M.E. Predicting injection profiles using ANFIS. Inf. Sci. 2007, 177, 4445–4461. [Google Scholar] [CrossRef]
  35. Näslund, M. Thinning experiments in pine forest conducted by the forest experiment station. Meddelanden fran Statens Skogsforsöksanstalt 1936, 29, 1–169. (In Swedish) [Google Scholar]
  36. Peschel, W. Mathematical methods for growth studies of trees and forest stands and the results of their application. Tharandter Forstliches Jahrburch 1938, 89, 169–247. (In German) [Google Scholar]
  37. Curtis, R.O. Height-diameter and height-diameter-age equations for second-growth Douglas-fir. For. Sci. 1967, 13, 365–375. [Google Scholar]
  38. Meyer, W.A. Mathematical expression for height curves. J. For. 1940, 38, 415–420. [Google Scholar]
  39. Stoffels, A.; van Soest, J. The main problems in sample plots. Nederlandsch Boschbouw Tijdschrift 1953, 25, 190–199. [Google Scholar]
  40. Wykoff, W.R.; Crookston, N.L.; Stage, A.R. User’s Guide to the Stand Prognosis Model; GTR-INT-133; Intermountain Forest and Range Experiment Station, Forest Service, U.S. Department of Agriculture: Ogden, UT, USA, 1982; p. 112.
  41. Prodan, M. Forest Biometrics; Perganion: Oxford, UK, 1968; p. 460. [Google Scholar]
  42. Pearl, R.; Reed, L.J. On the rate of growth of the population of the United States since 1790 and it’s mathematical representation. Proc. Natl. Acad. Sci. USA 1920, 6, 275–288. [Google Scholar] [CrossRef] [Green Version]
  43. Huang, S.; Titus, S.J.; Wiens, D.P. Comparison of nonlinear height–diameter functions for major Alberta tree species. Can. J. For. Res. 1992, 22, 1297–1304. [Google Scholar] [CrossRef]
  44. Richards, F.J. A Flexible Growth Function for Empirical Use. J. Exp. Bot. 1959, 10, 290–301. [Google Scholar] [CrossRef]
  45. Weibull, W.A. A statistical distribution function of wide applicability. J. Appl. Mech. 1951, 18, 293–297. [Google Scholar]
  46. Stage, A.R. Prediction of Height Increment for Models of Forest Growth; Intermountain Forest and Range Experiment Station, Forest Service, US Department of Agriculture: Washington, DC, USA, 1975.
  47. Lundqvist, B. On the height growth in cultivated stands of pine and spruce in Northern Sweden. Medd. Fran. Statens Skogfoesk Band 1957, 47, 1–64. [Google Scholar]
  48. Mehtätalo, L.; De Miguel, S.; Gregoire, T.G. Modeling height-diameter curves for prediction. Can. J. For. Res. 2015, 45, 826–837. [Google Scholar] [CrossRef] [Green Version]
  49. Ou, Q.; Lei, X.; Shen, C. Individual Tree Diameter Growth Models of Larch–Spruce–Fir Mixed Forests Based on Machine Learning Algorithms. Forests 2019, 10, 187. [Google Scholar] [CrossRef] [Green Version]
  50. Takayama, T.; Umezawa, T.; Komuro, N.; Osawa, N. A regression model-based method for indoor positioning with compound location fingerprints. Geo-Spat. Inf. Sci. 2019, 22, 107–113. [Google Scholar] [CrossRef]
  51. Silva, R.M.D.A.; Brandão, F.G.; Baleeiro, G.B.; Valentim, F.L.; De Mendonça, A.R.; Pires, D.M. Fuzzy and neuro-fuzzy estimates of the total height of eucalyptus trees. In Proceedings of the 2008 ACM Symposium on Applied Computing—SAC’08, Fortaleza, Ceara, Brazil, 16–20 March 2008. [Google Scholar]
  52. Ózcelik, R.; Diamantopoulou, M.J.; Brooks, J.R.; Wiant, H.V. Estimating tree bole volume using artificial neural network models for four species in Turkey. J. Environ. Manag. 2010, 91, 742–753. [Google Scholar] [CrossRef]
  53. Leite, H.G.; Da Silva, M.L.M.; Binoti, D.H.B.; Fardin, L.; Takizawa, F.H. Estimation of inside-bark diameter and heartwood diameter for Tectona grandis Linn. trees using artificial neural networks. Eur. J. For. Res. 2010, 130, 263–269. [Google Scholar] [CrossRef]
  54. Soares, F.; Flôres, E.L.; Cabacinha, C.D.; Carrijo, G.A.; Veiga, A.C.P. Recursive diameter prediction and volume calculation of eucalyptus trees using Multilayer Perceptron Networks. Comput. Electron. Agric. 2011, 78, 19–27. [Google Scholar] [CrossRef]
  55. Diamantopoulou, M.J.; Ozcelik, R. Evaluation of different modeling approaches for total tree-height estimation in Mediterranean Region of Turkey. For. Syst. 2012, 21, 383. [Google Scholar] [CrossRef] [Green Version]
  56. Bayat, M.; Thanh Noi, P.; Zare, R.; Tien Bui, D. A Semi-empirical Approach Based on Genetic Programming for the Study of Biophysical Controls on Diameter-Growth of Fagus orientalis in Northern Iran. Remote. Sens. 2019, 11, 1680. [Google Scholar] [CrossRef] [Green Version]
  57. Lee, J.; Im, J.; Kim, K.-M.; Quackenbush, L.J. Machine Learning Approaches for Estimating Forest Stand Height Using Plot-Based Observations and Airborne LiDAR Data. Forests 2018, 9, 268. [Google Scholar] [CrossRef] [Green Version]
  58. Alijani, V.; Namiranian, M.; Feghhi, J.; Bozorg Haddad, O.; Etemad, V. Investigation of diameter and height models in different evolutionary stages of unmanaged beech forests (case study: Kheyrud educatinal and research forest). J. Environ. Sci. Technol. 2017, 17, 210–218. [Google Scholar]
  59. Hamidi, K.; Fallah, A.; Bayat, M.; Hosseini, S.A. Investigating the diameter and height models of beech trees in uneven age forest of Northern Iran (Case study: Forest Farim). Iran. For. Ecol. 2019, 7, 28–39. [Google Scholar]
Figure 1. Location and example conditions of the study area.
Forests 11 00324 g001
Figure 2. The workflow employed in this study to quantify the tree heights using artificial intelligence and empirical models. BA: basal Area (m2ha−1), DBH: diameter at breast height (cm), BAL: basal area in the largest tree (m2ha−1).
Forests 11 00324 g002
Figure 3. Diameter-predicted heights of the two-parameter models.
Forests 11 00324 g003
Figure 4. Diameter-predicted heights of the three-parameter models.
Forests 11 00324 g004
Figure 5. Diameter-predicted heights of the selected model (Weibull).
Forests 11 00324 g005
Figure 6. Estimated heights versus observed heights by 10 empirical models (testing R2 and RMSE (%) noted).
Forests 11 00324 g006aForests 11 00324 g006b
Figure 7. Estimated heights versus observed heights, distributions of percentage errors of height estimates, and histograms of errors of height estimates, obtained by ANN, for training (a), validation (b), and test (c) data.
Forests 11 00324 g007
Figure 8. Estimated heights versus observed heights, distributions of percentage errors of height estimates, and histograms of errors of height estimates, obtained by ANFIS, for training (a), validation (b), and test (c) data.
Forests 11 00324 g008
Table 1. Statistical characteristics of the diameter at breast height (DBH) and total height measurements of trees.
Descriptive StatisticsDiameter at Breast Height (cm)Height (m)
TrainingTestingAllTrainingTestingAll
Mean69.1171.5669.9929.2131.6530.09
Minimum8887.47.57.4
Maximum1881721885050.550.5
Standard deviation39.2337.5438.629.2610.289.69
Table 2. Descriptions of ANN and ANFIS with their activation functions and input and output variables for estimating total height.
ModelInput VariableNetwork TopologyOutput
ANNANN1BAL, DBH, BA, NTLog-sigmoidTH
ANN2BAL, DBH, BA, NTHyperbolic tangent sigmoidTH
ANN3BAL, DBH, BALog-sigmoidTH
ANFISANFIS1BAL, DBH, BA, NTSubtractive clusteringTH
ANFIS2BAL, DBH, BA, NTGrid partition TH
ANFIS3BAL, DBH, BASubtractive clusteringTH
BAL: basal area of the largest trees (m2ha−1), TH: total height (m), DBH: diameter at breast height (cm), BA: total basal area (m2ha−1), and NT: number of trees per plot.
Table 3. Statistical indexes used to evaluate the efficiencies of the models.
Statistical IndicatorsEquation
Coefficient of determination R 2 ( % ) = ( y i y ι ¯ ) × ( Y ι ^ y ^ m ) [ i = 1 n ( y i y ¯ ) 2 ] × [ i = 1 n ( y ^ i y ^ m ) 2 ] · 100
Relative mean bias error M B E ( % ) = i = 1 n ( y i y ^ i ) n × 100 y ¯
Relative mean absolute error M A E ( % ) = i = 1 n | y i y ι ^ | n × 100 y ¯
Relative root mean square error R M S E ( % ) = i = 1 n ( y i y ι ^ ) 2 n × 100 y ¯
Table 4. Nonlinear empirical diameter and height models.
NumberModelAlgebraic PhraseReference
1NaslundH = 1.3 + D 2 ( aD + b ) 2 [35,36]
2CurtisH = 1.3 + a D ( 1 + D ) b [37]
3MeyerH = 1.3 + a (1 − exp(−bD))[37,38]
4PowerH = 1.3 + aDb[39]
5WykoffH = 1.3 + exp(a − b(D + 1)−1)[40]
6ProdanH = 1.3 + D 2 a D 2 + b D + c [37,41]
7LogisticH = 1.3 + ( a 1 + b   e x p ( c D ) )[42,43]
8Chapman-RichardsH = 1.3 + a(1 − exp(−bD))c[43,44]
9WeibullH = 1.3 + a(1 − exp(−bDc))[43,45]
10KorfH = 1.3 + a exp(−bD−c) [46,47,48]
H: tree height; D: tree diameter at breast height; a, b, c: parameters of models.
Table 5. Regression coefficients of models developed in this study.
NumberModelAlgebraic PhraseCoefficients of Models
abC
1NaslundH = 1.3 + D 2 ( aD + b ) 2 2.150.14-
2CurtisH = 1.3 + a D ( 1 + D ) b 39.0013.37-
3MeyerH = 1.3 + a (1 − exp(−bD))63.960.008-
4PowerH = 1.3 + aDb4.210.42-
5WykoffH = 1.3 + exp(a − b(D + 1)−1)3.62−13.59-
6ProdanH = 1.3 + D 2 a D 2 + b D + c 0.640.950.019
7LogisticH = 1.3 + ( a 1 + b   e x p ( c D ) )63.963.370.014
8Chapman-RichardsH = 1.3 + a(1 − exp(−bD))c33.770.041.078
9WeibullH = 1.3 + a(1 − exp(−bDc))63.960.0510.59
10KorfH = 1.3 + a exp(−bD−c) 63.965.560.48
Table 6. Coefficient of determination, RMSE, and MAE for modeling and validation of 10 nonlinear models.
NumberModel Training Testing
R2RMSE (%)% MBA% MAER2RMSE (%)% MBA% MAE
1Naslund0.6818.863.3116.180.6818.792.9714.15
2Curtis0.6720.331.7516.550.6719.142.3715.17
3Meyer0.6424.168.9420.410.6422.744.8218.28
4Power0.6818.442.3715.70.6718.192.3613.89
5Wykoff0.6720.296.2617.180.6721.804.5516.08
6Prodan0.6718.995.2116.320.6719.173.8514.23
7Logistic0.6719.571.5616.430.6719.201.7815.39
8Chapman-Richards0.6819.882.6216.540.6820.122.9915.18
9Weibull0.6818.270.2415.500.6817.691.12613.50
10Korf0.6818.751.52915.5840.6817.941.48413.71
The best models based on R2 and %RMSE are highlighted.
Table 7. Training, validation, and test statistics for the estimation of total height using ANN and ANFIS models.
ANN
Model R2 (%)MBE (%)MAE (%)RMSE (%)
1Training86.01−0.9613.9816.89
Validation81.541.6816.7420.05
Test78.06−5.7414.9918.52
2Training86.08−0.9813.6017.00
Validation81.691.5016.4820.11
Test78.73−5.6314.9318.49
3Training85.22−0.9014.0217.04
Validation80.091.7516.8720.17
Test76.13−4.5515.3618.97
ANFIS
1Training86.150.0013.3816.91
Validation84.353.1115.8918.97
Test78.69−5.9714.6618.62
2Training86.120.1313.4517.04
Validation84.203.1815.9319.09
Test77.97−5.9914.8918.96
3Training85.870.1613.5417.11
Validation84.113.3215.9919.18
Test77.78−6.0814.9718.99
The best models based on R2 and %RMSE are highlighted.
Table 8. Validation results of the regression, ANN, and ANFIS models.
Model RMSE (%)R2
RegressionNaslund18.790.68
Curtis19.140.67
Meyer22.740.64
Power18.190.67
Wykoff21.800.67
Prodan19.170.67
Logistic19.200.67
Chapman Richards20.120.68
Weibull17.690.68
Korf17.940.68
ANN1Training17.0016.89
Validation20.1120.05
Test18.4918.52
ANN2Training86.0117.00
Validation81.5420.11
Test78.0618.49
ANN3Training86.0817.04
Validation81.6920.17
Test78.7318.97
ANFIS1Training86.1516.91
Validation84.3518.97
Test78.6918.62
ANFIS2Training86.1217.04
Validation84.2019.09
Test77.9718.96
ANFIS3Training85.8717.11
Validation84.1119.18
Test77.7818.99
The best models based on R2 and %RMSE are highlighted.

