Article

Aboveground Biomass Allometric Models for Evergreen Broad-Leaved Forest Damaged by a Serious Ice Storm in Southern China

1
Research Institute of Tropical Forestry, Chinese Academy of Forestry, Guangzhou 510520, China
2
Beijiangyuan National Forest Ecosystem Research Station, Nanling Mts. China, Guangzhou 510520, China
*
Author to whom correspondence should be addressed.
Forests 2020, 11(3), 320; https://doi.org/10.3390/f11030320
Submission received: 20 January 2020 / Revised: 8 March 2020 / Accepted: 12 March 2020 / Published: 14 March 2020
(This article belongs to the Section Forest Ecology and Management)

Abstract

:
A catastrophic ice storm occurred in the spring of 2008, which severely destroyed nearly 13% of China’s forests; among them, the broad-leaved forest suffered the most extensive damage. In this study, allometric models of the evergreen broad-leaved forests damaged at different recovery stages after the disaster were established to estimate the aboveground biomass of damaged trees. Plant plots were established and surveyed in damaged forests to determine species composition and diameter distribution, and finally a sample scheme was formulated that contained 47 trees from 13 species. The destructive measurements of aboveground biomass of trees selected according to the scheme were conducted in 2008, 2010, 2012 and 2016, respectively. Undamaged trees in the same region were also selected to measure the biomass in 2010. Linear regression of logarithmic transformation of the power function form was performed using Diameter at Breast Height (DBH) as predictor to develop biomass allometric models. The results showed that the ice storm caused tree aboveground biomass loss, which caused different parameters of the tree biomass models at different recovery stages. The models have a high accuracy in predicting trunk and total aboveground biomass, with high determination coefficients (R2, 0.913~0.984, mean 0.957), and have a relatively low accuracy in predicting the biomass of branches and leaves (R2, 0.703~0.892, mean 0.784). The aboveground biomass reduced by 35.0% on average due to the ice storm, and recovered to the same level of undamaged trees in the same diameter 8 years after the disturbance. The branches and leaves recovered very fast, and the biomass of these parts exceeded that of the undamaged trees, reaching the same diameter 2 years after the disaster, indicating an over compensatory growth. The trees with a smaller diameter were mostly composed of middle and late succession species, and recovered faster than other species, indicating that the ice storm may alter the forest structure and accelerate community succession. The biomass allometric models built in this study, combined with forest inventory data, can estimate forest biomass loss and recovery after disturbance, and offer an important sense of the assessment of forest damage and the formulation of forest post-disaster management strategies.

1. Introduction

It is clear that the mean global temperature has risen since the start of modern measurements in 1850 [1]. Although global mean annual temperature has not increased every year, global decadal mean temperature has increased every decade since the 1970s [2]. Global warming has changed the atmospheric circulation, leading to an increase in the frequency and intensity of extreme climate events, such as floods, droughts, ice storms, and heat waves [3]. Ice storms are common in East Asia [4] and North America [5], and can cause massive structural damage to forests through physical forces and often define the northern boundaries of key tree species. Evergreen broad-leaved trees in subtropical regions are more vulnerable to the invasion of an ice storm than deciduous trees in temperate regions.
From 10 January to 2 February in 2008, a once-in-a-century ice storm disaster swept across most of the areas of southern and central China [6]. This severe weather disaster was characterized by sudden onset, excessive precipitation and long duration. The snow, ice and sleet caused severe forest losses and destroyed 1.98 × 10⁷ ha of forests, accounting for nearly 13% of China’s forests [7,8,9]. Among them, the broad-leaved forests suffered the most extensive damage [10]. The area of impacted forests with at least 10% standing volume loss was estimated to be about 20 million hectares, approximately 3% of the overall forest volume of the country [8]. Damage to individual trees included crown decapitation, stem breakage/splitting, branch snapping, bending and uprooting [8,11]. Mechanical damage of branches and stems under the weight of the snow and ice was the main type of damage in this disaster. Most of the trees were not dead after the disaster [12]; they could restore by sprouting [13,14]. In sub-tropical regions, the restoration was very fast [11,15]. The ice storm influenced multiple ecological processes such as tree growth speed [16,17], community succession [18], soil properties [19], and water and carbon cycle [20].
Estimating the loss and recovery rate of aboveground biomass in a disturbance is important to assess disaster severity and has great significance in the calculation of regional forest carbon balance and the formulation of forest post-disaster management strategy. The measurement of biomass loss after disturbance usually adopts a direct weighing method, that is, collecting and weighing all the fresh litters in a certain area and calculating regional biomass loss based on this [8]. This method must be conducted immediately after disturbance to prevent decomposition or the removal of fresh litter, and the sampling plots should include different types of forests, and sampling area should be large enough. Therefore, this method is time-limited and expensive, and biomass recovery cannot be determined. In recent years, the technological development of remote sensing makes it an ideal method to estimate forest biomass loss and recovery rate after disturbances in vast areas [21,22], but this method is limited by technology, cloud cover and fly-over frequency [23], and satisfactory accuracy has not yet been achieved.
For the estimation of the whole or partial weight of a tree, the allometric method is, to date, the most used method [24]. The allometric technique initially requires an extensive destructive sampling to establish allometric models, and the models can be used as a non-destructive method to estimate tree biomass based on measurable tree dimensions (e.g., stem diameter and height) [25,26]. The establishment of allometric models is usually based on selected normal or standard trees. The trees mechanically damaged by disturbances such as an ice storm or typhoon could lose part of their biomass of branches and stems, and the relationship between diameter and biomass may change, so their biomass estimation is not suitable for use in allometric models built for normal trees. In theory, the biomass of damaged trees at different recovery stages can be calculated by building allometric models and comparing with normal trees to estimate the tree biomass loss after the disturbance, and the following recovery rate. However, few allometric models of damaged trees are available [27].
The objectives of this study were to (1) develop aboveground biomass allometric models for different recovery stages of evergreen broad-leaved forests damaged by a severe ice storm in 2008 in southern China, and (2) estimate the aboveground biomass loss and recovery rate of different components of damaged trees. We hypothesize that the damaged trees and the normal trees have different allometric relations and abnormal growing processes, which can be used to estimate aboveground biomass loss and recovery rate.

2. Materials and Methods

2.1. Study Sites

The study site is located at the Xiaokeng Forest Farm (24°39′42″~24°42′33″ N, 113°49′08″~113°52′12″ E) in the northern Guangdong Province, southern China. The climate is classified as humid subtropical climate (Cfa in Köppen climate classification system) with an average annual temperature of 20.3 °C. The average annual rainfall is 1530 mm. The soils are classified as red soils (Humic Planosol, FAO) that developed from granite. The zonal vegetation is a subtropical evergreen broad-leaved forest, in which the Fagaceae, Lauraceae and Theaceae are the dominant species on canopy.
There were two sample sites for destructive measurements that were damaged and undamaged in the ice storm. The damaged site is located at latitude of 24°38’38.82″ N and longitude of 113°53’7.87″ E, with altitude ranges from 779 m to 788 m. The site is on a mountain ridge and has a slope gradient of 5°~10°, and the aspect was southeast. This region was covered with subtropical evergreen broadleaf forests that were naturally regenerated from a forest selective logging in 1986. This site suffered severe damage in the ice storm and the damage is typical in this region. The undamaged site is about 1.4 km far from the damaged site, with a latitude of 24°39’11.00″ N and a longitude of 113°52’37.84″ E, and the altitude ranges from 560 to 570 m. The site located in the middle slope with a slope gradient of 22°~30° and the aspect was northwest. This region has the same forest origin, vegetation types, community species composition and soil conditions as the damaged site. The altitude difference is what caused one site to be severely damaged in the ice storm, while the other site was not.

2.2. Forest Inventory and Sample Tree Selection

An inventory of the damaged forest was conducted in April 2008, two months after the disaster. Four 30 × 30 m plots were established by using a compass in the forests at the damaged site, with a distance between plots greater than 20 m. The plots were divided into subsamples of 10 × 10 m quadrats using a polyvinyl chloride pipe and nylon rope to facilitate inventory operation. For all trees with a DBH > 5 cm in each sample plot, tree number was marked with aluminum tag and plant species was recorded, DBH (cm) was measured with a diameter tape, and their damage situation was recorded. There were four concepts that need to be clarified during the record process: crown decapitation, the broken position was below the branch, and there was no branch left on the trunk; branch snapping, the broken position was above the first branch and there were branches on the trunk; bending, stems with a vertical angle of less than 45°; uprooting, trunks fell to the ground and the roots were exposed outside. Branch snapping accounted for more than 68% of all damage types and was considered to be the main damage type. The species composition and diameter distribution of damaged forest were analyzed and, based on the result of inventory data analysis, a scheme of sample trees for destructive measurements was formulated, which included the most common species and had a diameter distribution proportional to the sample plots. Finally, a total of 47 sampled trees belonging to 13 species was selected. The detailed species composition and diameter distribution were listed in Table 1. The scheme was used to guide species selection in all four times of the forest biomass measurement.

2.3. Biomass Measurements

The destructive biomass measurements of damaged trees were carried out four times at different recovery stages. The first measurement was taken from April to May in 2008, followed by three measurements in June 2010, July 2012 and July 2016, respectively. The biomass measurement of undamaged trees was carried out in July 2010. For each destructive measurement, 47sample trees (44 trees in 2008) with the damaged type of branch snapping were selected in one of the four 30 × 30 m plant plots established in the damaged forest. The damaged type was selected according to the inventory data and tree tag; the species composition and diameter distribution were determined by the sample scheme. The undamaged sample trees with normal shape were selected from the forest in the undamaged site according to the same scheme.
The tree biomass measurement operations were carried out with reference to the manual published by Bangladesh Forest Department, Ministry of Environment and Forests [28], and a minor revision was made in the actual operation. The brief description is as follows: All the sampled trees were recorded by species and DBH prior to the destructive procedure, then a chainsaw was used to fell the trees on the ground at their base. The branches and leaves were separated from the main stems, and then the branches and leaves were divided into three sections: large branches (diameter at the large end ≥2 cm), small branches (diameter at the large end <2 cm), and leaves. The stems were cut at intervals of 1.3m and cut at 2 m intervals thereafter up to the apex of the crown. The branches were trimmed and cross-cut into manageable billets ranging from 1 m to 2.5 m in length. All these tree components were directly weighed in the field, and their fresh weight was determined by an electronic hanging balance with an accuracy of 0.01 kg. Three disks with a thickness of 5 cm were collected from the stems with heights of 1.3, 3.3 and 5.3 m as subsamples of stems. Three cylinders of 5–10 cm in length and 5, 2 and 1 cm, respectively, in diameter were collected from the branches as subsamples of the branches. Subsamples of leaves weighing 300 g were collected from different parts of the branches. Identification codes were given to the subsamples and their fresh weight was measured using an electronic balance with an accuracy of 0.1 g. All samples were placed in cloth bags and then taken to the laboratory. All samples were oven-dried to constant weight at 65 °C and their dry weight was measured. The dry and fresh weights were used for the determination of the moisture content of each tree section. The fresh mass of all aboveground components was converted to the dry mass by their respective moisture content. Aboveground biomass was the sum of stem, branch and leaf components.

2.4. Allometric Model Development and Evaluation

The form of a power function or its logarithmic form is commonly used for allometric equations in biomass studies [29,30], DBH is generally the most common independent variable found in the available allometric models, and using DBH as a single variable in the biomass equation can provide a high estimation accuracy of tree biomass [30,31]. In this study, the tip of most of the damaged trees was lost in the ice storm and the measured tree height no longer reflected the real tree height, so we selected DBH alone as a predictor variable to build a biomass allometric model, and the equation is as follows
ln(B) = a + bln(DBH)
where B represents the biomass of trees, a and b are estimated parameters of the fitted models, DBH is the diameter at breast height (cm). The equation parameters were estimated using linear regression methods. The observation data of DBH and biomass underwent logarithmic transformation. To satisfy the regression linearity conditions, Cook’s distance of residuals, normality and homogeneity of residuals were analyzed to estimate the influence of a datapoint and identify and eliminate outliers. Statistical analyses in this study were performed using the statistical software R 3.3.0, package ‘nlme’ (Linear and Nonlinear Mixed Effects Models).
The criteria for evaluating the performance and fitness of the models were the coefficient of determination (R2), coefficient of variation (CV) and systematic errors (Bias) [30]
C V = 1 n p × i = 1 n ( Y i Y ^ i ) 2 / Y ¯
B i a s = 1 n i = 1 n Y i Y ^ i Y i
where n is the number of sampled trees, p is the number of parameters, Yi is the observed biomass, Y ^ i is the predicted biomass and Y ¯ is the mean observed biomass of trees.

3. Results

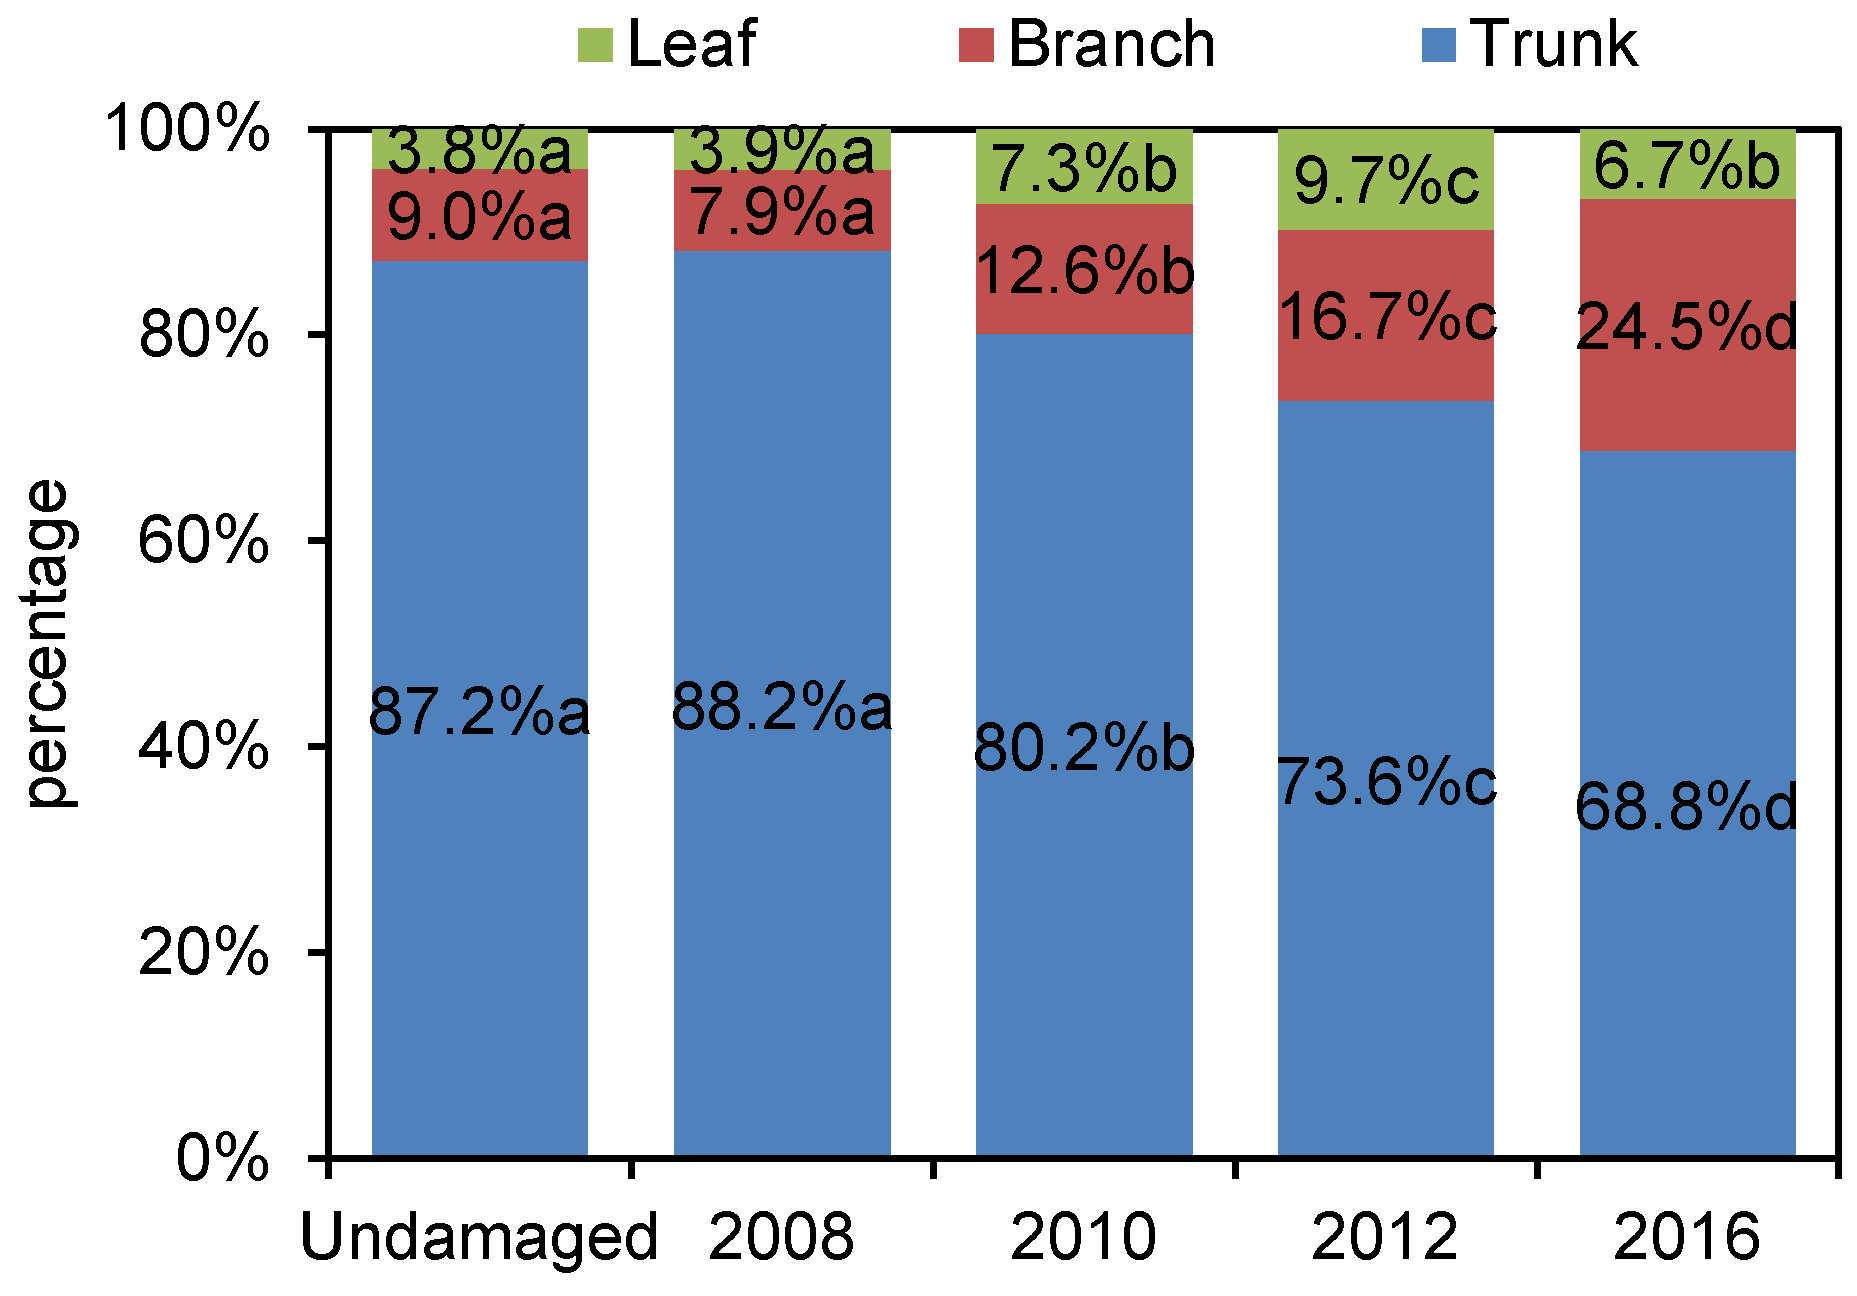
3.1. Dynamic of Biomass Distribution after Disturbance

The proportion of branch and leaf biomass increased while the proportion of trunk biomass decreased after the ice storm (Figure 1). The trunk biomass is the largest part of the total biomass, accounting for 87.2% ± 0.51% of the total biomass of undamaged trees. Shortly after the ice disaster, the proportion of trunk biomass increased slightly but not significantly in 2008, but decreased in the following recovery stage. The branch biomass is the second largest part of the total biomass, accounting for 9.0% ± 0.43% of the total biomass of undamaged trees. The proportion of branch biomass decreased in 2008 after the disaster, and then increased in the subsequent years, reaching 24.5% ± 1.33% in 2016, which was 2.72 times that of the undamaged trees. Compared with other compartments, leaves stored the least biomass, accounting for 3.8% ± 0.20% of the total biomass. The proportion of leaf biomass stayed the same after the disaster in 2008 and increased quickly in the first four years after the disaster, and then decreased in 2016.

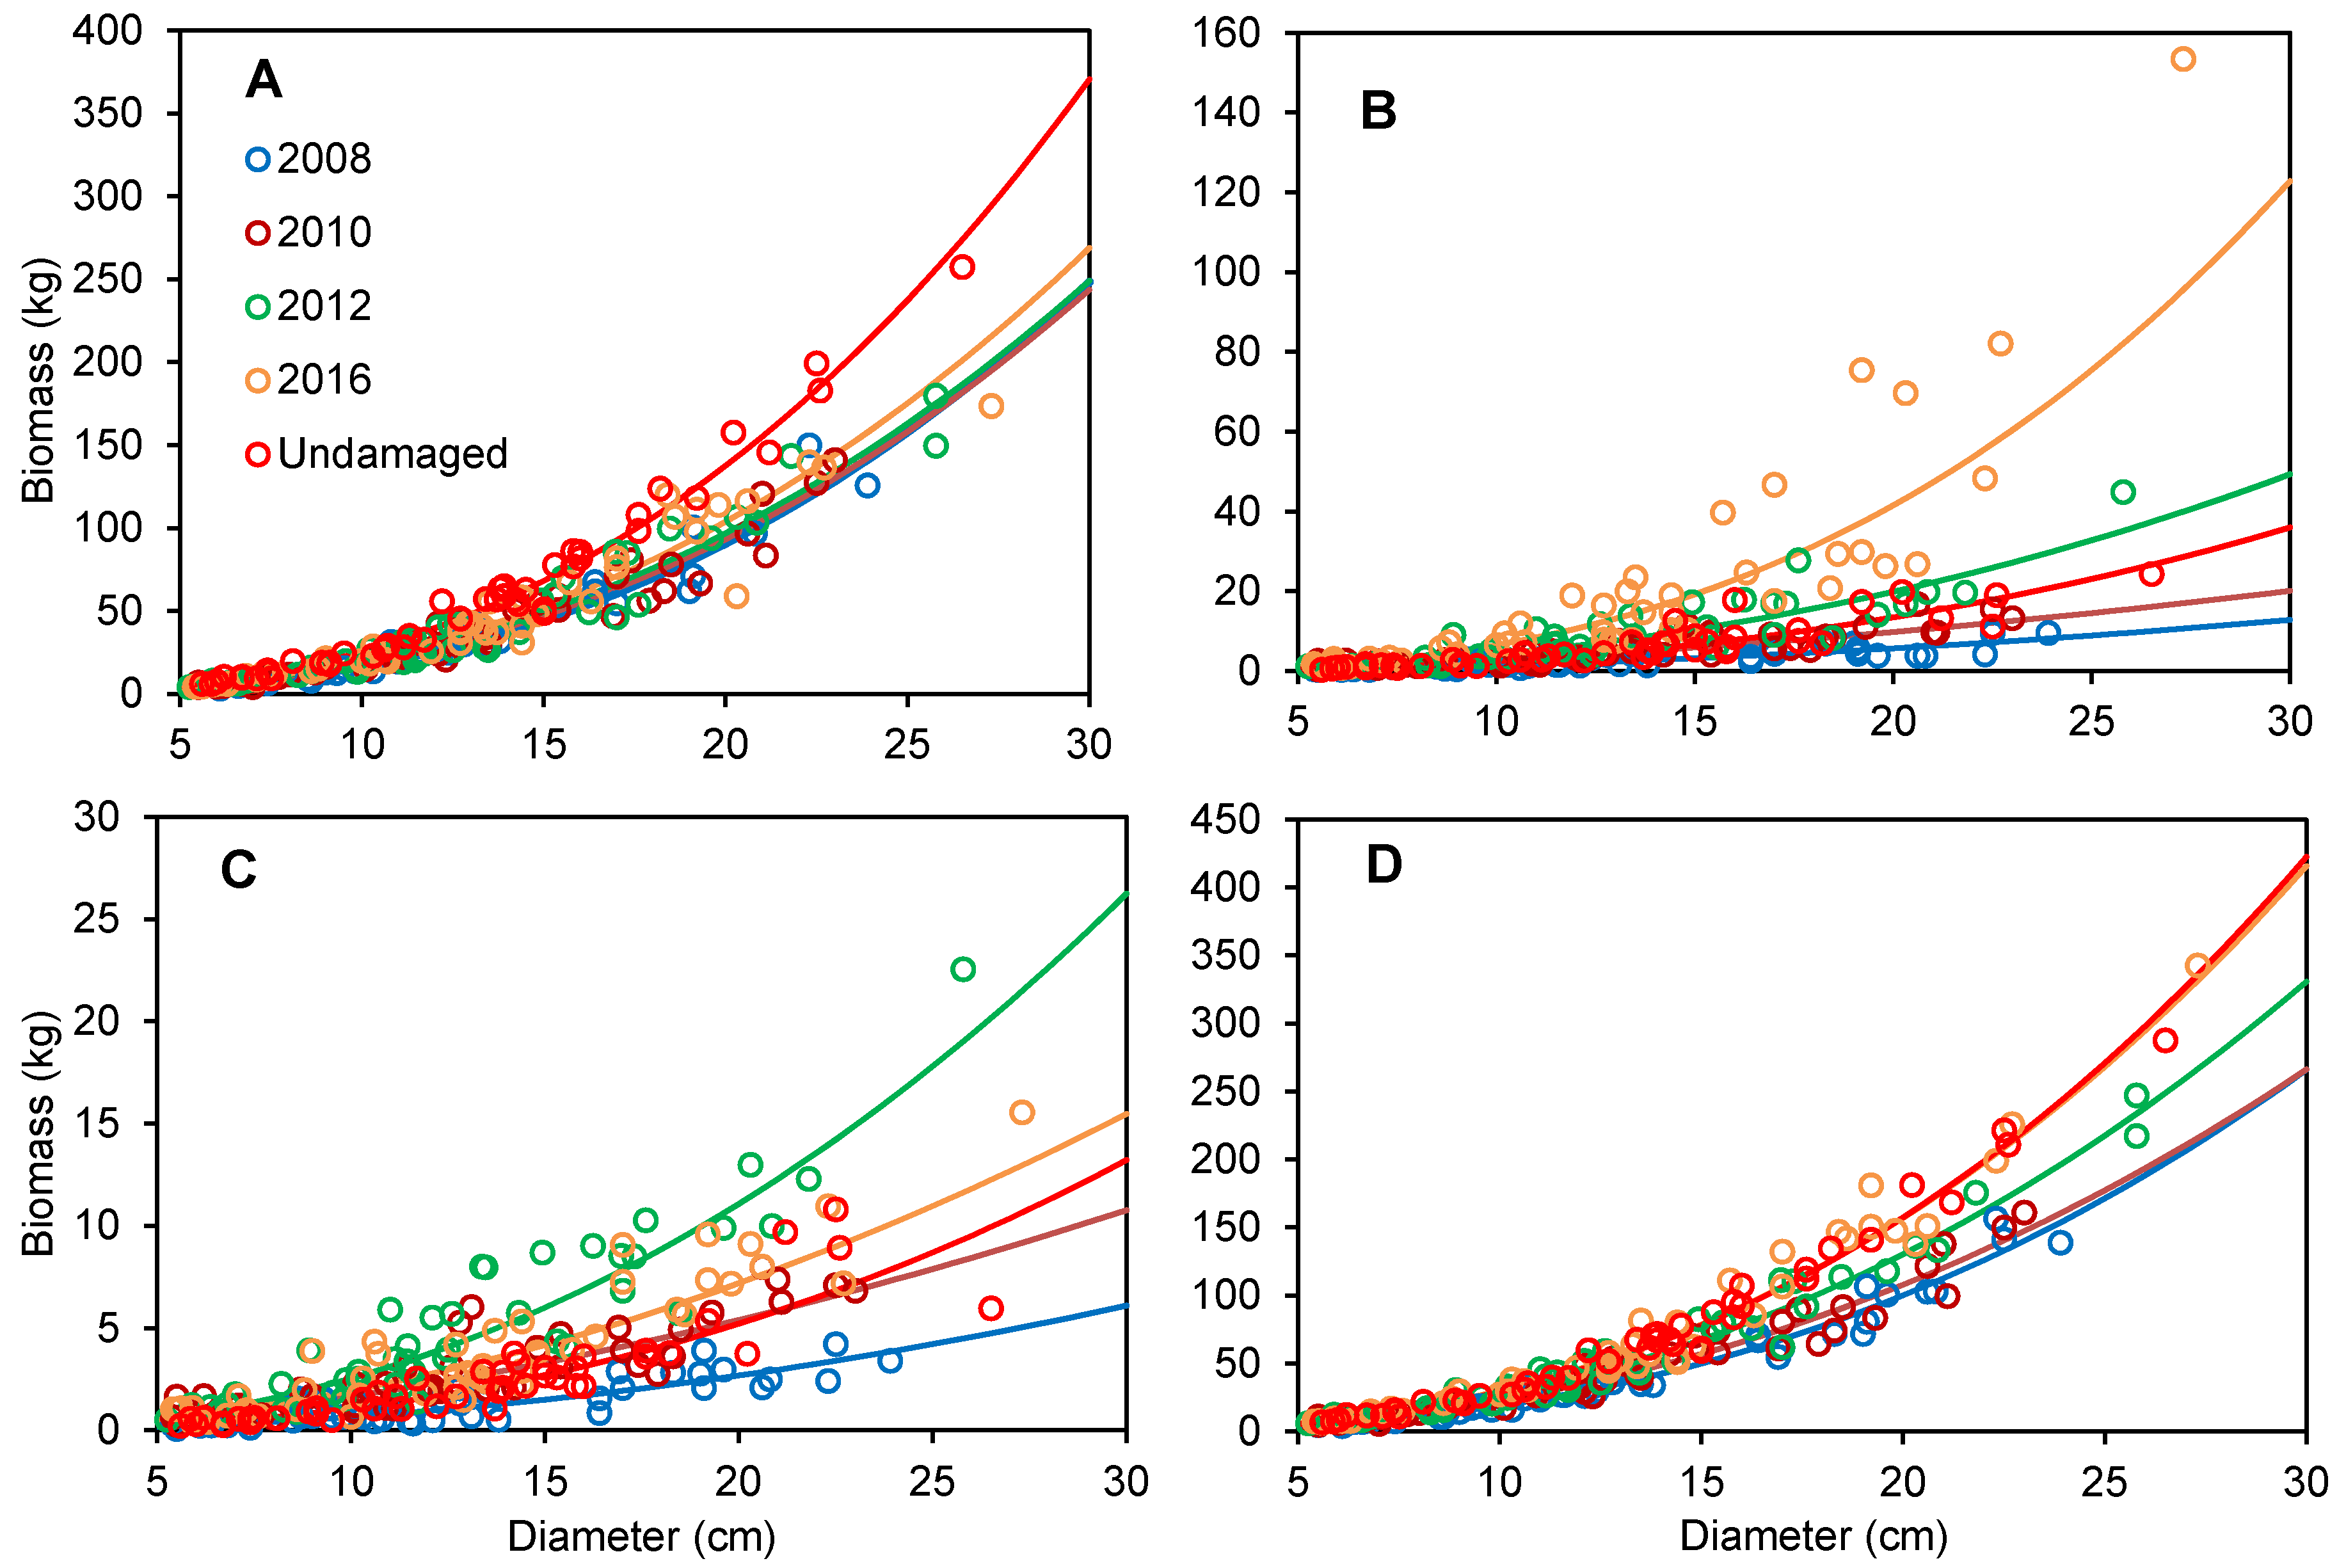
3.2. Biomass Allometric Models at Different Recovery Stages after Disturbance

The estimated parameters of allometric models were used to estimate the trunk, branch, leaf and total aboveground biomass at different recovery stages after the ice storm disaster and the evaluation results of the model performance are listed in Table 2 and demonstrated in Figure 2. The allometric models for estimating trunk and aboveground biomass had very high accuracy, with high R2 (0.913~0.984, mean 0.957) and low CV (11.44~26.14%, mean 18.23%) and Bias (−2.20~−0.71%, mean −1.58%). The accuracy of the allometric models of branches and leaves is lower than that of trunk and aboveground biomass, with a relatively lower R2 (0.703~0.892, mean 0.784) and higher CV (30.04~64.58%, mean 41.61%) and Bias (−16.66~−5.21%, mean −8.57%). The number of negative Bias for all models indicated an overestimation when using the models to calculate biomass. The allometric models for estimating the biomass of every component of undamaged trees had the highest accuracy. The accuracy of allometric models of branches and leaves was the lowest at the initial stage after disturbance, increased and reached the highest in 2012, and then decreased in 2016. The accuracy of allometric models of trunk gradually decreased with time. The allometric models for aboveground biomass decreased in 2010, and then gradually increased during the recovery process.

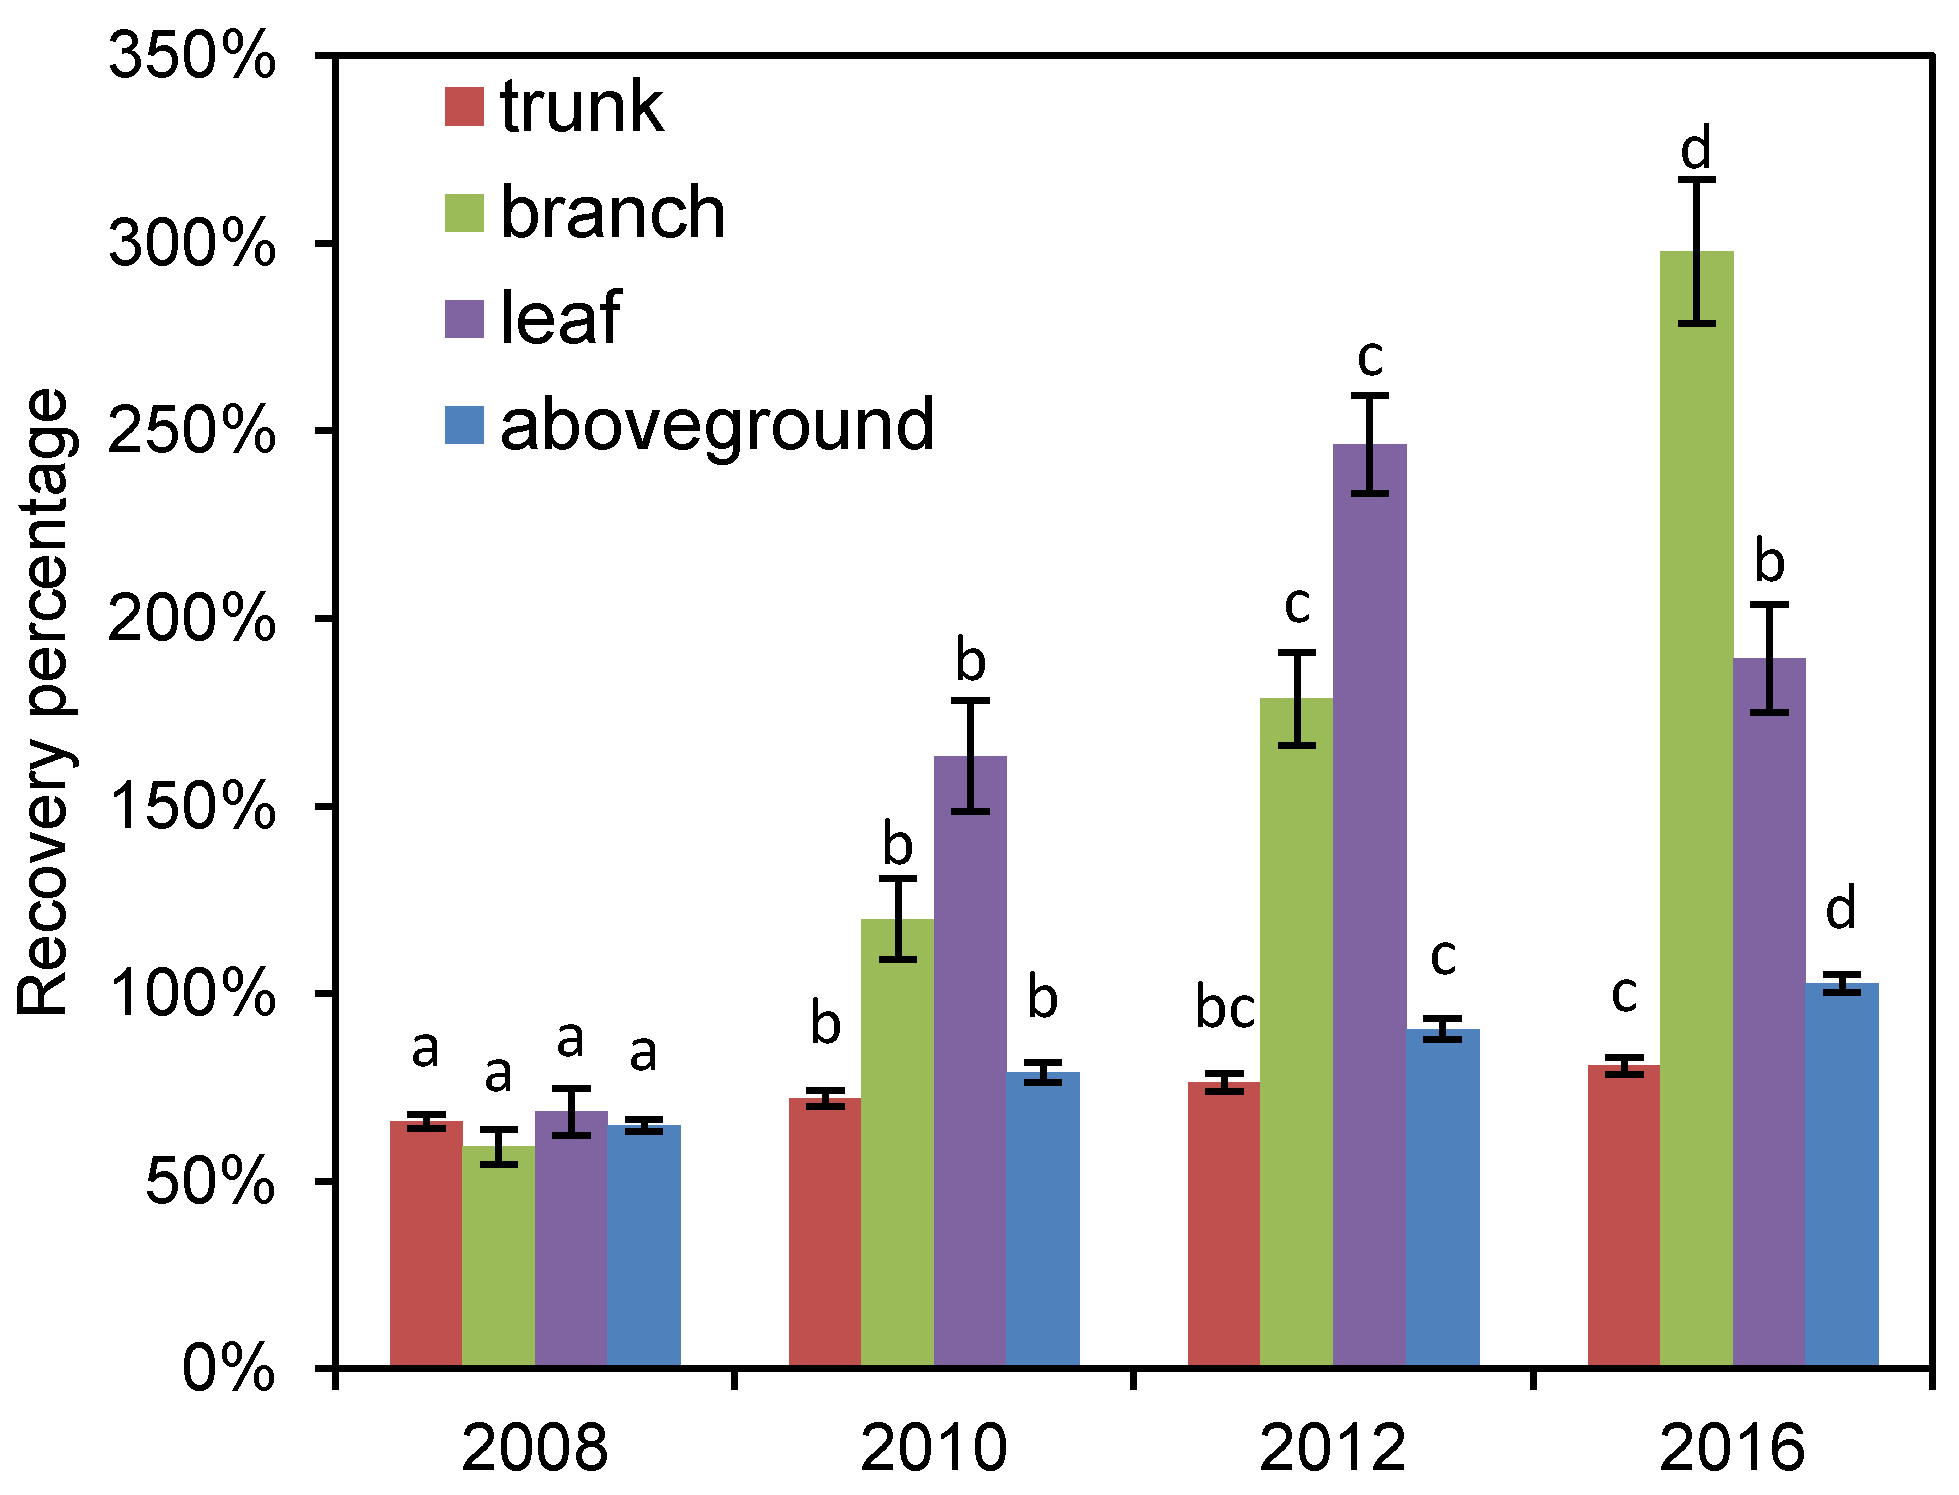
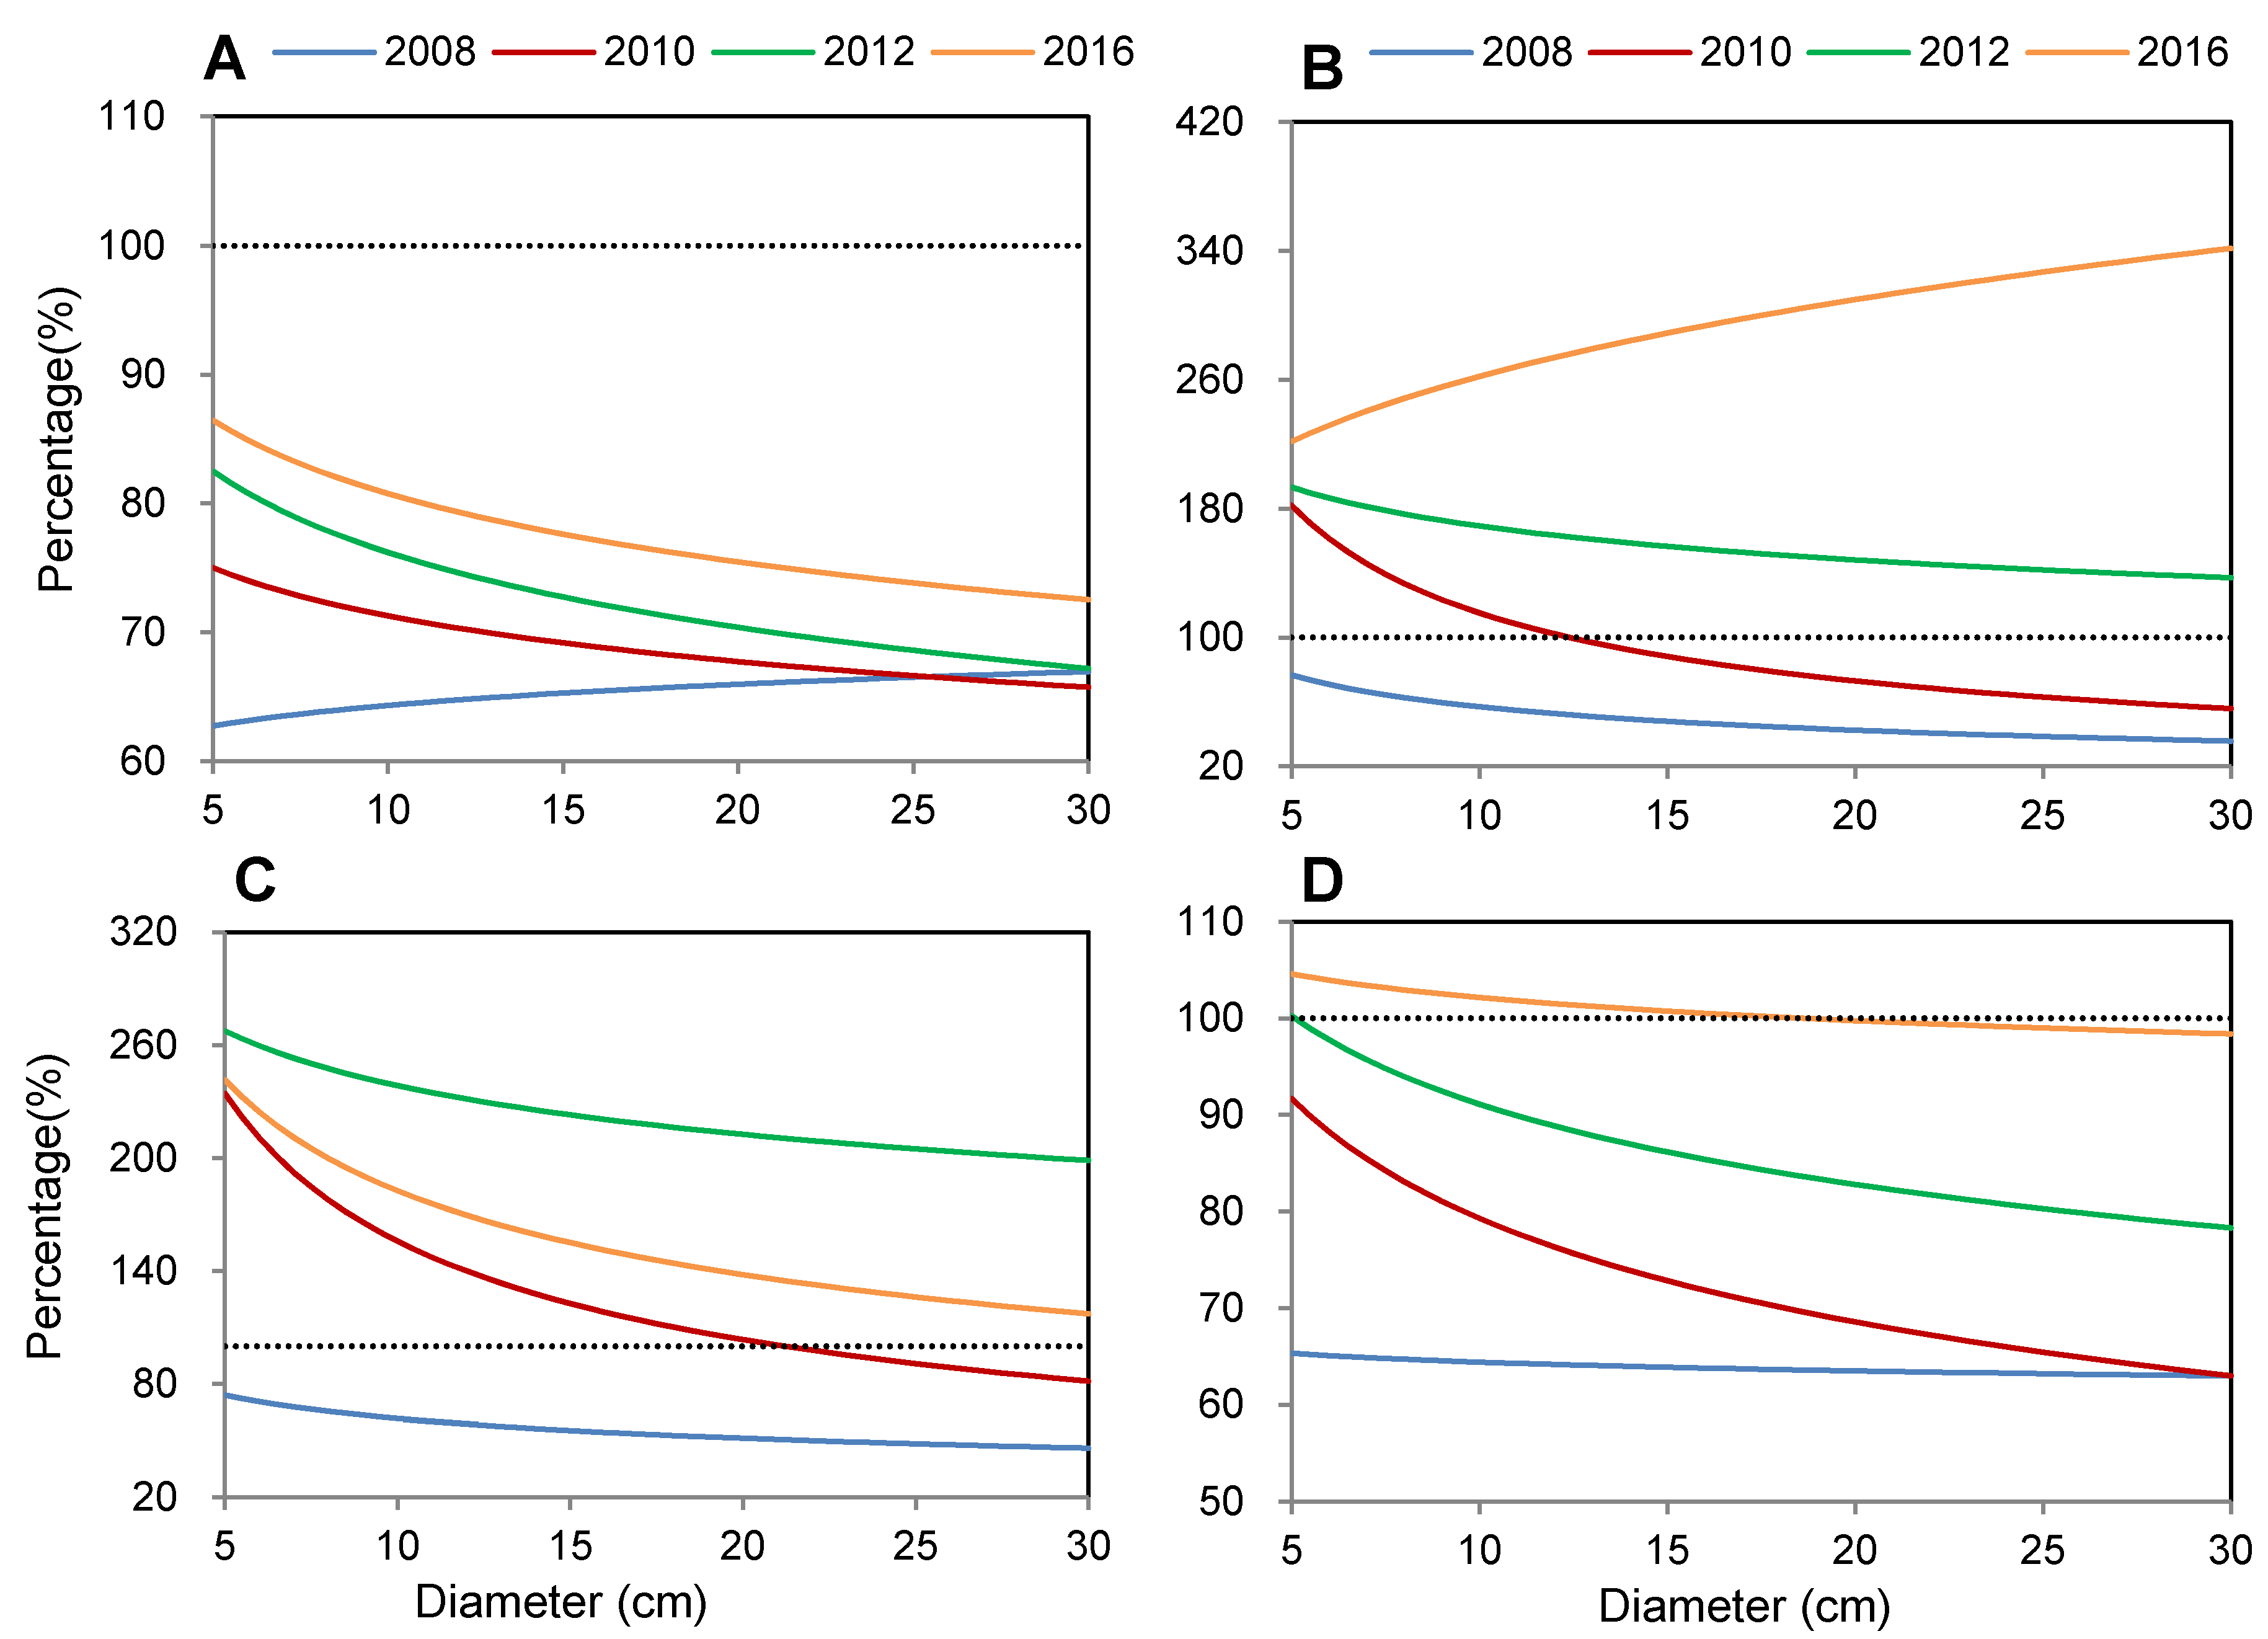
3.3. Recovery Process of Different Tree Components after Disturbance

In disasters, the average biomass loss percentage of different components of trees ranged from 31.4% to 40.7%, with little difference (Figure 3). The trunk lost 34.1% of its biomass on average, and there was a negative correlation between the loss and the diameter class (Figure 4). The biomass of the trunks recovered to 72.0%, 76.3% and 80.8% of the undamaged trees in 2010, 2012 and 2016, respectively, and the recovery rate of the small trees was faster than the large ones. The branch lost 40.7% of its biomass on average, and the amount of loss increased with the increase in diameter. The branch biomass had a fast recovery rate, and its average quantity exceeded that of undamaged trees 2 years after the disturbance, and reached approximately three times that of undamaged trees in 2016, 8 years after the disturbance. The biomass loss percentage of leaves was the smallest (31.4%), and the loss increased with the increase in diameter, the same as that of branches. The biomass of leaves recovered the fastest in the early stage after the disturbance. The average leaf biomass reached 163.3% and 246.3% of the undamaged trees in 2010 and 2012, respectively, but decreased to 189.4% in 2016. Small trees had a faster leaf biomass recovery rate than large trees. The average loss of total aboveground biomass was 35.0% and the loss percentage has a negative correlation with diameter. The average aboveground biomass recovered to 79.0%, 90.6% and 102.7% of the undamaged trees in 2010, 2012 and 2016, respectively, and the recovery rate was negatively correlated with the diameter.

4. Discussion

When a disaster, such as ice storm, that causes great damage to the forest occurs, the first things we want to know are how much has been lost, the depth and breadth of its impact, how long it will take to recover, and what to do. The ice storm caused the loss of part of the forest biomass, which in turn caused changes in many ecological processes such as tree growth speed [16,17], community succession [18], soil properties [19], and water and carbon cycle [20]. The loss of biomass determines the degree of change of other ecological processes. Therefore, an accurate assessment of biomass loss is the basis of the assessment and prediction of multi-process changes in ecosystems, and also provides basic data for formulating post-disaster forest management policies, such as assessing the risk of fire and developing fire prevention strategies. Similarly, the restoration of biomass is also the basis of the restoration of other ecological processes. According to our field observation, immediately after the ice storm, the proportion of tree biomass lost varies with the size class, so the percentage of total biomass cannot be used to estimate the biomass loss. In this study, allometric models for the damaged forest at different recovery stages were built by a small amount of destructive sampling, and then the biomass loss and recovery speed can be estimated by combining the existing forest inventory data. This method is suitable for the assessment of biomass loss and the recovery of evergreen broad-leaved forest after the ice storm, and is economical and easy to operate. This method is not only suitable for ice damage, but also has reference value for other types of disasters, such as typhoons that cause mechanical damage to trees. The relationship between tree diameter and biomass might differ due to variations in species, environmental conditions, and natural and anthropogenic disturbances. Building species-specific biomass allemetric models for every species has the highest accuracy in theory, but, in practice, the species-specific allometric model is not suitable for tropical and subtropical natural forests, where hundreds of species can coexist in a given area [32]. The mixed model usually used to estimate the biomass of all species in subtropical forests, and it has been proved to have reliable accuracy [30,33]. In this study, the selection of sample trees was guided by sample plot inventories, and the selected trees can approximately represent the distribution of community species and diameter. Many species were not represented in the sample plot inventories, because there were identical families or genus trees in the scheme, or these species constituted too little of the total base area. Therefore, the absence of some species will have little impact on the accuracy of biomass estimation.
Trunk biomass and total aboveground biomass often has close relationship with tree diameter, while branch and leaf biomass often vary greatly between species. Therefore, the allometric models have a higher accuracy in estimating stem and total aboveground biomass than in estimating branch and leaf biomass, and this result is consistent with the previous reports [30,34]. The decreased accuracy of trunk allometric models during the recovery process may be due to different sprouting strategies among species. We observed in the field that some species can produce apical dominance sprouting at the top of damaged trunks, and shape new trunks and gain a quick trunk recovery, while other species produce many sproutings but no potential trunks, and the trunk biomass recovered slowly.
The rapid recovery of branch and leaf can help trees to recover photosynthetic capacity as soon as possible to compensate for losses. Many researchers have demonstrated that the recovery of branches and leaves was very fast after disturbances. For example, trees can reach the same leaf mass fraction within one year after pruning treatment [35]: evergreens and semideciduous trees showed intense and accelerated shoot and leaf development after fire [36]. A measurement of forest greenness by satellite after the 2008 Chinese ice storm showed a fairly quick overall recovery [11], which indicated a quick leaf recovery. In this research, the leaf biomass of trees less than 21cm in diameter exceeded the undamaged trees of the same diameter two years after the disaster, showing a fast recovery rate. The sprouting of branches and leaves of woody plants rely on non-structural carbohydrate storage during the initial recovery stage after damage [37,38]. The ice-snow storm occurred in winter and the carbohydrate reserves were abundant during dormancy [39], which may be another reason for the faster recovery of branches and leaves.
The decrease in leaf biomass of damaged trees during the last 4 years of the recovery process indicated the existence of a self-thinning process. The damaged trees tend to produce a large number of branches and leaves, gaining a competitive advantage in post-disaster growth and showing an overcompensation effect, but not all sprouts can grow well due to the intensive competition for light and nutrients. A large number of sprouts often leads to a high mortality [40] and a self-thinning process [41]. We speculate that self-thinning of leaves and branches will continue for a long time in the future. The influence of the ice storm on tree structure and forest composition may last for decades.
Compensatory growth (CG) often refers to the process by which an organism accelerates its growth after a disturbance or a period of slow development due to nutrient deprivation. Although the exact biological mechanism for CG is poorly understood, the phenomenon has been observed in a wide variety of animals and plants [42]. In trees, complete CG (state of no difference in biomass between disturbed and undisturbed sites) and over-CG (state of biomass in the disturbed sites exceeding that from the sites without disturbance) have been observed in different species [42,43,44]. In this study, the biomass of branches and leaves showed a significant over-CG two years after the disaster and remained constant during the later recovery stage. It is necessary to point out that the same level of total aboveground biomass of damaged trees and undamaged trees 8 years after disaster indicated that the relationship between diameter and aboveground biomass had recovered to normal, but the increase in diameter may be delayed and the complete CG may be not reached.
In this study, small-diameter trees suffered more serious damage in the trunk and showed stronger resilience in all organisms than large trees. The positive cross-species relationship between the damage grade and the sprouting ability after damaged by the ice storm had also been demonstrated in previous research [45]. In the sample scheme, small diameter trees were mainly composed of Crustaceae and Lauraceae species and most of these species were shade-tolerant and mid-late succession species. Shade-tolerant species often have more non-structural carbohydrate reserves than light-demanding species [46] and the abundant carbohydrate reserves help plants to obtain a high sprouting ability [47]. Rapid recovery ability enables small trees to gain advantages in the competition of post-disaster growth and improve their dominance, so as to change the forest structure and accelerate forest succession. Other research also had demonstrated that large-scale, homogeneous canopy damage caused by hurricanes impeded the dispersal and establishment of pioneer trees and led to a secondary forest dominated by late-succession species that sprouted and survived the disturbance [48].
This study lasted for 8 years, and the relationship between DBH and biomass had restored to normal levels by the last observation, but the impact of the ice storm on forests was far from over. In the future, the relationship between DBH and biomass may continue to change, and the total biomass may have a complete- or over-CG effect, which needs further observation. Compared with other types of mechanical disasters such as typhoons, ice storms have their own characteristics. For example, they occur during the non-growing seasons and may be accompanied by freezing damage. Therefore, the applicability and accuracy of the models established in this study need to be evaluated when applied to other types of disasters.

5. Conclusions

Ice and snow disasters cause large-scale damage to forests, the loss of tree biomass, and changes in multiple ecological processes. Therefore, accurate assessment of biomass loss is the basis of other ecological research and can provide basic data for the formulation of post-disaster forest management policies. However, there was no reliable method to estimate forest biomass loss in the disaster and biomass recovery after the disaster. The allometric models we established for different recovery stages have a relatively high accuracy in estimating the biomass of different aboveground components of trees, and they can be used to estimate the forest biomass of different recovery stages on a large scale when combined with forest inventory data. This method is economical and easy to operate, and it is of great significance for assessing the impact of ice storms on regional carbon sink capacity and formulating post-disaster forest management strategies. This method can also be applied to other types of natural disasters that may cause mechanical damage to trees, such as typhoons and hurricanes.
Although the aboveground biomass of the damaged trees has recovered to the same level as the undamaged trees at same diameter 8 years after disaster, the proportion of different aboveground components has changed. The growth of branches and leaves was overcompensated and these proportions exceeded normal levels, which indicated that an ice storm can change the architecture of trees over time. Most of the smaller diameter trees were composed of middle- and late succession species, and have a more rapid recovery rate than other species. This ability made these species occupy the blank niche caused by the ice storm and improve their dominance, which indicates that the ice storm may alter the forest structure and accelerate forest succession.

Author Contributions

Conceptualization, H.Z. and G.Z.; software and formal analysis, H.Z., investigation, Z.L. and Z.Q.; writing and review, H.Z. and G.Z.; funding acquisition, Z.W. All authors have read and agreed to the published version of the manuscript.

Funding

This research was funded by the National Natural Science Foundation of China [grant numbers 31770664, 31200418, 31170418], and the Central Non-profit Research Institution of Chinese Academy of Forestry [grant numbers CAFYBB2017ZX002-3; CAFYBB2019SZ003].

Acknowledgments

We would like to thank Gen Li and Tingting Xie for their technological assistance and other 12 persons from local villages for their manual labor in field work.

Conflicts of Interest

The authors declare no conflict of interest.

References

  1. WMO (World Meteorological Organization). The Global Climate 2001–2010: A Decade of Climate Extremes; WMO (World Meteorological Organization): Geneva, Switzerland, 2013; Available online: https://library.wmo.int/index.php?lvl=notice_display&id=15112 (accessed on 20 January 2020).
  2. Yi, C.; Pendall, E.; Ciais, P. Focus on extreme events and the carbon cycle. Environ. Res. Lett. 2015, 10, 070201:1–07201:10. [Google Scholar] [CrossRef]
  3. Stott, P. How climate change affects extreme weather events. Science 2016, 352, 1517–1518. [Google Scholar] [CrossRef] [PubMed]
  4. Zhou, B.; Gu, L.; Ding, Y.; Shao, L.; Wu, Z.; Yang, X.; Li, C.; Li, Z.; Wang, X.; Cao, Y.; et al. The great 2008 Chinese ice storm: Its socioeconomic-ecological impact and sustainability lessons learned. B. Am. Meteorol. Soc. 2011, 92, 47–60. [Google Scholar] [CrossRef] [Green Version]
  5. Changnon, S.A. Characteristics of ice storms in the United States. J. Appl. Meteorol. Clim. 2003, 42, 630–639. [Google Scholar] [CrossRef]
  6. Stone, R. Natural disasters: Ecologists report huge storm losses in China’s forests. Science 2008, 319, 1318–1319. [Google Scholar] [CrossRef]
  7. Shao, Q.; Huang, L.; Liu, J.; Kuang, W.; Li, J. Analysis of forest damage caused by the snow and ice chaos along a transect across southern China in spring 2008. J. Geogr. Sci. 2011, 21, 219–234. [Google Scholar] [CrossRef]
  8. Zhou, B.; Li, Z.; Wang, X.; Cao, Y.; An, Y.; Deng, Z.; Letu, G.; Wang, G.; Gu, L. Impact of the 2008 ice storm on moso bamboo plantations in southeast China. J. Geophys. Res. 2011, 116, G00H06. [Google Scholar] [CrossRef]
  9. Wang, X.; Yang, F.; Gao, X.; Wang, W.; Zha, X. Evaluation of forest damaged area and severity caused by ice-snow frozen disasters over southern china with remote sensing. Chinese. Geogr. Sci. 2019, 29, 405–416. [Google Scholar] [CrossRef] [Green Version]
  10. Zhou, B.; Wang, X.; Cao, Y.; Ge, X.; Gu, L.; Meng, J. Damage assessment to subtropical forests following the 2008 Chinese ice storm. Iforest 2017, 10, 406–415. [Google Scholar] [CrossRef] [Green Version]
  11. Sun, Y.; Gu, L.; Dickinson, R.E.; Zhou, B. Forest greenness after the massive 2008 Chinese ice storm: Integrated effects of natural processes and human intervention. Environ. Res. Lett. 2012, 7, 035702:1–035702:8. [Google Scholar] [CrossRef] [Green Version]
  12. Bragg, D.C. Initial mortality rates and extent of damage to loblolly and longleaf pine plantations affected by an ice storm in South Carolina. For. Sci. 2016, 62, 574–585. [Google Scholar] [CrossRef]
  13. Zhao, H.; Wu, Z.; Qiu, Z.; Li, Z.; Zhou, G. Effects of stump characteristics and soil fertility on stump resprouting of schima superba. Cerne 2018, 24, 249–258. [Google Scholar] [CrossRef]
  14. Wang, X.; Huang, S.; Li, J.; Zhou, G.; Shi, L. Sprouting response of an evergreen broad-leaved forest to a 2008 winter storm in Nanling Mountains, southern China. Ecosphere 2016, 7, e01395:1–e01395:10. [Google Scholar] [CrossRef]
  15. Huang, R.; Jia, X.; Ou, Y.; Xu, M.; Xie, P.; Su, Z. Monitoring canopy recovery in a subtropical forest following a huge ice storm using hemispherical photography. Environ. Monit. Assess. 2019, 191, 355. [Google Scholar] [CrossRef] [PubMed]
  16. Ge, J.; Xiong, G.; Wang, Z.; Zhang, M.; Zhao, C.; Shen, G.; Xu, W.; Xie, Z. Altered dynamics of broad-leaved tree species in a Chinese subtropical montane mixed forest: The role of an anomalous extreme 2008 ice storm episode. Ecol. Evol. 2015, 5, 1484–1493. [Google Scholar] [CrossRef]
  17. Sholes, O.D.V. Effects of ice storm damage on radial growth of Quercus spp. J. Torrey Bot. Soc. 2013, 3, 364–368. [Google Scholar] [CrossRef]
  18. Covey, K.R.; Barrett, A.L.; Ashton, M.S. Ice storms as a successional pathway for Fagus grandifolia advancement in Quercus rubra dominated forests of southern New England. Can. J. Forest Res. 2015, 45, 1628–1635. [Google Scholar] [CrossRef]
  19. Xu, J.X.; Xue, L.; Su, Z.Y. Impacts of forest gaps on soil properties after a severe ice storm in a Cunninghamia lanceolata stand. Pedosphere 2016, 26, 408–416. [Google Scholar] [CrossRef]
  20. Xu, X.; Zhou, G.; Liu, S.; Du, H.; Mo, L.; Shi, Y.; Jiang, H.; Zhou, Y.; Liu, E. Implications of ice storm damages on the water and carbon cycle of bamboo forests in southeastern China. Agr. Forest Meteorol. 2013, 177, 35–45. [Google Scholar] [CrossRef]
  21. Powell, S.L.; Cohen, W.B.; Kennedy, R.E.; Healey, S.P.; Huang, C. Observation of trends in biomass loss as a result of disturbance in the conterminous U.S.: 1986–2004. Ecosystems 2014, 17, 142–157. [Google Scholar] [CrossRef]
  22. Hill, T.C.; Ryan, C.M.; Williams, M. A framework for estimating forest disturbance intensity from successive remotely sensed biomass maps: Moving beyond average biomass loss estimates. Carbon. Bal. Manag. 2015, 10, 27:1–27:9. [Google Scholar] [CrossRef] [PubMed] [Green Version]
  23. Xie, Y.; Sha, Z.; Yu, M. Remote sensing imagery in vegetation mapping: A review. J. Plant. Ecol. 2008, 1, 9–23. [Google Scholar] [CrossRef]
  24. Henry, M.; Picard, N.; Trotta, C.; Manlay, R.J.; Valentini, R.; Bernoux, M.; Saintandré, L. Estimating tree biomass of sub-Saharan African forests: A review of available allometric equations. Silva. Fenn. 2011, 45, 477–569. [Google Scholar] [CrossRef] [Green Version]
  25. Zianis, D.; Mencuccini, M. On simplifying allometric analyses of forest biomass. Forest Ecol. Manag. 2004, 187, 311–332. [Google Scholar] [CrossRef]
  26. Hounzandji, A.P.I.; Jonard, M.; Nys, C.; Saint-André, L.; Ponette, Q. Improving the robustness of biomass functions: From empirical to functional approaches. Ann. Forest Sci. 2015, 72, 795–810. [Google Scholar] [CrossRef] [Green Version]
  27. Ribeiro, G.; Suwa, R.; Marra, D.; Lima, A.; Kajimoto, T.; Ishizuka, M.; Higuchi, N. Allometry for juvenile trees in an Amazonian forest after wind disturbance. Jap. Agric. Res. Quar. 2014, 48, 213–219. [Google Scholar] [CrossRef] [Green Version]
  28. Mahmood, H.; Siddique, M.R.H.; Abdullah, S.M.R.; Akhter, M.; Islam, S. Manual for Building Tree Volume and Biomass Allometric Equation for Bangladesh; Bangladesh Forest Department, Ministry of Environment and Forests: Dhaka, Bangladesh; Food and Agricultural Organization of the United Nations: Dhaka, Bangladesh, 2016.
  29. Moussa, M.; Mahamane, L. Allometric models for estimating aboveground biomass and carbon in Faidherbia albida and Prosopis africana under agroforestry parklands in drylands of Niger. J. Forestry Res. 2018, 29, 1703–1717. [Google Scholar] [CrossRef]
  30. Zhao, H.; Zhou, G.; Li, Z.; Qiu, Z.; Wu, Z. Site-specific allometric models for prediction of above- and belowground biomass of subtropical forests in Guangzhou, southern China. Forests 2019, 10, 862. [Google Scholar] [CrossRef] [Green Version]
  31. Xiang, W.; Zhou, J.; Ouyang, S.; Zhang, S.; Lei, P.; Li, J.; Deng, X.; Fang, X.; Forrester, D.I. Species-specific and general allometric equations for estimating tree biomass components of subtropical forests in southern China. Eur. J. Forest Res. 2016, 135, 1–17. [Google Scholar] [CrossRef]
  32. Paul, K.I.; Roxburgh, S.H.; England, J.R.; Ritson, P.; Hobbs, T.; Brooksbank, K.; Raison, R.J.; Larmour, J.S.; Murphy, S.; Norris, J. Development and testing of allometric equations for estimating above-ground biomass of mixed-species environmental plantings. Forest Ecol. Manag. 2013, 310, 483–494. [Google Scholar] [CrossRef]
  33. Xu, Y.; Zhang, J.; Franklin, S.B.; Liang, J.; Ding, P.; Luo, Y.; Lu, Z.; Bao, D.; Jiang, M. Improving allometry models to estimate the above- and belowground biomass of subtropical forest, China. Ecosphere 2015, 6, 1–15. [Google Scholar] [CrossRef]
  34. Lin, K.; Lyu, M.; Jiang, M.; Chen, Y.; Li, Y.; Chen, G.; Xie, J.; Yang, Y. Improved allometric equations for estimating biomass of the three Castanopsis carlesii H. forest types in subtropical China. New Forest 2017, 48, 1–21. [Google Scholar] [CrossRef]
  35. Zeng, B. Aboveground biomass partitioning and leaf development of Chinese subtropical trees following pruning. Forest Ecol. Manag. 2003, 173, 135–144. [Google Scholar] [CrossRef]
  36. Souza, J.P.; Albino, A.L.S.; Prado, C.H.B.A. Evidence of the effects of fire on branching and leaf development in cerrado trees. Acta Botanica Brasilica 2017, 31, 677–685. [Google Scholar] [CrossRef] [Green Version]
  37. Schutz, A.E.N.; Bond, W.J.; Cramer, M.D. Defoliation depletes the carbohydrate reserves of resprouting Acacia saplings in an African savanna. Plant. Ecol. 2011, 212, 2047–2055. [Google Scholar] [CrossRef]
  38. Zhu, W.; Xiang, J.; Wang, S.; Li, M. Resprouting ability and mobile carbohydrate reserves in an oak shrubland decline with increasing elevation on the eastern edge of the Qinghai-Tibet Plateau. Forest Ecol. Manag. 2012, 278, 118–126. [Google Scholar] [CrossRef]
  39. Kays, J.S.; Canham, C.D. Effects of time and frequency of cutting on hardwood root reserves and sprout growth. Forest Sci. 1991, 37, 524–539. [Google Scholar]
  40. Lutz, J.A.; Halpern, C.B. Tree mortality during early forest development: A long-term study of rates, causes, and consequences. Ecol. Monogr. 2006, 76, 257–275. [Google Scholar] [CrossRef]
  41. Rydberg, D. Initial sprouting, growth and mortality of European aspen and birch after selective coppicing in central Sweden. Forest Ecol. Manag. 2000, 130, 27–35. [Google Scholar] [CrossRef]
  42. Li, C.; Huang, S.; Barclay, H.; Filipescu, C.N. Estimation of compensatory growth of coastal Douglas-fir following pre-commercial thinning across a site quality gradient. Forest Ecol. Manag. 2018, 429, 308–316. [Google Scholar] [CrossRef]
  43. Guillet, C.; Bergstrom, R. Compensatory growth of fast-growing willow (Salix) coppice in response to simulated large herbivore browsing. Oikos 2006, 113, 33–42. [Google Scholar] [CrossRef]
  44. Lieurance, D.M. Biomass allocation of the invasive tree Acacia auriculiformis and refoliation following hurricane-force winds. J. Torrey Bot. Soc. 2007, 134, 389–397. [Google Scholar] [CrossRef]
  45. Angela, G.B.; Neil, C.; Contreras, T.A.; Fahrig, L. Crown loss and subsequent branch sprouting of forest trees in response to a major ice storm. J. Torrey Bot. Soc. 2004, 131, 169–176. [Google Scholar] [CrossRef]
  46. Myers, J.A.; Kitajima, K. Carbohydrate storage enhances seedling shade and stress tolerance in a neotropical forest. J. Ecol. 2007, 95, 383–395. [Google Scholar] [CrossRef]
  47. Nzunda, E.F.; Griffiths, M.E.; Lawes, M.J. Resource allocation and storage relative to resprouting ability in wind disturbed coastal forest trees. Evol. Ecol. 2014, 28, 735–749. [Google Scholar] [CrossRef]
  48. Mascaro, J.; Perfecto, I.; Barros, O.; Boucher, D.H.; Cerda, I.G.D.L.; Ruiz, J.; Vandermeer, J. Aboveground biomass accumulation in a tropical wet forest in Nicaragua following a catastrophic hurricane disturbance. Biotropica 2005, 37, 600–608. [Google Scholar] [CrossRef] [Green Version]
Figure 1. Distribution of biomass among different tree compartments (leaves, branches, trunks) at different recovery stages after the ice storm. The percentage within the section of each bar indicates the mean proportion value, while the different lowercase letters following the numbers indicate significant differences between the recovery stages tested by one-way ANOVA LSD.
Forests 11 00320 g001
Figure 2. The relationships between diameter and biomass of different compartments of trees at different recovery stages after the ice storm disaster. (A) trunk, (B) branch, (C) leaf and (D) aboveground. The solid lines with different colors are regression equations.
Forests 11 00320 g002
Figure 3. Proportion of average biomass of different tree compartments at different recovery stages after the ice storm compared to that of undamaged trees with the same diameter. The different lowercase letters on the columns indicate significant differences between the recovery stages tested by one-way ANOVA LSD.
Forests 11 00320 g003
Figure 4. The relationship between the diameter and proportion of calculated biomass of damaged trees to that of calculated biomass of undamaged trees. (A) trunk, (B) branch, (C) leaf and (D) aboveground.
Forests 11 00320 g004
Table 1. The species composition, sampled number and diameter class distribution of sampled trees.
SpeciesSample NumberMin DBH (cm)Max DBH (cm)5–10 cm10–15 cm15–20 cm>20 cm
Castanopsis fissa115.527.32333
Aleurites montana810.322.7-332
Castanopsis carlesii66.719.813 *2-
Lithocarpus harlandii57.119.2221-
Diospyros morrisiana45.313.322--
Castanopsis tibetana25.513.511--
Machilus chinensis25.912.711--
Machilus kwangtungensis25.47.72 *---
Manglietia moto26.39.12---
Sapium discolor210.314.8-2 *--
Castanopsis eyrei15.57.31---
Cinnamomum porrectum16.18.61---
Machilus thunbergii112.615-1--
Note: The sampled number in 2008 was 44 and the symbol “*” means there was a sample lacked. Symbol “-” means no such diameter class arrangement. DBH: Diameter at Breast Height.
Table 2. Allometric models for estimation of biomass of trunks, branches, leaves and total aboveground biomass at different recovery stages after the ice storm disaster.
ComponentsYearCoefficient SymbolR2CV (%)Bias (%)
ab
Trunk2008−2.926 ± 0.1842.482 ± 0.0730.94920.69%−1.82%
2010−2.571 ± 0.1812.372 ± 0.0730.94420.85%−2.20%
2012−2.409 ± 0.1962.331 ± 0.0780.94222.67%−2.12%
2016−2.390 ± 0.1592.347 ± 0.0640.91326.14%−1.80%
Undamaged−2.401 ± 0.1262.445 ± 0.0500.98112.44%−0.91%
Branch2008−4.275 ± 0.4362.007 ± 0.1730.70342.19%−10.37%
2010−3.033 ± 0.3491.774 ± 0.1410.77737.34%−7.97%
2012−3.727 ± 0.3842.242 ± 0.1530.82042.87%−8.05%
2016−4.286 ± 0.3492.675 ± 0.1390.76764.58%−8.43%
Undamaged−4.694 ± 0.3062.434 ± 0.1220.79542.46%−5.27%
Leaf2008−5.099 ± 0.5292.031 ± 0.2100.70641.80%−16.66%
2010−3.423 ± 0.3561.705 ± 0.1440.77734.98%−8.08%
2012−3.973 ± 0.3332.129 ± 0.1330.89230.04%−6.52%
2016−3.693 ± 0.3561.891 ± 0.1420.84433.03%−9.11%
Undamaged−5.224 ± 0.2972.295 ± 0.1180.76146.80%−5.21%
Aboveground2008−2.638 ± 0.1562.417 ± 0.0620.96317.13%−1.32%
2010−1.995 ± 0.1792.228 ± 0.0720.95118.70%−2.13%
2012−2.021 ± 0.1732.300 ± 0.0690.97015.97%−1.60%
2016−2.145 ± 0.1302.404 ± 0.0520.97116.24%−1.16%
Undamaged−2.246 ± 0.1112.438 ± 0.0440.98411.44%−0.71%
Note: Letters a and b are the coefficient symbols of regression model; The number is unstandardized coefficients ± standard error, R2 is the coefficient of determination; CV (%) is the coefficient of variation, Bias (%) is systematic error.

