Abstract
The TIFY gene family is specific to land plants, exerting immense influence on plant growth and development as well as responses to biotic and abiotic stresses. Here, we identify 25 TIFY genes in the poplar (Populus trichocarpa) genome. Phylogenetic tree analysis revealed these PtrTIFY genes were divided into four subfamilies within two groups. Promoter cis-element analysis indicated most PtrTIFY genes possess stress- and phytohormone-related cis-elements. Quantitative real-time reverse transcription polymerase chain reaction (qRT–PCR) analysis showed that PtrTIFY genes displayed different expression patterns in roots under abscisic acid, methyl jasmonate, and salicylic acid treatments, and drought, heat, and cold stresses. The protein interaction network indicated that members of the PtrTIFY family may interact with COI1, MYC2/3, and NINJA. Our results provide important information and new insights into the evolution and functions of TIFY genes in P. trichocarpa.
1. Introduction
The TIFY gene family is specific to land plants and was first found in Arabidopsis and annotated as a transcription factor [1,2]. This gene family contains a core motif, TIF[F/Y]XG, previously known as ZIM (a zinc-finger protein expressed in inflorescence meristem) [1], and includes 20 members in Rice, 18 members in Arabidopsis, and 27 members in Maize [3,4,5]. Depending on the conservative domain, the proteins are divided into two groups: Group I containing the C2C2-GATA (CX2CX20CX2C) conservative domain, which is absent in Group II. Generally, the TIFY family can be divided into four subfamilies: TIFY, JAZ, PPD, and ZML [4]. The TIFY subfamily contains only the TIFY domain. The JAZ subfamily is named for its conserved Jas motif with 22 amino acids, which contains the TIFY domain and a C-terminal conserved domain, as well as the distinctive motif of SLX2FX2KRX2RX5PY [6,7]. The PEAPOD (PPD) subfamily was first found by map-based cloning method in ppd mutants, which has an exclusive N-terminal PPD domain of around 50 amino acids, a TIFY domain, and a Jas motif lacking the two conserved amino acids “PY” (SLX2FX2KRX2RX5). Finally, the ZML (ZIM-LIKE) subfamily contains a C-terminal GATA-type zinc-finger domain, a CCT (CONSTANS/CO-like/TOC1) domain, and a TIFY domain. The CCT domain is known to play an important role in light signal transduction and takes part in protein–protein interaction [4]. The JAZ (Jasmonate ZIM-domain) subfamily has been studied mostly as a key regulator of jasmonate signaling pathways [8]. The CCT domain is important because it allows the proteins of the JAZ subfamily to interact with other proteins to regulate jasmonate signaling and take part in response to biotic and abiotic stresses in several plants [7]. For example, the F-box protein CORONATINE INSENSITIVE1 (COI1) acts as a hormone co-receptor and functions as a negative regulator of the jasmonate signaling pathway [8,9]. JAZ1 and JAZ9 can interact with COI1 in Arabidopsis and transgenic plants exhibited JA-insensitive phenotypes and increased resistance to pathogens [10]. Also, JA regulates the ethylene-stabilized transportation factors EIN3 and EIL1 by binding with the JAZ proteins to pathogen defense and development processes [11]. The R2R3 MYB-type transcription factors MYB21 and MYB24 can interact with JAZ1, JAZ8, and JAZ11 in yeast and plants to affect jasmonate-regulated stamen development in Arabidopsis. Recently, Ju et al. reported that the C-terminal region of TaJAZ1 interacts with TaABI5 to modulate seed germination and negatively modulate ABA response in wheat [12].
Functional analysis of the TIFY gene family has been carried out in several plant species. PnJAZ1 increased tolerance to salt stress and decreased ABA sensitivity during seed germination and early development in Pohlia nutans [13]. As reported, ZmJAZ14 was significantly induced by polyethylene glycol (PEG), MeJA, abscisic acid (ABA), and gibberellins (GAs). Overexpression of ZmJAZ14 in Arabidopsis enhanced the plants’ tolerance to JA and ABA treatments [14]. Additionally, AsJAZ1 can be involved in nodule development and nitrogen fixation by interacting with AsB2510 in Astragalus sinicus [15]. The PPD genes regulate tissue growth, modify lamina size, and restrict curvature of the leaf blade [16]. Removing PEAPOD results in increased leaf lamina size and altered shape of the silique [16]. In Arabidopsis, AtPPD2 interacts with AtLHP1 to directly or indirectly regulate several target genes to affect lateral organ development, while Arabidopsis ppd2 shows greater leaf breadth than wild-type (WT) [17]. In Maize, ZmTIFY4, 5, 8, 26, and 28 respond to drought; additionally, ZmTIFY1 19 and 28 show upregulation when treated by three kinds of pathogens [5]. In summary, different TIFY subfamily members have different functions during plant growth and development, as well as different responses to phytohormone treatment and abiotic stress.
Populus trichocarpa serves as a model forest species and is widely used in forest tree genomics studies [18]. Previous works identified 24 PtrTIFY genes in the P. trichocarpa genome and analyzed their expression profiles under JA, MeJA, SA, salt, cold stresses, and pathogen infection in leaves [19,20]. In our study, besides these 24 genes, we found a new TIFY family member in the P. trichocarpa genome; because of the existence of the Jas and TIFY motif, we named it PtrJAZ13. Roots play an important role in woody plants’ responses to phytohormone treatment and abiotic stress, but there are no reports to date that focus on the TIFY gene family in P. trichocarpa roots responding to such manipulations. We therefore used the roots of P. trichocarpa as experimental materials and employed quantitative real-time reverse transcription polymerase chain reaction (qRT-PCR) to analyze the expression profiles of all TIFY family genes under ABA, MeJA, and SA treatments plus drought, heat, and cold stresses. Our results provide new insights for future investigations into the roles of these candidate genes under hormone treatment and abiotic stress in P. trichocarpa.
2. Materials and Methods
2.1. Identification of TIFY Genes in P. trichocarpa
We used the protein family database Pfam (http://pfam.xfam.org/) [21] to search for the hidden Markov model (HMM) profile of the TIFY gene family (protein family ID:PF06200) based on an expected value (E-value) cutoff of 0.01 in HMMER 3.3 (http://hmmer.org/) to find TIFY genes in the P. trichocarpa genome. The genomic library, coding sequence (CDS), and protein database of P. trichocarpa were directly downloaded from the Phytozome v12.0 (https://phytozome.jgi.doe.gov) and NCBI (http://www.ncbi.nlm.nih.gov/). The Clustal X (version 2.0) and NCBI database were used to search the identification of the TIFY, ZML, PPD, and JAZ domains. We used the WoLF PSORT database to predict the subcellular localization of PtrTIFY genes. Aliphatic index, instability index, and GRAVY (grand average of hydropathy) of PtrTIFY genes were identified for all PtrTIFY proteins by using ProtParam of Expasy tools (http://web.expasy.org/protparam) [22].
2.2. Phylogenetic Analysis
The ClustalX (version 2.0, http://www.clustal.org/clustal2/) [23] program and Bioedit 7.2 [24] software were used to performed multiple sequence alignment using the full-length protein sequence. In order to analyze the molecular features and phylogenetic relationships of the TIFY gene family in plants, MEGA 7.0 [25] was used to build an unrooted phylogenetic tree using the neighbor-joining (NJ) method, with a bootstrap test performed using 1000 replications and the poisson model. Gene clusters referring to the homologs within the three species (P. trichocarpa, A. thaliana, and O. sativa) which identified based on the NCBI database by BLAST and query cover >75% was regarded as homologous genes. The PtrTIFY gene exon/intron organization was determined using GSDS2.0 online software (http://gsds.cbi.pku.edu.cn) [26]. MEME 5.1.0 [27] was used to find motifs in PuTIFY genes using the default parameters and a conserved motif number of 15.
2.3. Promoter Cis-Element Analysis
The NCBI and Phytozome V12.0 (https://phytozome.jgi.doe.gov/pz/portal.html) databases were used to search for cis-regulating elements, which were limited the 2000 bp upstream of the ATG codon for each of the analyzed genes [28]. The online software Plantcare (http://bioinformatics.psb.ugent.be/webtools/plantcare/html/) [29] was used to predict and locate their cis-elements and analyze the functions of the TIFY gene family.
2.4. Plant Materials, Abiotic Stress, and Phytohormone Treatment
For plant samples, the clonally propagated P. trichocarpa (genotype Nisqually-1) was grown in woody plant medium (WPM) supplied with 20 g/L sucrose and 5.5 g agar. In vitro plants were cultured in 250 mL plastic containers and grown in a growth chamber with the 16 h light/8 h dark cycling at 23–25 °C with a light intensity of 46 μmol photons m−2 s−1 irradiation. Two-week-old in vitro plants were used for abiotic stress and phytohormone treatment. For abiotic stress, 7% PEG6000 simulated drought stress, 42 °C simulated heat stress, and 4 °C simulated cold stress. For phytohormone treatments, plants were exposed to a WPM medium containing 100 μM MeJA, 200 μM ABA, or 100 μM SA. Each treatment lasted for 0, 3, 6, 12, and 24 h. The 42 °C stress time points were at 0, 0.5, 1, and 3 h. Untreated in vitro plants at each time point served as control. Fresh roots undergoing each stress were frozen in liquid nitrogen immediately after being harvested and stored at −80°C for later use. Three independent biological replicates were performed for each treatment to ensure reliable data.
2.5. RNA Isolation and Real-Time Quantitative PCR
Highly purified RNA was extracted using the CTAB method [30]. The TransScript® First-Strand cDNA Synthesis SuperMix (TransGen) was used to obtain the cDNA, with the following reaction system: 500 ng of total RNA, 1 μL of anchored oligo(dT)18, 10 μL of 2 × ES reaction mix, 1 μL of EasyScript®RT/RI enzyme mix and appropriate ddH2O to make the total volume to 20 μL. The cDNA was diluted 10-fold (cDNA:nuclease free water = 1:10) for further qRT–PCR analysis. Gene-specific primers were designed using Primer Premier 6.25, and NCBI primer-BLAST was used to check their specificity. TransStart®Top Green qPCR Super Mix (TransGen Biotech, Beijing, China) was employed to carry out the qRT–PCR, with the following reaction system: 10 μL of 2 × TransStart® Top Green qPCR Super Mix, 7 μL of double-distilled H2O, 1 μL of diluted template, and 2 μL of forward primer and reverse primer. qTOWER 3G Cycler and qPCR software (Analytik Jena, Germany) were used as a work program and the 2−ΔΔCT method [31] was used to perform the relative gene expression level analysis. The PtrActin was used as the internal reference gene. Triplicate independent technical and biological replications were used in the analysis. The primers for qRT–PCR are listed in Table S1.
2.6. Protein Interaction Network Analysis
The online database STRING v11.0 (https://string-db.org) [32] was used to predict the PtrTIFY protein interaction network according to the corresponding homologs between P. trichocarpa and Arabidopsis. Each amino acid sequence of the PtrTIFY genes was used to generate the protein interaction network. In the STRING database, a variety of active interaction sources were provided for the user to select the evidence of interaction [32]. In this study, active interaction sources were selected as “experiments” and “co-expression” with a minimum required interaction score of 0.4. Cytoscape 3.7.2 software [33] was used to visualize and analyze the interactions.
2.7. Statistical Analysis
SPSS software (version 20, IBM, Chicago, USA) was used to analyze data using one-way analysis of variance (ANOVA) followed by Tukey’s test to assess significant differences between the control and each treatment. Significance was defined as * p < 0.05, ** p < 0.01.
3. Results
3.1. Identification of TIFY Genes in P. trichocarpa
In order to identify all assumptive TIFY genes in P. trichocarpa, the HMM profile of the TIFY domain (protein ID:PF06200) was used as a query to compare with the P. trichocarpa genome. In the end, a total of 25 candidate TIFY gene members were obtained. Wang et al. found 24 PtrTIFY genes in the P. trichocarpa genome; in our study, besides the founded 24 PtrTIFY genes, we found another PtrTIFY gene (PtrJAZ13). According to distinct domain, we named TIFY proteins as PtrTIFY (1–2), PtrJAZ (1–13), PtrZML (1–8), and PtrPPD (1–2). WoLF PSORT was used to predict the subcellular location of each candidate TIFY protein in P. trichocarpa. The results showed that PtrJAZ6 and PtrJAZ10 were predicted to be in the cytoplasm and chloroplasts, respectively; PtrTIFY (PtrTIFY1, -2) and PtrPPD (PtrPPD1, -2) subfamily members were predicted to be in the nucleus; PtrZML2, -3, -4, -6 and -7 were predicted to be in the nucleus, PtrZML1 and PtrZML5 were predicted to be in the cytoplasm, and PtrZML8 was predicted to be in chloroplasts. The TIFY gene family has all ten different kinds of TIFY formation in P. trichocarpa. PtrTIFY1, -2, two PtrJAZ subfamily members (PtrJAZ6, -12), and PtrPPD1, -2 shared the TIFY motifs with TIFYGG and TIFYCG, respectively. PtrJAZ1, -4, -9, -13 contained the TIFYNG motif and PtrJAZ2, -3, -5, -7, -8, -10, -11 shared the TIFYAG conserved motif. Eight PtrZML subfamily members own six different kinds of TIFY formation, including TLSFEG, TLTFRG, TLSFEG, TLSFQG, TIAFEG, TLTFQG. The GRAVY ranged from −0.225 to −0.893, the instability index ranged from 29.88 to 81.91, and the aliphatic index ranged from 48.96 to 85.07. PtrJAZ13 had the highest stability index; PtrZML7 possessed the minimum GRAVY (grand average of hydropathy), instability index, and aliphatic index; and PtrZML5 contained the maximum aliphatic index. Detailed information about PtrTIFY genes is given in Table 1.

Table 1.
Basic information of the TIFY family in P. trichocarpa.
3.2. Phylogenetic Analysis of TIFY Genes
To gain insight into the evolutionary relationship between TIFY proteins in P. trichocarpa, the 25 full-length TIFY protein sequences from P. trichocarpa, 17 proteins from Rice, and 18 proteins from Arabidopsis were used to build the neighbor-joining phylogenetic tree. MEGA 7.0 software was used to visualize the results. As shown in Figure 1, nine clades were identified in the phylogenetic tree, including JAZ I to V, PPD, TIFY I, II, and ZML. Eight PtrTIFY proteins (PtrZML1, -2, -3, -4, -5, -6, -7, -8) were clustered together in Group I, which contained a GATA zinc-finger domain and a CCT motif based on distinct domain. The remaining 17 PtrTIFY proteins were clustered in Group II. This group contained all PtrJAZ, PtrTIFY, and PtrPPD subfamily members. The PtrJAZ subfamily contains the largest numbers of members, which were distributed in three of the four JAZ clades, omitting JAZII. PtrJAZ13 was in the JAZIV clade and belongs to Group II. From the genetic relationship, PtrJAZ2, -3, -5, -6, -7, -8, -10, -11, PtrZML1, -3, PtrTIFY1, -2 and PtrPPD1, -2 were clustered with TIFY proteins in Arabidopsis. This phenomenon indicates that PtrTIFY proteins are more closely related to those of Arabidopsis than to those of Rice.
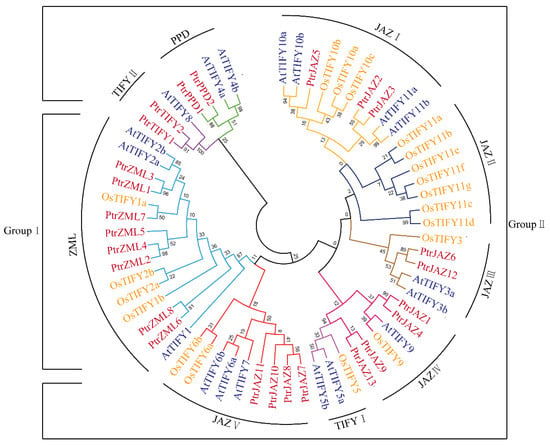
Figure 1.
Phylogenetic analysis of the TIFY family members from P. trichocarpa, O. sativa, and Arabidopsis. The phylogenetic trees were constructed using the neighbor-joining (NJ) method of MEGA7 with 1000 bootstrap replicates. For Group I and Group II, Group I contained the C2C2-GATA (CX2CX20CX2C) conservative domain, which was absent in Group II. Each clade was represented by different color lines. The naming approach of each clade was following a previous study [34]. The explanation of group I and II of Figure 1 was added in the Figure 1 legend which was highlighted in red font and yellow background
3.3. Phylogenetic Analysis, Gene Structure, and Conserved Motifs of TIFY Genes in P. trichocarpa
In order to analyze the phylogenetic relationships among the TIFY genes in P. trichocarpa, an unrooted phylogenic tree was constructed from alignments of the full-length PtrTIFY protein sequences. As shown in Figure 2A, PtrTIFY genes were clustered into five sections, including two parts of PtrJAZ. Based on the phylogenetic analysis, we identified 11 sister pairs, all of which had strong bootstrap support (>90%). To gain further insights into the structural diversity of PtrTIFY genes, we analyzed the exon/intron organization in the full-length cDNAs with their corresponding genomic DNA sequences of individual PtrTIFY genes in P. trichocarpa (Figure 2B). Most PtrTIFY subfamily members shared similar exon/intron lengths and numbers, especially the sister pair genes within the same subfamily. For example, both PtrTIFY1 and PtrTIFY2 contained five introns of similar lengths, while PtrJAZ13 and its homologous gene PtrJAZ9 possessed only one intron. Distinct motifs were found in PtrTIFY genes by the MEME website. All PtrTIFY genes contained the conserved TIFY motif. As expected, the most closely related genes contained similar motifs, indicating functional diversity among TIFY proteins in the subgroup. In total, we found 15 motifs within 25 PtrTIFY genes, including Motif 1 representing the TIFY motif, Motif 2 representing the JAZ motif, and Motif 13 representing the PPD motif. PtrJAZ9 and PtrJAZ13 contained the minimum motif in number (Motifs 1 and 2). Interestingly, PtrJAZ8 possessed one more Motif 6 than PtrJAZ7 (Figure 2C). Detailed motif information is shown in Table S2.
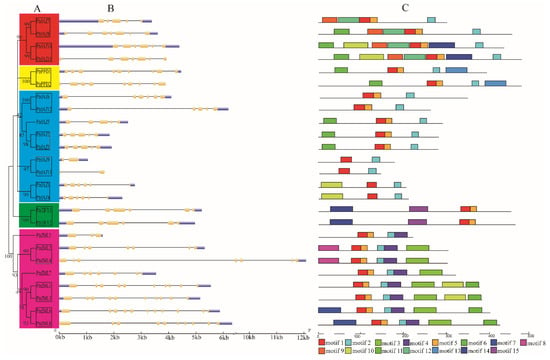
Figure 2.
Phylogenetic relationships and gene structure of TIFYs in P. trichocarpa. (A) Multiple alignment of full-length amino acid sequences of PtrTIFY genes was carried out with ClustalX 2.0. The phylogenetic tree was constructed using neighbor-joining method with MEGA7.0. The sister pairs was marked with black-box. Red and blue boxes represent the JAZ subfamily, yellow box represents the PPD subfamily, green box represents the TIFY subfamily, and pink box represents the ZML subfamily. (B) Exon/intron structures of the PtrTIFY gene family. (C) The conserved motifs were obtained from the MEME website. Fifteen different kinds of conserved motifs were marked with different colors.
3.4. Promoter Cis-Element Analysis
Promoter cis-elements play pivotal roles in the transcriptional regulation of genes when plants are under biotic and abiotic conditions. Phytohormones, including ABA, JA, and SA, apart from their functions during growth and development, play important roles in various signal transduction pathways during responses to environmental stresses [35]. Hence, we decided to identify putative cis-acting regulatory DNA elements in PtrTIFY genes, based on their promoter sequences (2000 bp upstream of the initiation codon). Six different kinds of cis-elements relating to phytohormones and environmental stress signals were identified. Most PtrTIFY genes possessed the AREB cis-elements (cis-acting elements involved in abscisic acid responsiveness). It is worth noting that PtrJAZ8 contained nine AREB cis-elements in different positions of its promoter. PtrJAZ13, PtrZML2, -3, -5, and PtrTIFY2 contained only one AREB cis-element. PtrJAZ4, PtrPPD2, and PtrZML4 lack the AREB cis-element. The remaining PtrTIFY genes contained 2–7 AREB cis-elements. Thirteen PtrTIFY genes contained the CGTCA/TGACG cis-element (cis-acting element involved in MeJA-responsiveness). PtrJAZ1, -6, -7, -10, -12, PtrPPD1, -2, PtrZML1, -2, -4, -7, -8, and PtrTIFY2 contained both CGTCA and TGACG cis-elements in their promotors. Eight PtrJAZ genes, one PtrPPD gene, three PtrZML genes, and one PtrTIFY gene possessed a TCA-element that is involved in SA responsiveness. GAAnnTTC is the typical cis-element of heat shock elements (HSE) [36]. In the PtrTIFY gene family, PtrJAZ1, -2, -3, -8, -10, -13 contained HSE in their promotors, with PtrJAZ10 possessing the largest number of HSEs. PtrPPD2, PtrZML2, 6 as well as PtrTIFY1 and PtrTIFY2 contained 1–3 HSEs (Figure 3). In summary, each PtrTIFY member contained at least one biotic or phytohormone responsive cis-element in its promotor. Detailed promoter cis-element information is listed in Supplementary Table S3.
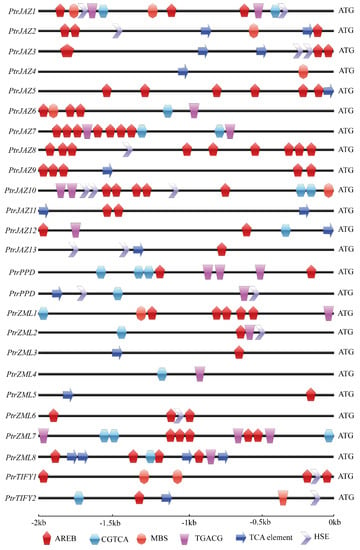
Figure 3.
Abiotic stress and phytohormone response elements in PtrTIFY gene promoters.
3.5. Expression Pattern of PtrTIFY Genes under Drought, Heat, Cold Stress
To understand how PtrTIFY genes take part in drought stress response, we analyzed the expression of PtrTIFY genes in roots under drought at 3, 6, 12, and 24 h using qRT–PCR. Our data showed that all PtrJAZ subfamily members and PtrZML2, 3 as well as PtrZML2 and PtrZML3 were induced in roots by drought stress. It is noteworthy that PtrJAZ10 was significantly upregulated at all time points. PtrPPD1 and PtrPPD2 as well as PtrZML5 and PtrZML8 did not change significantly compared to untreated controls. Finally, PtrZML4, PtrZML7 and PtrTIFY2 were downregulated at all time points (Figure 4).
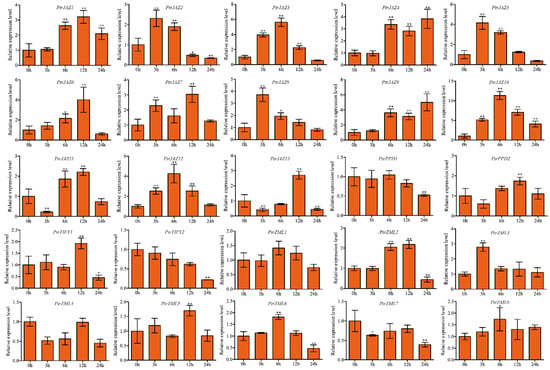
Figure 4.
Expression analysis of PtrTIFY genes in root under drought stress by qRT–PCR. Error bars represent the standard deviations from three biological replicates. Asterisks indicate stress treatment groups that showed a significant difference in transcript abundance compared with the control group (* p < 0.05, ** p < 0.01).
We also analyzed the expression pattern of the PtrTIFY genes in the roots under 42 °C at 0.5, 1, and 3 h. The results showed all PtrJAZ subfamily genes were induced by heat stress except for PtrJAZ2 and PtrJAZ13, which were suppressed at all time points. PtrJAZ4 was upregulated about 17-fold at 1 h. Interestingly, PtrJAZ6 was downregulated at the 0.5 h time point and was rapidly upregulated at 1 and 3 h. PtrJAZ12 responded rapidly to heat stress, with the relative expression level being upregulated 10-fold compared with normal and then gradually declining to 5-fold at 3 h. PtrPPD2 and PtrTIFY1 were upregulated at the 1-h time point. PtrZML3 was highly upregulated at all the time points. Finally, PtrPPD1, PtrZML1, and PtrZML6 showed no change in expression under heat stress at any time point (p > 0.05; Figure 5).
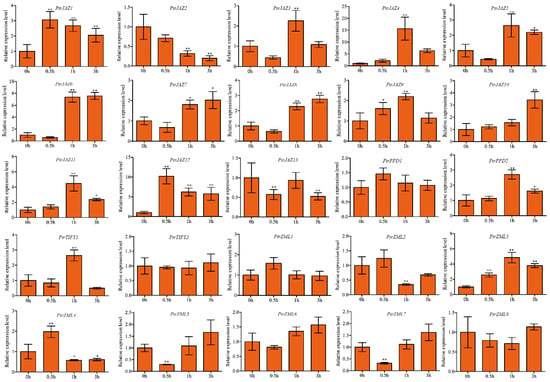
Figure 5.
Expression analysis of PtrTIFY genes in root under heat stress by qRT–PCR. Error bars represent the standard deviations from three biological replicates. Asterisks indicate stress treatment groups that showed a significant difference in transcript abundance compared with the control group (* p < 0.05, ** p < 0.01).
For cold stress, eleven PtrJAZ subfamily members were induced by cold stress in roots. PtrJAZ6 was downregulated at 12 h and PtrJAZ11 was significantly downregulated during the early response period and was elevated back to a level comparable to that of untreated control at 12 and 24 h. PtrJAZ9 and PtrJAZ12 were dramatically upregulated at all time points, PtrJAZ9 and PtrJAZ12 were upregulated about 11-fold at 24 h and 19-fold at 3 h, respectively. One PtrPPD gene and half of the PtrZML subfamily genes were strongly induced by cold stress (Figure 6).
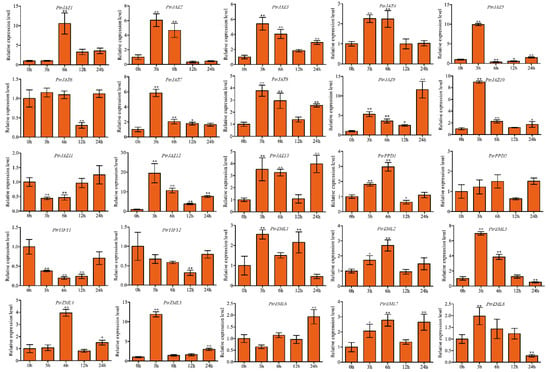
Figure 6.
Expression analysis of PtrTIFY genes in root under low-temperature stress by qRT–PCR. Error bars represent the standard deviations from three biological replicates. Asterisks indicate stress treatment groups that showed a significant difference in transcript abundance compared with the control group (* p < 0.05, ** p < 0.01).
3.6. Expression Pattern of PtrTIFY Genes Under ABA, MeJA, and SA Treatments
We employed qRT–PCR to determine the relative expression levels of all PtrTIFY members under 200 μM ABA treatment in P. trichocarpa roots at 0, 3, 6, 12, and 24 h. Up- or downregulation of the relative expression level >2.0-fold was regarded as significantly differentially expressed. In roots, most PtrJAZ subfamily members were induced by 200 μM ABA treatment. The relative expression levels of PtrJAZ1 and PtrJAZ9 were upregulated about 17-fold at 12 h compared with control. PtrJAZ3 and PtrJAZ6 had similar expression patterns, with the expression level being gradually upregulated at 3 and 6 h and then gradually downregulated at 12 and 24 h. PtrJAZ13 was downregulated at all time points in the root. PtrPPD1 and PtrPPD2 were upregulated by 200 μM ABA treatment at 12 h. PtrTIFY1 was slightly up-regulated at 3 and 12 h, PtrTIFY2 was suppressed by ABA at all time points. PtrZML1, -5, -6, -7 were significantly upregulated by ABA. The remaining five PtrZML subfamily members exhibited opposing expression patterns. The relative expression level of PtrZML2 showed gradual upregulation at 3 and 6 h, then peaked at 12 h before declining (Figure 7).
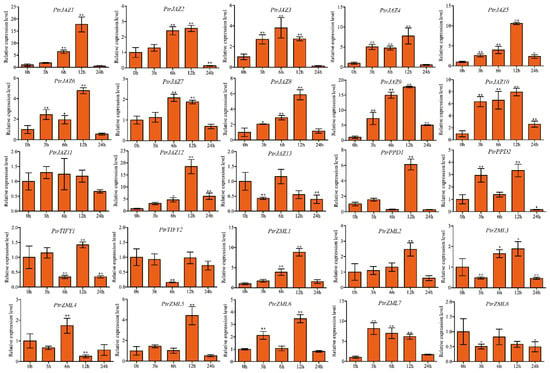
Figure 7.
Expression analysis of PtrTIFY genes in root under 200 μM ABA treatment by qRT–PCR. Error bars represent the standard deviations from three biological replicates. Asterisks indicate stress treatment groups that showed a significant difference in transcript abundance compared with the control group (* p < 0.05, ** p < 0.01).
For MeJA treatment, all but PtrJAZ10 among PtrJAZ subfamily members were strongly induced by 100 μM MeJA in roots. PtrJAZ10 showed no change compared to control. PtrJAZ4, -5, -7, -11, -12, and -13 were significantly upregulated at both 3 and 6 h, indicating these PtrJAZ subfamily genes are early-responding genes for MeJA treatment. PtrPPD1 was suppressed by MeJA at 3, 6, and 24 h, while its homologous gene PtrPPD2 showed no significant change in expression compared to control. PtrTIFY1 and PtrTIFY2 were markedly downregulated at 12 h. Only PtrZML4, -7, and -8 were induced by MeJA treatment. PtrZML5 and PtrZML6 did not respond to MeJA treatment at any time point (Figure 8).
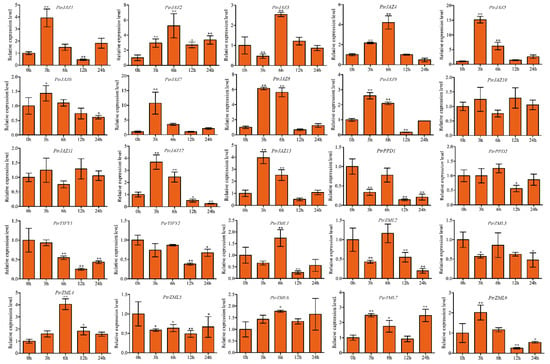
Figure 8.
Expression analysis of PtrTIFY genes in root under 100 μM MeJA treatment by qRT–PCR. Error bars represent the standard deviations from three biological replicates. Asterisks indicate stress treatment groups that showed a significant difference in transcript abundance compared with the control group (* p < 0.05, ** p < 0.01).
For SA treatment, all but PtrJAZ5 were induced by SA treatment in roots. PtrJAZ1 showed gradual upregulation with time, peaked at 12 h (26-fold) then declined. PtrJAZ13 was significantly upregulated at 3 and 6 h, then declined to normal expression level at 12 and 24 h. PtrJAZ1 and PtrJAZ9 were dramatically upregulated at all time points. PtrPPD1 was induced by SA treatment in roots and PtrPPD2 was slightly up-regulated at 3 and 6 h, and repressed at 12 and 24 h. PtrTIFY2 was suppressed by SA. For PtrZMLs, only PtrZML5 was upregulated at the 6-h time point; PtrZML1, -3, -4, -6, -7, and -8 were downregulated compared to the untreated control, while PtrZML2 was slightly increased by the 100-μM SA treatment. PtrZML1 and PtrZML6 were suppressed by MeJA at all the time points (Figure 9).
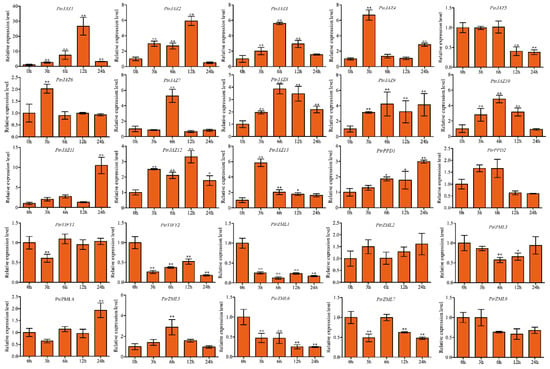
Figure 9.
Expression analysis of PtrTIFY genes in root under 100 μM SA treatment by qRT–PCR. Error bars represent the standard deviations from three biological replicates. Asterisks indicate stress treatment groups that showed a significant difference in transcript abundance compared with the control group (* p < 0.05, ** p < 0.01).
3.7. Analysis of the TIFY Protein Interaction Network in P. trichocarpa
The STRING database was used to investigate the relationship of interaction and association in PtrTIFY proteins with a medium confidence score of 0.40 and the interaction sources “experiments” and “co-expression”. Thirteen putative protein networks were constructed within three kinds of subfamilies (PtrJAZ, PtrZML, and PtrTIFY). This result showed that PtrTIFY proteins could interact with other proteins to respond to phytohormone treatment and environmental stress in P. trichocarpa. Interestingly, the pairs PtrJAZ10 and PtrJAZ11, PtrTIFY1 and PtrTIFY2, and PtrZML5 and PtrZML7 shared similar protein interaction networks, indicating a conserved protein interaction domain may exist in each protein pair (Figure 10).
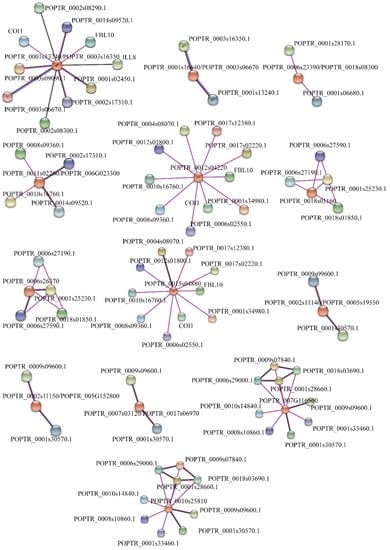
Figure 10.
The predicted protein interaction network of PtrTIFY proteins by STRING database. Different colored lines represent different evidence of interaction.
4. Discussion
TIFY is a plant-specific transcription factor that has been identified in many model plants, such as Arabidopsis, Rice, and Maize [1,3,5]. Previous studies have given a comprehensive analysis of 24 PtrTIFY genes in leaves of P. trichocarpa under various phytohormone treatments and abiotic stresses [19,20]. In this study, we found a new PtrTIFY gene, PtrJAZ13, that belongs to the important JAZ subfamily. Additionally, we examined in roots, for the first time, the expression pattern of the entire PtrTIFY family under ABA, MeJA, and SA treatments plus drought, heat, and cold stresses.
Each of the 25 TIFY genes in the P. trichocarpa genome contains at least one conserved TIFY domain. The length of these sequences varied significantly, implying a high degree of complexity among the TIFY genes. WoLF PSORT analysis helped to predict the location of PtrTIFY proteins. Most PtrTIFY proteins (20/25) were predicted to localize to the nucleus. In addition, PtrZML1, -5, and PtrJAZ6 on one hand, and PtrZML8 and PtrJAZ10 on the other, were localized in cytoplasm and chloroplast, respectively. Interestingly, PtrJAZ6 and PtrJAZ12 were in cytoplasm and nucleus, respectively, although they were placed in the JAZIII clade as homologous genes; it is the same with PtrZML1 and PtrZML3, PtrZML6 and PtrZML8. These results indicate that the same phylogenetic group identified based on sequence similarity does not necessarily correspond to the same subcellular localization [28]. Therefore, homologous genes may show differences in gene function and signal transduction.
In this study, we compare the members of the TIFY genes in Populus, Rice, and Arabidopsis. Our results show that the phylogenetic tree is divided into two groups; Group I contains the GATA zinc-finger, and Group II lacks it. All PtrZML members, together with OsTIFY1a, -1b, -2a, and -2b, AtTIFY1, -2a, and -2b belong to the Group I, which contain not only the TIFY domain but also the GATA zinc-finger and CCT motif. The remainder are in Group II. PtrTIFY and AtTIFY proteins are more closely related than those of rice, indicating that they may have a common ancestor. Interestingly, OsTIFY1a, -1b, -2a, -2b, AtTIFY1, -2a, -2b not only have a TIFY domain but also a GATA zinc-finger and a CCT motif; the remaining members in Rice and Arabidopsis do not have the CCT motif. However, almost all the PtrZML proteins contain the CCT motif, suggesting that woody plants might have undergone many different changes during the evolutionary process [37].
The promoter is a specific DNA region located about 2000 bp upstream of the initiation codon that contains a variety of cis-elements, including AREB, MBS, LTR, HSE, CGTCA, and TGACG. These help plants respond to exogenous phytohormone treatment and environmental stress [38,39]. In our study, PtrTIFY genes possessed at least one stress- or phytohormone-related promoter cis-element, indicating PtrTIFY genes respond to exogenous phytohormone treatments and environmental stresses. It is worth noting that PtrJAZ3, -5 and -8 did not possess the MBS cis-element in their promoter regions, although our qRT–PCR data showed these three genes were strongly induced in the root by drought stress; we can thus speculate that they may interact with other genes to respond to drought stress.
Abiotic stresses, such as drought, cold, and heat, along with important phytohormones, always influence plant growth and development in the life cycle, and may even cause fatal damage [40]. To adapt and survive under adverse environments, woody plants have evolved a number of responses, including reprogramming of gene expression [40]. In this study, PtrJAZ1, -3, -4, -5, -7, -8, -9 -10, -12 showed high expression levels during drought, heat, and cold stresses, indicating that the PtrTIFY family has important functions in responding to these abiotic stresses. PtrJAZ2 and PtrJAZ13 were induced by drought and cold stresses but suppressed by heat stress, whereas PtrJAZ11 was upregulated in drought and heat stresses but downregulated in cold stress. These results suggest that PtrTIFY sets up different physiological and biochemical functions to respond to various environmental challenges. Notably, OsTIFY9, a PtrJAZ1 and PtrJAZ4 orthologous gene, was strongly induced by drought and cold stresses [3], suggesting the homologous genes have similar functions in different species. A previous study has shown the relative expression level of VvJAZ11 was downregulated by cold stress [2], but according to our qRT–PCR data, its homologous genes in P. trichocarpa (PtrJAZ7, -8, -10) are strongly induced by cold stress. This result suggests that their functions might vary in different plant species. Many previous studies had shown that ABA takes part in response to drought stress [41], with multiple drought stress-responsive genes being induced by ABA [42]. In this study, qRT–PCR analysis showed almost all PtrJAZ subfamily members were induced by ABA treatment and by drought stress. In Rice, OsJAZ1 was induced by ABA treatment and drought stress, over-expression of OsJAZ1 lead to a drought-sensitive phonotype under ABA treatment [43]. PtrJAZ6 and its homologous gene PtrJAZ12 were simultaneously induced under ABA treatment and drought stress. PtrJAZ6/12 was the homologous gene of OsJAZ1; this result suggests that PtrJAZ6/12 may negatively function in drought stress under ABA treatment in P. trichocarpa. Salicylic acid (SA) is a key molecule in the signal transduction pathway of abiotic responses [44,45]. In this work, qRT–PCR shows that most PtrJAZ subfamily members are induced by SA and by heat stress. PtrJAZ1, as well as PtrJAZ4, were remarkably upregulated at all time points both by SA treatment and heat stress. A previous study showed that SA functions as a plant growth regulator and alleviates the effects on photosynthesis under heat stress [46]. When plants suffer from heat stress, SA could help to increase proline production through the increase in γ-glutamyl kinase and decrease in proline oxidase activity to help protect photosynthesis from heat stress [47]. PtrJAZ subfamily genes may play important roles in the cross-talk between SA and heat stress.
JA is also involved in a wide range of plant growth and developmental processes, including root development [48]. Previous research had shown that JA could regulate lateral root formation in Arabidopsis and petunia cuttings [49,50]. Furthermore, PtrJAZ5 was dramatically upregulated at early response time points (3 and 6 h) under MeJA treatment. GaJAZ5 was the homologous gene of PtrJAZ5 in Gossypium arboretum; previous research had shown that when GaJAZ5-overexpression lines were treated with exogenous MeJA, the lateral root and root hair were higher in number compared to untreated transgenic lines in cotton [51]. OsJAZ1 could regulate root development by interacting with OsMYC2 through JA signaling in Rice [52]. In this research, besides PtrJAZ5, PtrJAZ7, -8, -9, -11, -12, -13 were also dramatically upregulated at early response time points (3 and 6 h); moreover, PtrJAZ2 was significantly upregulated at all time points under MeJA treatment. These results suggest the PtrJAZ subfamily members may take part in root growth and development through the JA signaling pathway.
We constructed the protein interaction network to investigate their interactions and associations in P. trichocarpa using the STRING database. The results showed that ten PtrJAZ (PtrJAZ1/4, PtrJAZ2/3, PtrJAZ6/12, PtrJAZ9/13, PtrJAZ10, and PtrJAZ11), two PtrTIFY (PtrTIFY1 and PtrTIFY2), and eight PtrZML (PtrZML1/3, PtrZML2/4, PtrZML5, PtrZML6/8, and PtrZML7) subfamily members were predicted to interact with other proteins. Two members of the PtrPPD subfamily could not interact with any other proteins; nevertheless, PtrPPD1 was induced by ABA, SA, and cold stress, and PtrPPD2 was upregulated by ABA at 12 h and heat stress at 1 h, indicating that the two PtrPPD subfamily members may function by regulating their target genes to respond to abiotic stress and phytohormone treatment. Increasing evidence supports the idea that Arabidopsis COI 1 (CORONATINE IN SENSITIVE 1), NINJA CNOVEL IN TEACTIOR OF JAZ and two bHLH protein family members (MYC2/MYC3) play important roles in JA signaling and function in the JA pathway, such as root growth inhibition, wound response, and abiotic stress response [10,53,54]. POPTR_0003s09090 is a homologous gene of AtMYC2; moreover, PtrJAZ1/4 shared a high degree of homology with AtTIFY9, which had been reported to interact with AtMYC2 to restrain the activity of transcription factor and then promote the expression of JA-relative genes [55]. Meanwhile, according to our expression pattern, PtrJAZ1/4 was induced by ABA treatment and drought, heat stresses, so we speculate that PtrJAZ1/4 may interact with PtrMYC2 in response to phytohormone treatment and abiotic stress by taking part in JA signaling. PtrJAZ1/4, PtrJAZ10, and PtrJAZ11 shared similar protein interaction networks with PtrZML5 and PtrZML7, PtrJAZ2/3 and PtrZJAZ6/12, PtrTIFY1 and PtrTIFY2, PtrZML2/4 and PtrZML6/8, as well as PtrZML5 and PtrZML7. This phenomenon indicates that a conserved protein interaction domain may exist in these proteins that share the same network.
5. Conclusions
In summary, we identified 25 PtrTIFY genes in the P. trichocarpa genome and performed comprehensive bioinformatics analyses, including phylogenetic analysis, conserved motif analysis, and promoter cis-elements analysis. Importantly, a new TIFY member (PtrJAZ13) was found. Then, for the first time, we analyzed the expression pattern of PtrTIFY genes in roots under ABA, MeJA, and SA treatments plus drought, heat, and cold stresses. Almost all the PtrTIFY genes responded to at least one abiotic stress and phytohormone treatment in the root of P. trichocarpa. These results indicate that the PtrTIFY genes may play important roles in response to phytohormone treatment and abiotic stress. Our study will help to determine which genes deserve further functional characterization.
Supplementary Materials
The following are available online at https://www.mdpi.com/1999-4907/11/3/315/s1. Table S1: Primer pairs for real-time quantitative PCR. Table S2: Motif sequences of PtrTIFY genes. Table S3: Phytohormone- and abiotic stress-related cis-elements.
Author Contributions
Conceptualization, H.W., and C.L.; experiment design, C.L.; data curation, W.H., L.X., X.X., and C.L.; contribution of materials/analysis tools, H.W., X.L., X.X., and C.L.; writing—original draft, H.W., and X.L.; writing—review and editing, C.L. All authors have read and agreed to the published version of the manuscript.
Funding
This work was supported by the Fundamental Research Funds for the Central Universities of China (Grant No. 2572016AA01), the 111 Project (Grant No. B16010) and the National Natural Science Foundation of China (Grant No. 31670668).
Acknowledgments
We would like to thank TopEdit (www.topeditsci.com) for its linguistic assistance during the preparation of this manuscript.
Conflicts of Interest
The authors declare no conflict of interest.
References
- Vanholme, B.; Grunewald, W.; Bateman, A.; Kohchi, T.; Gheysen, G. The tify family previously known as ZIM. Trends Plant Sci. 2007, 12, 239–244. [Google Scholar] [CrossRef]
- Zhang, Y.C.; Gao, M.; Singer, S.D.; Fei, Z.J.; Wang, H.; Wang, X.P. Genome-wide identification and analysis of the TIFY gene family in grape. PLoS ONE 2012, 7, e0044465. [Google Scholar] [CrossRef] [PubMed]
- Ye, H.Y.; Du, H.; Tang, N.; Li, X.H.; Xiong, L.Z. Identification and expression profiling analysis of TIFY family genes involved in stress and phytohormone responses in rice. Plant Mol. Biol. 2009, 71, 291–305. [Google Scholar] [CrossRef]
- Bai, Y.H.; Meng, Y.J.; Huang, D.L.; Qi, Y.H.; Chen, M. Origin and evolutionary analysis of the plant-specific TIFY transcription factor family. Genomics 2011, 98, 128–136. [Google Scholar] [CrossRef]
- Zhang, Z.B.; Li, X.L.; Yu, R.; Han, M.; Wu, Z.Y. Isolation, structural analysis, and expression characteristics of the maize TIFY gene family. Mol Genet Genomics 2015, 290, 1849–1858. [Google Scholar] [CrossRef]
- Katsir, L.; Chung, H.S.; Koo, A.J.K.; Howe, G.A. Jasmonate signaling: A conserved mechanism of hormone sensing. Curr. Opin Plant Biol. 2008, 11, 428–435. [Google Scholar] [CrossRef] [PubMed]
- Chini, A.; Fonseca, S.; Chico, J.M.; Fernandez-Calvo, P.; Solano, R. The ZIM domain mediates homo- and heteromeric interactions between Arabidopsis JAZ proteins. Plant J. 2009, 59, 77–87. [Google Scholar] [CrossRef]
- Thines, B.; Katsir, L.; Melotto, M.; Niu, Y.; Mandaokar, A.; Liu, G.H.; Nomura, K.; He, S.Y.; Howe, G.A.; Browse, J. JAZ repressor proteins are targets of the SCFCO11 complex during jasmonate signalling. Nature 2007, 448, 661–662. [Google Scholar] [CrossRef]
- Xie, D.X.; Feys, B.F.; James, S.; Nieto-Rostro, M.; Turner, J.G. COI1: An Arabidopsis gene required for jasmonate-regulated defense and fertility. Science 1998, 280, 1091–1094. [Google Scholar] [CrossRef] [PubMed]
- Melotto, M.; Mecey, C.; Niu, Y.; Chung, H.S.; Katsir, L.; Yao, J.; Zeng, W.Q.; Thines, B.; Staswick, P.; Browse, J.; et al. A critical role of two positively charged amino acids in the Jas motif of Arabidopsis JAZ proteins in mediating coronatine- and jasmonoyl isoleucine-dependent interactions with the COI1F-box protein. Plant J. 2008, 55, 979–988. [Google Scholar] [CrossRef] [PubMed]
- Guo, H.W.; Ecker, J.R. The ethylene signaling pathway: New insights. Curr. Opin. Plant Biol. 2004, 7, 40–49. [Google Scholar] [CrossRef] [PubMed]
- Ju, L.; Jing, Y.X.; Shi, P.T.; Liu, J.; Chen, J.S.; Yan, J.J.; Chu, J.F.; Chen, K.M.; Sun, J.Q. JAZ proteins modulate seed germination through interaction with ABI5 in bread wheat and Arabidopsis. New Phytol. 2019, 223, 246–260. [Google Scholar] [CrossRef] [PubMed]
- Liu, S.H.; Zhang, P.Y.; Li, C.C.; Xia, G.M. The moss jasmonate ZIM-domain protein PnJAZ1 confers salinity tolerance via crosstalk with the abscisic acid signalling pathway. Plant Sci. 2019, 280, 1–11. [Google Scholar] [CrossRef] [PubMed]
- Wang, L.; Chen, R.M. A maize jasmonate Zim-domain protein, ZmJAZ14, associates with the JA, ABA, and GA signaling pathways in transgenic Arabidopsis. PLoS ONE 2015, 10, e0128957. [Google Scholar] [CrossRef]
- Li, Y.X.; Xu, M.; Wang, N.; Li, Y.G. A JAZ protein in Astragalus sinicus interacts with a leghemoglobin through the TIFY domain and is involved in nodule development and nitrogen fixation. PLoS ONE 2015, 10, e0139964. [Google Scholar] [CrossRef] [PubMed]
- White, D.W.R. PEAPOD regulates lamina size and curvature in Arabidopsis. Proc. Natl. Acad. Sci. USA 2006, 103, 13238–13243. [Google Scholar] [CrossRef] [PubMed]
- Zhu, Y.; Luo, X.; Liu, X.; Wu, W.; Cui, X.; He, Y.; Huang, J. Arabidopsis PEAPODs function with LIKE HETEROCHROMATIN PROTEIN1 to regulate lateral organ growth. J. Integr. Plant Biol. 2019. [Google Scholar] [CrossRef]
- Yin, T.; DiFazio, S.P.; Gunter, L.E.; Zhang, X.; Sewell, M.M.; Woolbright, S.A.; Allan, G.J.; Kelleher, C.T.; Douglas, C.J.; Wang, M.; et al. Genome structure and emerging evidence of an incipient sex chromosome in Populus. Genome Res. 2008, 18, 422–430. [Google Scholar] [CrossRef]
- Xia, W.X.; Yu, H.Y.; Cao, P.; Luo, J.; Wang, N. Identification of TIFY family genes and analysis of their expression profiles in response to phytohormone treatments and melampsora larici-populina infection in poplar. Front Plant Sci. 2017, 8, 493. [Google Scholar] [CrossRef]
- Wang, Y.; Pan, F.; Chen, D.M.; Chu, W.Y.; Liu, H.L.; Xiang, Y. Genome-wide identification and analysis of the Populus trichocarpa TIFY gene family. Plant Physiol. Biochem. 2017, 115, 360–371. [Google Scholar] [CrossRef]
- Finn, R.D.; Mistry, J.; Schuster-Bockler, B.; Griffiths-Jones, S.; Hollich, V.; Lassmann, T.; Moxon, S.; Marshall, M.; Khanna, A.; Durbin, R.; et al. Pfam: Clans, web tools and services. Nucleic Acids Res. 2006, 34, D247–D251. [Google Scholar] [CrossRef] [PubMed]
- Wilkins, M.R.; Gasteiger, E.; Bairoch, A.; Sanchez, J.C.; Williams, K.L.; Appel, R.D.; Hochstrasser, D.F. Protein identification and analysis tools in the ExPASy server. Methods Mol. Biol. 1999, 112, 531–552. [Google Scholar] [CrossRef] [PubMed]
- Thompson, J.D.; Gibson, T.J.; Plewniak, F.; Jeanmougin, F.; Higgins, D.G. The CLUSTAL_X windows interface: Flexible strategies for multiple sequence alignment aided by quality analysis tools. Nucleic Acids Res 1997, 25, 4876–4882. [Google Scholar] [CrossRef] [PubMed]
- Hall, T.A. BioEdit: A user-friendly biological sequence alignment editor and analysis program for Windows 95/98/NT. Nucleic Acids Symposium Series 1999, 41, 95–98. [Google Scholar]
- Kumar, S.; Stecher, G.; Tamura, K. MEGA7: Molecular evolutionary genetics analysis version 7.0 for bigger datasets. Mol. Biol. Evol. 2016, 33, 1870–1874. [Google Scholar] [CrossRef]
- Hu, B.; Jin, J.P.; Guo, A.Y.; Zhang, H.; Luo, J.C.; Gao, G. GSDS 2.0: An upgraded gene feature visualization server. Bioinformatics 2015, 31, 1296–1297. [Google Scholar] [CrossRef]
- Bailey, T.L.; Boden, M.; Buske, F.A.; Frith, M.; Grant, C.E.; Clementi, L.; Ren, J.Y.; Li, W.W.; Noble, W.S. MEME SUITE: Tools for motif discovery and searching. Nucleic Acids Res. 2009, 37, W202–W208. [Google Scholar] [CrossRef]
- Liu, Q.G.; Wang, Z.C.; Xu, X.M.; Zhang, H.Z.; Li, C.H. Genome-Wide Analysis of C2H2 Zinc-Finger Family Transcription Factors and Their Responses to Abiotic Stresses in Poplar (Populus trichocarpa). PLoS ONE 2015, 10, e0134753. [Google Scholar] [CrossRef]
- Lescot, M.; Dehais, P.; Thijs, G.; Marchal, K.; Moreau, Y.; Van de Peer, Y.; Rouze, P.; Rombauts, S. PlantCARE, a database of plant cis-acting regulatory elements and a portal to tools for in silico analysis of promoter sequences. Nucleic Acids Res. 2002, 30, 325–327. [Google Scholar] [CrossRef]
- Jaakola, L.; Pirttila, A.M.; Halonen, M.; Hohtola, A. Isolation of high quality RNA from bilberry (Vaccinium myrtillus L.) fruit. Mol. Biotechnol. 2001, 19, 201–203. [Google Scholar] [CrossRef]
- Zhang, X.; Wollenweber, B.; Jiang, D.; Liu, F.; Zhao, J. Water deficits and heat shock effects on photosynthesis of a transgenic Arabidopsis thaliana constitutively expressing ABP9, a bZIP transcription factor. J. Exp. Bot. 2008, 59, 839–848. [Google Scholar] [CrossRef]
- Szklarczyk, D.; Gable, A.L.; Lyon, D.; Junge, A.; Wyder, S.; Huerta-Cepas, J.; Simonovic, M.; Doncheva, N.T.; Morris, J.H.; Bork, P.; et al. STRING v11: Protein-protein association networks with increased coverage, supporting functional discovery in genome-wide experimental datasets. Nucleic Acids Res. 2019, 47, D607–D613. [Google Scholar] [CrossRef]
- Otasek, D.; Morris, J.H.; Boucas, J.; Pico, A.R.; Demchak, B. Cytoscape Automation: Empowering workflow-based network analysis. Genome Biol. 2019, 20, 185. [Google Scholar] [CrossRef]
- Yang, Y.X.; Ahammed, G.J.; Wan, C.P.; Liu, H.J.; Chen, R.R.; Zhou, Y. Comprehensive analysis of TIFY transcription factors and their expression profiles under Jasmonic acid and abiotic stresses in Watermelon. Int. J. Genom. 2019, 13, 6813068. [Google Scholar] [CrossRef]
- Wang, L.; Su, H.Y.; Han, L.Y.; Wang, C.Q.; Sun, Y.L.; Liu, F.H. Differential expression profiles of poplar MAP kinase kinases in response to abiotic stresses and plant hormones, and overexpression of PtMKK4 improves the drought tolerance of poplar. Gene 2014, 545, 141–148. [Google Scholar] [CrossRef]
- Sung, D.Y.; Kaplan, F.; Lee, K.J.; Guy, C.L. Acquired tolerance to temperature extremes. Trends Plant Sci. 2003, 8, 179–187. [Google Scholar] [CrossRef]
- Wang, Z.C.; Liu, Q.Q.; Wang, H.Z.; Zhang, H.Z.; Xu, X.M.; Li, C.H.; Yang, C.P. Comprehensive analysis of trihelix genes and their expression under biotic and abiotic stresses in Populus trichocarpa. Sci. Rep-Uk 2016, 6. [Google Scholar] [CrossRef]
- Wang, L.W.; He, M.W.; Guo, S.R.; Zhong, M.; Shu, S.; Sun, J. NaCl stress induces CsSAMs gene expression in Cucumis sativus by mediating the binding of CsGT-3b to the GT-1 element within the CsSAMs promoter. Planta 2017, 245, 889–908. [Google Scholar] [CrossRef]
- Fujita, M.; Fujita, Y.; Noutoshi, Y.; Takahashi, F.; Narusaka, Y.; Yamaguchi-Shinozaki, K.; Shinozaki, K. Crosstalk between abiotic and biotic stress responses: A current view from the points of convergence in the stress signaling networks. Curr. Opin. Plant Biol. 2006, 9, 436–442. [Google Scholar] [CrossRef]
- Debnath, M.; Pandey, M.; Bisen, P.S. An omics approach to understand the plant abiotic stress. Omics 2011, 15, 739–762. [Google Scholar] [CrossRef]
- Fujita, Y.; Fujita, M.; Satoh, R.; Maruyama, K.; Parvez, M.M.; Seki, M.; Hiratsu, K.; Ohme-Takagi, M.; Shinozaki, K.; Yamaguchi-Shinozaki, K. AREB1 is a transcription activator of novel ABRE-dependent ABA signaling that enhances drought stress tolerance in Arabidopsis. Plant Cell 2005, 17, 3470–3488. [Google Scholar] [CrossRef]
- Yamaguchi-Shinozaki, K.; Shinozaki, K. Transcriptional regulatory networks in cellular responses and tolerance to dehydration and cold stresses. Annu. Rev. Plant. Biol. 2006, 57, 781–803. [Google Scholar] [CrossRef]
- Seo, J.S.; Joo, J.; Kim, M.J.; Kim, Y.K.; Nahm, B.H.; Song, S.I.; Cheong, J.J.; Lee, J.S.; Kim, J.K.; Do Choi, Y. OsbHLH148, a basic helix-loop-helix protein, interacts with OsJAZ proteins in a jasmonate signaling pathway leading to drought tolerance in rice. Plant J. 2011, 65, 907–921. [Google Scholar] [CrossRef]
- Maiti, S.; Patro, S.; Pal, A.; Dey, N. Identification of a novel salicylic acid inducible endogenous plant promoter regulating expression of CYR1, a CC-NB-LRR type candidate disease resistance gene in Vigna mungo. Plant Cell Tiss Org. Cult. 2015, 120, 489–505. [Google Scholar] [CrossRef]
- Horvath, E.; Szalai, G.; Janda, T. Induction of abiotic stress tolerance by salicylic acid signaling. J. Plant Growth Regul. 2007, 26, 290–300. [Google Scholar] [CrossRef]
- Nazar, R.; Iqbal, N.; Syeed, S.; Khan, N.A. Salicylic acid alleviates decreases in photosynthesis under salt stress by enhancing nitrogen and sulfur assimilation and antioxidant metabolism differentially in two mungbean cultivars. J. Plant Physiol. 2011, 168, 807–815. [Google Scholar] [CrossRef]
- Khan, M.I.; Iqbal, N.; Masood, A.; Per, T.S.; Khan, N.A. Salicylic acid alleviates adverse effects of heat stress on photosynthesis through changes in proline production and ethylene formation. Plant Signal Behav. 2013, 8, e26374. [Google Scholar] [CrossRef]
- Huang, H.; Liu, B.; Liu, L.Y.; Song, S.S. Jasmonate action in plant growth and development. J. Exp. Bot. 2017, 68, 1349–1359. [Google Scholar] [CrossRef]
- Cai, X.T.; Xu, P.; Zhao, P.X.; Liu, R.; Yu, L.H.; Xiang, C.B. Arabidopsis ERF109 mediates cross-talk between jasmonic acid and auxin biosynthesis during lateral root formation. Nat. Commun. 2014, 5, 5833. [Google Scholar] [CrossRef]
- Lischweski, S.; Muchow, A.; Guthorl, D.; Hause, B. Jasmonates act positively in adventitious root formation in petunia cuttings. BMC Plant Biol. 2015, 15, 229. [Google Scholar] [CrossRef]
- Zhao, G.; Song, Y.; Wang, C.X.; Butt, H.I.; Wang, Q.H.; Zhang, C.J.; Yang, Z.R.; Liu, Z.; Chen, E.Y.; Zhang, X.Y.; et al. Genome-wide identification and functional analysis of the TIFY gene family in response to drought in cotton. Mol. Genet. Genomics 2016, 291, 2173–2187. [Google Scholar] [CrossRef] [PubMed]
- Cai, Q.; Yuan, Z.; Chen, M.J.; Yin, C.S.; Luo, Z.J.; Zhao, X.X.; Liang, W.Q.; Hu, J.P.; Zhang, D.B. Jasmonic acid regulates spikelet development in rice. Nat. Commun. 2014, 5, 3476. [Google Scholar] [CrossRef]
- Breeze, E. Master MYCs: MYC2, the jasmonate signaling “master switch”. Plant Cell 2019, 31, 9–10. [Google Scholar] [CrossRef] [PubMed]
- Acosta, I.F.; Gasperini, D.; Chetelat, A.; Stolz, S.; Santuari, L.; Farmer, E.E. Role of NINJA in root jasmonate signaling. Proc. Natl. Acad. Sci. USA 2013, 110, 15473–15478. [Google Scholar] [CrossRef]
- Chung, H.S.; Howe, G.A. A critical role for the TIFY motif in repression of jasmonate signaling by a stabilized splice variant of the JASMONATE ZIM-domain protein JAZ10 in Arabidopsis. Plant Cell 2009, 21, 131–145. [Google Scholar] [CrossRef]
© 2020 by the authors. Licensee MDPI, Basel, Switzerland. This article is an open access article distributed under the terms and conditions of the Creative Commons Attribution (CC BY) license (http://creativecommons.org/licenses/by/4.0/).