Article

Site Index Models for Main Forest-Forming Tree Species in Poland

by
Jarosław Socha
1,*,
Luiza Tymińska-Czabańska
1,
Ewa Grabska
1,2 and
Stanisław Orzeł
1
1
Department of Forest Resources Management, Faculty of Forestry, University of Agriculture in Krakow, Al. 29 Listopada 46, 31-425 Krakow, Poland
2
Institute of Geography & Spatial Management, Faculty of Geography & Geology, Jagiellonian University in Kraków, Gronostajowa 7, 30-387 Kraków, Poland
*
Author to whom correspondence should be addressed.
Forests 2020, 11(3), 301; https://doi.org/10.3390/f11030301
Submission received: 4 February 2020 / Revised: 2 March 2020 / Accepted: 5 March 2020 / Published: 8 March 2020
(This article belongs to the Section Forest Ecology and Management)

Abstract

:
Site index is the most commonly used measure of potential site productivity, providing key information for forest management practices. It is determined using species-specific site index models that take into account climatic and edaphic factors. To reliably estimate the site index, appropriate models are necessary. In Poland, however, outdated guidelines, i.e., yield tables, are used to determine site classes, which result in the inappropriate estimation of height growth and increments of stands. Therefore, the aim of this study is to develop new site index models for the main forest forming tree species in Poland, in a total of eight species. For the development of site index models, we used growth trajectories of 3052 sample trees, representing the whole range of geographic locations and site conditions. Five dynamic models were selected and parametrized to develop the site index models. The models were evaluated using quantitative measures of goodness of fit (MAE, R2, and AIC), the analysis of residuals, and the assessment of how the model reflects the biological phenomena of height growth. Results showed that depending on the species, different models have the highest predictive ability. There are significant differences in results using traditional yield tables and developed site index models. For most of the species, the largest differences characterized either the youngest or the oldest age classes. These differences can be attributed to the changes in growth conditions from the time when yield tables were developed. Growth dynamics of forest stands may also show spatial variability, thus, in future research additional site variables and, regional variability should be taken into account.

1. Introduction

Information concerning site productivity remains a fundamental variable in forestry [1,2,3,4]. The unbiased estimation of site potential is essential for forest management because it is the main determinant of species-specific decisions, connected with the selection of silvicultural treatments, species composition, and the determination of the allowable cut and rotation periods [3,5,6]. Site productivity is one area of strategic information in forest management, which determines the economic and environmental effects of forest management [6,7] and allows the forecasting of stand growth [2]. The most frequently used and commonly accepted measure of potential site productivity is the site index, determined using species-specific site index models based on the height of the stand at a certain age [1,8,9,10]. Site index models are the main functions used in the empirical models of tree stand growth [11,12,13].
In recent years, forest ecosystems in Europe have experienced changes due to both the mean climate variables and the higher risk of extreme weather events [14]. Therefore, for effective long-term planning, forest management has to take into account the impact of climate change on stand growth and site productivity. In general, recent climate changes seem to have had a positive impact on forest productivity, although, this may vary at regional scales [15]. In northern and western Europe, a positive effect on forest growth and wood production is expected [14]. The site index considers the impact of climate conditions, expressing how the climatic and edaphic factors influence site productivity. Therefore, it is frequently used to analyze how environmental changes affect forest ecosystems [16,17,18,19,20]. Climate-sensitive site productivity models provide key information to develop forest management guidelines for adaptation steps and apply mitigation strategies against changing climatic conditions [21]. Site index models also play a crucial role in estimating the dynamics of forest carbon pools. According to the good practice guidance (GPG) of the Intergovernmental Panel on Climate Change (IPCC), the past and future dynamics of forest carbon pools should be calculated using stand volume. Stand volume is most commonly estimated using empirical models, such as EFISCEN [22,23] and CBM-CFS3 [24], which both employ National Forest Inventory data. In calculating both of them, site index models play a crucial role [25].
Appropriate site index models adjusted to local site conditions are necessary for the reliable estimation of the site index. In forestry practice in Poland, a site class is still determined using height growth curves, developed by Schwappach [26] for Scots pine, Norway spruce, European beech, silver fir, and sessile oak, and by Schober [27] for European larch and by Turin [28] for silver birch and black alder. Due to the frequent occurrence of pine stands exceeding the height of Schwappach’s first class, Szymkiewicz [28] extrapolated tables for class Ia, however, simple graphical extrapolation raises large doubts in this case [29]. Moreover, Schwappach’s tables use the mean Lorey’s height to measure the site index. Influenced by the intensity of silvicultural treatment, Lorey’s height does not represent site productivity well [30]. Another reason for the inadequacy of Schwappach’s tables is because of the significant changes in growth conditions, which have greatly changed during the 100-year period since the development of the tables. Research carried out in Central Europe indicates that these changes have strongly influenced the dynamics of stand growth [19,31,32,33]. Pretzsch [31] estimated that site productivity increased by about 30%–70%. Most visible changes occur in stands of older age classes. Therefore, height growth and the increments of stands observed currently significantly differ from those included in the original tables, which were observed 100 years ago [34]. Therefore, the use of yield tables can result in the inappropriate estimation of site productivity and stand volume increment estimation. This was an inspiration for Bruchwald et al. to develop new Polish site index models for Scots pine [35,36], Norway spruce [37], black alder [38], and European larch [39]. When developing these models, however, the authors used a function describing a single growth trajectory, which is next extrapolated for different sites [29]. Thus, these models do not appropriately differentiate the height growth rate between different sites in terms of the dependence on stand age. Consequently, for example, for stands of younger age classes, the models can produce unrealistically high site index values [40,41].
For the development of site index models, either dynamic (invariant of a base age) or static (dependent on the base age) equations have been used [42]. The former approach assumes a certain base age, violating the assumptions of regression models, e.g., those of [43,44]. In addition, the choice of a base age strongly affects the final model [45]. This problem was already noticed by Bailey and Clutter [46], who proposed a base-age invariant method of deriving site index models, called the algebraic difference approach (ADA). However, a selection of a parameter of the equation used as the site parameter resulted in site index curves that were anamorphic or polymorphic with single asymptotes. Cieszewski and Bailey [47] solved this problem by developing the generalized algebraic difference approach (GADA), which allows one to use more than one site parameter. Therefore, such models are characterized by both polymorphism and variable asymptotes for different sites [42,48]. The GADA has proven to be an adequate method for side index modeling worldwide [29,42,48,49,50,51,52,53,54,55,56]. GADA allow for the development of local site-specific site index models, which properly describe local height growth trajectories and enable the reliable assessment of site productivity.
Site index models constitute an important decision-making tool in forest management. As a result of the inadequacy of existing yield tables, there is a high demand from the State Forests and Forest Management Bureau in Poland to develop new site index and growth models for the main forest-forming tree species. In response to this demand, in the years of 2015–2018, the research project titled “actual and potential productivity of the main forest-forming tree species in Poland,” was implemented, financed by State Forests in Poland. As part of the project, a grid of over 600 permanent research plots was established, a representative for the main forest-forming tree species growing in Polish forests. Trees for stem analysis were located close to the research plots, allowing for retrospective growth reconstruction when felled. In addition, in the frame of the project, over 2400 growth trajectories were gathered from different research projects implemented in Poland in recent years. The collected database constitutes the empirical material used in the presented research. The aim of this research is to develop new dynamic site index models for the main forest-forming tree species in Poland.

2. Materials and Methods

The methodology used in this study involved the following steps: (i) the collection of the research material on trees from the projects, (ii) stem analysis, (iii) the selection of models of height growth, (iv) the estimation of models parameters, and (v) evaluation of the models.

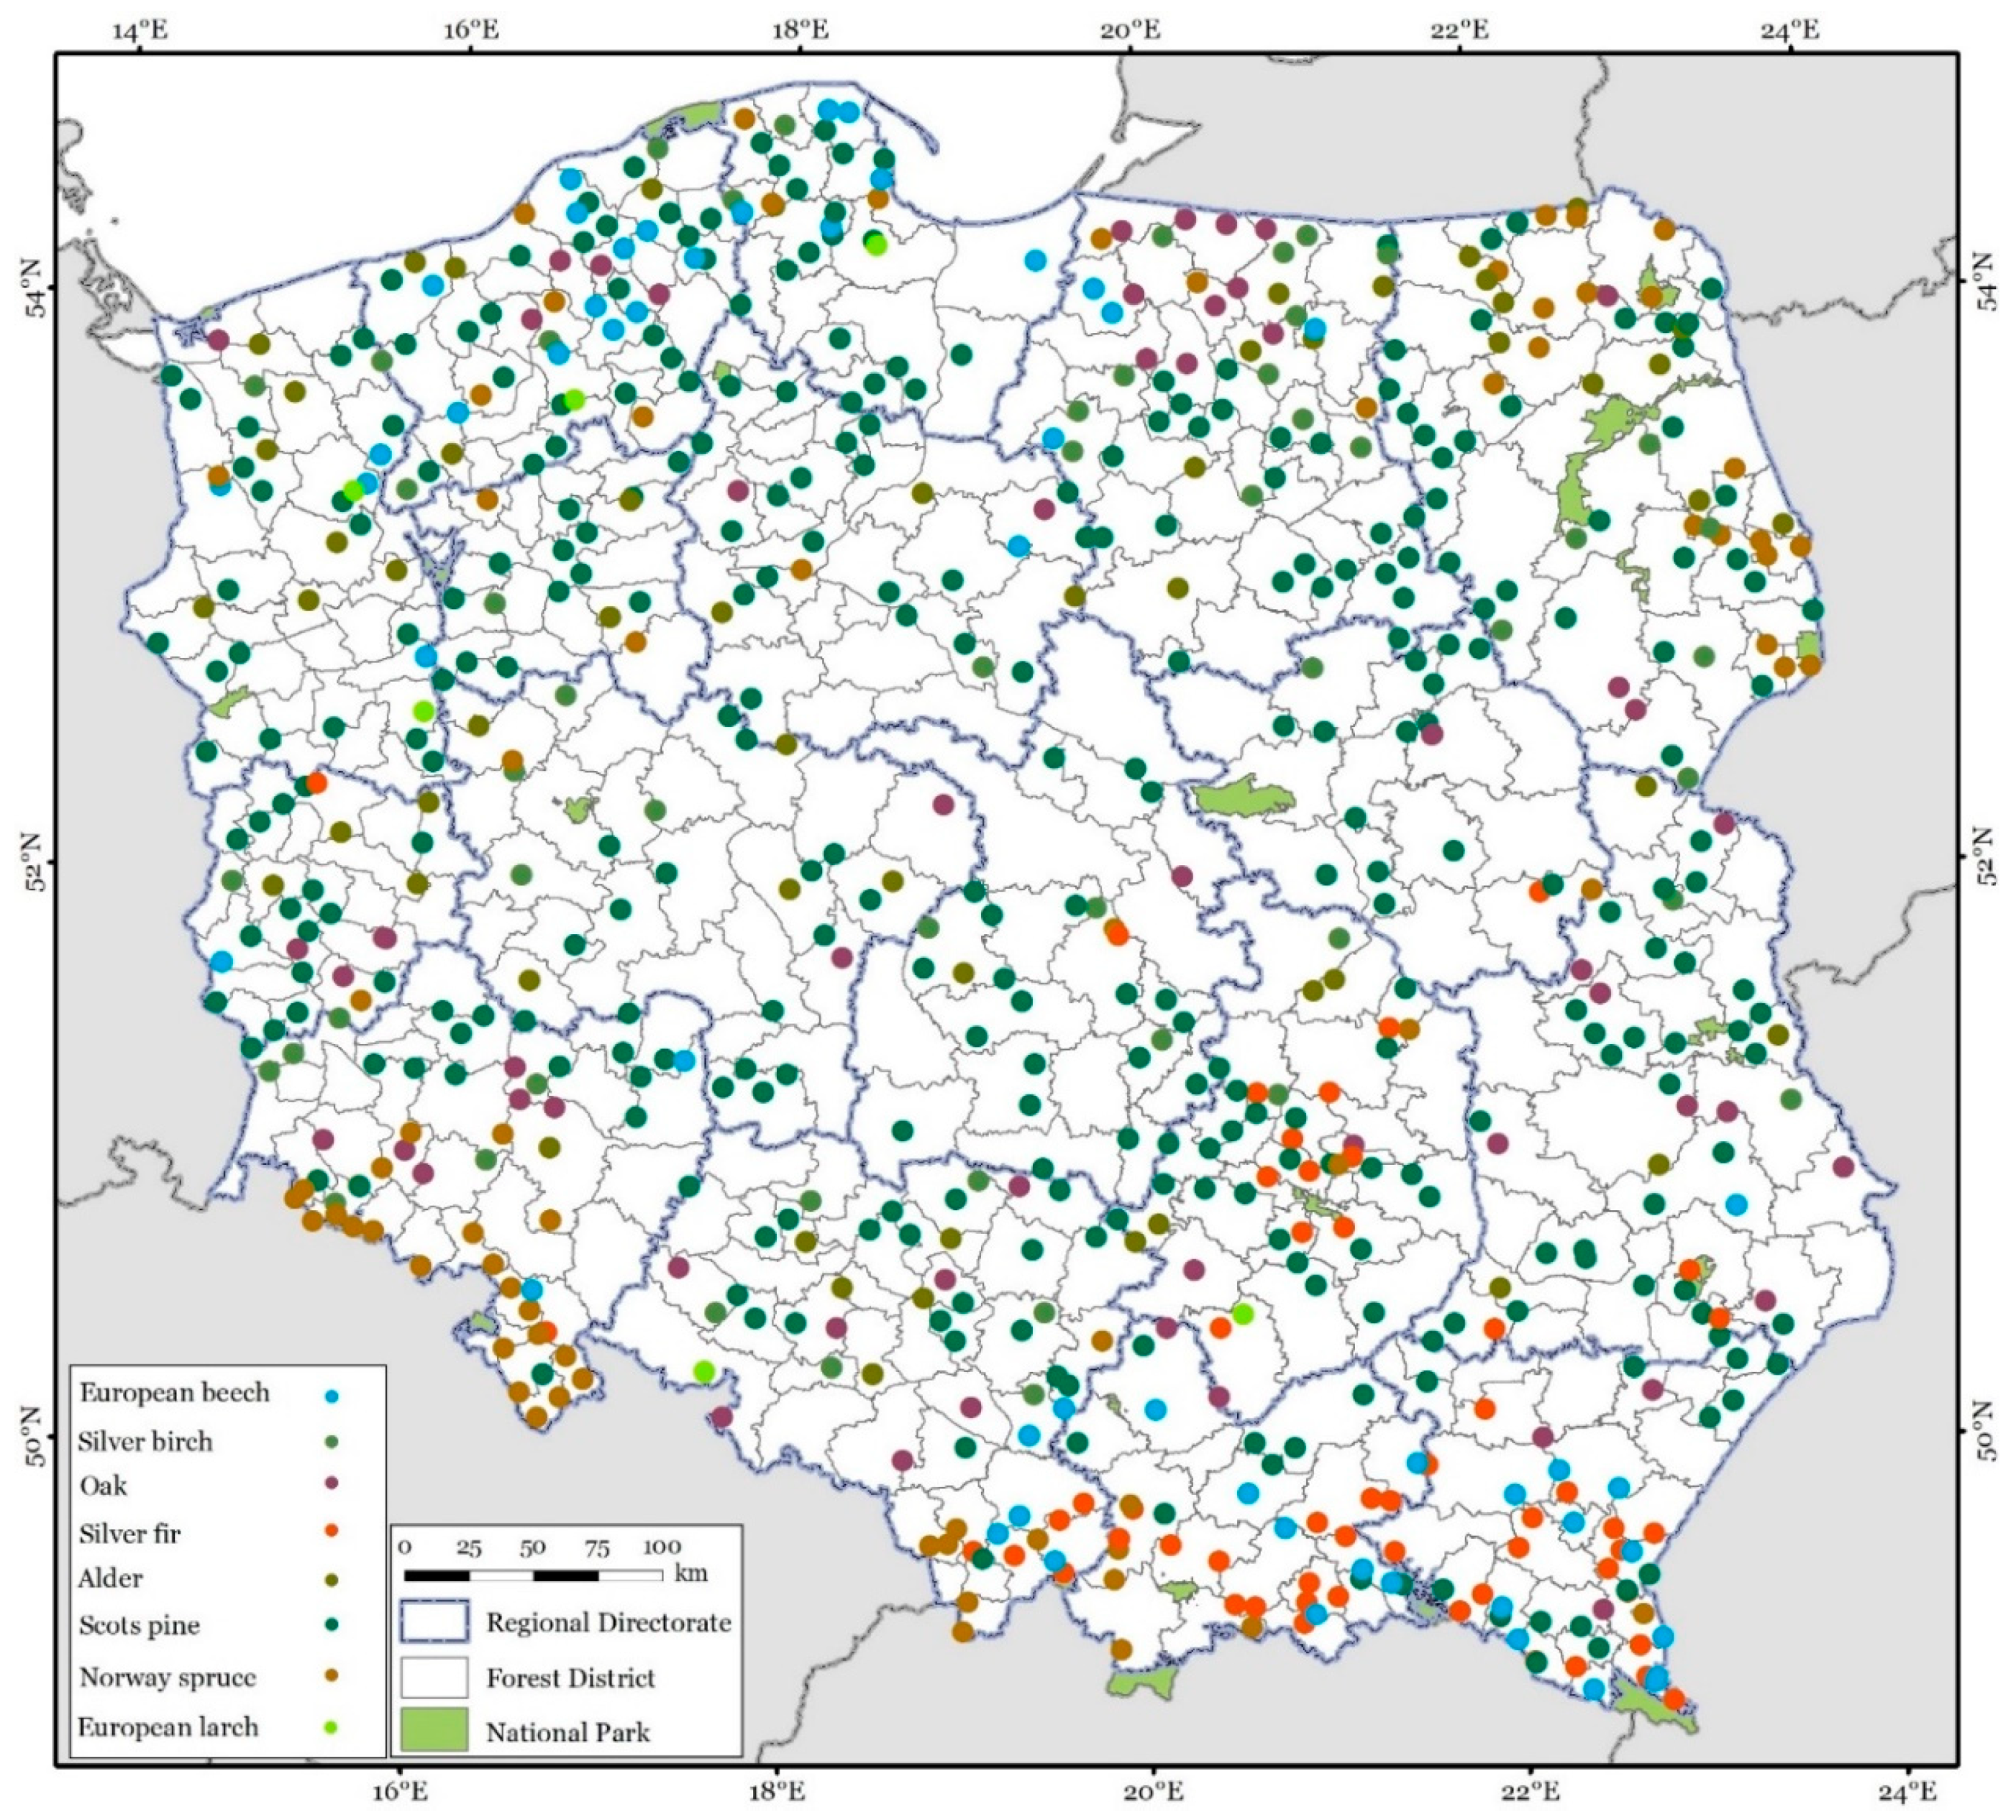
2.1. Collection of the Research Material

The research material consists of the height growth trajectories of 3052 dominant and codominant trees of the eight main forest-forming tree species in Poland (Table 1), which were collected from the whole territory of Poland (Figure 1). Sampled stands are mainly pure and even-aged. In part sampled stands were artificially planted, however, those are not typical forest plantations and the methods of forest management used in these forests, with the exception of Scots pine, are mainly close to continuous cover forestry. The research uses data from two sources. About 20% of the data were collected from the project titled “actual and potential site productivity in Poland for main forest-forming tree species,” realized in 2015–2017 and financed by the State Forests of Poland. The project established 612 sample plots for eight of the main forest-forming tree species, where stands were selected for each species, representing the whole range of geographic distributions and site conditions. The material collected thus represented the whole variability of Poland’s growth conditions for the forest-forming tree species analyzed. The second data source was the database of individual tree growth trajectories collected in Poland over the last few decades as part of research projects conducted by the main forest research institutions in Poland, namely, the Forest Research Institute in Sękocin Stary, the Faculty of Forestry, Warsaw University of Life Sciences (SGGW), and the Faculty of Forestry, University of Agriculture, Krakow. Both data sets used in the study meet the standards required for site index models development; the sample trees for the height growth reconstruction have been dominant without visible damage and were collected in pure stands of target species.

2.2. Stem Analysis

Stem analysis used the material of the 3052 trees to reconstruct the past height growth of the trees. The trees for stem analysis were selected in the direct neighborhood of the permanent sample plots established within the research projects. For each plot, one to three trees with a diameter and height close to the top height (TH) defined as the average height of the 100 thickest trees per 1 ha were selected and cut for stem analysis (SA). To reconstruct height growth, only trees with typically developed crowns with no visible damage or growth anomalies were chosen. After cutting, the total lengths of the trees were measured and rings were collected for stem analysis. Rings were taken from the base of the felled tree at a height of 0.5 m, at the diameter at breast height (DBH), and then, for trees over 15 m high, subsequent discs were collected at heights of 2 m, 4 m, and then every 2 m up to the top of the tree. For trees less than 15 m high, subsequent discs were collected at heights of 1.5, 2.5, 3.5, and every 1 m further up the tree. The course of growth of the individual tree was reconstructed using the height of the discs and the number of annual rings. The growth of the trees was also visually examined for patterns of suppression and release as well as growth anomalies. As cross-section lengths do not coincide with periodic height growth, the height-age data from the stem analysis were corrected using Carmean’s method [57].

2.3. Models

Over the years, researchers have used various mathematical functions to describe the growth of stands. Kiviste et al. [58] documented 74 different mathematical models for this purpose. Recently, several new solutions have been proposed to model the growth of various forest-forming species [29,42,48,50,56,59,60,61,62]. New growth functions have been used to develop site index models for different countries, such as Sweden [63], Finland [64], Spain [59,65,66], the USA [67,68], Turkey [61], and Poland [35,36,41,42,69].
To reliably estimate the site index, a model should have the following desirable attributes [47,50,70]:
  • Polymorphism, allowing the model to take into account different site-specific growth patterns, depending on site conditions;
  • Variable asymptotes for different sites;
  • Equality of the site index and the height at base age;
  • The possibility of using the same function as both a height growth model and a site index model.
The GADA method, which enables one to use one or two site-specific parameters representing the site’s quality, provides dynamic site index models that meet these criteria [47,59].
In the present study, we selected five dynamic models with symbols from M1 to M5 for further analysis (Table 2). All of these models meet the most criteria above and have been successfully applied to site index modeling, which makes them potential candidates for reliable site index models. Model M1, derived by Cieszewski [48], was applied in site index modeling in Denmark [71] and Poland [69,72]. Model M2 from the base function of Chapman–Richards, was developed by Krumland and Eng [73] and was used as one of the candidate functions for development site index models for Norway spruce and Scots pine by Sharma [60]. GADA formulation of the model M3 was developed by Cieszewski [74] based on the Bertalanffy–Richards function. Models M4 [60] and model M5 are the growth models that have frequently been tested in many studies concerning site index modeling [60,61,75]. In the case of the model, M5 GADA is equivalent to ADA [76].

2.4. Parameter Estimation

What distinguishes the selected equations is that the choice of the base age does not affect the estimates of the model parameters [47,48,50]. Local (site-specific) and global parameters (GPs) of site index models were simultaneously fitted using the iterative nested procedure (INP) that has been described by Cieszewski [77], Sharma [60], and Socha [69].
The INP starts by calculating the GPs of Function (1), using the height measured in base age for each of the growth trajectories of the individual trees. Next, for each growth trajectory, the GPs are assumed as constants, and the site-specific parameter (SI) is estimated. The SI values fitted for a given tree then become the “observed” values and the GPs are re-estimated. This procedure was repeated here until the GPs were stabilized.
To fit the models, we wrote a devoted R script [77]. As the data represent a time series, the models used a first-order autocorrelation error structure. We did so to deal with possibly autocorrelated residuals from the models, a problem often encountered in models fitted to data representing successive (and thus often correlated) observations in time, especially when all the possible time intervals are used. Such autocorrelation can adversely affect the estimates of model parameters and their standard errors [78].
To compare the fitted models with the corresponding growth trajectories from yield tables [26,28], we plotted height growth curves for a range of site indices.

2.5. Model Evaluation

To select the best models, we used three tools, namely, (i) graphical methods to compare residuals with the corresponding fitted values, (ii) statistics of the goodness-of-fit, and (iii) the evaluation of a model’s suitability to represent biological realism [70]. Such a procedure has been frequently used to compare and evaluate models [45,55,60,61,66]. To assess biological realism, we analyzed the trajectories and age of culmination of height increment. According to the general rules of growth [30], we assumed that the height increment of stands growing on the weakest site conditions should not exceed the increment in more fertile sites. Besides, we assumed that as the site productivity decreases, the age of culmination of height increment should increase.
In the first step, to evaluate the quality of the fit, the procedure analyzes three statistics, namely, the mean absolute error (MAE, Equation (1)), coefficient of determination (R2adj, Equation (2)), and the Akaike information criterion (AIC, Equation (3)):
MAE = i = 1 n | h i h i ^ | n
R 2 adj = 1 i = 1 n ( h i h i ^ ) 2 i = 1 n ( h i h i ¯ ) 2 ( n 1 n p )
AIC = 2 log L + 2 p
where h i   h i ¯ ,   h i ^   are the measured, mean, and predicted values of the heights, respectively, n is the total number of observations used to fit the model, p is the number of parameters in the model, and L is the residual sum of squares.
In the second step, we analyzed plots of model residuals, which allow for assessing the model’s fit across the range of the data. In the last step of the procedure, we analyzed whether each model had the desired biological properties.

3. Results

The five individual growth functions for the eight forest-forming species yielded 40 site index models (Table 3). Due to the properties of the differential equations, they were also height growth models. Table 3 summarizes parameter estimates and goodness-of-fit statistics of these candidate models. Figure 2 shows the model fit to growth series and Figure 3 shows the residuals against the predicted values. As emphasized earlier, to select the best model, we cannot use just one particular statistical measure, but instead, have to make a compromise between the statistical aspects and biological realism of the model. In the case of models with similar statistics of the goodness-of-fit, the model, which meets the criteria of biological realism was recommended.
Hence, the below analyses used quantitative measures of the goodness-of-fit (MAE, R2, and AIC), the analysis of residuals, and the evaluation of how the model reflects the biological phenomena of height growth as criteria.
The evaluation of fit statistics and the graphical analysis for model M1 indicates that this function had the best predictive ability as compared to the other models studied for Scots pine (Figure 2) and most of the analyzed species (Table 3). The European beech models, built based on functions M1, M3, and M5, had comparable fitting statistics, but after analysis of the residuals of models, we found systematic errors of model M3 in the dependence on stand age. Therefore models M1 and M5 (Figure 2) proved to be best suited to the empirical data among all of the other analyzed models. For black alder, model M1 had the best predictive ability in terms of the results of residual distribution and biological realism compared to the other models. Models M1 and M4, tested for European larch, showed a good fit for statistics with small differences between models, however, considering the plot of residuals, we propose the application of model M4 for site index determination for this species. Among all the equations tested for silver birch, models M1 M4 and M5 were characterized by good fitting statistics but after a detailed analysis of growth trajectories and plots of residuals, we recommend model M1 here. For oak, we recommend model M5, which provided the best results for the distribution of residuals. Goodness-of-fit statistics showed that model M1 for Norway spruce had the best predictive ability as compared to model M3, however, based on analysis of residuals we recommend model M3. For silver fir, the model built based on model M5 had the best fitting statistics as compared to the other models tested for silver fir, and was also well-fitted across the range of data.
Residual plots were used as one of the criteria of the model evaluation. For the models chosen, the most appropriate plots of residuals are presented in Figure 3. None of the models showed any apparent trends and structures across the range of predicted values, which indicates that the site index curves for the recommended models well represent the observed height age patterns across the range of site conditions.
High values of the adjusted (by the number of parameters in the model) coefficients of determination (R2adj) indicate that selected models accounted for at least 97.5% of the total variation in the data (Table 3), which represents a very good fit in every single case. Here, mean absolute errors ranged between 0.60 m (Scots pine) and 0.91 m (silver fir).
Growth curves obtained from the developed site index models were compared directly with the growth curves from the yield tables (Figure 4). For Scots pine, the curves were similar, with the largest differences observed in the old and young age classes, especially for less productive sites. The models differed more significantly for European beech and black alder in the youngest age classes. The yield tables showed that black alder’s stands reach nearly half of the total height in the first 15 years of life, after which their growth slows down, while the site index model developed in this study shows a fast growth rate up to 40 years. Large differences in growth trajectories were observed for Norway spruce and silver fir. For the former, the results show that the height growth of younger stands is considerably faster than what is found according to yield tables. For the latter, there were differences particularly in the oldest age classes, where the obtained model, in contrast, to yield tables, did not show the strong inhibition of height increase. Differences in height growth trajectories for European larch were rather small, with the larger height increment from developed models than in yield tables for the oldest stands. Growth curves from yield tables and the developed models provided similar trajectories for oak and silver birch.

4. Discussion

We developed site index models using dynamic functions derived from the GADA method, which meet the crucial requirement of polymorphism and variable asymptotes. This enables the good representation of empirical data, from both statistical and biological perspectives. To assess biological behavior, we analyzed height increment curves. We found the higher height increment in weaker site conditions, which was observed in the case of some models in the stands of older age classes, as incompatible with generally known growth rules [30]. We also assumed that as the site productivity decreases, the age of culmination of height increment should increase.
All the selected models had the desired properties of a good site index model. Compared to the methods still used in Polish forestry practice, such as yield tables, our models provide better predictive ability, which was also reported by many other studies that applied the GADA methodology, for instance [47].
It is important to note that yield tables were developed at the end of the nineteenth century and the beginning of the twentieth century. Each yield table value represents information obtained on the basis of only one age and site class, while each point of the curve of the developed models is the result of information from the entire range of empirical data. The purpose of modeling is to generalize the information contained in the measurement data and to compensate for random errors. The use of mathematical models developed by the simultaneous estimation of their parameters on the basis of all observations from all height growth trajectories collected for individual species is, statistically speaking, much more effective than tables containing the results of the individual adjustment of growth curves for individual site classes [79]. These attributes are one of the probable reasons for the differences between site index curves from yield tables and the newly developed dynamic site index curves.
The height growth trajectories obtained by the dynamic site index models have different courses from those of the yield tables. For most species, the two types of models showed the largest differences for either the youngest or the oldest age classes. For Scots pine, we observed some differences in both old and young age classes, especially for less productive sites (Figure 4), most likely due to the fact that yield tables poorly represent data within this range [80].
For European beech, the largest differences were observed in the youngest age classes, which is likely a consequence of the use of the longer regeneration periods for natural stands, which have been used in the past. A common current approach in the practice of beech forest management uses shorter regeneration periods, which could explain the observed changes.
The two types of models provided different results for black alder as well. The site index curves suggested a slower height growth speed in the youngest age classes than that resulting from the yield tables. This overestimation by yield tables may result from their use of data for coppice alder stands, which most probably present very intensive growth in the initial period of growth.
The differences we observed for European larch were similar to those observed for Scots pine, with less productive sites being poorly represented in the data and the oldest age classes being either underestimated or overestimated by yield tables.
Site index curves from yield tables and the developed model’s curves for oak and silver birch have almost the same course, demonstrating the possibility of the use of yield tables for site index estimation for this species. The large differences observed for Norway spruce probably have resulted from using different regeneration methods in the past (such as the shelterwood system) and a long regeneration period. The guidelines for the forest silviculture of this species have changed quite significantly during the twentieth century. In particular, its regeneration period was shortened, which is a key factor affecting the growth dynamics of this species, particularly for trees up to 60–80 years in age. In comparison to the height growth trajectories obtained from the developed model for Norway spruce, the site index curves from yield tables showed large errors in determining site productivity.
Analyzing growth trends for fir in the oldest age classes showed significant differences. The comparison of the curves suggests that, currently, stands of the oldest age classes do not show as significant slowdown as yield tables may suggest, which is consistent with the biology of this species. The current knowledge indicates that, in favorable conditions, silver firs can grow for 200 years [81].
In general, the results indicate that for most forest-forming tree species, the currently used yield tables provide different height growth curves than those actually observed. On the one hand, this observation might be due to the small amount of data used to construct yield tables for the youngest and oldest age classes, as well as the less productive sites, which are relatively rare. On the other hand, site indices for young stands are commonly considered to be very variable, because early growth is irregular and determined not only by site conditions but also by other factors [82]. Two of the key roles in this variation are the regeneration period and the regeneration method, the former likely being a reason for the differences between the growth curves fitted for Norway spruce and European beech, while the latter for black alder.
Another important factor affecting growth curves is the selection of trees. It is known that not all trees in the top layer of the stand belong to this layer throughout their entire life. As such a change in the canopy position of a tree is quite probable [83], models based on the data from stem analysis can sometimes overestimate growth rates [10]. We used the verification procedure to assess the growth curve of the individual growth series against the background of more trees living in the given area. This allowed us to limit the probability of choosing trees whose growth curves significantly differ from the growth curves of other trees growing in similar site conditions.
Most likely, the differences in growth curves obtained using dynamic site index modeling and yield tables, the latter obtained using data older than 100 years, were due to the changes in growth conditions over this time. As shown by the latest research, these were changes mainly in nitrogen deposition and the climatic parameters [31,84], as well as an increase in carbon dioxide concentration [85]. Changing site conditions over time [31] undoubtedly constitutes a disadvantage of the site index concept [3], as they lead to a negative correlation between stand age and the site index [21,60,69]. This problem is sometimes solved by the inclusion of a stand age as one of the variables when modeling site productivity [33,86].
Site index, which is traditionally used to determine current growth conditions, has increasingly used in new research areas, such as mapping the site index from remote sensing data, simulating productivity changes, and analyzing the CO2 sequestration of forest ecosystems [25,87]. Such analyses and tools provide valuable data to develop improved management practices in terms of mitigation and adaptation strategies for climate change. The appropriate prediction of site productivity is also key to developing effective strategies of CO2 sequestration [25]. Such activities should form the basis of modern forest management, which would take into account the need to adapt forest ecosystems to the effects of climate change. In this research, we have observed differences in the growth dynamics and site requirements of the main forest-forming species. This knowledge may be key in many areas of forest management, especially in the context of maintaining the sustainability of forests in the face of climate and environmental changes.
What is important from the perspective of forest management is that Poland is geologically and climatically diverse, particularly along the northeastern and southwestern gradients. Thus, the growth dynamics of forest stands may show spatial variability. If this variability is significant, future research should focus on dynamic site index models that take into account additional site variables. This thought is not new, however, as various authors have pointed out that when analyzing the site index, regional variability should be taken into account [3,56,71]. Therefore, future research should focus on the development of regional site index models, which would help foresters to estimate the potential productivity of forest sites. Although the development of such regional models requires extensive research material, the recent research suggests that for building them, not only the results of stem analysis may be used, but also other data sources. Data from permanent plots that are part of the large-scale National Forest Inventory and data from aerial laser scanning have also successfully been used for site index modeling [60,69].

5. Conclusions

We have developed new site index models for eight of the main forest-forming tree species in Poland, namely Scots pine, European beech, black alder, European larch, silver birch, oak, Norway spruce, and silver fir, using over 3000 data series describing the trajectories of tree height growth. Selected for each species, the best dynamic forms of the growth function allow for a good fitting of the models to the empirical data, as evidenced by the explanation of about 98% variation in height growth, which was crucial for the elimination of systematic errors. The main purpose of the developed models is the determination of site productivity. Thanks to the properties of the functions used for the development of the models, however, they can also be used as models describing the height growth of the stands. This research is the response to demands from the State Forests in Poland, Forest Management Bureau and other stakeholders to develop new yield tables (growth models) for the main forest-forming tree species in Poland. The presented research is the first stage in the construction of new empirical growth models/yield tables. The site index models presented in this research will be one of the functions of the developed growth models.

Author Contributions

Conceptualization, J.S.; Methodology, J.S.; Validation, J.S., L.T.-C.; Formal Analysis, J.S.; Investigation, J.S. and L.T.-C.; Resources, J.S.; Data Curation, J.S., S.O.; Writing—Original Draft Preparation, J.S., L.T.-C., E.G., S.O.; Writing—Review & Editing, J.S. and L.T.-C.; Visualization, J.S. and L.T.-C.; Funding Acquisition, J.S. All authors have read and agreed to the published version of the manuscript.

Funding

This work was supported by the project I-MAESTRO. Project Innovative forest MAnagEment STrategies for a Resilient biOeconomy under climate change and disturbances (I-MAESTRO) is supported under the umbrella of ForestValue ERA-NET Cofund by the National Science Centre, Poland and French Ministry of Agriculture, Agrifood, and Forestry; French Ministry of Higher Education, Research and Innovation, German Federal Ministry of Food and Agriculture (BMEL) via Agency for Renewable Resources (FNR), Slovenian Ministry of Education, Science and Sport (MIZS). ForestValue has received funding from the European Union’s Horizon 2020 research and innovation programme under grant agreement N° 773324. Data collection was supported by the project “Actual and potential site productivity in Poland for the main forest forming tree species”, financed by the General Direction of State Forests [agreement no. ER-2717-11/14, 15th April 2014].

Acknowledgments

We would like to thank the Forest Management and Geodesy Bureau from Sekocin Stary for cooperation in implementing the project "Actual and potential site productivity in Poland for the main forest forming tree species", particular for help in collecting the height growth data. We thank Professor Arkadiusz Bruchwald for sharing stem analysis data for different tree species collected within his research projects. We also thank three anonymous reviewers and the scientific editor who provided valuable comments on earlier versions of the manuscript.

Conflicts of Interest

The authors declare no conflicts of interest.

References

  1. Skovsgaard, J.P.; Vanclay, J.K. Forest site productivity: A review of the evolution of dendrometric concepts for even-aged stands. Forestry 2008, 81, 13–31. [Google Scholar] [CrossRef] [Green Version]
  2. Pretzsch, H.; Grote, R.; Reineking, B.; Rötzer, T.; Seifert, S. Models for forest ecosystem management: A European perspective. Ann. Bot. 2008, 101, 1065–1087. [Google Scholar] [CrossRef]
  3. Bontemps, J.J.D.; Bouriaud, O. Predictive approaches to forest site productivity: Recent trends, challenges and future perspectives. Forestry 2013, 87, 109–128. [Google Scholar] [CrossRef]
  4. Brandl, S.; Mette, T.; Falk, W.; Vallet, P.; Rötzer, T.; Pretzsch, H. Static site indices from different national forest inventories: Harmonization and prediction from site conditions. Ann. For. Sci. 2018, 75. [Google Scholar] [CrossRef] [Green Version]
  5. Splechtna, B.E. Height growth and site index models for Pacific silver fir in southwestern British Columbia. J. Ecosyst. Manag. 2001, 1, 1–14. [Google Scholar]
  6. Skovsgaard, J.P.; Vanclay, J.K. Forest site productivity: A review of spatial and temporal variability in natural site conditions. Forestry 2013, 86, 305–315. [Google Scholar] [CrossRef]
  7. Sharma, M.; Amateis, R.L.; Burkhart, H.E. Top height definition and its effect on site index determination in thinned and unthinned loblolly pine plantations. For. Ecol. Manage. 2002, 168, 163–175. [Google Scholar] [CrossRef]
  8. Hägglund, B.; Lundmark, J.E. Site index estimation by means of site properties of Scots pine and Norway spruce in Sweden. Stud. For. Suec. 1977, 138, 5–38. [Google Scholar]
  9. Johansson, T. Site Index Curves for Common Alder and Grey Alder Growing on Different Types of Forest Soil in Sweden. Scand. J. For. Res. 1999, 14, 441–453. [Google Scholar] [CrossRef]
  10. Raulier, F.; Lambert, M.C.; Pothier, D.; Ung, C.H. Impact of dominant tree dynamics on site index curves. For. Ecol. Manage. 2003, 184, 65–78. [Google Scholar] [CrossRef]
  11. Pretzsch, H. A Unified Law of Spatial Allometry for Woody and Herbaceous Plants. Plant Biol. 2002, 4, 159–166. [Google Scholar] [CrossRef]
  12. Pretzsch, H. Forest Dynamics, Growth, and Yield; Springer: Berlin/Heidelberg, Germany, 2010. [Google Scholar]
  13. Bruchwald, A.; Zasada, M. Model wzrostu modrzewia europejskiego ( Larix decidua Mill) Growth model for European larch (Larix decidua Mill). Sylwan 2010, 158, 615–624. [Google Scholar]
  14. Lindner, M.; Maroschek, M.; Netherer, S.; Kremer, A.; Barbati, A.; Lexer, M.J.; Marchetti, M. Climate change impacts, adaptive capacity, and vulnerability of European forest ecosystems. For. Ecol. Manag. 2010, 259, 698–709. [Google Scholar] [CrossRef]
  15. Boisvenue, C.; Running, S.W. Impacts of climate change on natural forest productivity—Evidence since the middle of the 20th century. Glob. Chang. Biol. 2006, 12, 862–882. [Google Scholar] [CrossRef]
  16. Swenson, J.J.; Waring, R.H.; Fan, W.; Coops, N. Predicting site index with a physiologically based growth model across Oregon, USA. Can. J. For. Res. 2005, 35, 1697–1707. [Google Scholar] [CrossRef] [Green Version]
  17. Coops, N.C.; Hember, R.A.; Waring, R.H. Assessing the impact of current and projected climates on Douglas-Fir productivity in British Columbia, Canada, using a process-based model (3-PG). Can. J. For. Res. 2010, 40, 511–524. [Google Scholar] [CrossRef]
  18. Mäkinen, H.; Yue, C.; Kohnle, U. Site index changes of Scots pine, Norway spruce and larch stands in southern and central Finland. Agric. For. Meteorol. 2017, 237–238, 95–104. [Google Scholar] [CrossRef]
  19. Yue, C.; Mäkinen, H.; Klädtke, J.; Kohnle, U. An approach to assessing site index changes of Norway spruce based on spatially and temporally disjunct measurement series. For. Ecol. Manage. 2014, 323, 10–19. [Google Scholar] [CrossRef]
  20. Yue, C.; Kahle, H.P.; von Wilpert, K.; Kohnle, U. A dynamic environment-sensitive site index model for the prediction of site productivity potential under climate change. Ecol. Modell. 2016, 337, 48–62. [Google Scholar] [CrossRef]
  21. Albert, M.; Schmidt, M. Climate-sensitive modelling of site-productivity relationships for Norway spruce (Picea abies (L.) Karst.) and common beech (Fagus sylvatica L.). For. Ecol. Manage. 2010, 259, 739–749. [Google Scholar] [CrossRef]
  22. Nabuurs, G.J.; Schelhaas, M.J.; Pussinen, A. Validation of the European Forest Information Scenario Model (EFISCEN) and a projection of Finnish forests. Silva Fenn. 2000, 34, 167–179. [Google Scholar] [CrossRef] [Green Version]
  23. Verkerk, P.J.; Fitzgerald, J.B.; Datta, P.; Dees, M.; Hengeveld, G.M.; Lindner, M.; Zudin, S. Spatial distribution of the potential forest biomass availability in Europe. For. Ecosyst. 2019, 6, 1–11. [Google Scholar] [CrossRef]
  24. Kurz, W.A.; Dymond, C.C.; White, T.M.; Stinson, G.; Shaw, C.H.; Rampley, G.J.; Smyth, C.; Simpson, B.N.; Neilson, E.T.; Trofymow, J.A.; et al. CBM-CFS3: A model of carbon-dynamics in forestry and land-use change implementing IPCC standards. Ecol. Modell. 2009, 220, 480–504. [Google Scholar] [CrossRef]
  25. Kim, M.; Lee, W.K.W.; Kurz, W.W.A.; Kwak, D.D.A.; Morken, S.; Smyth, C.E.C.; Ryu, D. Estimating carbon dynamics in forest carbon pools under IPCC standards in South Korea using CBM-CFS3. iForest Biogeosci. For. 2016, 9, 1–10. [Google Scholar] [CrossRef] [Green Version]
  26. Schwappach, A. Ertragstafeln der Wichtigeren Holzarten; Druckerei Merkur: Prag, Czech, 1943. [Google Scholar]
  27. Schober, R. Die Lärche – Eine ertragskundlich-biologische Untersuchung; Verlag M. u. H. Schaper: Hannover, Germany, 1949. [Google Scholar]
  28. Szymkiewicz, B. Niektóre zagadnienia dotyczące tablic zasobności drzewostanów sosnowych. Pr. IBL 1948, Seria A, 67. [Google Scholar]
  29. Cieszewski, C.J.; Strub, M.; Zasada, M. New dynamic site equation that fits best the Schwappach data for Scots pine (Pinus sylvestris L.) in Central Europe. For. Ecol. Manage. 2007, 243, 83–93. [Google Scholar] [CrossRef]
  30. Assman, E. Nauka o Produkcyjności Lasu; Państwowe Wydawnictwo Rolne i Lesne: Warszawa, Poland, 1968. [Google Scholar]
  31. Pretzsch, H.; Biber, P.; Schütze, G.; Uhl, E.; Rötzer, T. Forest stand growth dynamics in Central Europe have accelerated since 1870. Nat. Commun. 2014, 5, 4967. [Google Scholar] [CrossRef] [Green Version]
  32. Pretzsch, H.; Schütze, G.; Biber, P. Drought can favour the growth of small in relation to tall trees in mature stands of Norway spruce and European beech. For. Ecosyst. 2018, 5, 20. [Google Scholar] [CrossRef] [Green Version]
  33. Sharma, R.P.; Brunner, A.; Eid, T. Site index prediction from site and climate variables for Norway spruce and Scots pine in Norway. Scand. J. For. Res. 2012, 27, 619–636. [Google Scholar] [CrossRef]
  34. Socha, J.; Ochał, W.; Grabczyński, S.; Maj, M. Modele Bonitacyjne dla Gatunków Lasotwórczych Polski Opracowane na Podstawie Tablic Zasobności*. Site Index Models for Forest−Forming Tree Species in Poland Developed Basing on the Yield Tables. Sylwan 2015, 159, 639–649. [Google Scholar]
  35. Bruchwald, A.; Michalak, K.; Wróblewski, L.; Zasada, M. Przestrzenne Zróżnicowanie Wzrostu Sosny. Wzrost Wysokości Sosny w Różnych Regionach Polski; Fundacja Rozwój SGGW: Warszawa, Poland, 2000. [Google Scholar]
  36. Bruchwald, A. Change in Top Height of Pine Forest Stands with Age; Pascal and Francis Bibliographic Databases: Warszawa, Poland, 1977. [Google Scholar]
  37. Bruchwald, A.; Dudek, A.; Michalak, K.; Zasada, M.; Rymer-Dudzinska, T.; Wroblewski, L. Model wzrostu dla drzewostanów świerkowych. Sylwan 1999, 143, 19–31. [Google Scholar]
  38. Bruchwald, A.; Dudzińska, M.; Wirowski, M. Model wzrostu dla olszy czarnej (Alnus glutinosa (L.) Gaertn.). Sylwan 2003, 147, 3–10. [Google Scholar]
  39. Bruchwald, A.; Dmyterko, E.; Wojtan, R. A growth model for European larch (Larix decidua Mill.) based on stand characteristics. For. Res. Pap. 2011, 72, 77–81. [Google Scholar] [CrossRef]
  40. Orzeł, S.; Forgiel, M.; Ochał, W.; Socha, J. Nadziemna biomasa i roczna produkcja drzewostanów sosnowych Puszczy Niepołomickiej * Aboveground biomass and annual production in stands. Sylwan 2006, 150, 1–17. [Google Scholar]
  41. Socha, J.; Orzeł, S. Dynamic site index curves for Scots pine stands in Niepołomice Primeval ForestDynamiczne krzywe bonitacyjne dla drzewostanów sosnowych Puszczy Niepołomickiej. Sylwan 2011, 155, 301–312. [Google Scholar]
  42. Cieszewski, C.J.; Zasada, M. Dynamiczna forma anamorficznego modelu bonitacyjnego dla sosny pospolitej w Polsce. Sylwan 2002, 146, 17–24. [Google Scholar]
  43. Goelz, J.C.G.; Burk, T.E. Measurement error causes bias in site index equations. Can. J. For. Res. 1996, 26, 1585–1593. [Google Scholar] [CrossRef]
  44. Strub, M.; Cieszewski, C.J. Base-age invariance properties of two techniques for estimating the parameters of site index models. For. Sci. 2006, 52, 182–186. [Google Scholar]
  45. Martín-Benito, D.; Gea-Izquierdo, G.; del Río, M.; Cañellas, I. Long-term trends in dominant-height growth of black pine using dynamic models. For. Ecol. Manage. 2008, 256, 1230–1238. [Google Scholar] [CrossRef]
  46. Bailey, R.L.; Clutter, J.L. Base-Age Invariant Polymorphic Site Curves. For. Sci. 1974, 20, 155–159. [Google Scholar]
  47. Cieszewski, J.; Bailey, L. Generalized Algebraic Difference Approach: Theory Based Derivation of Dynamic Site Equations with Polymorphism and Variable Asymptotes. For. Sci. 2000, 46, 116–126. [Google Scholar]
  48. Cieszewski, C.J. Three methods of deriving advanced dynamic site equations demonstrated on inland Douglas-fir site curves. Can. J. For. Res. For. 2001, 31, 165–173. [Google Scholar] [CrossRef]
  49. Kitikidou, K.; Kaymakis, M.; Milios, E. Site index curves for young Populus tremula stands on Athos Peninsula (northern Greece). Turk. J. Agric. For. 2012, 36, 55–63. [Google Scholar]
  50. Cieszewski, C.J. Developing a Well-Behaved Dynamic Site Equation Using a Modified Hossfeld IV Function Y 3 = (axm)/(c + x m–1), a Simplified Mixed-Model and Scant Subalpine Fir Data. For. Sci. 2003, 49, 539–554. [Google Scholar]
  51. Cieszewski, C.J.; Nigh, G.D. A dynamic equation for a published Sitka spruce site-dependent height-age model. For. Chron. 2002, 78, 690–694. [Google Scholar] [CrossRef] [Green Version]
  52. Diéguez-Aranda, U.; Grandas-Arias, J.A.; Álvarez-González, J.G.; Von Gadow, K. Site quality curves for birch stands in North-Western Spain. Silva Fenn. 2006, 40, 631–644. [Google Scholar] [CrossRef] [Green Version]
  53. Diéguez-Aranda, U.; Burkhart, H.E.; Amateis, R.L. Dynamic site model for loblolly pine (Pinus taeda L.) plantations in the United States. For. Sci. 2006, 52, 262–272. [Google Scholar]
  54. Nord-Larsen, T. Developing Dynamic Site Index Curves for European Beech. For. Sci. 2006, 52, 173–181. [Google Scholar]
  55. Adame, P.; Hynynen, J.; Cañellas, I.; del Río, M. Individual-tree diameter growth model for rebollo oak (Quercus pyrenaica Willd.) coppices. For. Ecol. Manage. 2008, 255, 1011–1022. [Google Scholar] [CrossRef]
  56. Bravo-Oviedo, A.; del Río, M.; Montero, G. Geographic variation and parameter assessment in generalized algebraic difference site index modelling. For. Ecol. Manage. 2007, 247, 107–119. [Google Scholar] [CrossRef]
  57. Carmean, W.H. Site index curves for upland oaks in the central states. For. Sci. 1972, 18, 109–120. [Google Scholar]
  58. Kiviste, A.; Álvarez González, J.G.; Rojo-Alboreca, A.; Ruiz González, A.D. Funciones de Crecimiento de Aplicación en el Ámbito Forestal Faculty of Forestry; Ministerio de Ciencia y Tecnología: Madrid, Spain, 2002. [Google Scholar]
  59. Diéguez-Aranda, U.; Castedo Dorado, F.; Álvarez González, J.G.; Rojo Alboreca, A. Dynamic growth model for Scots pine (Pinus sylvestris L.) plantations in Galicia (north-western Spain). Ecol. Modell. 2006, 191, 225–242. [Google Scholar] [CrossRef]
  60. Sharma, R.P.; Brunner, A.; Eid, T.; Øyen, B.H. Modelling dominant height growth from national forest inventory individual tree data with short time series and large age errors. For. Ecol. Manage. 2011, 262, 2162–2175. [Google Scholar] [CrossRef]
  61. Ercanli, I.; Kahriman, A.; Yavuz, H. Dynamic base-age invariant site index models based on generalized algebraic difference approach for mixed Scots pine (Pinus sylvestris L.) and Oriental beech (Fagus orientalis Lipsky) stands. Turk. J. Agric. For. 2014, 38, 134–147. [Google Scholar] [CrossRef]
  62. Barrio Anta, M.; Dieguez-Aranda, U. Site quality of pedunculate oak (Quercus robur L.) stands in Galicia (northwest Spain). Eur. J. For. Res. 2005, 124, 19–28. [Google Scholar] [CrossRef]
  63. Elfving, B.; Kiviste, A. Construction of site index equations for Pinus sylvestris L. using permanent plot data in Sweden. For. Ecol. Manage. 1997, 98, 125–134. [Google Scholar] [CrossRef]
  64. Karlsson, K. Height growth patterns of Scots pine and Norway spruce in the coastal areas of western Finland. For. Ecol. Manag. 2000, 135, 205–216. [Google Scholar] [CrossRef]
  65. Bravo, F.; Montero, G. Site index estimation in Scots pine ( Pinus sylvestris L.) stands in the High Ebro Basin ( northern Spain) using soil attributes. Forestry 2001, 74, 395–406. [Google Scholar] [CrossRef] [Green Version]
  66. Palahı́, M.; Tomé, M.; Pukkala, T.; Trasobares, A.; Montero, G.; Palahí, M. Site index model for Pinus sylvestris in north-east Spain. For. Ecol. Manage. 2004, 187, 35–47. [Google Scholar] [CrossRef]
  67. Weiskittel, A.R.; Hann, D.W.; Kershaw, J.A., Jr.; Vanclay, J.K.; Kershaw, J.A.; Vanclay, J.K. Forest Growth and Yield Modeling; Wiley: Chichester, UK, 2011. [Google Scholar]
  68. Weiskittel, A.; Kuehne, C.; McTague, J.P.; Oppenheimer, M. Development and evaluation of an individual tree growth and yield model for the mixed species forest of the Adirondacks Region of New York, USA. For. Ecosyst. 2016, 3. [Google Scholar] [CrossRef] [Green Version]
  69. Socha, J.; Pierzchalski, M.; Bałazy, R.; Ciesielski, M. Modelling top height growth and site index using repeated laser scanning data. For. Ecol. Manage. 2017, 406, 307–3017. [Google Scholar] [CrossRef]
  70. Goelz, J.C.G.; Burk, T.E. Development of a well-behaved site index equation: Jack pine in north central Ontario. Can. J. Res. 1992, 22, 776–784. [Google Scholar] [CrossRef]
  71. Nord-Larsen, T.; Meilby, H.; Skovsgaard, J.P. Site-specific height growth models for six common tree species in Denmark. Scand. J. For. Res. 2009, 24, 194–204. [Google Scholar] [CrossRef]
  72. Socha, J. Site index curves for Norway spruce on mountain habitatsKrzywe bonitacyjne świerka pospolitego na siedliskach górskich. Sylwan 2011, 155, 816–826. [Google Scholar]
  73. Krumland, B.; Eng, H. Site Index Systems For Major Young-Growth Forest and Woodland Species in North California. Calif. For. 2005, 4, 1–220. [Google Scholar]
  74. Cieszewski, C.J. GADA derivation of dynamic site equations with polymorphism and variable asymptotes from Richards to Weibull and other exponential functions. For. Sci. 2004, 54, 303–315. [Google Scholar]
  75. Seki, M.; Sakici, O.E. Dominant height growth and dynamic site index models for Crimean pine in the Kastamonu-Taşköprü region of Turkey. Can. J. For. Res. 2017, 47, 1441–1449. [Google Scholar] [CrossRef] [Green Version]
  76. Anta, M.B.; Dorado, F.C.; Diéguez-Aranda, U.; Álvarez González, J.G.; Parresol, B.R.; Soalleiro, R.R. Development of a basal area growth system for maritime pine in northwestern Spain using the generalized algebraic difference approach. Can. J. For. Res. 2006, 36, 1461–1474. [Google Scholar] [CrossRef] [Green Version]
  77. Cieszewski, C.J.; Harrison, M.; Martin, S.W. Examples of Practical Methods for Unbiased Parameter Estimation in Self-Referencing Functions; University of Georgia: Athens, GA, USA, 2000. [Google Scholar]
  78. Parresol, B.R.; Vissage, J.S. White Pine Site Index for the Southern Forest Survey White Pine Site Index for the Southern Forest Survey; U.S. Department of Agriculture, Forest Service, Southern Research: Asheville, NC, USA, 1998.
  79. Cieszewski, C.J.; Zasada, M. Model bonitacyjny dla sosny na podstawie tablic zasobności Szymkiewicza. Sylwan 2003, 147, 51–62. [Google Scholar]
  80. Szymkiewicz, B. Tablice Zasobności i Przyrostu Drzewostanów; Państwowe Wydawnictwo Rolnicze i Leśne: Warszawa, Poland, 2001. [Google Scholar]
  81. Magin, V.R. Ertragskundliche Unteruchungen in Montanen Mischwaldern. Forstwiss. Cbl. 1954, 73, 103–113. [Google Scholar] [CrossRef]
  82. Huang, S. Development of compatible height and site in- dex models for young and mature stands within an ecosys- tem based management framework. In Empirical and Process-Based Models for Forest Tree and Stand Growth Simulation; Technical University of Lisboa: Oeiras, Portugal, 1999; pp. 61–98. [Google Scholar]
  83. Perin, J.; Hébert, J.; Brostaux, Y.; Lejeune, P.; Claessens, H. Modelling the top-height growth and site index of Norway spruce in Southern Belgium. For. Ecol. Manage. 2013, 298, 62–70. [Google Scholar] [CrossRef]
  84. Nieróbca, A.; Wróblewska, E.; Mizak, K.; Kozyra, J. Zmiana długości okresu wegetacyjnego w Polsce. Woda Środowisko Obsz. Wiej. 2013, 13, 81–94. [Google Scholar]
  85. Jabłoński, M.; Budniak, P. Estimating aboveground woody biomass of forests in Poland for FAO/ECE and UNFCCC reporting. For. Res. Pap. 2014, 75, 277–289. [Google Scholar] [CrossRef] [Green Version]
  86. Bøhler, F.; Bernt-Håvar, Ø. Estimation of site-index in old, semi-natural stands of Norway spruce at high altitude. Book of abstracts for the conference. Rapport fra Skog og landskap. In Proceedings of the Forest Management and Silviculture in the North—Balancing Future Needs, Stjørdal, Norway, 6–8 September 2011; p. 53. [Google Scholar]
  87. Coops, N.C.; Hember, R.A. Physiologically derived predictions of Douglas-fir site index in British Columbia. For. Chron. 2009, 85, 733–744. [Google Scholar] [CrossRef] [Green Version]
Figure 1. The location of sample plots for the analyses of the forest-forming tree species in Poland. From these plots, stem analysis data used for model development were collected.
Forests 11 00301 g001
Figure 2. Site-specific height growth curves representing the developed site index models, along with the observed height growth trajectories obtained from stem analysis. The numbers in circles show the corresponding values of the site index.
Forests 11 00301 g002
Figure 3. Residual versus predicted values from the selected site index models for the analyzed tree species studied.
Forests 11 00301 g003
Figure 4. Height growth curves from the selected site index models (solid lines) against those obtained from yield tables (dotted lines). The numbers in circles show the corresponding values of the site index.
Forests 11 00301 g004aForests 11 00301 g004b
Table 1. The number and basic characteristics of growth series for the analyzed species, obtained from stem analysis and used for the development of the site index models.
SpeciesNumber of Growth SeriesAge (Years)Height (m)
MinMaxMin Max
Scots pine (Pinus sylvestris)988121757.0736.75
European beech (Fagus sylvatica)3276018015.7933.56
Black alder (Alnus glutinosa)44871205.1531.4
European larch (Larix decidua)2272017016.3838.55
Silver birch (Betula pendula)992010510.4633.46
Oak (Quercus sp.)317181459.532.91
Norway spruce (Picea abies)419101541.2741.57
Silver fir (Abies alba)227202151.736.16
3052
Table 2. The dynamic generalized algebraic difference approach (GADA) formulations with base equations used to model dominant height growth.
Model No.Base Model FormsParameter Related to Site and Solution for theoretical Variable XDynamic GADA Formulation and Reference
M1 H = a 1 S a 2 ( 1 + e a 3 a 4 l n t a 5 l n S ) S = X 0
R = Z 0 + ( Z 0 2 + 2 b 2 H 1 T 1 b 1 )
Z 0 = H 1 b 3
H 1 = H 0 t 1 b 1 ( t 0 b 1 R + b 2 t 1 b 1 R + b 2 )
Cieszewski [48]
M2 H = a 1 [ 1 exp ( a 2 t ) ] a 3 a 1 = X
X 0 = H 0 / ( 1 exp ( b 2 t 0 ) ) b 3
H 1 = H 0 ( 1 e x p b 2 t 0 1 e x p b 2 t 1 ) b 3
Krumland and Eng [73]
M3 H = a 1 [ 1 exp ( a 2 t ) ] a 3 a 1 = e x p ( X )
a 3 = b 2 + b 3 / X
X 0 = 1 2 l n Y 0 b 2 L 0 + ( l n Y 0 b 2 L 0 ) 2 4 b 3 L 0
with
L 0 = l n 1 exp ( b 1 t 0 )
H 1 = H 0 ( 1 exp ( b 1 t 1 ) 1 exp ( b 1 t 0 ) ( b 2 + b 3 X 0 )
Cieszewski [74]
M4 H = t 2 a 1 + a 2 t + a 3 t 2 a 2 = X
X 0 = t 0 H 0 b 1 t 0 b 2 t 0
H 1 = t 1 2 b 1 + X 0 t 1 + b 2 t 1 2
Sharma et al. [60]
M5 H = a 1 e x p ( a 2 t a 3 ) a 2 = X
X 0 = ln ( Y 0 a 1 ) t 0 a 3
H 1 = b 0 ( H 0 b 0 ) ( t 1 t 0 ) b 2
Anta et al. [76]
a1, a2, a3, a4, a5 are parameters in base models; b1, b2, b3 are parameters in dynamic models; S is the parameter related to site; H0 and H1 are heights (in m) at age t0 and t1 (in years), respectively; X0 is the solution of X for initial height and age.
Table 3. Parameter estimates and goodness-of-fit statistics for the individual site functions and species. R2: Coefficient of determination. AIC: Akaike information criterion. MAE: Mean absolute error.
SpeciesFunctionParametersEstimateR2adjAICMAE
Scots pineM1b11.3660.989353240.6
b25802.862
b330.581
M2b20.0170.986392050.65
b31.236
M3b10.0200.988369370.61
b20.860
b38.425
M4b110.8480.989356080.61
b20.019
M5b0101.2550.988365180.64
b20.436
European beechM1b11.3660.98786040.677
b25802.952
b330.581
M2b20.0150.98787300.684
b31.675
M3b10.0170.98885610.672
b21.243
b37.797
M4b147.6610.98688950.707
b20.013
M5b0206.9470.98787970.697
b20.415
Black alderM1b11.5650.985283590.728
b21644.059
b329.161
M2b20.0350.981306730.83
b31.472
M3b10.0390.983293270.77
b20.159
b331.764
M4b19.2440.984288030.74
b20.025
M5b0101.2550.983365180.645
b20.436
European larchM1b11.3280.98487830.843
b2625.507
b343.486
M2b20.0170.97896611.044
b31.084
M3b10.0230.98290750.897
b20.346
b321.046
M4b14.6390.98389480.878
b20.018
M5b078.3570.98388790.848
b20.514
Silver birchM1b11.3660.98430070.744
b25802.952
b330.581
M2b20.0360.98330790.777
b31.580
M3b10.0380.98330420.768
b21.120
b312.810
M4b111.3370.98429990.731
b20.023
M5b0101,2550.98431720.845
b20,436
OakM1b11.6640.987123760.691
b27635.281
b330.359
M2b20.0220.984132530.776
b31.591
M3b10.0250.986126320.708
b20.699
b318.602
M4b127.8310.986126320.708
b20.022
M5b060.3310.986125110.697
b20.654
Norway spruceM1b11.8330.986198140.775
b26121.850
b340.956
M2b20.0160.977230531.009
b31.606
M3b10.0250.985204050.828
b20.770
b324.012
M4b131.5490.979224980.96
b20.014
M5b086.6250.986200240.8
b20.642
Silver firM1b11.8330,976120750.992
b26121.850
b340.956
M2b20.0070.959136291.285
b31.478
M3b10.0170.975120180.993
b21.439
b36.830
M4b166.6780.959136141.285
b20.011
M5b063.5330.978115960.916
b20.867

