Abstract
The methodology presented here can assist in evaluating the need for pre-harvest clearing. In the long term, similar approaches may help with managing electronic standing sales and enhance the operational environment of roundwood e-marketplaces. In cut-to-length harvesting, pre-harvest clearing is needed when the understory vegetation hinders the visibility of the stems to be harvested. It can facilitate the work of the harvester operators and thereby enhance the productivity and quality of the harvesting operation. Information about where pre-harvest clearing is required is often not available, however, or else it has to be collected during time-consuming field visits. We report here on the development and evaluation of airborne laser scanning (ALS)-based models for estimating the need for pre-harvest clearing. The reference data consisted of 99 circular field sample plots that were photographed and in which stems with diameters at breast height from one to seven centimeters were measured. An online e-questionnaire survey responded to by 66 forest professionals classified the sample plots into five categories ranging from no need for pre-harvest clearing to compulsory pre-harvest clearing. A linear discriminant analysis was used to estimate the need for pre-harvest clearing with an accuracy of 63.6%, whereas a linear model-based method that predicted the understory stem density assessed the need with an accuracy of 64.6%. Use of this method could deliver information about the understory vegetation, offer guidelines for clearing the understory, and reduce the number of field visits before harvesting, thus reducing costs.
1. Introduction
The value of a standing tree stock can be derived from the value of the roundwood in the wood processing yard with its procurement costs deducted. These procurement costs include harvesting and transportation costs plus the fixed overhead costs of the procurement organization. Consequently, the wood procurement costs, and therefore the value of any standing tree stock, will greatly depend on the productivity and cost-efficiency of wood procurement operations.
The productivity of cut-to-length (CTL) harvesting is affected by the size, properties, and configuration of the machinery, the capabilities of the operator, and the stand and site conditions (see [1,2,3,4]). CTL machinery is constantly being developed [5] and the operators’ capabilities can be improved through education [6] and experience [7]. On the other hand, it is generally difficult to alter the stand and site conditions in order to improve productivity. One option to achieve this is to remove any understory vegetation that may hinder visibility during harvesting. Understory removal is a standard practice in Nordic countries [8,9].
According to Oikari et al. [10], dense understory vegetation is the most serious problem affecting industrial roundwood harvesting in young stands in Finland, even to the extent that prior clearance of any dense understory is required for cost-efficient harvesting. In Nordic countries, pre-harvest clearing was found to ease the harvester operators’ work, increase their safety and productivity, and improve the quality of the harvesting operation [8]. It has been stated [11] that pre-harvest clearing of small trees reduces stem damage, facilitates the selection of the trees to be harvested, and increases bearing capacity, thereby reducing root damage. Weak visibility due to understory vegetation also increases the risk of chain, guide bar, and hydraulic tube breakages [11].
In the USA, Granskog and Anderson [12] have shown that the productivity of a feller-buncher in row thinning was reduced by about 20% in pine plantations with a dense deciduous understory compared with those having a light understory. Kärhä [8] found that cutting productivity in a Norway spruce dominated (Picea abies (L.) H. Karst) Finnish forest was reduced by 12–14% when the density of the understory vegetation of height circa two meters was 2000 stems·ha−1 and by 30–34% at 10,000 stems·ha−1. In contrast, the average percentage of damage to merchantable trees was only 4.2% regardless of the understory vegetation when the harvester operators used the harvester head to remove the disturbed understory and were highly experienced (having used CTL harvesters for pre-thinning work from seven to twenty years). The productivity loss in harvesting operations due to this practice nevertheless severely hinders cost-effectiveness, and therefore damage rates may be further reduced, and efficiency further increased by performing understory clearing using brush saws instead of harvesters, although this requires pre-knowledge of the location of the stands where such clearing operations are required.
As regular field visits entail a comparatively high workload, the application of active remote sensing techniques such as airborne laser scanning (ALS) may be a promising alternative. ALS is an active remote sensing technology that collects information on tree size structures in 3D and has been widely used to provide estimates of tree and stand-level forest inventory parameters [13,14]. Large-scale forest stand inventories based on ALS have been in use in Nordic countries since 2002 [15], and in particular, area-wide ALS-based estimates of wood volume [16] and biomass [17] have been obtained in numerous studies. Forest variables can be obtained through the area-based approach (ABA; see [18]) or individual tree detection (ITD; see [19]), but the ITD approach requires a relatively high ALS point density, whereas ABA has been shown to work quite reliably at a comparatively low point density (roughly one pulse·m−2, [20]). While overstory trees (i.e., dominant and co-dominant trees) often have a detection rate of 90% or more in ALS data, the detection rate for understory trees (i.e., intermediate and suppressed trees) is usually below 50% [21]. One important source of omission errors (missed trees) is the obstruction of understory trees by overstory ones [22]. However, full-waveform ALS data detect these strata in more detail than discrete ALS data. Nevertheless, these full-waveform ALS data are less common due to the large amount of data and the limited processing tools available [23,24]. On the other hand, branches, non-crop trees, and dead trees are potential causes of commission errors (wrongly detected trees) [25]. While ALS data can be used to estimate the canopy cover quite accurately [26], the isolation of understory trees from the overstory ones remains a challenging task [27]. However, for the application of pre-harvest pruning discussed here, it is not crucial to distinguish individual plants as the average height and density of the forest understory form a good proxy for the necessity of pre-harvest clearing [28], and it may be quite possible to estimate these rather coarse parameters of the understory with ALS data.
Since a certain proportion of the laser pulses will penetrate through the dominant tree canopy layer, multi-layered stands can be identified using ALS (see [29,30]). When Maltamo et al. [30] examined the height distributions of reflected laser pulses using the histogram thresholding method to segregate distinct tree storys, the results indicated that multi-layered stand structures could be identified and quantified using ALS height data distribution statistics. Later, an object-oriented segmentation approach to multistory stands was adopted by [21,31]. The first stratified the point cloud by canopy layers and segmented the trees of all sizes for each canopy layer using a digital surface model-based tree crown segmentation method. Ferraz et al. [31] used a mean shift algorithm to segment the point cloud and allocate each segment to an appropriate vegetation layer.
The quantity of understory trees affects the commercial value of timber stands. Current electronic marketplaces (e.g., www.kuutio.fi) facilitate trading in timber by providing a place where supply and demand can meet. The challenge for such a virtual marketplace is the facilitation of “standing sales”, where the buyer is responsible for harvesting and its costs. This is the type of sales contract that is predominantly used in Finland. One requirement for such transactions is accurate and comprehensive information on the forest area concerned including growing stock properties and harvesting conditions. These matters were previously assessed in the course of purchasing the timber, but now that this can be done by computer, there is increasing pressure to reduce the number of forest visits before harvesting operations begin. For this purpose, it would be feasible to resort to remote sensing and GIS-based methodologies. In Finland, it is possible to obtain data on understory trees from the National Forest Inventory, but these are quantitative estimates and are imprecise for practical purposes [27]. There are no means currently available for examining the need for pre-harvest clearing without a field visit.
Our hypothesis for this research was that the need for pre-harvest clearing could be estimated using ALS data, which led us to examine the possibilities of estimating that need from multispectral ALS data. In this paper, we present and evaluate linear discriminant analyses (LDA) and a linear model-based method for estimating the need for pre-harvest clearing based on ALS-derived variables, field measurements, and an e-questionnaire survey answered by forest professionals that contained pictures taken in the forest area concerned. The overarching aim of the research was to develop an ALS workflow that could provide information about the understory vegetation, which in turn may serve to reduce the need for forest visits before harvesting operations.
2. Materials and Methods
2.1. Materials
2.1.1. Field Data
The field data were collected in the municipalities of Liperi and Heinävesi in Eastern Finland (Figure 1). The main tree species in the area are Scots pine (Pinus sylvestris L.), Norway spruce, and birches (Betula spp.). The plots were selected subjectively with the aim of having approximately one third of each of the plots dominated by Scots pine, one third by Norway spruce, and one third by birches. The field data were collected in July and August 2017. Altogether, 99 circular sample plots were photographed in order to estimate the need for pre-harvest clearing. The center of each plot was identified using global positioning system (GPS) devices with an accuracy of <0.5 m.
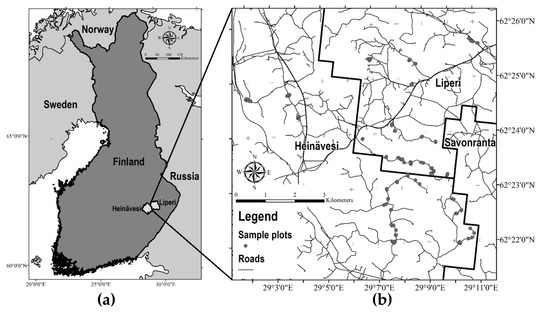
Figure 1.
(a) Location of Liperi and Heinävesi (light grey) within Finland (dark grey); (b) Map of the area in which the sample plots were located.
In dense forests with small trees, sample trees are typically selected on different plot sizes depending on the diameter at breast height (DBH) [32]. In our study, trees with DBH under seven centimeters were defined as understory trees. For the purpose of determining the understory stem density, each plot contained two concentric circular sample plots with fixed radiuses of three and five meters, respectively. In the three-meter plots, the diameter at breast height and the species of all the trees whose diameters were between one and seven centimeters (DBH1–7) were recorded, while in the five-meter plots, the same measurements were carried out for all the trees with a diameter between four and seven centimeters (DBH4–7). The understory tree of all the trees with a DBH1–7 (NDBH1–7) varied from 0 to 11,926 stems·ha−1, with an average of 3455 stems·ha−1.
2.1.2. E-Questionnaire Survey
An online e-questionnaire survey among subscribers to the Finnish Facebook group “Forest machine operators”, which included over 8000 members at the time of the survey, was organized to compile our reference dataset. The questionnaire contained images taken within the plots, and respondents were asked to classify each plot into one of five categories: (1) no need for pre-harvest clearing; (2) pre-harvest clearing would help harvesting; (3) pre-harvest clearing recommended; (4) a great need for pre-harvest clearing; and (5) compulsory pre-harvest clearing (see Figure 2). Replies were received from 66 respondents, representing 56 harvester operators, 10 forwarder operators, four forest experts, five students, six forest owners, and one other person. In some cases, the same respondent fell into more than one category (e.g., a harvester operator and forest owner).
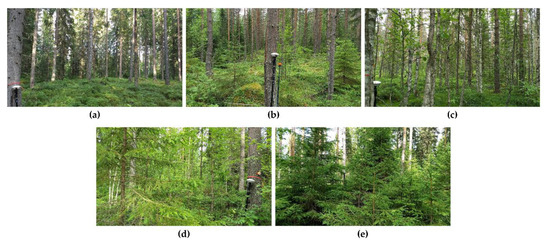
Figure 2.
Representative photographs of each category used in the e-questionnaire survey. (a) Class 1, no need for pre-harvest clearing; (b) Class 2, pre-harvest clearing would help harvesting; (c) Class 3, pre-harvest clearing recommended; (d) Class 4, a great need for pre-harvest clearing; and (e) Class 5, compulsory pre-harvest clearing.
2.1.3. Airborne Laser Scanning (ALS) Data
The multispectral ALS data were collected on 2, 3, and 10 July 2016 using an Optech Titan sensor on a fixed-wing airplane travelling at 1000 m above ground level, recording with a strip width of 655 m. The ground speed was 77 m s−1, the scan angle was 40°, and the pulse repetition frequency was 250 kHz. This Optech Titan sensor has three independent active imaging channels that work at wavelengths of 1550, 1064, and 532 nm. The average pulse densities per flight line were 6.6 pulses·m−2, 8.0 pulses·m−2, and 3.1 pulses·m−2 for the 1550, 1064, and 532 nm channels, respectively.
2.2. Methods
2.2.1. Processing of ALS Data
The procedure for estimating the need for pre-harvest clearing using the ALS data required the following steps: (1) pre-processing of the point cloud, (2) calculation of height statistics for voxels and prediction of the need for pre-harvest clearing, and (3) defining the operational needs for pre-harvest clearing using the model results.
The original ALS point cloud was normalized using a digital terrain model (DTM) with a 0.5 m resolution. The DTM was built up by classifying points as ground and non-ground points, as explained in [33]. After that, the ALS point altitudes (Z) were normalized to altitudes above ground (dZ) using the DTM. We then filtered the point cloud using a height threshold and only considered points with heights from zero to three meters for the remainder of the analysis.
As illustrated in Figure 3, we constructed voxels with a base of 1.5 m by 1.5 m and a height of 1.5 m or 3 m around the center of each field plot for a detailed description of the vegetation structure. We only considered voxels that were fully contained in the 5 m radius data for the plots. This led to the consideration of 72 (i.e., 24 in the XY direction × 3 in the Z direction) for each plot for which the ALS metrics were calculated. For this purpose, the ALS points were split geometrically by voxels, and the ALS data from the channels at wavelengths of 1550, 1064, and 532 nm were used together to estimate the need for pre-harvest clearing.
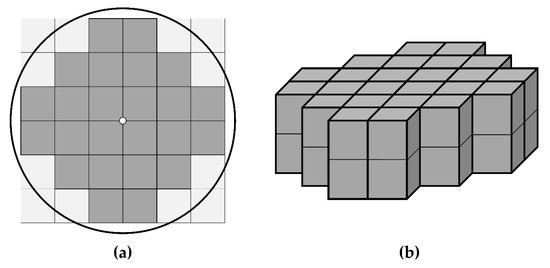
Figure 3.
(a) 2-dimensional distribution of the voxels in a plot (dark grey) in a circular plot of radius five meters (black circle). The size of each voxel was 1.5 m × 1.5 m. (b) 3-dimensional distribution of the same voxels. The size of each voxel was 1.5 m × 1.5 m × 1.5 m or 1.5 m × 1.5 m × 3 m.
The density (i.e., the number of ALS points) and the maximum, minimum, mean, standard deviation, skewness, and kurtosis of the density per plot and per voxel were calculated from the ALS data.
2.2.2. Operational Needs for Pre-Harvest Clearing
We used two alternative concepts to determine the need for pre-harvest clearing, the first relying on the operators’ opinions (five and three categories; LDA) and the second on predicting the number of stems in the understory vegetation and applying the rules developed in the forest industry.
First, the categories of need for pre-harvest clearing were based on the e-questionnaire survey. The variation in the forest professionals’ perceptions within one class based on the answers given in the e-questionnaire is shown in Table 1. The average value for each plot was calculated as the nearest integer value of all the answers (from one to five) within the plot. After that, the 99 plots were divided into the five categories based on the average value per plot. To calculate the variation in the forest professionals’ perceptions within the category represented by each average value, the numbers of observations with an answer equal to one, two, three, four, or five were divided separately by the total number of observations with an answer equal to the average value for the category.

Table 1.
Variations in the forest professionals’ perceptions within each class regarding the need for pre-harvest clearing of understory trees.
2.2.3. Model Construction
A LDA with cross-validation was carried out using the ALS density distribution statistics of the voxels as predictor variables and the mean values of all the answers per plot of the need for pre-harvest clearing (five categories), according to the e-questionnaire survey data as response variables (professionals’ opinions). When five categories were applied, the LDA used the mean values from the e-questionnaire survey data per plot as response variables and the following ALS density distribution statistics for the voxels as predictor variables: NP0–1.5, MaxV0–1.5, MaxV1.5–3, MaxV0–3, MeanV0–3, SdV0–1.5, SdV1.5–3, SdV0–3, SkewV1.5–3, SkewV0–3, KurtV0–1.5, KurtV1.5–3, and KurtV0–3. Where P, plot; V, voxel; 0–1.5, heights from zero to 1.5 meters; 1.5–3, heights from 1.5 to three meters; 0–3, heights from zero to three meters; N, point density; Max, maximum; Mean, mean; Sd, standard deviation; Skew, skewness; Kurt, kurtosis. The predicted categories were evaluated using the overall accuracy and the kappa index.
Second, the needs for pre-harvest clearing were estimated based on the understory stem density, the field-measured metrics of understory density being separately related to the e-questionnaire survey results and to the ALS-derived metrics. On one hand, the understory densities of the trees with NDBH1–7 were compared to the mean of the answers given in the e-questionnaire and a linear model was formulated to predict the stem density of the corresponding trees. The density distribution statistics from the ALS data presented earlier were used as predictor variables in this model, whereas the stem densities of trees with NDBH1–7 were utilized as response variables. Stepwise variable selection criteria were used to define independent variables. The continuous variables were evaluated using the coefficient of determination and the root mean squared error.
We concluded the study by determining the need for pre-harvest clearing based on the number of understory trees by comparing the predicted understory tree densities with the need for pre-harvest clearing established by the forest professionals. First, we divided the plots into the three categories presented above from the e-questionnaire survey results. Second, we performed a LDA using the field-measured understory densities of the stems with NDBH1–7 as predictor variables and the three categories from the e-questionnaire survey data as response variables. Third, we predicted the three categories based on this LDA and on the number of stems with NDBH1–7 estimated from regression model 1.
3. Results
In practice, it became obvious that the perceived need for pre-harvest clearing varied between the professionals. Categories one and five showed a high level of agreement among the professionals (87.9% and 76.8%, respectively), but in the case of categories two, three, and four, about 30% of the professionals had the same view as the average value. On the other hand, 91.2% of the respondents’ perceptions were within one category of the average value (Table 1). The understory stem density was shown to correlate with the forest professionals’ opinions given in the e-questionnaire (Figure 4a) and with the ALS data (Figure 4b).
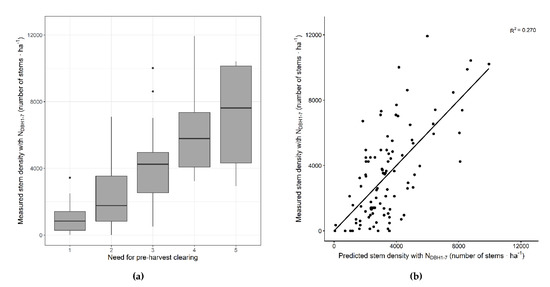
Figure 4.
(a) Box plots of the measured understory tree densities (trees with diameters at breast height from one to seven centimeters, NDBH1–7) versus the need for pre-harvest clearing based on the answers given in the e-questionnaire, being 1, no need for pre-harvest clearing; 2, pre-harvest clearing would help harvesting; 3, pre-harvest clearing recommended; 4, a great need for pre-harvest clearing; 5, compulsory pre-harvest clearing. (b) Measured stem densities of trees with NDBH1–7 versus stem densities of trees with NDBH1–7 as predicted by model 1. The solid line is a regression line.
The first concept used a LDA with cross-validation to predict the need for pre-harvest clearing (five and three categories) within the plots from the ALS density distribution statistics for the voxels. Outside the plus–minus one category of the mean value lay 21% of the plots. When there was no need for pre-harvest clearing and when the need was compulsory (categories one and five), 50.0% and 66.7% of the values were located correctly in their original class with the LDA. In the plots where pre-harvest clearing would help or is recommended (categories two and three), the distribution contained 51.9% and 60.0% of the values in other categories, with a great need for pre-harvest clearing (category four) being the one that contained the largest proportion of values in other categories (73.7%) (Table 2).
Table 2.
Need for pre-harvest clearing of understory trees in five classes based on the e-questionnaire survey mean field data values versus values estimated from the airborne laser scanning (ALS) linear discriminant analysis (LDA).
The e-questionnaire was used to classify each plot into one of five categories, but if we assume that three categories are enough for operational decision-making, we can combine some of the classes. The original categories one and two, for instance, both indicate a very low need and can just as well be combined. Class three is clearly an uncertain category, but the original classes four and five depict an evident need for pre-harvest clearing. Thus, we have three new classes (Table 3) where class one stands for little need for pre-harvest clearing; class two, for an uncertain need; and class three for an evident need.
Table 3.
Need for pre-harvest clearing of understory trees in three classes based on the e-questionnaire survey mean field data values versus values estimated from the ALS linear discriminant analysis.
When three categories were employed (Table 3), the LDA predicted them with 63.6% accuracy. In this case, it used the mean values from the e-questionnaire survey data per plot as a response variable and the next ALS density distribution statistics of the voxels as predictor variables: NP0–1.5, MaxV0–1.5, MaxV1.5–3, MaxV0–3, MinV0–3, SdV0–1.5, SdV1.5–3, SdV0–3, SkewV1.5–3, SkewV0–3, KurtV0–1.5, KurtV1.5–3, and KurtV0–3, where Min = minimum. Little need for pre-harvest clearing (category one) was the best predicted class, with an accuracy of 81.6%, whereas the accuracy was 40.0% when the need was uncertain (class two), and 52.0% when it was evident (class three). Cohen’s kappa is 0.26 in Table 2 and 0.39 in Table 3, and the weighted kappa is 0.48 and 0.47, respectively.
The second concept used a linear model to predict the number of stems within the diameter range from one to seven centimeters (NDBH1–7, model 1). This was:
NDBH1–7 = 2102.343 − 451.017 × NP1.5–3 − 230.582 × MaxV0–1.5 + 625.300 × MaxV1.5–3 + 207.317 × MaxV0–3 − 210.453 × MeanV0–1.5 + 12992.500 × MeanV1.5–3 + 1425.248 × SdV0–1.5 − 3099.624 × SdV1.5–3 − 1131.531 × SdV0–3 − 2283.163 × SkewV0–1.5 + 1953.650 × SkewV1.5–3 + 1753.099 × KurtV0–1.5 − 450.967 × KurtV1.5–3 − 971.578 × KurtV0–3
The 5-fold cross-validation based relative root mean squared error of model 1 was 75.8%, the residual standard error was 2620 stems·ha−1, and the adjusted coefficient of determination was 0.270. In order to determine the need for pre-harvest clearing based on the understory stem density, the trees used for prediction with regression model 1, NDBH1–7, were classified into three categories using field data-based LDA categories. Model 1 determined the need for pre-harvest clearing with an accuracy of 64.6% (Table 4).
Table 4.
Need for pre-harvest clearing of understory trees in three classes based on the e-questionnaire survey mean field data values versus the values estimated from the ALS model 1 and field data-based LDA categories.
4. Discussion
Pre-harvest clearing is needed when forest stands have an understory vegetation that impedes harvesting operations. In order to determine when this is so, it is necessary to visit the forest, which is nowadays considered too laborious and expensive. On the other hand, ALS data are now fairly readily available in Scandinavia, offering an attractive alternative for assessing the need for pre-harvest clearing without field visits and to support the planning of harvesting operations. Since it can be assumed that the availability and quality of ALS data will improve further in the near future, the approaches presented here could very well support forestry operations.
The usability of optical remote sensing data is limited for the determination of the spatial pattern of all trees [34,35]. Empirical discernibility has been modeled using discernibility-functions by [36]. The discernibility-sigmoid-model is assumed to model omission errors in 3D tree top positioning. These are omissions due to occlusion, shading, and overlapping crowns. High-sampling-rate ALS data with a small footprint size, will be superior in comparison to passive image data [37]. Shadows do not cause a problem with ALS data as they seem to do in aerial images. Problems caused by overlapping crowns and occlusion are shared by both ALS data and aerial images.
When we predicted the number of understory trees with NDBH1–7 with regression model 1 using the ABA, we had a relative error of 75.8%, which is not directly sufficient for decision making. However, when the estimates were converted into the three categories used in decision making, the accuracy of the classification was reasonable (64.6%). Other researchers who have estimated the understory vegetation by means of ALS data (see Figure 5) have reported that the species, height, and crown shape of the neighboring tall trees had a great influence on the rate of detection of the suppressed trees [22]. Point density also decreased in the lower canopy layers, depending significantly on the number of layers [21]. Typically, results are affected by the variation of the tree size structure. Su and Bork [38] used an average density of 0.54 pulses·m−2 and were not capable of precisely estimating the understory vegetation cover and height. When pulse densities between one and 10 pulses·m−2 were used, the variation of the identification rate was 38–70% for intermediate trees, and 14–30% for suppressed trees [22,31,39]. Several authors have also used average densities between 10 and 20 pulses·m−2. Maltamo et al. [40] detected less than 40% of the understory trees, and Maltamo et al. [30] succeeded in recognizing the density and height of understory trees with regression models that had a coefficient of determination of 0.87 for the density and of 0.76 for the height. Vega et al. [41] detected 41%, 42%, and 50% of the dominated trees in three forest types. Paris et al. [42] detected 71.8% of the understory trees. When a very high density of 50 pulses·m−2 was applied, it is possible to detect 68% of the understory trees [21]. In addition, Duncanson et al. [43] utilized very high pulse density with detection rates of 35% for the intermediate trees and 21% for the suppressed trees.
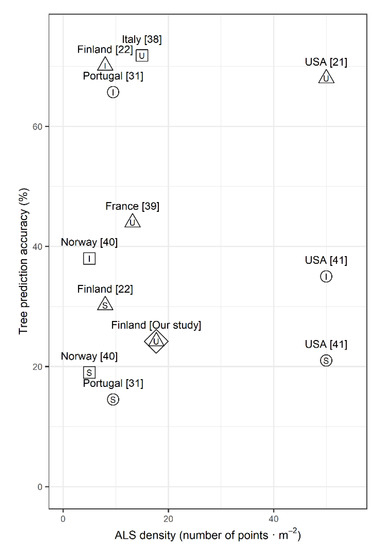
Figure 5.
Tree prediction accuracy, and average airborne laser scanning (ALS) point density as reported in various countries. Symbols: I, intermediate trees; S, suppressed trees; U, understory trees; square, coniferous forest; circle, deciduous forest; triangle, coniferous and deciduous forest; rhombus, our study.
The Optech Titan sensor used here represents the latest development in ALS technology. We did not use the spectral information provided by the available multispectral ALS data in this study, but we did benefit from its high point density, which was used when estimating the need for pre-harvest clearing. Similarly, Dalponte et al. [44], who explored the potential of this sensor for modeling and predicting forest characteristics at the plot level (e.g., the number of trees per hectare), stated that multispectral ALS data were useful for predicting the forest characteristics considered in their work and had great potential for use in forestry and ecological applications.
Many forest companies have distinct guidelines for the pre-harvest clearing of understory vegetation, but the need for this and its assessment are considered controversial for a number of reasons. Studies differ in the size of the understory, the proportion of the various tree species in it, the working methods of the harvester operator, the harvesting machinery that is used, the time interval between pre-clearance and harvesting, and the seasons when the various operations are carried out [8]. In any case, it is important to note that the understory trees that are located between the machine and the stem to be harvested will more probably hinder the operator’s visibility and the movement of the harvester head than any other understory trees [8].
Our results show that the stem number-based approach differs slightly from direct estimates of the need for pre-harvest clearing. Both can be used to support forest operations, but direct need-based estimation (LDA) should cover all the aspects that are of importance for operators, while the stem number-based approach requires clear criteria and should be tested further. In the latter approach, the understory density was estimated for trees with NDBH1–7 (model 1). The regression model might be overfitted. However, forest structure in Finland is very heterogeneous and visibility below the main canopy layer requires detailed information from various height zones. Further studies are needed to investigate optimized and stable biometric models for this purpose. Both approaches estimated the need for pre-harvest clearing with an accuracy of 64% when three classes were considered. Validation was based on 5-fold cross-validation without an independent set of data. There is need to test the methodology with different forest structures and datasets in the future.
LDA can be used directly when taking forest management decisions, and likewise, regression model 1 could be employed directly for decision making if we had clear criteria for determining the amount of interference from the understory vegetation. In this case, however, our material did not include many dense stands. Kärhä [45] states that in operational forestry, the cutting work is hindered when the understory of more than 1.5 m in height exceeds 1100–2000 stems·ha−1, and pre-clearance should be carried out in such cases. On the other hand, Bergström et al. [9], evaluating the effects of the density of the understory on the operational efficiency of a bundle harvester in early fuelwood thinnings in northern Sweden, showed that pre-clearance had no significant effect on the time taken up by harvesting and bundling work. Their understory trees had a diameter below 2.5 cm at breast height, however, and the biomass removed was collected into bioenergy bundles. Furthermore, it should be noted that a bundle harvester can be used for energy wood thinning, but not for CTL harvesting.
The reference material for this study of the needs for pre-harvest clearing was collected from an e-questionnaire answered by forest professionals. The survey had five answers instead of three to avoid losing resolution. For instance, class four means that harvesting is very difficult but possible, whereas class five implies that it is not possible without pre-clearing. Table 1 shows that there is a clear distinction between these classes: if there were no differences, classes four and five could be merged. For operational decision making, however, three categories are enough to separate two reliable categories and one uncertain category for further inspections. The forest professionals had to choose between five categories instead of three. If they had the chance to decide between three categories, their answers may have been different from the ones we assumed. Nevertheless, we believe that most of their responses would have been similar to the classification we created when we reduced the number of categories from five to three. The perceptions of the need for pre-harvest clearing expressed by forest professionals and the variations in these are dependent on personal preferences (i.e., some professionals are willing to adapt to different circumstances whereas others require more stable conditions). The method could point reliably to plots that have little need for pre-harvest clearing and those that do have a need for it, although there were several plots here where the need existed, but was fairly low, and then it was rather difficult to determine the necessity for clearing. For that reason, some flexibility based on current resources should be retained in decisions as to whether pre-harvest clearing should be carried out or not within a given stand.
5. Conclusions
In conclusion, information gathered with the methodology proposed here could (1) reduce the need for field visits and therefore reduce costs, (2) offer a basis for improving the guidelines for the pre-harvest clearing of understory vegetation, and (3) assist in the performing of electronic standing sales transactions.
Author Contributions
Conceptualization, T.T., B.S., J.M., and J.H.; Methodology, T.T., B.S., J.M., and J.H.; Software, B.S.; Validation, T.T., B.S., and J.M.; Formal analysis, B.S.; Investigation, B.S. and J.H.; Resources, B.S.; Data curation, B.S.; Writing—original draft preparation, B.S.; Writing—review and editing, B.S., T.T., J.M., and J.H.; Visualization, B.S.; Supervision, T.T. and J.M.; Project administration, T.T. and J.M.; Funding acquisition, T.T. and J.M. All authors have read and agreed upon the published version of the manuscript.
Funding
This research was funded by the Doctoral Program in Forests and Bioresources at the University of Eastern Finland.
Acknowledgments
The authors thank Malcolm Hicks, Lauri Korhonen, Arttu Laide, and Matias Vänttinen for their help and support. We also acknowledge the forest professionals who answered the e-questionnaire, and Oy Arbonaut Ltd. for letting us use the ArboLiDAR software.
Conflicts of Interest
The authors declare no conflicts of interest.
References
- Kärhä, K.; Rönkkö, E.; Gumse, S.-I. Productivity and Cutting Costs of Thinning Harvesters. Int. J. For. Eng. 2004, 15, 43–56. [Google Scholar] [CrossRef]
- Nurminen, T.; Korpunen, H.; Uusitalo, J. Time consumption analysis of the mechanized cut-to-length harvesting system. Silva Fenn. 2006, 40, 335–363. [Google Scholar] [CrossRef]
- Jiroušek, R.; Klvač, R.; Skoupý, A. Productivity and costs of the mechanised cut-to-length wood harvesting system in clear-felling operations. J. For. Sci. 2007, 53, 476–482. [Google Scholar] [CrossRef]
- Eriksson, M.; Lindroos, O. Productivity of harvesters and forwarders in CTL operations in northern Sweden based on large follow-up datasets. Int. J. For. Eng. 2014, 25, 179–200. [Google Scholar] [CrossRef]
- Nordfjell, T.; Björheden, R.; Thor, M.; Wästerlund, I. Changes in technical performance, mechanical availability and prices of machines used in forest operations in Sweden from 1985 to 2010. Scand. J. For. Res. 2010, 25, 382–389. [Google Scholar] [CrossRef]
- Ovaskainen, H. Timber harvester operators’ working technique in first thinning and the importance of cognitive abilities on work productivity. Diss. For. 2009, 79, 62. [Google Scholar] [CrossRef]
- Malinen, J.; Taskinen, J.; Tolppa, T. Productivity of Cut-to-Length Harvesting by Operators’ Age and Experience. Croat. J. For. Eng. 2018, 39, 15–22. [Google Scholar]
- Kärhä, K. Effect of undergrowth on the harvesting of first-thinning wood. For. Stud. 2006, 45, 101–117. [Google Scholar]
- Bergström, D.; Di Fulvio, F.; Nuutinen, Y. Effect of Forest Structure on Operational Efficiency of a Bundle-Harvester System in Early Thinnings. Croat. J. For. Eng. 2016, 37, 37–49. [Google Scholar]
- Oikari, M.; Kärhä, K.; Palander, T.; Pajuoja, H.; Ovaskainen, H. Analyzing the views of wood harvesting professionals related to the approaches for increasing the cost-efficiency of wood harvesting from young stands. Silva Fenn. 2010, 44, 481–495. [Google Scholar] [CrossRef]
- Anon. Hakkuukonetyömaan Ennakkoraivaus (Pre-Clearance of Mechanised Harvesting Sites); Metsäteho’s Guidebook: Helsinki, Finland, 2001; pp. 1–8. (In Finnish) [Google Scholar]
- Granskog, J.E.; Anderson, W.C. Dense Undergrowth Reduces Feller-Buncher Productivity in Shortleaf Pine Plantations; US Department of Agriculture, Forest Service, Southern Forest Experiment Station: New Orleans, LA, USA, 1981; pp. 1–4.
- Næsset, E. Determination of mean tree height of forest stands using airborne laser scanner data. ISPRS J. Photogramm. Remote Sens. 1997, 52, 49–56. [Google Scholar] [CrossRef]
- Nelson, R.; Krabill, W.; MacLean, G. Determining forest canopy characteristics using airborne laser data. Remote Sens. Environ. 1984, 15, 201–212. [Google Scholar] [CrossRef]
- Næsset, E.; Gobakken, T.; Holmgren, J.; Hyyppä, H.; Hyyppä, J.; Maltamo, M.; Nilsson, M.; Olsson, H.; Persson, Å.; Söderman, U. Laser scanning of forest resources: The nordic experience. Scand. J. For. Res. 2004, 19, 482–499. [Google Scholar] [CrossRef]
- Korhonen, L.; Peuhkurinen, J.; Malinen, J.; Suvanto, A.; Maltamo, M.; Packalén, P.; Kangas, J. The use of airborne laser scanning to estimate sawlog volumes. Forestry 2008, 81, 499–510. [Google Scholar]
- Maltamo, M.; Næsset, E.; Vauhkonen, J. (Eds.) Forestry Applications of Airborne Laser Scanning: Concepts and Case Studies. Manag. For. Ecosyst. 2014, 27, 460. [Google Scholar]
- Sanz, B.; Malinen, J.; Leppänen, V.; Valbuena, R.; Kauranne, T.; Tokola, T. Valuation of growing stock using multisource GIS data, a stem quality database, and bucking simulation. Can. J. For. Res. 2018, 48, 888–897. [Google Scholar] [CrossRef]
- Sun, Y.; Huang, J.; Ao, Z.; Lao, D.; Xin, Q. Deep Learning Approaches for the Mapping of Tree Species Diversity in a Tropical Wetland Using Airborne LiDAR and High-Spatial-Resolution Remote Sensing Images. Forests 2019, 10, 1047. [Google Scholar] [CrossRef]
- Maltamo, M.; Eerikäinen, K.; Packalén, P.; Hyyppä, J. Estimation of stem volume using laser scanning-based canopy height metrics. Forestry 2006, 79, 217–229. [Google Scholar] [CrossRef]
- Hamraz, H.; Contreras, M.A.; Zhang, J. Vertical stratification of forest canopy for segmentation of understory trees within small-footprint airborne LiDAR point clouds. ISPRS J. Photogramm. Remote Sens. 2017, 130, 385–392. [Google Scholar] [CrossRef]
- Wang, Y.; Hyyppä, J.; Liang, X.; Kaartinen, H.; Yu, X.; Lindberg, E.; Holmgren, J.; Qin, Y.; Mallet, C.; Ferraz, A.; et al. International Benchmarking of the Individual Tree Detection Methods for Modeling 3-D Canopy Structure for Silviculture and Forest Ecology Using Airborne Laser Scanning. IEEE Trans. Geosci. Remote Sens. 2016, 54, 5011–5027. [Google Scholar] [CrossRef]
- Anderson, K.; Hancock, S.; Disney, M.; Gaston, K.J. Is waveform worth it? A comparison of LiDAR approaches for vegetation and landscape characterization. Remote Sens. Ecol. Conserv. 2016, 2, 5–15. [Google Scholar] [CrossRef]
- Crespo-Peremarch, P.; Tompalski, P.; Coops, N.C.; Ruiz, L.Á. Characterizing understory vegetation in Mediterranean forests using full-waveform airborne laser scanning data. Remote Sens. Environ. 2018, 217, 400–413. [Google Scholar] [CrossRef]
- McCombs, J.W.; Roberts, S.D.; Evans, D.L. Influence of Fusing Lidar and Multispectral Imagery on Remotely Sensed Estimates of Stand Density and Mean Tree Height in a Managed Loblolly Pine Plantation. For. Sci. 2003, 49, 457–466. [Google Scholar]
- Peuhkurinen, J.; Mehtätalo, L.; Maltamo, M. Comparing individual tree detection and the area-based statistical approach for the retrieval of forest stand characteristics using airborne laser scanning in Scots pine stands. Can. J. For. Res. 2011, 41, 583–598. [Google Scholar] [CrossRef]
- Korpela, I.; Hovi, A.; Morsdorf, F. Understory trees in airborne LiDAR data—Selective mapping due to transmission losses and echo-triggering mechanisms. Remote Sens. Environ. 2012, 119, 92–104. [Google Scholar] [CrossRef]
- Alam, M.M.; Strandgard, M.N.; Brown, M.W.; Fox, J.C. Improving the productivity of mechanised harvesting systems using remote sensing. Aust. For. 2012, 75, 238–245. [Google Scholar] [CrossRef]
- Zimble, D.A.; Evans, D.L.; Carlson, G.C.; Parker, R.C.; Grado, S.C.; Gerard, P.D. Characterizing vertical forest structure using small-footprint airborne LiDAR. Remote Sens. Environ. 2003, 87, 171–182. [Google Scholar] [CrossRef]
- Maltamo, M.; Packalén, P.; Yu, X.; Eerikäinen, K.; Hyyppä, J.; Pitkänen, J. Identifying and quantifying structural characteristics of heterogeneous boreal forests using laser scanner data. For. Ecol. Manag. 2005, 216, 41–50. [Google Scholar] [CrossRef]
- Ferraz, A.; Bretar, F.; Jacquemoud, S.; Gonçalves, G.; Pereira, L.; Tomé, M.; Soares, P. 3-D mapping of a multi-layered Mediterranean forest using ALS data. Remote Sens. Environ. 2012, 121, 210–223. [Google Scholar] [CrossRef]
- Fridman, J.; Holm, S.; Nilsson, M.; Nilsson, P.; Ringvall, A.H.; Ståhl, G. Adapting National Forest Inventories to changing requirements—the case of the Swedish National Forest Inventory at the turn of the 20th century. Silva Fenn. 2014, 48, 1–29. [Google Scholar] [CrossRef]
- Axelsson, P. DEM generation from laser scanner data using adaptive TIN models. In Proceedings of the International Archives of Photogrammetry and Remote Sensing, Amsterdam, The Netherlands, 16–22 July 2000; pp. 110–117. [Google Scholar]
- Uuttera, J.; Haara, A.; Tokola, T.; Maltamo, M. Determination of the spatial distribution of trees from digital aerial photographs. For. Ecol. Manag. 1998, 110, 275–282. [Google Scholar] [CrossRef]
- Maltamo, M.; Tokola, T.; Lehikoinen, M. Estimating stand characteristics by combining single tree pattern recognition of digital video imagery and a theoretical diameter distribution model. For. Sci. 2003, 49, 98–109. [Google Scholar]
- Korpela, I. Individual tree measurements by means of digital aerial photogrammetry. Silva Fenn. Monographs 2004, 3, 1–93. [Google Scholar]
- Persson, Å.; Holmgren, J.; Söderman, U. Detecting and measuring individual trees using an airborne laser scanner. Photogramm. Eng. Remote Sens. 2002, 68, 925–932. [Google Scholar]
- Su, J.G.; Bork, E.W. Characterization of diverse plant communities in Aspen Parkland rangeland using LiDAR data. Appl. Veg. Sci. 2007, 10, 407–416. [Google Scholar] [CrossRef]
- Solberg, S.; Naesset, E.; Bollandsas, O.M. Single Tree Segmentation Using Airborne Laser Scanner Data in a Structurally Heterogeneous Spruce Forest. Photogramm. Eng. Remote Sens. 2006, 72, 1369–1378. [Google Scholar] [CrossRef]
- Maltamo, M.; Mustonen, K.; Hyyppä, J.; Pitkänen, J.; Yu, X. The accuracy of estimating individual tree variables with airborne laser scanning in a boreal nature reserve. Can. J. For. Res. 2004, 34, 1791–1801. [Google Scholar] [CrossRef]
- Vega, C.; Hamrouni, A.; El Mokhtari, S.; Morel, J.; Bock, J.; Renaud, J.P.; Bouvier, M.; Durrieu, S. PTrees: A point-based approach to forest tree extraction from lidar data. Int. J. Appl. Earth Obs. Geoinf. 2014, 33, 98–108. [Google Scholar] [CrossRef]
- Paris, C.; Valduga, D.; Bruzzone, L. A Hierarchical Approach to Three-Dimensional Segmentation of LiDAR Data at Single-Tree Level in a Multilayered Forest. IEEE Trans. Geosci. Remote Sens. 2016, 54, 4190–4203. [Google Scholar] [CrossRef]
- Duncanson, L.I.; Cook, B.D.; Hurtt, G.C.; Dubayah, R.O. An efficient, multi-layered crown delineation algorithm for mapping individual tree structure across multiple ecosystems. Remote Sens. Environ. 2014, 154, 378–386. [Google Scholar] [CrossRef]
- Dalponte, M.; Ene, L.T.; Gobakken, T.; Næsset, E.; Gianelle, D. Predicting selected forest stand characteristics with multispectral ALS data. Remote Sens. 2018, 10, 586. [Google Scholar] [CrossRef]
- Kärhä, K. Towards better pre-clearance guideline of undergrowth in first thinnings: Case study of Stora Enso Wood Supply Finland. In Forest Engineering: “Making a positive contribution”. In Proceedings of the 48th Symposium on Forest Mechanization, Linz, Austria, 4–8 October 2015; pp. 63–67. [Google Scholar]


© 2020 by the authors. Licensee MDPI, Basel, Switzerland. This article is an open access article distributed under the terms and conditions of the Creative Commons Attribution (CC BY) license (http://creativecommons.org/licenses/by/4.0/).