High Nitrate or Ammonium Applications Alleviated Photosynthetic Decline of Phoebe bournei Seedlings under Elevated Carbon Dioxide

Abstract
1. Introduction
2. Materials and Methods
2.1. Plant Materials and Fertilizer
2.2. Experimental Treatments
2.3. Determination of Gas Exchange
2.4. Determination of Chlorophyll Fluorescence
2.5. Determination of Chlorophyll and Key Photosynthetic Enzyme content
2.6. Determination of Leaf Anatomy and Stomatal Density
2.7. Statistical Analysis
3. Results
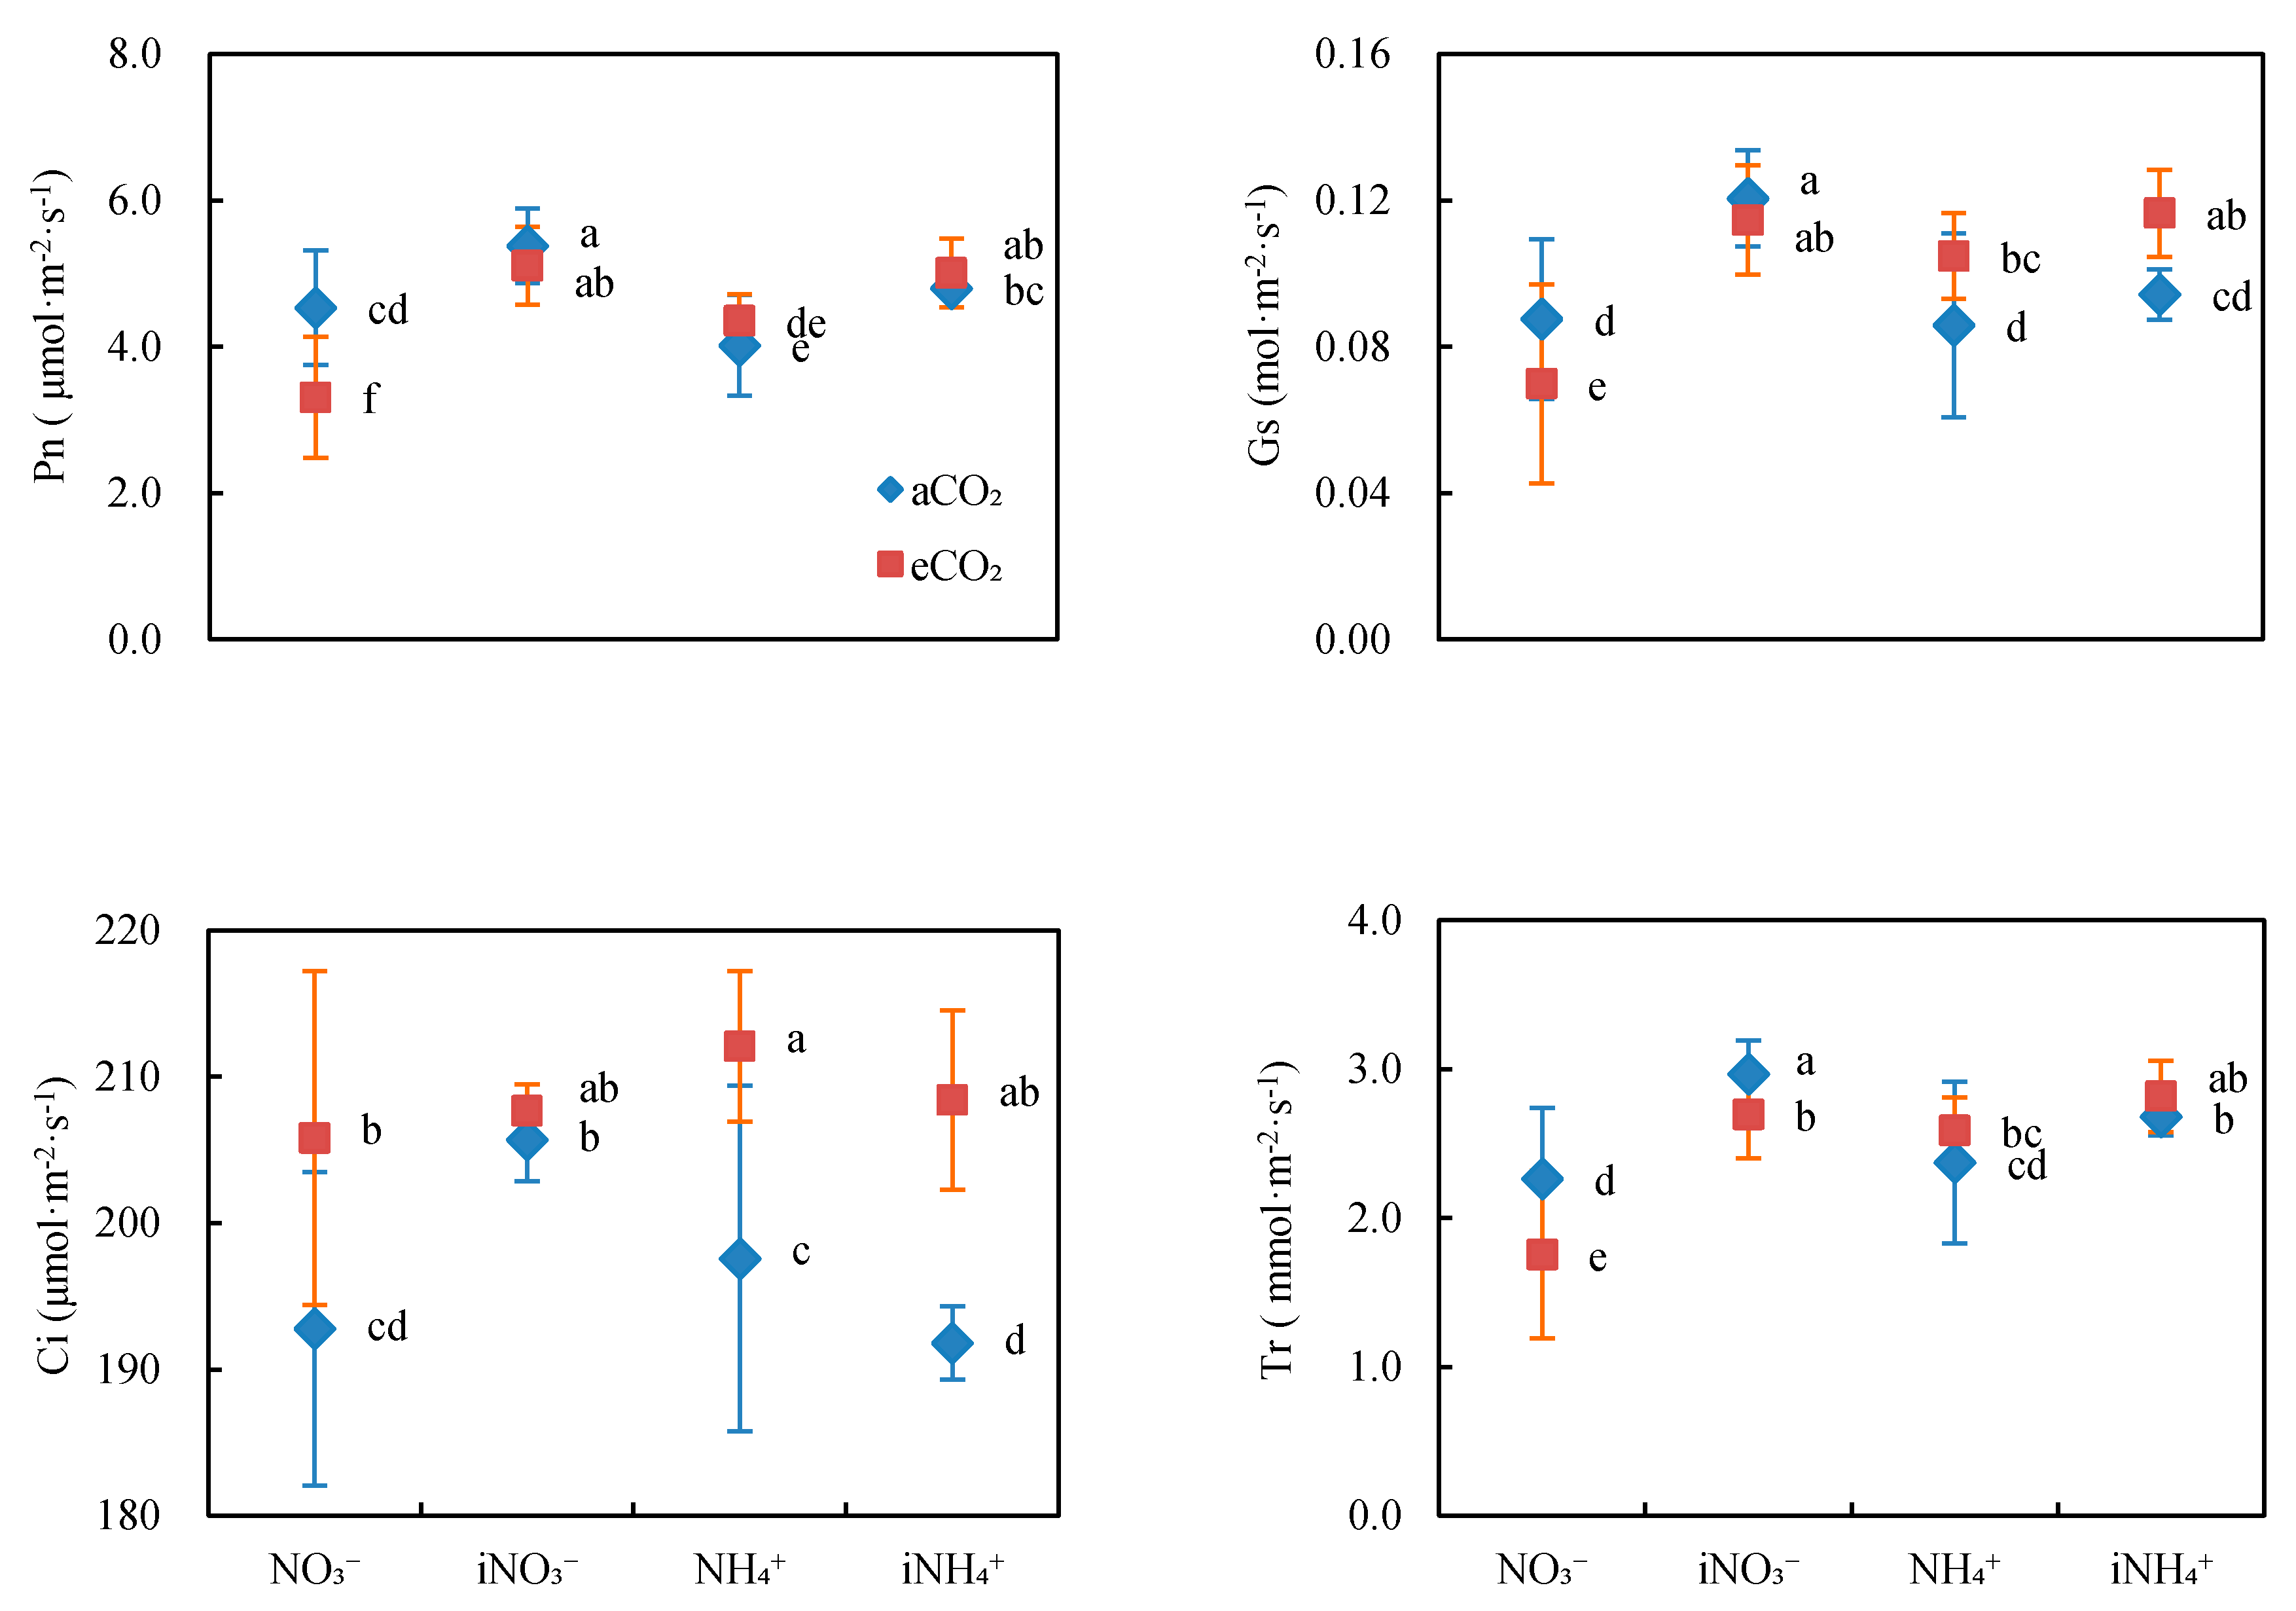
3.1. Gas Exchange
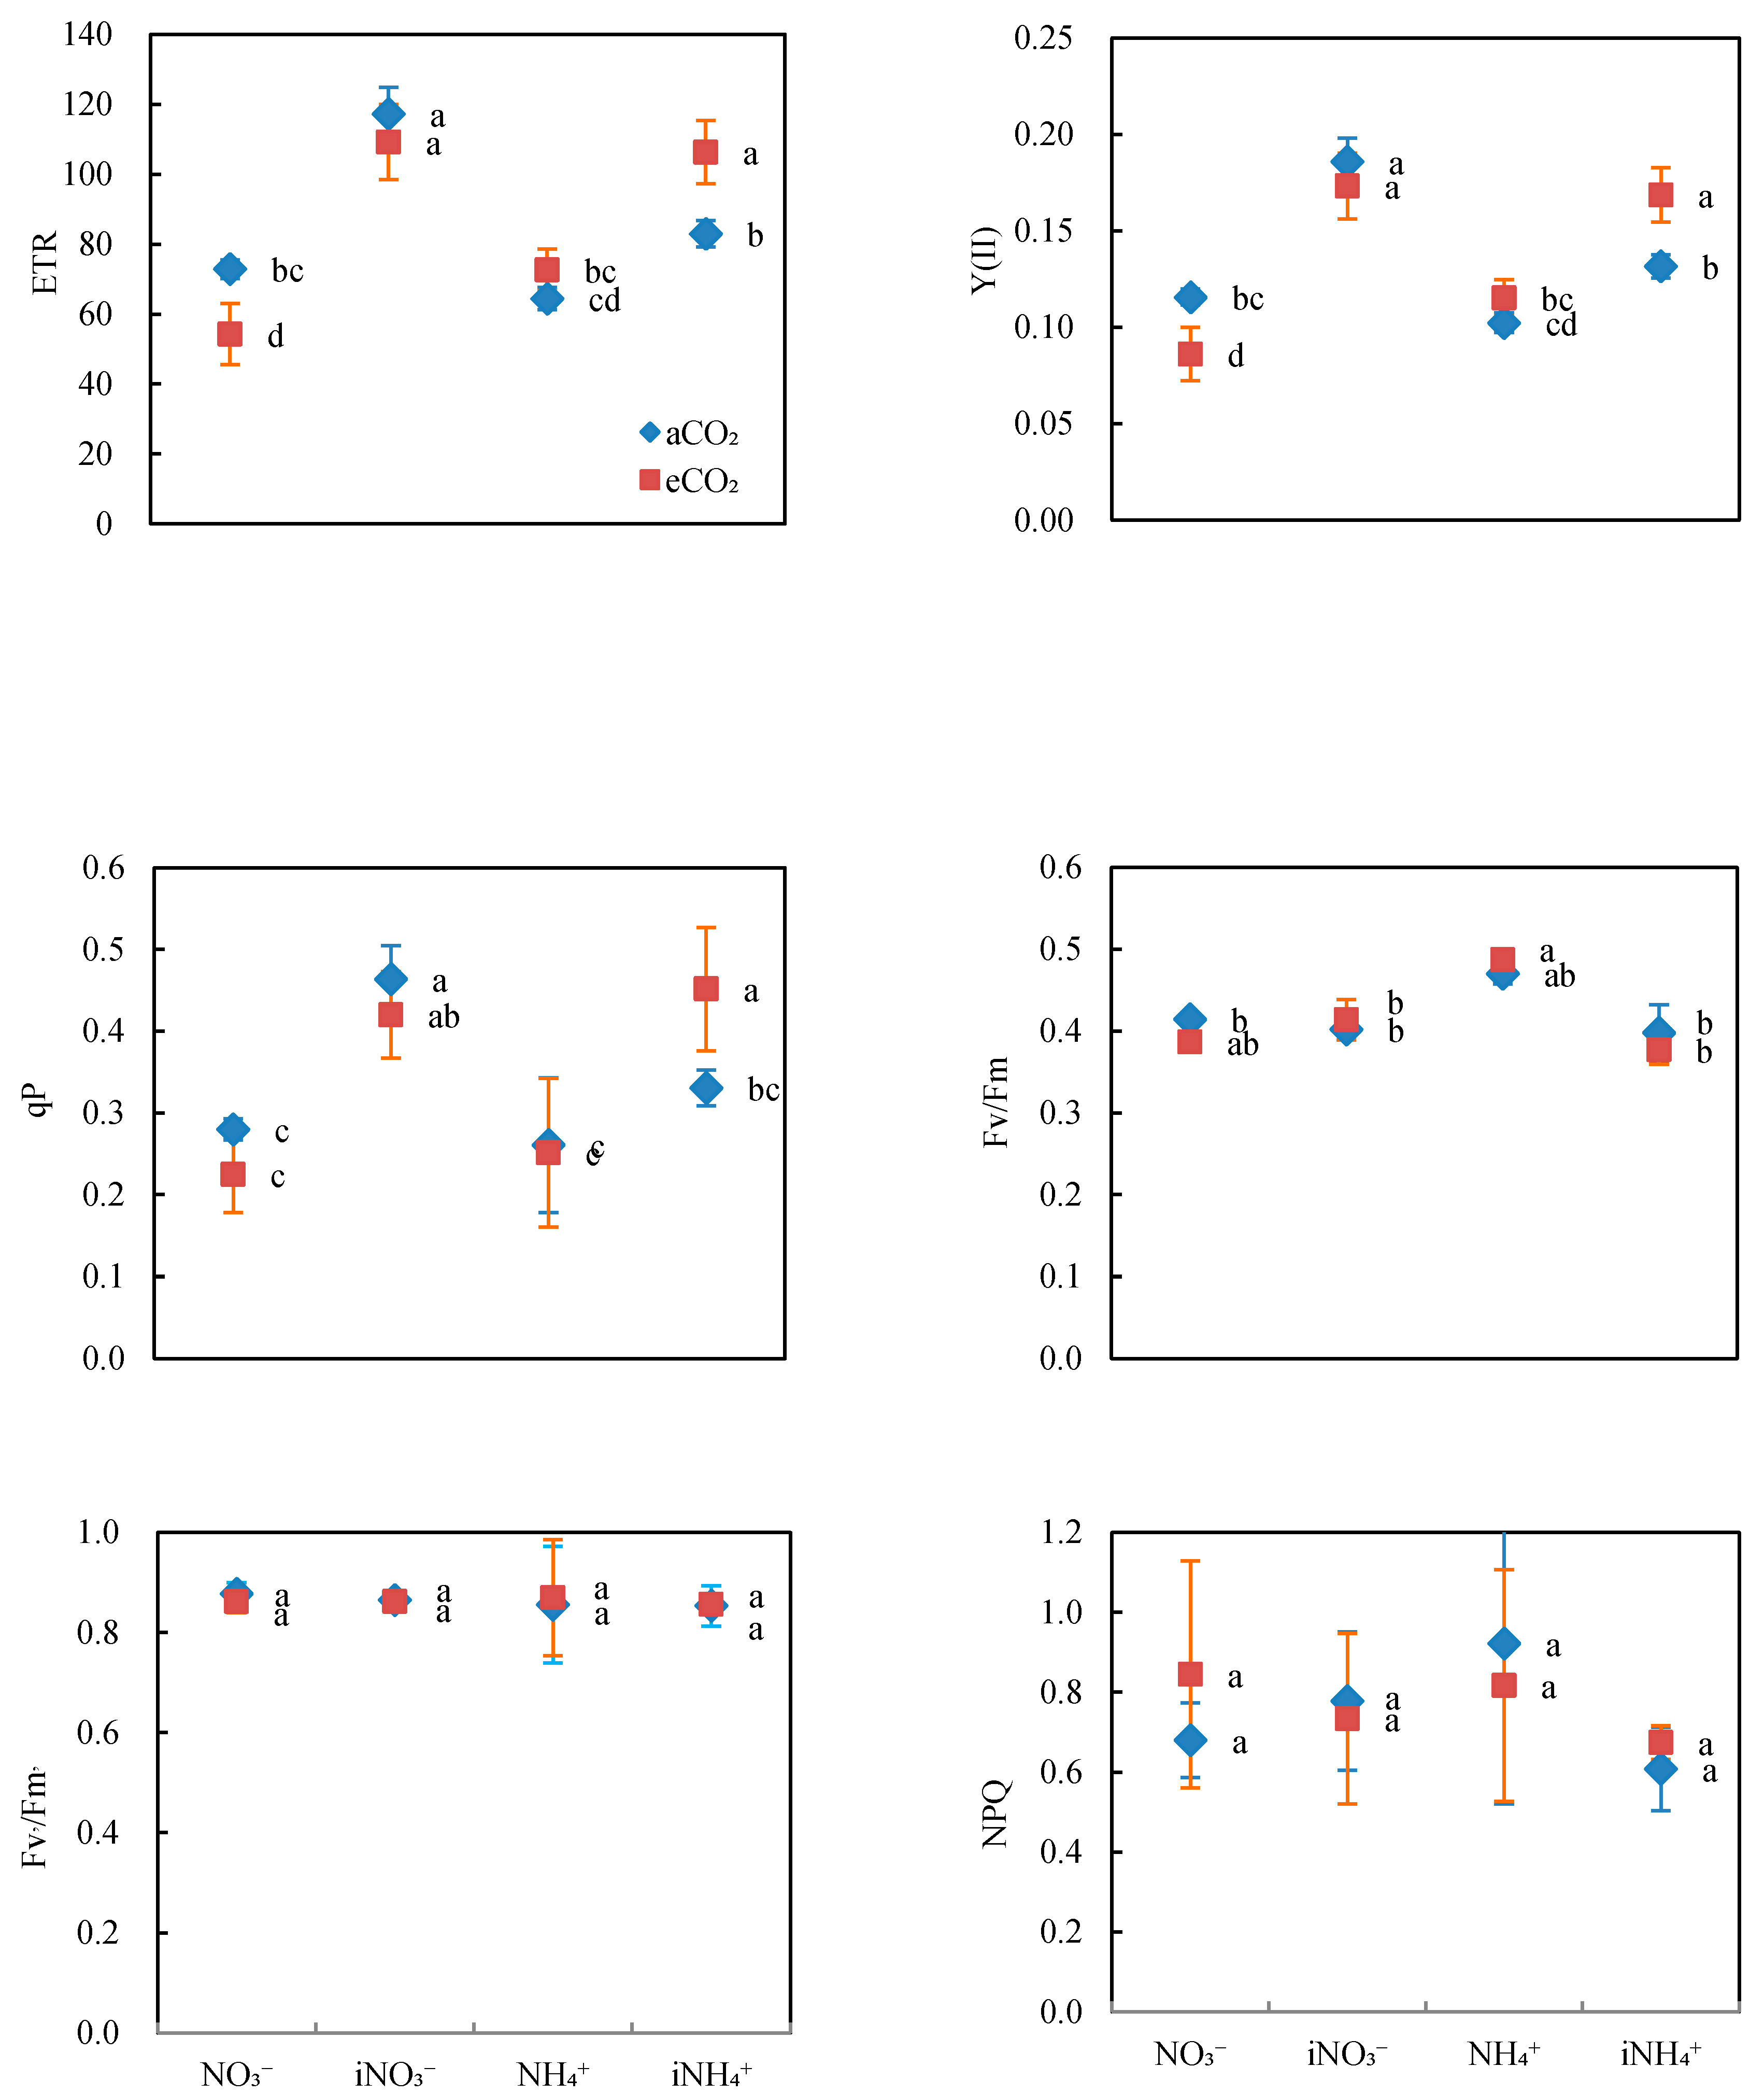
3.2. Chlorophyll Fluorescence
3.3. Chlorophyll Content
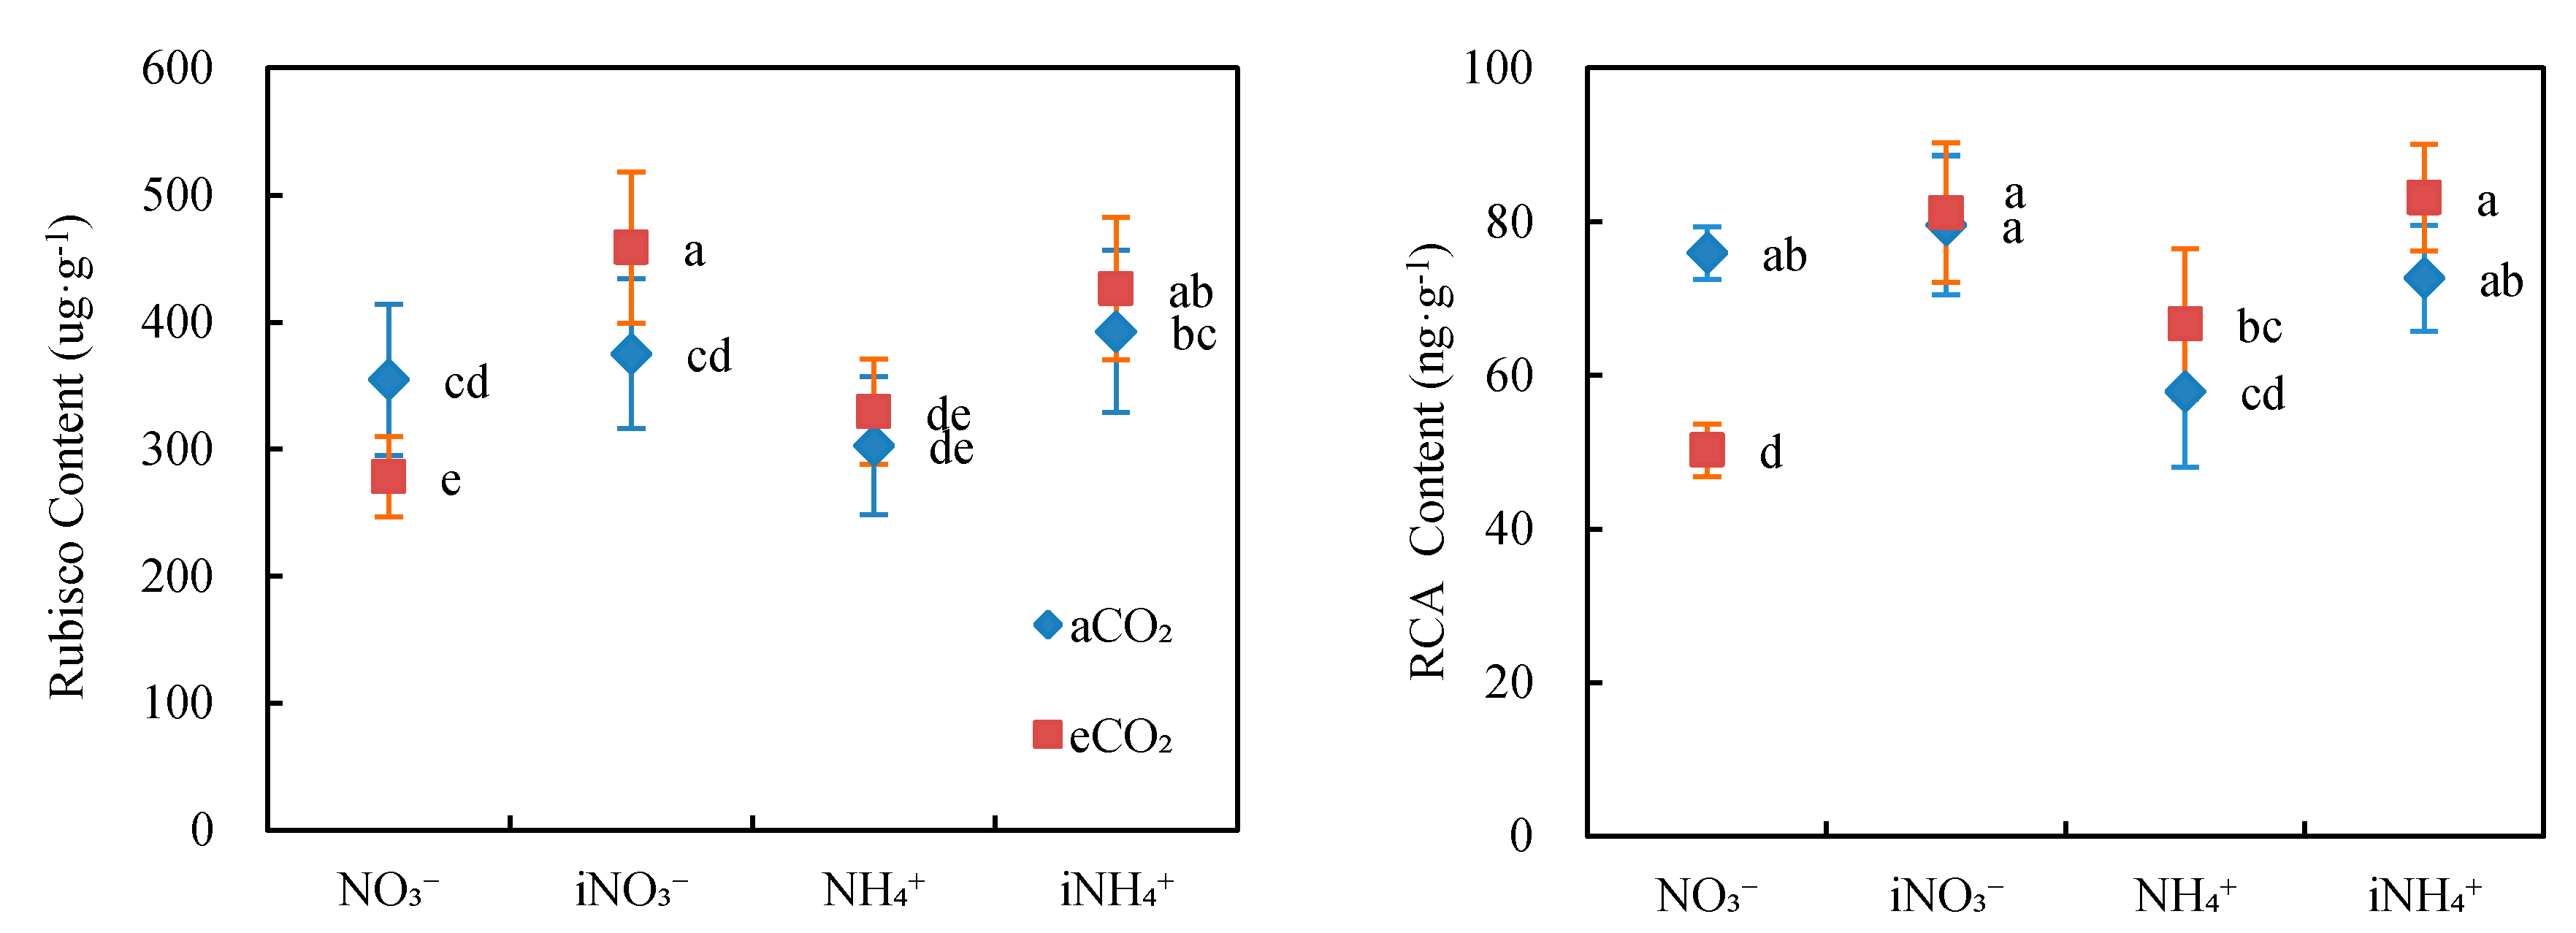
3.4. Content of Key Photosynthetic Enzymes
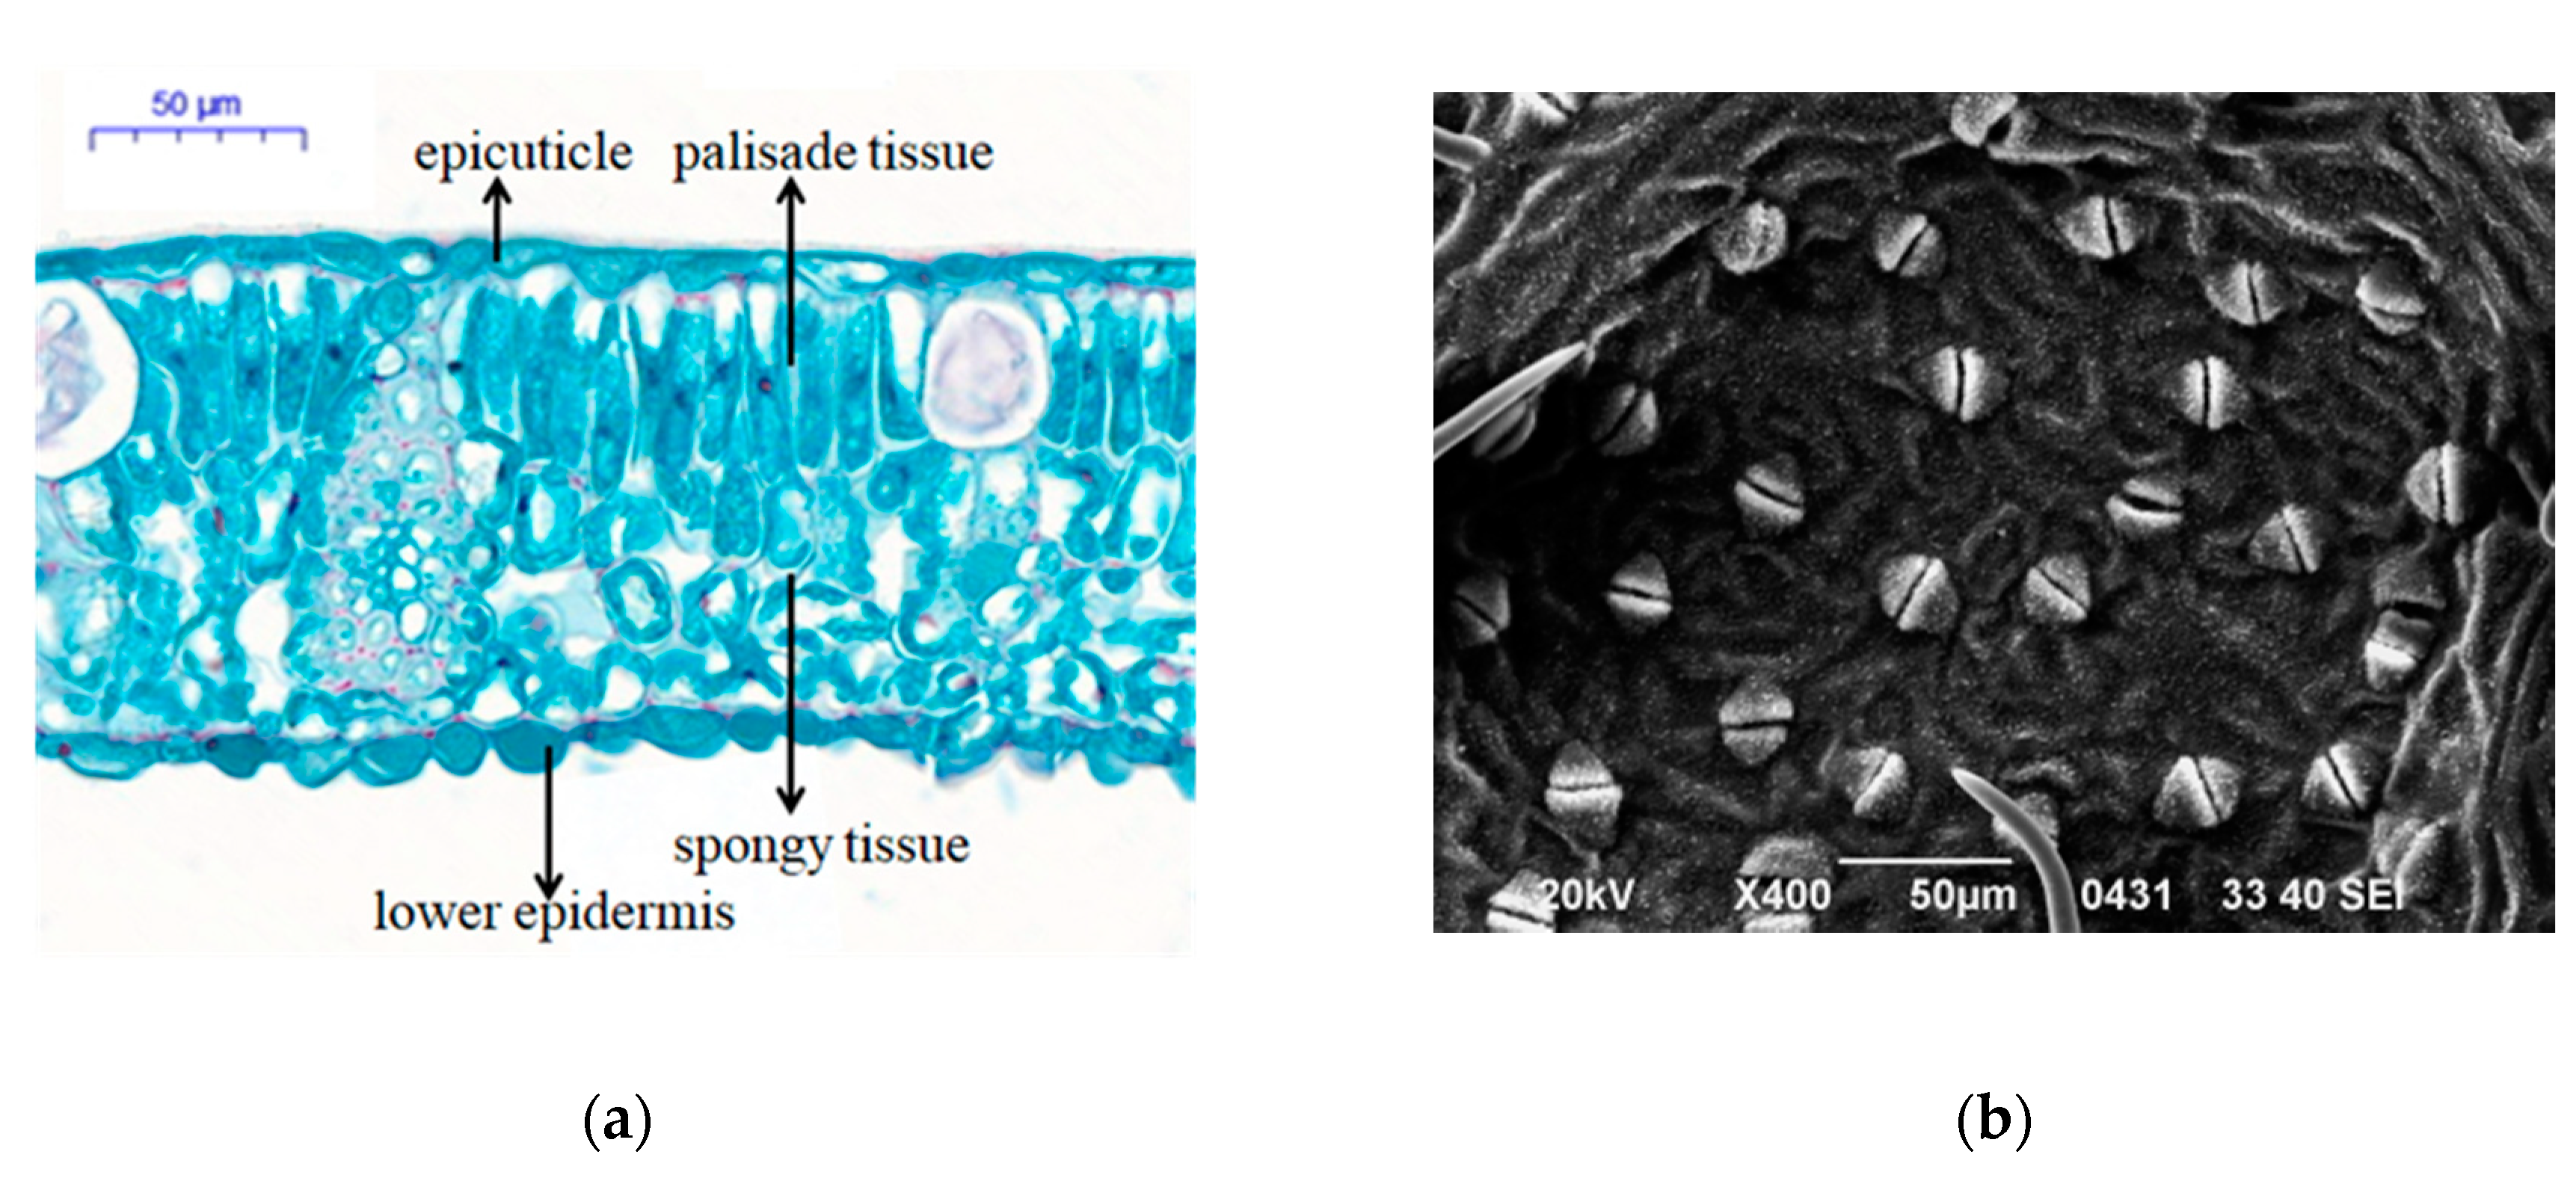
3.5. Leaf Anatomical Structure and Stomatal Density
4. Discussion
5. Conclusions
Author Contributions
Funding
Acknowledgments
Conflicts of Interest
References
- Landry, J.S.; Matthews, H.D. Non-deforestation fire vs. fossil fuel combustion: The source of CO2 emissions affects the global carbon cycle and climate responses. Biogeosciences 2016, 13, 2137–2149. [Google Scholar] [CrossRef]
- De Graaff, M.A.; Van Groenigen, K.J.; Six, J.; Hungate, B.; Van Kessel, C. Interactions between plant growth and soil nutrient cycling under elevated CO2: A meta-analysis. Glob. Chang. Biol. 2006, 12, 2077–2091. [Google Scholar] [CrossRef]
- Aranjuelo, I.; Pardo, A.; Biel, C.; Savé, R.; Azcón-bieto, J.; Nogués, S. Leaf carbon management in slow-growing plants exposed to elevated CO2. Glob. Chang. Biol. 2009, 15, 97–109. [Google Scholar] [CrossRef]
- Intergovernmental Panel on Climate Change. Climate Change 2014: Impacts, Adaptation, and Vulnerability. Part B: Regional Aspects; Contribution of Working Group II to the Fifth Assessment Report of the Intergovernmental Panel on Climate Change; Cambridge University Press: Cambridge, UK, 2014. [Google Scholar]
- Norby, R.J.; Zak, D.R. Ecological lessons from free-air CO2 enrichment (FACE) experiments. Annu. Rev. Ecol. Evol. Syst. 2011, 42, 181–203. [Google Scholar] [CrossRef]
- Long, S.P.; Ainsworth, E.A.; Rogers, A.; Ort, D.R. Rising atmospheric carbon dioxide: Plants FACE the future. Annu. Rev. Plant Biol. 2004, 55, 591–628. [Google Scholar] [CrossRef] [PubMed]
- Zhu, P.; Zhuang, Q.; Ciais, P.; Welp, L.; Li, W.; Xin, Q. Elevated atmospheric CO2 negatively impacts photosynthesis through radiative forcing and physiology-mediated climate feedback. Geophys. Res. Lett. 2017, 44, 1956–1963. [Google Scholar] [CrossRef]
- Yu, T.; Chen, Y. Effects of elevated carbon dioxide on environmental microbes and its mechanisms: A review. Sci. Total Environ. 2019, 655, 865–879. [Google Scholar] [CrossRef]
- Quentin, A.G.; Crous, K.Y.; Barton, C.V.; Ellsworth, D.S. Photosynthetic enhancement by elevated CO2 depends on seasonal temperatures for warmed and non-warmed Eucalyptus globulus trees. Tree Physiol. 2015, 35, 1249–1263. [Google Scholar]
- DaMatta, F.M.; Godoy, A.G.; Menezes-Silva, P.E.; Martins, S.C.; Sanglard, L.M.; Morais, L.E.; Torre-Neto, A.; Ghini, R. Sustained enhancement of photosynthesis in coffee trees grown under free-air CO2 enrichment conditions: Disentangling the contributions of stomatal, mesophyll, and biochemical limitations. J. Exp. Bot. 2016, 67, 341–352. [Google Scholar] [CrossRef]
- Davidson, A.M.; Da Silva, D.; Saa, S.; Mann, P.; DeJong, T.M. The influence of elevated CO2 on the photosynthesis, carbohydrate status, and plastochron of young peach (Prunuspersica) trees. Hortic. Environ. Biotechnol. 2016, 57, 364–370. [Google Scholar] [CrossRef]
- Dosskey, M.G.; Linderman, R.G.; Boersma, L. Carbon–sink stimulation of photosynthesis in Douglas fir seedlings by some ectomycorrhizas. New Phytol. 1990, 115, 269–274. [Google Scholar] [CrossRef]
- Cure, J.D.; Acock, B. Crop responses to carbon dioxide doubling: A literature survey. Agric. For. Meteorol. 1986, 38, 127–145. [Google Scholar] [CrossRef]
- Harley, P.C.; Thomas, R.B.; Reynolds, J.F.; Strain, B.R. Modelling photosynthesis of cotton grown in elevated CO2. Plant Cell Environ. 2010, 15, 271–282. [Google Scholar] [CrossRef]
- Cheng, S.H.; d Moore, B.; Seemann, J.R. Effects of short-and long-term elevated CO2 on the expression of ribulose-1, 5-bisphosphate carboxylase/oxygenase genes and carbohydrate accumulation in leaves of Arabidopsis thaliana (L.) Heynh. Plant Physiol. 1998, 116, 715–723. [Google Scholar] [CrossRef]
- Vicente, R.; Pérez, P.; Martínez-Carrasco, R.; Usadel, B.; Kostadinova, S.; Morcuende, R. Quantitative RT-PCR platform to measure transcript levels of C and N metabolism-related genes in durum wheat: Transcript profiles in elevated CO2 and high temperature at different levels of N supply. Plant Cell Physiol. 2015, 56, 1556–1573. [Google Scholar] [CrossRef] [PubMed]
- Roumet, C.; Garnier, E.; Hélène, S.; Salager, J.L.; Roy, J. Short and long-term responses of whole-plant gas exchange to elevated CO2 in four herbaceous species. Environ. Exp. Bot. 2000, 43, 155–169. [Google Scholar] [CrossRef]
- Ainsworth, E.A.; Davey, P.A.; Hymus, G.J.; Osborne, C.P.; Long, S.P. Is stimulation of leaf photosynthesis by elevated carbon dioxide concentration maintained in the long term? A test with Loliumperenne grown for 10 years at two nitrogen fertilization levels under Free Air CO2 Enrichment (FACE). Plant Cell Environ. 2003, 26, 705–714. [Google Scholar] [CrossRef]
- Seneweera, S. Effects of elevated CO2 on plant growth and nutrient partitioning of rice (Oryza sativa L.) at rapid tillering and physiological maturity. J. Plant Interact. 2011, 6, 35–42. [Google Scholar] [CrossRef]
- Alonso, A.; Pérez, P.; Martínez-Carrasco, R. Growth in elevated CO2 enhances temperature response of photosynthesis in wheat. Physiol. Plant. 2009, 135, 109–120. [Google Scholar] [CrossRef]
- Gutiérrez, D.; Gutiérrez, E.; Pérez, P.; Morcuende, R.; Verdejo, A.L.; Martinez-Carrasco, R. Acclimation to future atmospheric CO2 levels increases photochemical efficiency and mitigates photochemistry inhibition by warm temperatures in wheat under field chambers. Physiol. Plant. 2009, 137, 86–100. [Google Scholar] [CrossRef]
- Bloom, A.J.; Asensio, J.S.R.; Randall, L.; Rachmilevitch, S.; Cousins, A.B.; Carlisle, E.A. CO2 enrichment inhibits shoot nitrate assimilation in C3 but not C4 plants and slows growth under nitrate in C3 plants. Ecology 2012, 93, 355–367. [Google Scholar] [CrossRef] [PubMed]
- Harbinson, J.; Genty, B.; Baker, N.R. The relationship between CO2 assimilation and electron transport in leaves. Photosynth. Res. 1990, 25, 213–224. [Google Scholar] [CrossRef] [PubMed]
- Yousuf, P.Y.; Ganie, A.H.; Khan, I.; Qureshi, M.I.; Ibrahim, M.M.; Sarwat, M.; Iqbal, M.; Ahmad, A. Nitrogen-efficient and nitrogen-inefficient Indian mustard showed differential expression pattern of proteins in response to elevated CO2 and low nitrogen. Front. Plant Sci. 2016, 7, 1074. [Google Scholar] [CrossRef] [PubMed]
- Cohen, I.; Rapaport, T.; Chalifa-Caspi, V.; Rachmilevitch, S. Synergistic effects of abiotic stresses in plants: A case study of nitrogen limitation and saturating light intensity in Arabidopsis thaliana. Physiol. Plant. 2019, 165, 755–767. [Google Scholar] [CrossRef]
- Pettersson, R.; McDonald, A.J.S. Effects of nitrogen supply on the acclimation of photosynthesis to elevated CO2. Photosynth. Res. 1994, 39, 389–400. [Google Scholar] [CrossRef]
- Norby, R.J.; Warren, J.M.; Iversen, C.M.; Medlyn, B.E.; Mcmurtrie, R.E. CO2 enhancement of forest productivity constrained by limited nitrogen availability. Proc. Natl. Acad. Sci. USA 2010, 107, 19368–19373. [Google Scholar] [CrossRef]
- Jifon, J.L.; Wolfe, D.W. Photosynthetic acclimation to elevated CO2 in Phaseolus vulgaris L. is altered by growth response to nitrogen supply. Glob. Chang. Biol. 2002, 8, 1018–1027. [Google Scholar] [CrossRef]
- Makino, A. Rubisco and nitrogen relationships in rice: Leaf photosynthesis and plant growth. Soil Sci. Plant Nutr. 2003, 49, 319–327. [Google Scholar] [CrossRef]
- Butterly, C.R.; Armstrong, R.; Chen, D.; Tang, C. Carbon and nitrogen partitioning of wheat and field pea grown with two nitrogen levels under elevated CO2. Plant Soil 2015, 391, 367–382. [Google Scholar] [CrossRef]
- Wujeska-Klause, A.; Crous, K.Y.; Ghannoum, O.; Ellsworth, D.S. Lower photorespiration in elevated CO2 reduces leaf N concentrations in mature Eucalyptus trees in the field. Glob. Chang. Biol. 2019, 25, 1282–1295. [Google Scholar] [CrossRef]
- Hachiya, T.; Sugiura, D.; Kojima, M.; Sato, S.; Yanagisawa, S.; Sakakibara, H.; Terashima, I.; Noguchi, K. High CO2 triggers preferential root growth of Arabidopsis thaliana via two distinct systems under low pH and low N stresses. Plant Cell Physiol. 2014, 55, 269–280. [Google Scholar] [CrossRef] [PubMed]
- Jauregui, I.; Aroca, R.; Garnica, M.; Zamarreño, Á.M.; García-Mina, J.M.; Serret, M.D.; Parry, M.; Iigoyen, J.J.; Aranjuelo, I. Nitrogen assimilation and transpiration: Key processes conditioning responsiveness of wheat to elevated CO2 and temperature. Physiol. Plant. 2015, 155, 338–354. [Google Scholar] [CrossRef] [PubMed]
- Andrews, M.; Condron, L.M.; Kemp, P.D.; Topping, J.F.; Lindsey, K.; Hodge, S.; Raven, J.A. Elevated CO2 effects on nitrogen assimilation and growth of C3 vascular plants are similar regardless of N-form assimilated. J. Exp. Bot. 2018, 70, 683–690. [Google Scholar] [CrossRef] [PubMed]
- Han, W.J.; Liao, F.Y.; He, P. The photosynthetic response of Phoebe bournei to doubled CO2 concentration in air. J. Cent. South Univ. For. Tech. 2003, 23, 62–65. [Google Scholar]
- Laisk, A.; Loreto, F. Determining photosynthetic parameters from leaf CO2 exchange and chlorophyll fluorescence (ribulose-1, 5-bisphosphate carboxylase/oxygenase specificity factor, dark respiration in the light, excitation distribution between photosystems, alternative electron transport rate, and mesophyll diffusion resistance. Plant Physiol. 1996, 110, 903–912. [Google Scholar]
- Peterson, R.B.; Oja, V.; Laisk, A. Chlorophyll fluorescence at 680 and 730 nm and leaf photosynthesis. Photosynth. Res. 2001, 70, 185–196. [Google Scholar] [CrossRef]
- Frank, H.A.; Cua, A.; Chynwat, V.; Young, A.; Gosztola, D.; Wasielewski, M.R. Photophysics of the carotenoids associated with the xanthophyll cycle in photosynthesis. Photosynth. Res. 1994, 41, 389–395. [Google Scholar] [CrossRef]
- Zhao, X.; Du, Q.; Zhao, Y.; Wang, H.; Yu, H. Effects of different potassium stress on leaf photosynthesis and chlorophyll fluorescence in maize (Zea mays L.) at seedling stage. Agric. Sci. 2016, 7, 44–53. [Google Scholar]
- Zheng, B.; Cheng, X.; Jiang, D.; Weng, X. Effects of potassium on Rubisco, RCA and photosynthetic rate of plant. J. Zhejiang For. Coll. 2002, 19, 104–108. [Google Scholar]
- Zheng, Y.; Li, F.; Hao, L.; Yu, J.; Xu, M. Elevated CO2 concentration induces photosynthetic down-regulation with changes in leaf structure, non-structural carbohydrates and nitrogen content of soybean. BMC Plant Biol. 2019, 19, 255. [Google Scholar] [CrossRef]
- Tomás, M.; Jaume, F.; Lucian, C.; Galmés, J.; Lea, H.; Medrano, H. Importance of leaf anatomy in determining mesophyll diffusion conductance to CO2 across species: Quantitative limitations and scaling up by models. J. Exp. Bot. 2013, 64, 2269–2281. [Google Scholar] [CrossRef] [PubMed]
- Yang, G.; Luo, J.; Lin, Y.; Wang, H.; Mo, Y. Effects of salt stress on photosynthetic characteristics and stoma structure of two kinds bracket plants. Hubei Agric. Sci. 2016, 55, 4982–4986. [Google Scholar]
- Li, X.; Yang, Y.; Zhang, J.; Jia, L.; Li, Q.; Zhang, T.; Qiao, K.; Ma, S. Zinc induced phytotoxicity mechanism involved in root growth of Triticum aestivum L. Ecotoxicol. Environ. Saf. 2012, 86, 198–203. [Google Scholar] [CrossRef] [PubMed]
- Wang, S.; Zou, Y.; Ma, F. Influence of drought stress on leaf anatomical structure and micro-morphology traits and chloroplast ultra structure of three Malus specie. Agric. Res. Arid Areas 2014, 32, 15–23. [Google Scholar]
- Herrick, J.D.; Maherali, H.; Thomas, R.B. Reduced stomatal conductance in sweetgum (Liquidambar styraciflua) sustained over long-term CO2 enrichment. New Phytol. 2004, 162, 387–396. [Google Scholar] [CrossRef]
- Woodward, F.I.; Kelly, C.K. The influence of CO2 concentration on stomatal density. New Phytol. 1995, 131, 311–327. [Google Scholar] [CrossRef]
- Kitao, M.; Koike, T.; Tobita, H.; Maruyama, Y. Elevated CO2 and limited nitrogen nutrition can restrict excitation energy dissipation in photosystem II of Japanese white birch (Betula platyphylla var. japonica) leaves. Physiol. Plant. 2005, 125, 64–73. [Google Scholar] [CrossRef]
- Tissue, D.T.; Griffin, K.L.; Ball, J.T. Photosynthetic adjustment in field-grown ponderosa pine trees after six years of exposure to elevated CO2. Tree Physiol. 1999, 19, 221–228. [Google Scholar] [CrossRef]
- Urban, O.; Hrstka, M.; Zitová, M.; Holišová, P.; Šprtová, M.; Klem, K.; Calfapietra, C.; Angelis, P.D.; Marek, M.V. Effect of season, needle age and elevated CO2 concentration on photosynthesis and Rubisco acclimation in Piceaabies. Plant Physiol. Biochem. 2012, 58, 135–141. [Google Scholar] [CrossRef]
- Warren, C.R.; Adams, M.A. Distribution of N, Rubisco and photosynthesis in Pinus pinaster and acclimation to light. Plant Cell Environ. 2001, 24, 597–609. [Google Scholar] [CrossRef]
- Causin, H.F.; Tremmel, D.C.; Rufty, T.W.; Reynolds, J.F. Growth, nitrogen uptake, and metabolism in two semiarid shrubs grown at ambient and elevated atmospheric CO2 concentrations: Effects of nitrogen supply and source. Am. J. Bot. 2004, 91, 565–572. [Google Scholar] [CrossRef] [PubMed]
- Alexandre, A.; Silva, J.; Buapet, P.; Björk, M.; Santos, R. Effects of CO2 enrichment on photosynthesis, growth, and nitrogen metabolism of the sea grass Zosteranoltii. Ecol. Evol. 2012, 2, 2625–2635. [Google Scholar] [CrossRef] [PubMed]
- Sanz-Sáez, Á.; Erice, G.; Aranjuelo, I.; Nogués, S.; Irigoyen, J.J.; Sánchez-Díaz, M. Photosynthetic down-regulation under elevated CO2 exposure can be prevented by nitrogen supply in nodulated alfalfa. J. Plant Physiol. 2010, 167, 1558–1565. [Google Scholar] [CrossRef] [PubMed]
- Sharkey, T.D. Estimating the rate of photorespiration in leaves. Physiol. Plant. 1988, 73, 147–152. [Google Scholar] [CrossRef]
- Rachmilevitch, S.; Cousins, A.B.; Bloom, A.J. Nitrate assimilation in plant shoots depends on photorespiration. Proc. Natl. Acad. Sci. USA 2004, 101, 11506–11510. [Google Scholar] [CrossRef]
- Bloom, A.J.; Burger, M.; Kimball, B.A.; Pinter, P.J., Jr. Nitrate assimilation is inhibited by elevated CO2 in field-grown wheat. Nat. Clim. Chang. 2014, 4, 477–480. [Google Scholar] [CrossRef]
- Silva, L.C.; Salamanca-Jimenez, A.; Doane, T.A.; Horwath, W.R. Carbon dioxide level and form of soil nitrogen regulate assimilation of atmospheric ammonia in young trees. Sci. Rep. 2015, 5, 13141. [Google Scholar] [CrossRef]
- McGrath, J.M.; Lobell, D.B. Reduction of transpiration and altered nutrient allocation contribute to nutrient decline of crops grown in elevated CO2 concentrations. Plant Cell Environ. 2013, 36, 697–705. [Google Scholar] [CrossRef]
- Wassen, M.J.; Venterink, H.O.; Lapshina, E.D.; Tanneberger, F. Endangered plants persist under phosphorus limitation. Nature 2005, 437, 547–550. [Google Scholar] [CrossRef]
- Conroy, J.P.; Milham, P.J.; Reed, M.L.; Barlow, E.W. Increases in phosphorus requirements for CO2-enriched pine species. Plant Physiol. 1990, 92, 977–982. [Google Scholar] [CrossRef]
- Israel, D.W.; Rufty, T.W., Jr.; Cure, J.D. Nitrogen and phosphorus nutritional interactions in a CO2 enriched environment. J. Plant Nutr. 1990, 13, 1419–1433. [Google Scholar] [CrossRef]
- Myers, S.S.; Zanobetti, A.; Kloog, I.; Huybers, P.; Leakey, A.D.; Bloom, A.J.; Carlisle, E.; Dietterich, L.H.; Fitzgerald, G.; Hasegawa, T.; et al. Increasing CO2 threatens human nutrition. Nature 2014, 510, 139–142. [Google Scholar] [CrossRef] [PubMed]


| Treatment | Chl a (mg∙g−1) | Chl b (mg∙g−1) | Chl a + b (mg∙g−1) | Chl a/b | |
|---|---|---|---|---|---|
| aCO2 | NO3− | 1.45 ± 0.06cd | 0.50 ± 0.08de | 1.94 ± 0.13d | 2.95 ± 0.33a |
| iNO3− | 1.67 ± 0.02a | 0.83 ± 0.08a | 2.50 ± 0.09a | 2.02 ± 0.19d | |
| NH4+ | 1.38 ± 0.06d | 0.48 ± 0.03de | 1.86 ± 0.09d | 2.91 ± 0.08a | |
| iNH4+ | 1.59 ± 0.05ab | 0.63 ± 0.08cd | 2.22 ± 0.12bc | 2.53 ± 0.23abc | |
| eCO2 | NO3− | 1.17 ± 0.09e | 0.40 ± 0.06e | 1.58 ± 0.15e | 2.94 ± 0.30a |
| iNO3− | 1.68 ± 0.03a | 0.79 ± 0.08ab | 2.47 ± 0.1ab | 2.13 ± 0.18cd | |
| NH4+ | 1.50 ± 0.10bc | 0.57 ± 0.09cd | 2.08 ± 0.2cd | 2.66 ± 0.28ab | |
| iNH4+ | 1.59 ± 0.08ab | 0.67 ± 0.14bc | 2.26 ± 0.21abc | 2.42 ± 0.37bcd | |
| Effects | Chl a | Chl b | Chl a + b | Chl a/b | ||||
|---|---|---|---|---|---|---|---|---|
| F | p | F | p | F | p | F | p | |
| CO2 concentration (C) | 1.284 | 0.274 | 0.001 | 0.972 | 0.244 | 0.628 | 0.144 | 0.709 |
| Nitrogen level (L) | 77.804 | <0.001 | 42.524 | <0.001 | 62.589 | <0.001 | 26.394 | <0.001 |
| Nitrogen Type (T) | 0.570 | 0.461 | 1.220 | 0.286 | 0.100 | 0.755 | 1.087 | 0.313 |
| C × L | 2.746 | 0.117 | 0.061 | 0.809 | 0.812 | 0.381 | 0.093 | 0.764 |
| C × T | 10.238 | 0.006 | 2.801 | 0.114 | 6.033 | 0.026 | 0.781 | 0.390 |
| L × T | 10.753 | 0.005 | 7.648 | 0.014 | 9.891 | 0.006 | 4.861 | 0.042 |
| C × L × T | 9.126 | 0.008 | 0.271 | 0.610 | 2.842 | 0.111 | 0.003 | 0.955 |
| Treatment | Palisade Tissue Thickness (μm) | Spongy Tissue Thickness (μm) | Epidermal Thickness (μm) | Leaf Thickness (μm) | CTR | SR | Stomatal Density (ind∙mm−2) | |
|---|---|---|---|---|---|---|---|---|
| aCO2 | NO3− | 38.8 ± 4.9a | 51.7 ± 5.7ab | 11.2 ± 0.9b | 108.5 ± 2.8bc | 0.36 ± 0.04a | 378.8 ± 12.6d | 378.8 ± 12.6d |
| iNO3− | 41.1 ± 3.9a | 58.5 ± 5.1a | 11.7 ± 0.5b | 113.8 ± 4ab | 0.36 ± 0.04a | 446.1 ± 14.6c | 446.1 ± 14.6c | |
| NH4+ | 37.2 ± 3.4a | 49.4 ± 4.7ab | 11.5 ± 0.7b | 100.1 ± 3.8d | 0.37 ± 0.05a | 383.0 ± 26.3d | 383.0 ± 26.3d | |
| iNH4+ | 39.5 ± 4.1a | 48.4 ± 4ab | 13.9 ± 1.5ab | 101.2 ± 0.8cd | 0.39 ± 0.04a | 399.8 ± 14.6d | 399.8 ± 14.6d | |
| eCO2 | NO3− | 37.0 ± 6.4a | 42.4 ± 4.3b | 11.7 ± 1.1b | 95.0 ± 6.9d | 0.39 ± 0.05a | 307.2 ± 7.3e | 307.2 ± 7.3e |
| iNO3− | 35.5 ± 3.2a | 56.2 ± 3.6a | 16.0 ± 0.8a | 115.9 ± 6.8a | 0.31 ± 0.02a | 542.9 ± 25.2a | 542.9 ± 25.2a | |
| NH4+ | 37.3 ± 6.9a | 53.2 ± 6.6a | 12.6 ± 1.5b | 101.7 ± 0.7cd | 0.37 ± 0.07a | 374.6 ± 26.3d | 374.6 ± 26.3d | |
| iNH4+ | 40.9 ± 1.1a | 52.4 ± 1.8ab | 12.4 ± 1.7b | 108.1 ± 0.8bc | 0.38 ± 0.01a | 492.4 ± 25.3b | 492.4 ± 25.3b | |
© 2020 by the authors. Licensee MDPI, Basel, Switzerland. This article is an open access article distributed under the terms and conditions of the Creative Commons Attribution (CC BY) license (http://creativecommons.org/licenses/by/4.0/).
Share and Cite
Wang, X.; Wei, X.; Wu, G.; Chen, S. High Nitrate or Ammonium Applications Alleviated Photosynthetic Decline of Phoebe bournei Seedlings under Elevated Carbon Dioxide. Forests 2020, 11, 293. https://doi.org/10.3390/f11030293
Wang X, Wei X, Wu G, Chen S. High Nitrate or Ammonium Applications Alleviated Photosynthetic Decline of Phoebe bournei Seedlings under Elevated Carbon Dioxide. Forests. 2020; 11(3):293. https://doi.org/10.3390/f11030293
Chicago/Turabian StyleWang, Xiao, Xiaoli Wei, Gaoyin Wu, and Shenqun Chen. 2020. "High Nitrate or Ammonium Applications Alleviated Photosynthetic Decline of Phoebe bournei Seedlings under Elevated Carbon Dioxide" Forests 11, no. 3: 293. https://doi.org/10.3390/f11030293
APA StyleWang, X., Wei, X., Wu, G., & Chen, S. (2020). High Nitrate or Ammonium Applications Alleviated Photosynthetic Decline of Phoebe bournei Seedlings under Elevated Carbon Dioxide. Forests, 11(3), 293. https://doi.org/10.3390/f11030293