Article

90Sr Content in the Stemwood of Forests within Ukrainian Polissya

1
Department of Forest Mensuration and Forest Management, National University of Life and Environmental Sciences of Ukraine, 03041 Kyiv, Ukraine
2
Ukrainian Institute of Agricultural Radiology, National University of Life and Environmental Sciences of Ukraine, 08162 Chabany, Ukraine
3
Ecosystem Services and Management (ESM) Program, International Institute for Applied Systems Analysis, A-2361 Laxenburg, Austria
*
Author to whom correspondence should be addressed.
Forests 2020, 11(3), 270; https://doi.org/10.3390/f11030270
Submission received: 20 January 2020 / Revised: 26 February 2020 / Accepted: 27 February 2020 / Published: 28 February 2020
(This article belongs to the Section Forest Ecology and Management)

Abstract

:
The consequences of the Chernobyl disaster continue to threaten humans and ecosystems across fallout gradient in Northern Ukraine and nearby. Forest ecosystems contain substantial stocks of long-lived radionuclide 90Sr which was leached from the fuel matrix during the disaster. Nowadays, there is a lack of information about current transfer factors (TF) of this radionuclide from soil to the stemwood of native tree species. We have estimated 90Sr content in the forest stemwood of three tree species utilizing models of their growth and yield and collected woody samplings. TFs provided here vary greatly across studied tree species (18.0 × 2.1±1, 8.7 × 2.8±1, and 10.4 × 6.0±1 n × 10−3 m2·kg−1 (geometrical mean (GM) ± geometrical standard deviation, GSD) for the above species, respectively) and together with indicators of soil contamination allow us to reliably assess local stocks in the stemwood. Silver birch stands are estimated to deposit the highest 90Sr stocks. Herewith, at 25 years old Black alder stands could accumulate higher stocks (up to 35 MBq·ha−1) under rich growth conditions. TFs obtained in this study substantially exceed values provided by the International Atomic Energy Agency for studied tree species and thus could entail respective restrictions on use of firewood across large areas in Ukrainian Polissya. Data provided here may be harnessed to support decisions of respective stakeholders to provide credibly safe management of the contaminated forest ecosystems.

1. Introduction

Radioactive contamination of forests remains one of the main ecological consequences of the Chernobyl and Fukushima Daiichi nuclear power plant (NPP) accidents [1]. Currently, only long-lived radionuclides (90Sr, 137Cs, and also transuranium elements) pose a radiological hazard in Ukraine [2]. In total, 137Cs deposition exceeded 37 kBq m−2 at the forest area of approximately 1230.7 thousand ha (38.6% total forest land of Ukrainian Polissya as of 1993) [3]. Spatially distributed high-resolution data on levels of radioactive contamination 90Sr in forest are absent currently in Ukraine.
The most perspective (in terms of sanitary) types of use of abandoned contaminated lands are either natural afforestation (or closed to nature silviculture) or bioenergy production for local needs [4]. Nowadays, forest management based on native tree species is likewise considered as an efficient way to use respective areas [5]. Hence, studies focused on patterns of radionuclide migration and accumulation in forests will remain at a high level of significance for contaminated areas.
To date, 90Sr activity due to its physical half-life (~ 30 years) has been decreased twice. However, substantial areas will persist as highly contaminated for at least a century more [6]. Consequently, the risk of contaminated wood being occasionally used by the people remains. Special consideration must be given for the firewood, since local inhabitants in rural areas typically use ash after firewood utilization as a fertilizer thus leading to the secondary contamination of soil and agricultural products as well. Despite all the villages in the Ukrainian Polissya region being electrified, settlers there hitherto prefer to use fuelwood to heat their homes [1].
Nowadays, restrictions of the activity concentration of 90Sr in Ukraine forest are met only for the requirements of firewood and fuel bunches [7]. Fuel bunches are the only forest products which hygienic standards set for them. The regulations to 90Sr activity concentration in timber are introduced in Russia [8], whereas there is no any statutory restriction for 90Sr content of contaminated wood in Belarus (Table 1) the territory of which was heavily contaminated after the Chernobyl disaster as well.
Biogeochemical 90Sr cycling in forest ecosystems is strongly dependent on the soil type (including fertility and water supply conditions), tree species, features of their growth and development, tree mortality patterns and dead organic matter (including litter) decomposition. While radionuclide fluxes in each ecosystem have certain features, and generalization of 90Sr migration and accumulation patterns will allow researchers to assess and simulate dynamics of concentration activity in ecosystem compartments including forest live biomass [9]. Another important factor determining the magnitude of its root uptake is a content of exchangeable calcium in soil. Being the chemical analogue of Ca, strontium is absorbed from soil, translocated and accumulated in the tree organs, and is removed from the aboveground biomass by the same mechanisms of the Ca cycle. 90Sr soil-to-plant transfer factor (TF) declines with increase of the exchangeable forms of Ca in soil [10].
Patterns of 90Sr migration due to root uptake, transferring into tree live biomass and returning through litterfall, rainfall and stem fluxes, is commonly shown by respective aggregated TF. Aggregated TF is the ratio of the mass activity concentration of radionuclide (Bq·kg−1) in a specified object to the unit area of its activity density (for terrestrial surfaces, usually: kBq·m−2). Compared to information on TF for 137Cs, there are a lack of such data for 90Sr and existing TF differ greatly. TF were estimated for 90Sr from soil in wood of Scots pine (Pinus sylvestris L., arithmetical mean and standard deviation (AM ± SD): 39.1 ± 5.9 × 10⁻³ m2·kg−1), Norway spruce (Picea abies (L.) H. Karst., 9.0 ± 2.0 × 10⁻³ m2·kg−1), European oak (Quercus robur L., 1.92 ± 0.46 × 10⁻³ m2·kg−1), Silver birch (Betula pendula Roth., 16.9 ± 3.1 × 10⁻³ m2·kg−1), Black alder (Alnus glutinosa (L.) Gaertn., 1.91 ± 0.35 × 10⁻³ m2·kg−1) and Common aspen (Populus tremula L., 1.91 ± 0.35 × 10⁻³ m2·kg−1) depending on forest type conditions, as well as TF expansion series for timber wood [11].
Information on 90Sr TF for the stem wood of Scots pine (11.2–17.9 × 10⁻³ m2·kg−1) and Silver birch (15.4–27.3 × 10⁻³ m2·kg−1) published by Davydov et al. [12], are rather consistent with data of Perevolotskiy [10] for timber, but additionally contain TF for branches and foliage live biomass of these tree species.
Guidelines of the International Atomic Energy Agency (IAEA) for use of 90Sr TF from soil to stem biomass of Black alder (geometrical mean—GM: 0.95 × 10⁻³ m2·kg−1), Silver fir (Abies alba L., GM: 4.4 × 10⁻³ m2·kg−1), Scots pine (GM: 1.6 × 10⁻³ m2·kg−1), Common oak (GM: 1.3 × 10⁻³ m2·kg−1), Common aspen (GM: 2.1 × 10⁻³ m2·kg−1) and Silver birch (GM: 2.4 × 10⁻³ m2·kg−1) are based on data from the Kyshtym [13] accident and early studies by Scheglov (1986–1992), that substantially differ from the data of the majority of subsequent researchers [9,11,12].
Estimation of concentration dynamics of 90Sr in forest live biomass compartments allows us not only to expand understanding of biogeochemical fluxes in forest ecosystems, but rather to develop information-support materials for decision-making in planning, organization and management of timber production, including wood for energy purposes. Such materials should sustain reasonable restrictions of wood utilization. Together with fostering the establishment of new naturally regrown mixed forests which are more resilient in terms of radiological sanitary, these are only reliable approaches to maintain contamination levels stable [1].
According to accumulation of the highest dose rates that cause impact on humans due to external and internal exposure, forest ecosystems are especially significant, being characterized fundamentally another radionuclides’ behavior compared to agricultural, meadow and peatland ecosystems [14]. Functioning of forests causes biogeochemical radionuclide cycling that define respective concentration in the soil, mushrooms, forest berries, live biomass of the trees, understory, forest litter (foliage and branches up to 1 cm in diameter), coarse woody debris (CWD: branches with d > 1 cm) and other ecosystem compartments. Although there are several studies devoted to the migration of 137Cs and 90Sr [15,16], experimental assessment of their biogeochemical fluxes in forest ecosystems hitherto has crucial importance. We are hypothesizing that combining data on the growth and productivity of forest stands with patterns of radionuclide transfer from soil to the stemwood, it is possible to provide sufficient information on the accumulation of 90Sr in birch, alder and aspen wood. That is, the aim of such assessment is thus to predict forest ecosystem contamination in more credible manner and with perspectives to adjust respective knowledge for planning local management decisions and silviculture activities not exceeding implemented hygienic standards for 90Sr and 137Cs content in products.

2. Materials and Methods

2.1. Forest Growth Modelling

This study focuses on the most abundant deciduous tree species within Ukrainian Polissya. Forests of Silver birch, Black alder and Common aspen cover one third of forested area within this zone. Such a ratio is slightly increasing due to the natural succession on abandoned agricultural lands [17,18]. Deciduous forests have crucial importance, provisioning ecosystem services such as biomass accumulation, carbon sequestration, oxygen production, biodiversity maintaining, sustaining conditions for hunting and providing other goods for human well-being [19].
Computations of growth and yield at stand level were carried out using height-based allometric models for Silver birch (seed origin), Black alder (vegetative origin) and Common aspen (vegetative origin) forests, based on the set of inventory units (n = 175,000 (Silver birch), n = 124,000 (Black alder), and n = 17,000 for Common aspen) from data in the aggregated nationwide database of forest planning and management (FPAM).
Models of biophysical parameters dynamics were developed for deciduous tree species examined in this study. Those include models of mean height (H) and diameter (D), growing stock volume (GSV). Dynamics of parameters mentioned above was harmonized using the Chapman–Richards non-linear model [20]. Differential and integral equations of this function are given as:
d X i d t =   c 3 c 2 c 1 1 / c 3   c 3 c 2 X i
X i =   c 1 [ 1 exp ( c 2 A ) ] c 3
For a given site index, this model (1–2) reflects increment and accumulated value of the certain biophysical parameter as a function of the stand age. Such differential equation generally describes growth patterns of trees in the forest and is given with visualization purpose. Each regression coefficient has a biological explanation: c 1 is a maximal possible value of growth function, i.e., it represents the level of used growth capability in respective forest conditions; c 2 scales up temporal axis and characterizes stand growth velocity, simultaneously being proportional to the age of the highest increment. Hence, value c 2 ( 1 1 / c 3 ) exp ( c 3 1 ) represents the maximal value of the current increment, while [ ln ( c 3 ) / c 2 ] is an intercept of growth function [20].
Based on stand growth models for each site index, there has been an approximation of coefficients for soft-leaved tree species with the use of quadratic polynomial equations (3–5):
c 1 =   c 13 B 2 +   c 12 B +   c 11
c 2 =   c 23 B 2 +   c 22 B +   c 21
c 3 =   c 33 B 2 +   c 32 B +   c 31
where B is a site index encoded, c 1 c 3 and c 11 c 33 are the regression coefficients.
Since growth and yield modelling implied use of site indexes, here we utilized a digital encoding system (where initial letters (a–f) in site index titles indicate the growing trend in forest productivity) for adequate visualization of their influence (Table 2).
Distribution of Ukrainian Polissya forests’ area by site indexes is given in Table 3. Typically, stands of Common aspen are high-productive (site index I takes 43.1% of area) there, while the most common forests of Silver birch and Black alder belong to site index II (41.7% and 54%, respectively). The proportion of low-productive stands of studied tree species is rather insufficient.
To assess accuracy, we used an experimental dataset of 382 temporary sample plots (TSP) established for studying growth and yield of stands of soft-wood deciduous species and live biomass dynamics of Ukrainian Polissya’s forests. The plots are almost equally arranged among studied tree species (119 of Silver birch, 139 of Black alder and 124 of Common aspen). We utilized three different metrics (6-8) to validate models’ performance on this dataset: root mean square error (RMSE), residual sum of squares (RSS) and model efficiency (ME).
R M S E =   i = 1 n ( y i   y ^ i ) 2 n
R S S =   i = 1 n ( y i   y ^ i ) 2
M E = 1   | i = 1 n ( y i   y ^ i ) 2   / i = 1   n ( y i   y ¯ i ) 2 |
where y i is observed value, y ^ i is mean observed value, y ¯ i is respective predicted value, and n is sample size. Additionally, we used the Shapiro–Wilk test to examine whether residuals of predicted GSV follow normal distribution.

2.2. Sampling and Measuring 90Sr Activity

Aiming to estimate parameters of radioactive contamination of wood stem, here we used standard sampling methods that allow us to examine unbiased means of 90Sr density of soil contamination and biomass. Composite soil samples were collected using the envelope method ([21] as an industry standard implemented in Ukraine). After full accounting of all trees and measurement of their diameters at breast height (DBH) at forest sites, we selected three model trees near the AM of stand DBH, and two model trees around values AM – SD and AM + SD. Wood samples of these 5 model trees were collected using an increment borer (5.5 mm) at a tree height of 1.3 m for radiological investigation. Soil samplings were gathered with use of special cylindrical sampler (d = 37 mm) digging to the 30-cm layer depth in five points per plot with 5–10 m distance between those: four in the corners and one in the center of a plot. The samples were subsequently combined to form a composite. The soil composites were dried (at 105 °C), sifted through sieve (cells d = 1 mm), carefully homogenized and 100 cm3 volume was taken for 90Sr activity measurements. 90Sr activity in samplings was estimated based on radiochemical method described by Pavlotskaya [22] with the next use of β-spectrometer SEB-01-70 (Research and Production Enterprise AKP—Atom Komplex Prylad, Ukraine). All measured 90Sr activity values for the samples were recalculated as of 1 January 2018.
Experimental dataset of collected stem wood samplings includes 44 samplings: Silver birch – 32 pcs, Black alder – 6 pcs and Common aspen – 6 pcs, which were used for estimation of 90Sr content within. Experimental dataset of collected stemwood samplings includes 1122 samplings: Silver birch—504 pcs, Black alder—336 pcs and Common aspen—282 pcs, which were used for estimation of basic wood density. Basic wood density was 512 ± 18 kg·m−3 for Common aspen, 444 ± 21 kg·m−3 for Black alder, and 415 ± 12 kg·m−3 for Silver birch.

3. Results

3.1. Forest Growth Modelling

Performance of developed models in terms of abovementioned metrics is given in the Table 4. The best predictive ability was achieved by the mean height (H) models, while models of growing stock volume (GSV) and diameter (D) were performed moderately.
RMSE (Table 4) of growing stock volume in validation Silver birch stands equals 33.4% of mean value of observed GSVs, regarding Black alder stands, 33.7% and Common aspen stands, 24.4% of respective values. Residuals of predicted GSV for Black alder follows normal distribution (p-value = 0.07), while this is not a case for other two species (p-value < 0.05 for both).
Visualization of 1:1 agreement between observed and predicted values illustrates overall sufficient adequacy of developed models (Figure 1):
Polynomial coefficients for calculating values c 1 - c 3 (3-5) given in each model (2) are presented in Appendix A.

3.2. Transfer Factors Estimation

Experimental data of wood samplings was used for estimation of current TFs from soil to the wood without bark for all tree above mentioned species: Silver birch, Black alder and Common aspen, although the number of samplings for the last two species was small. However, results obtained agreed quite well with data provided by Perevolotskiy [11] and Davydov et al. [12], but substantially exceed data provided by the IAEA [23]. Data on main descriptive statistics of our estimated experimental TFs (with standard deviations (SD) and geometrical standard deviations, GSD) is presented in Table 5.

3.3. Content of 90Sr in the Stemwood of Studied Tree Species

Based on developed GSV models, data on wood density for studied tree species, common levels of soil contamination and estimated TFs, capability potential of forest stands to deposit 90Sr was assessed. An example of produced data at equal 90Sr contamination density of soil for estimated geometric mean values of studied wood species TF is given in Figure 2.
Typically, considering higher TF and growth rate, Silver birch stands accumulate the largest stocks across their life (Figure 2). Black alder stands can reach higher stocks up to a 25-year-old threshold. Differences between 90Sr stock related to various site indexes at the same (60 yr) age and soil (40 kBq·m−2) contamination level are visualized in Figure 3.
Since nowadays restrictions for use of stemwood regarding 90Sr contamination in Ukraine are determined only for fuelwood, respective probabilities of excess related to implemented activity levels (60 Bq·kg−1) were estimated (Table 6).

4. Discussion

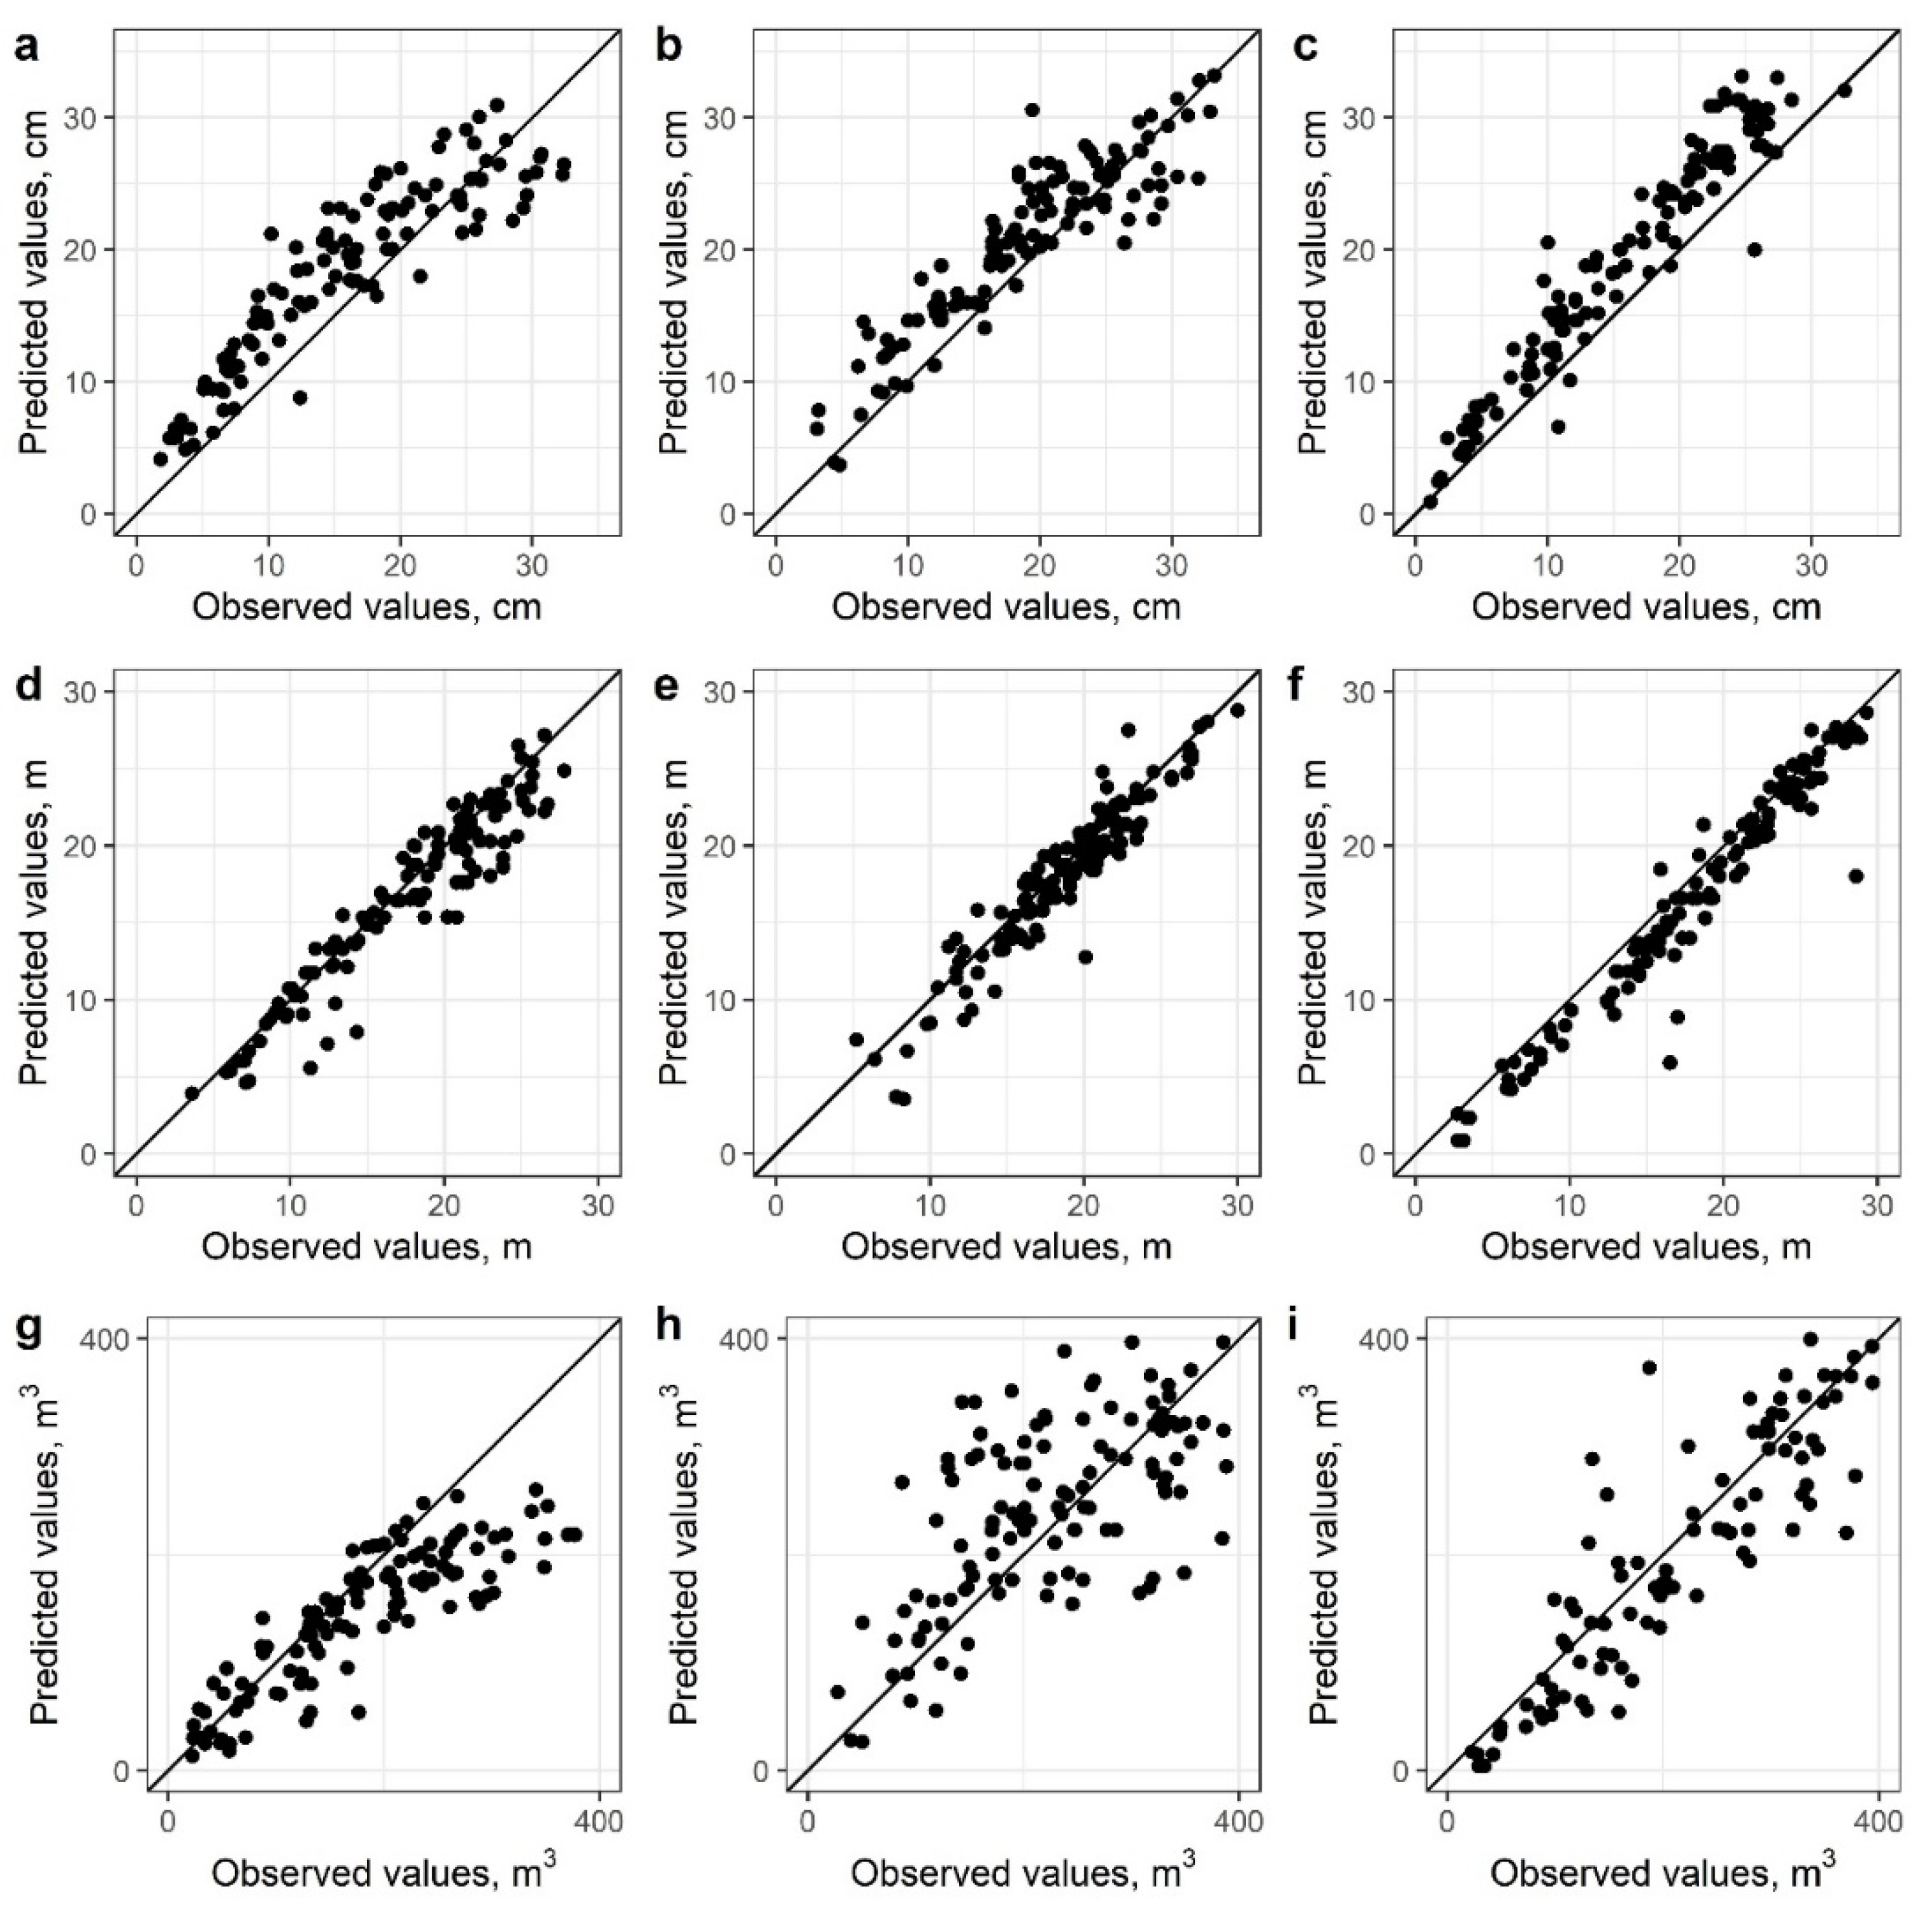
Based on (i) growth patterns of deciduous forests, (ii) dynamics of stemwood as well as on (iii) features of radionuclides transition from soil to the wood of tree, we developed empirical models of 90Sr content depending on different age of forest stands for respective tree species widely presented in forests of Ukrainian Polissya. Such data are crucial for understanding and modelling of radionuclide biogeochemical fluxes and depots within forest ecosystems and for prediction of changes in environmental contamination.
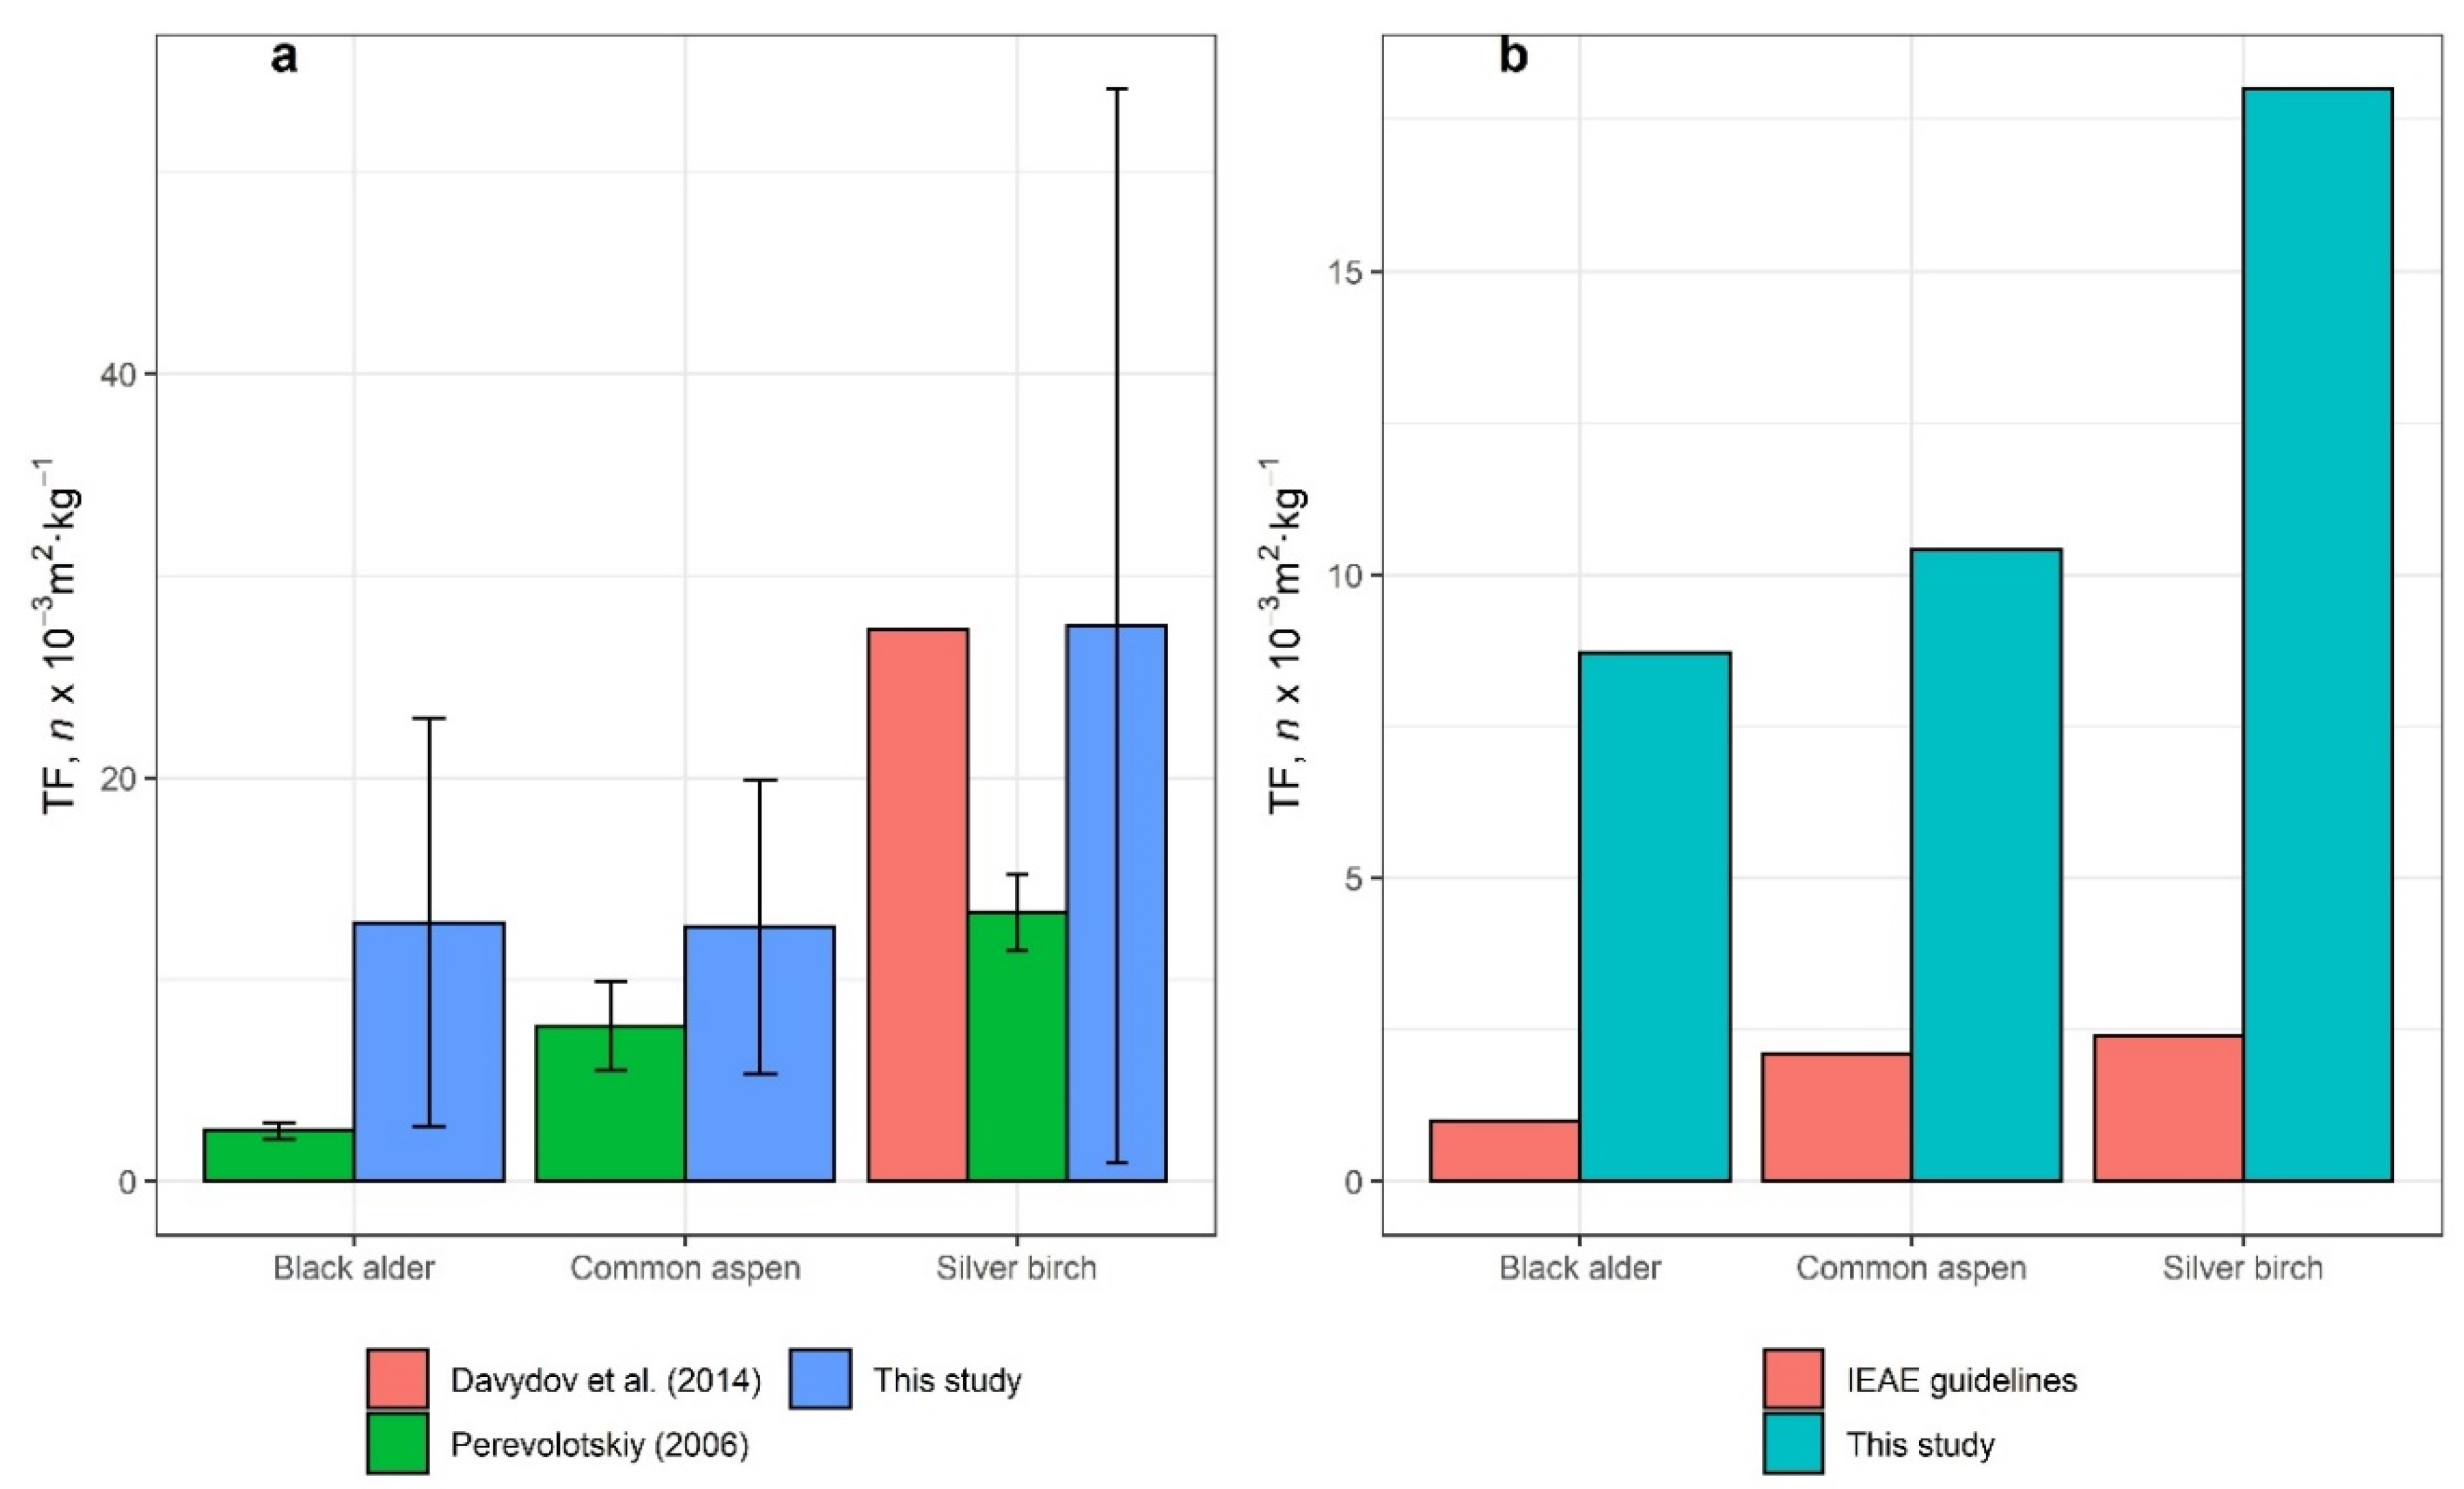
To date, information about updated TFs for different species typical for Ukrainian Polissya is limited. Davydov et al. [12] developed transfer factors (TF) for Silver birch, while respective values for Black alder and Common aspen were studied by Perevolotskiy [11]. Data provided by the IAEA [23] which are obtained based on studying the Kyshtym accident, and early studies by Scheglov [13], are different from the aforementioned studies by a large margin. If the first case (Kyshtym accident), the regional soil conditions cause this difference, while the contrast of our data to the results by Scheglov [13] is a consequence of the lack of 90Sr ‘saturation’ in depot biomass compartments of the woody plants. Additionally, the content of 90Sr is given in a biologically inaccessible form in the matrix of fuel particles during the first period after Chernobyl accident [24,25]. The comparison of various TFs is presented in Figure 4.
Geometrical means of developed TFs do not agree with data provided by the IAEA (Figure 4b, [23]), while arithmetical means are almost the same relating to [12] data on Silver birch (Figure 4a). Herewith, SD of TF arithmetical means range tremendously, when respective values for geometrical means do not exceed critical thresholds.
To date, while the ratio of bioenergy in global energy markets is likely to be increased, efforts to use forest live biomass for energy purposes in Ukraine are facing great challenges due to a high (exceeding restrictions) level of radioactive contamination that impacts environment and human well-being.
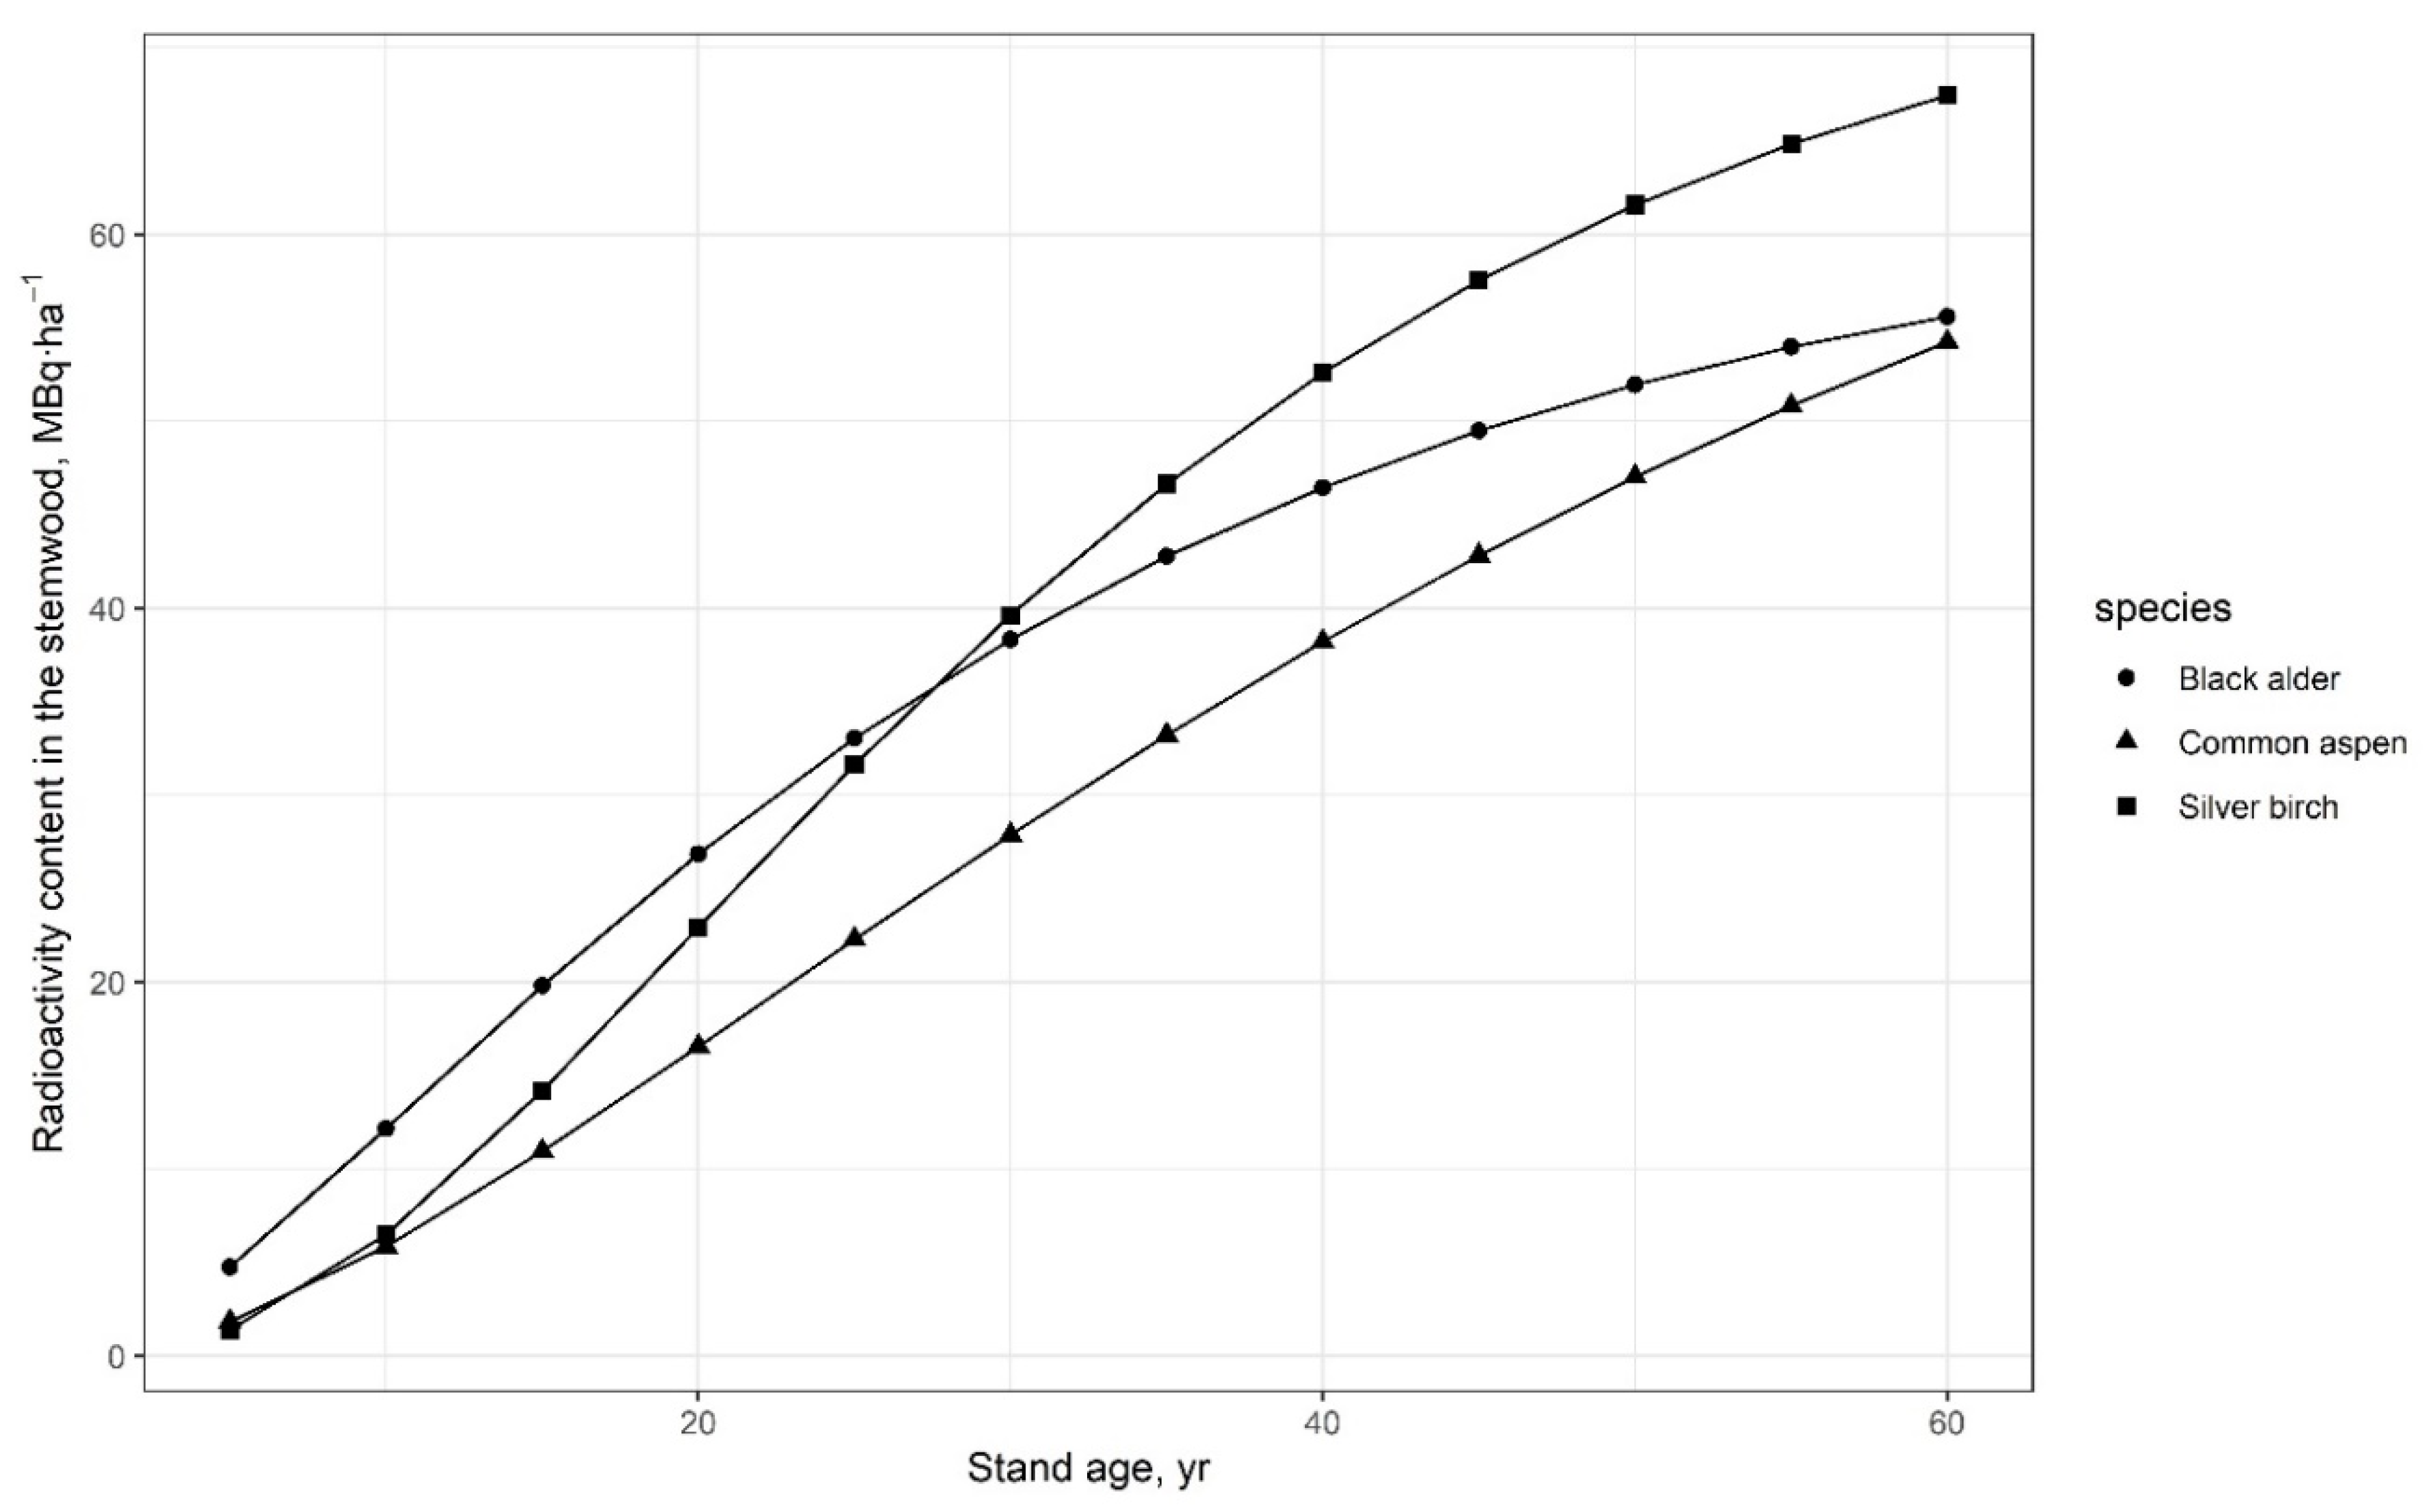
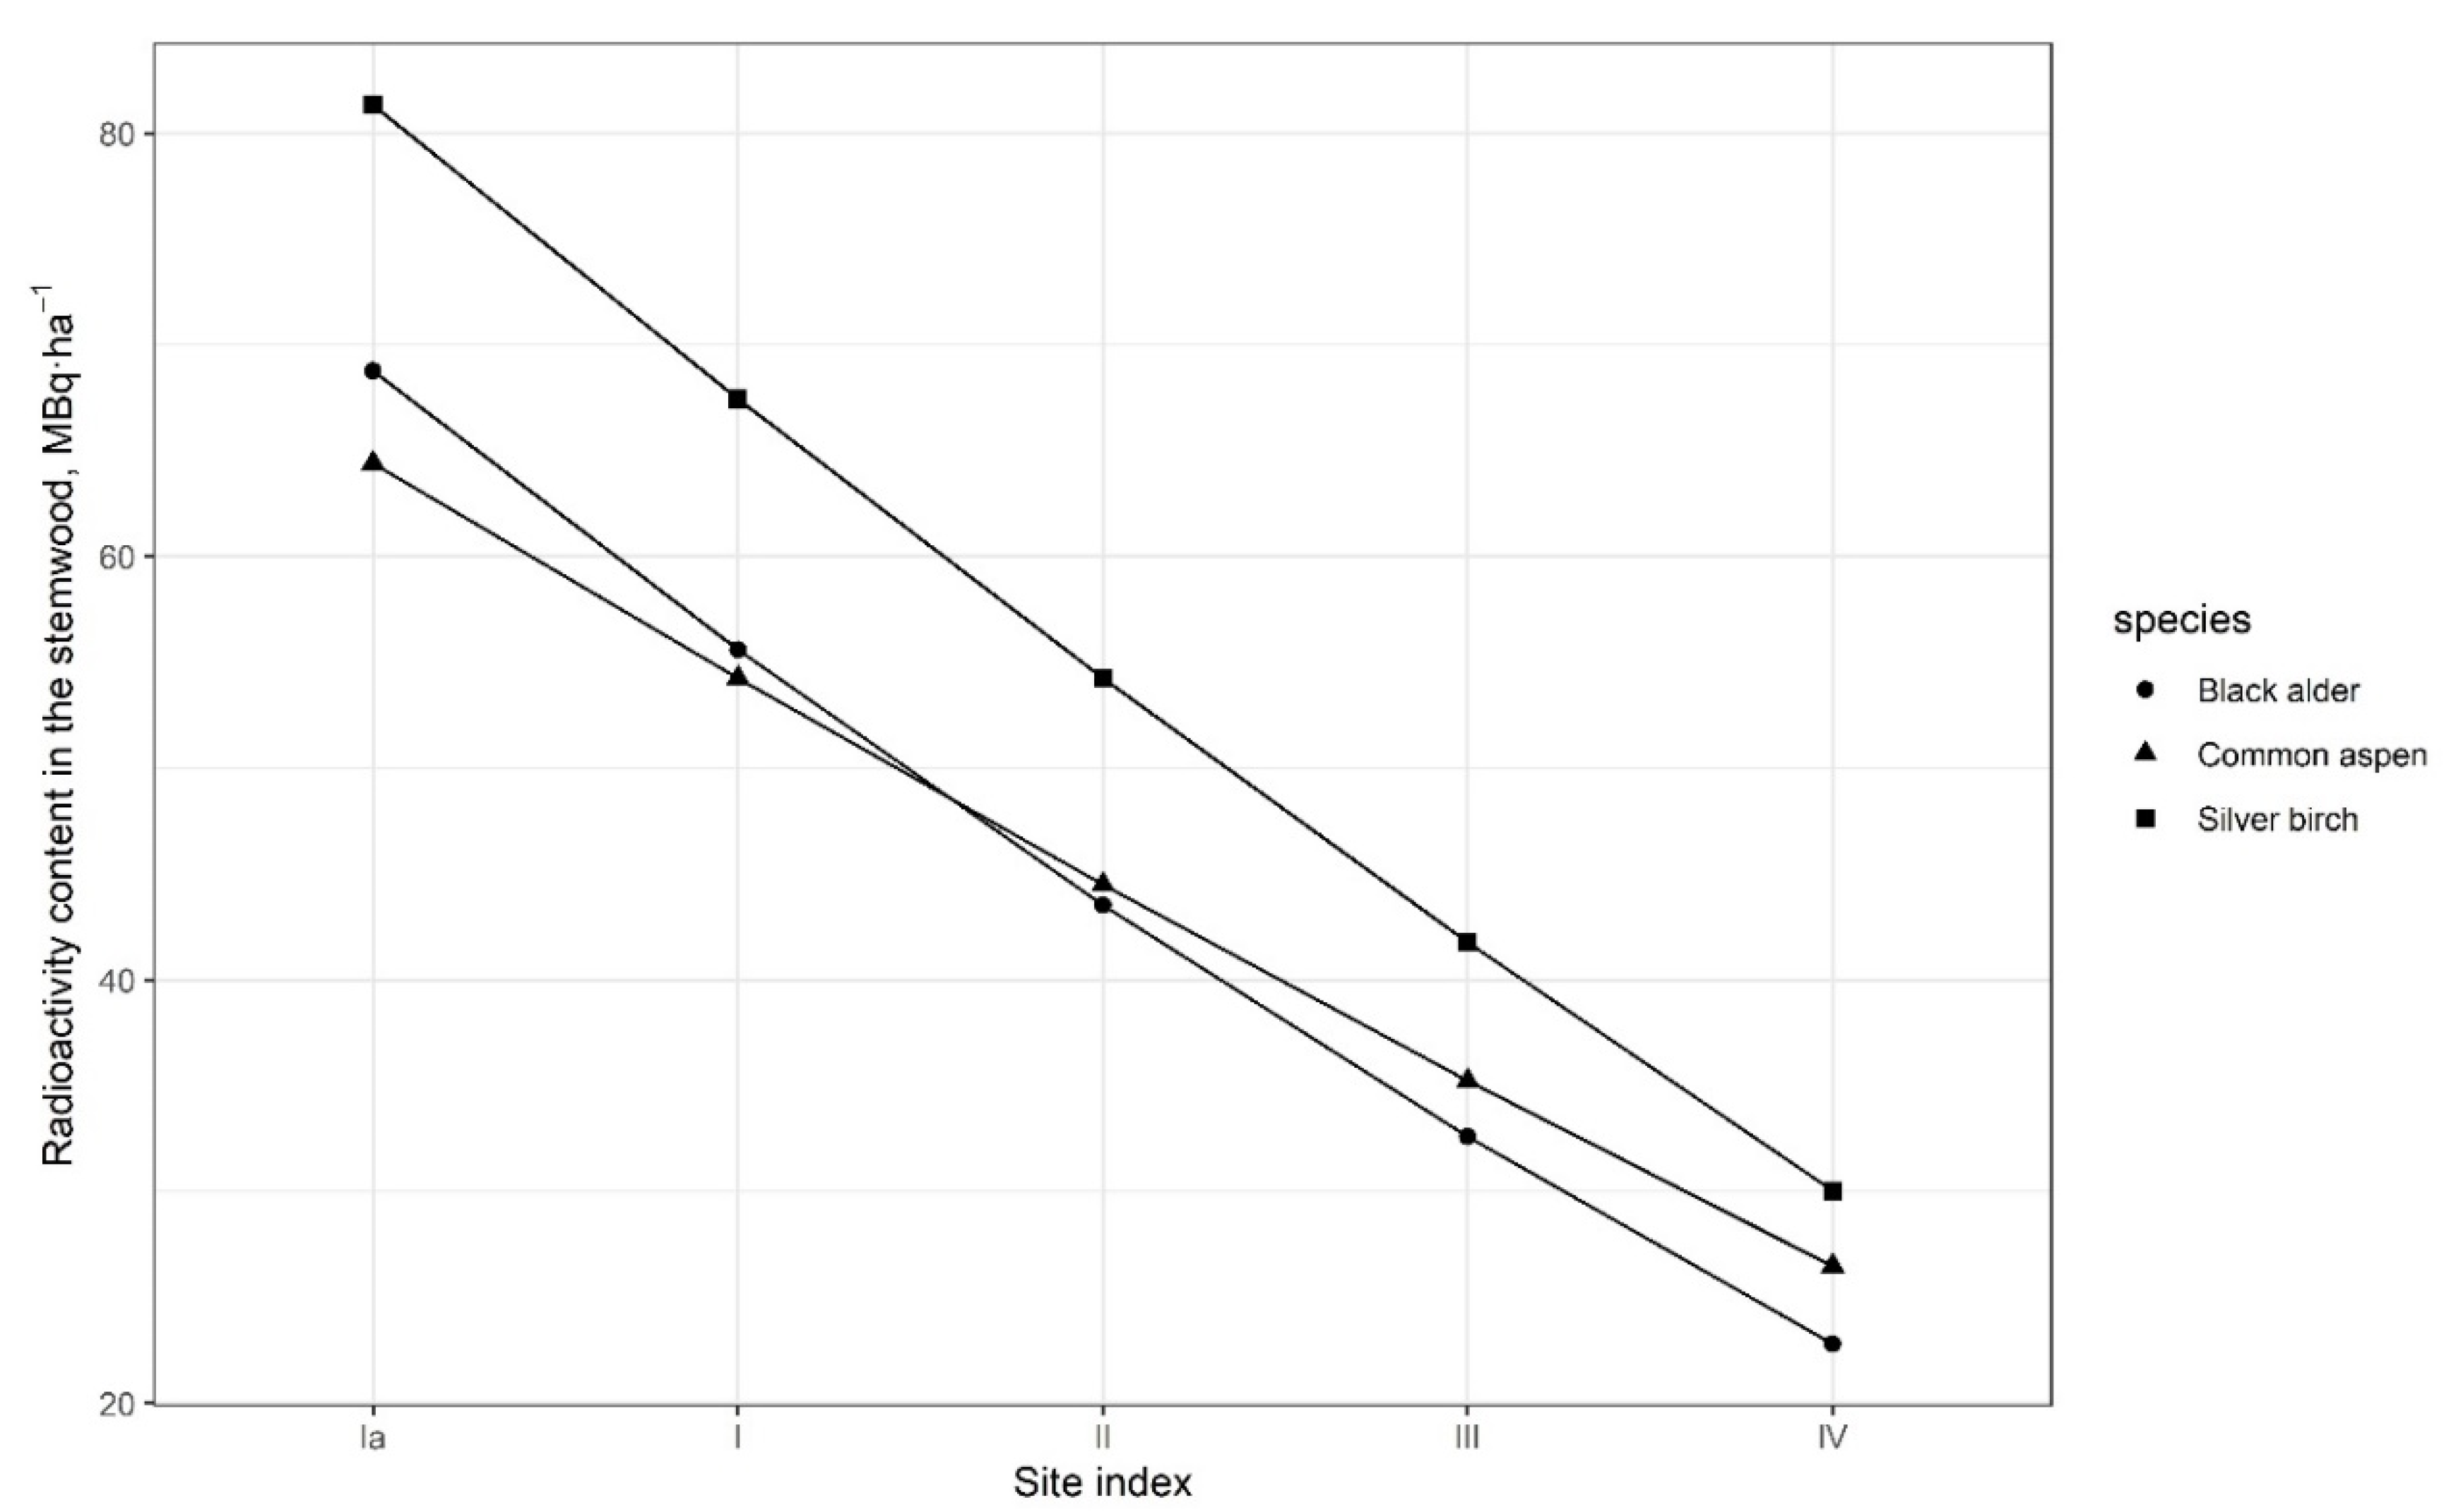
The stock of 90Sr is dependent on the growth potential, basic wood density, TF and level of the soil contamination (Figure 2). The last two factors mentioned, typically being changed over time [11], are the main features that determine whether stemwood from a given ecosystem can be used for utilization in various spheres.
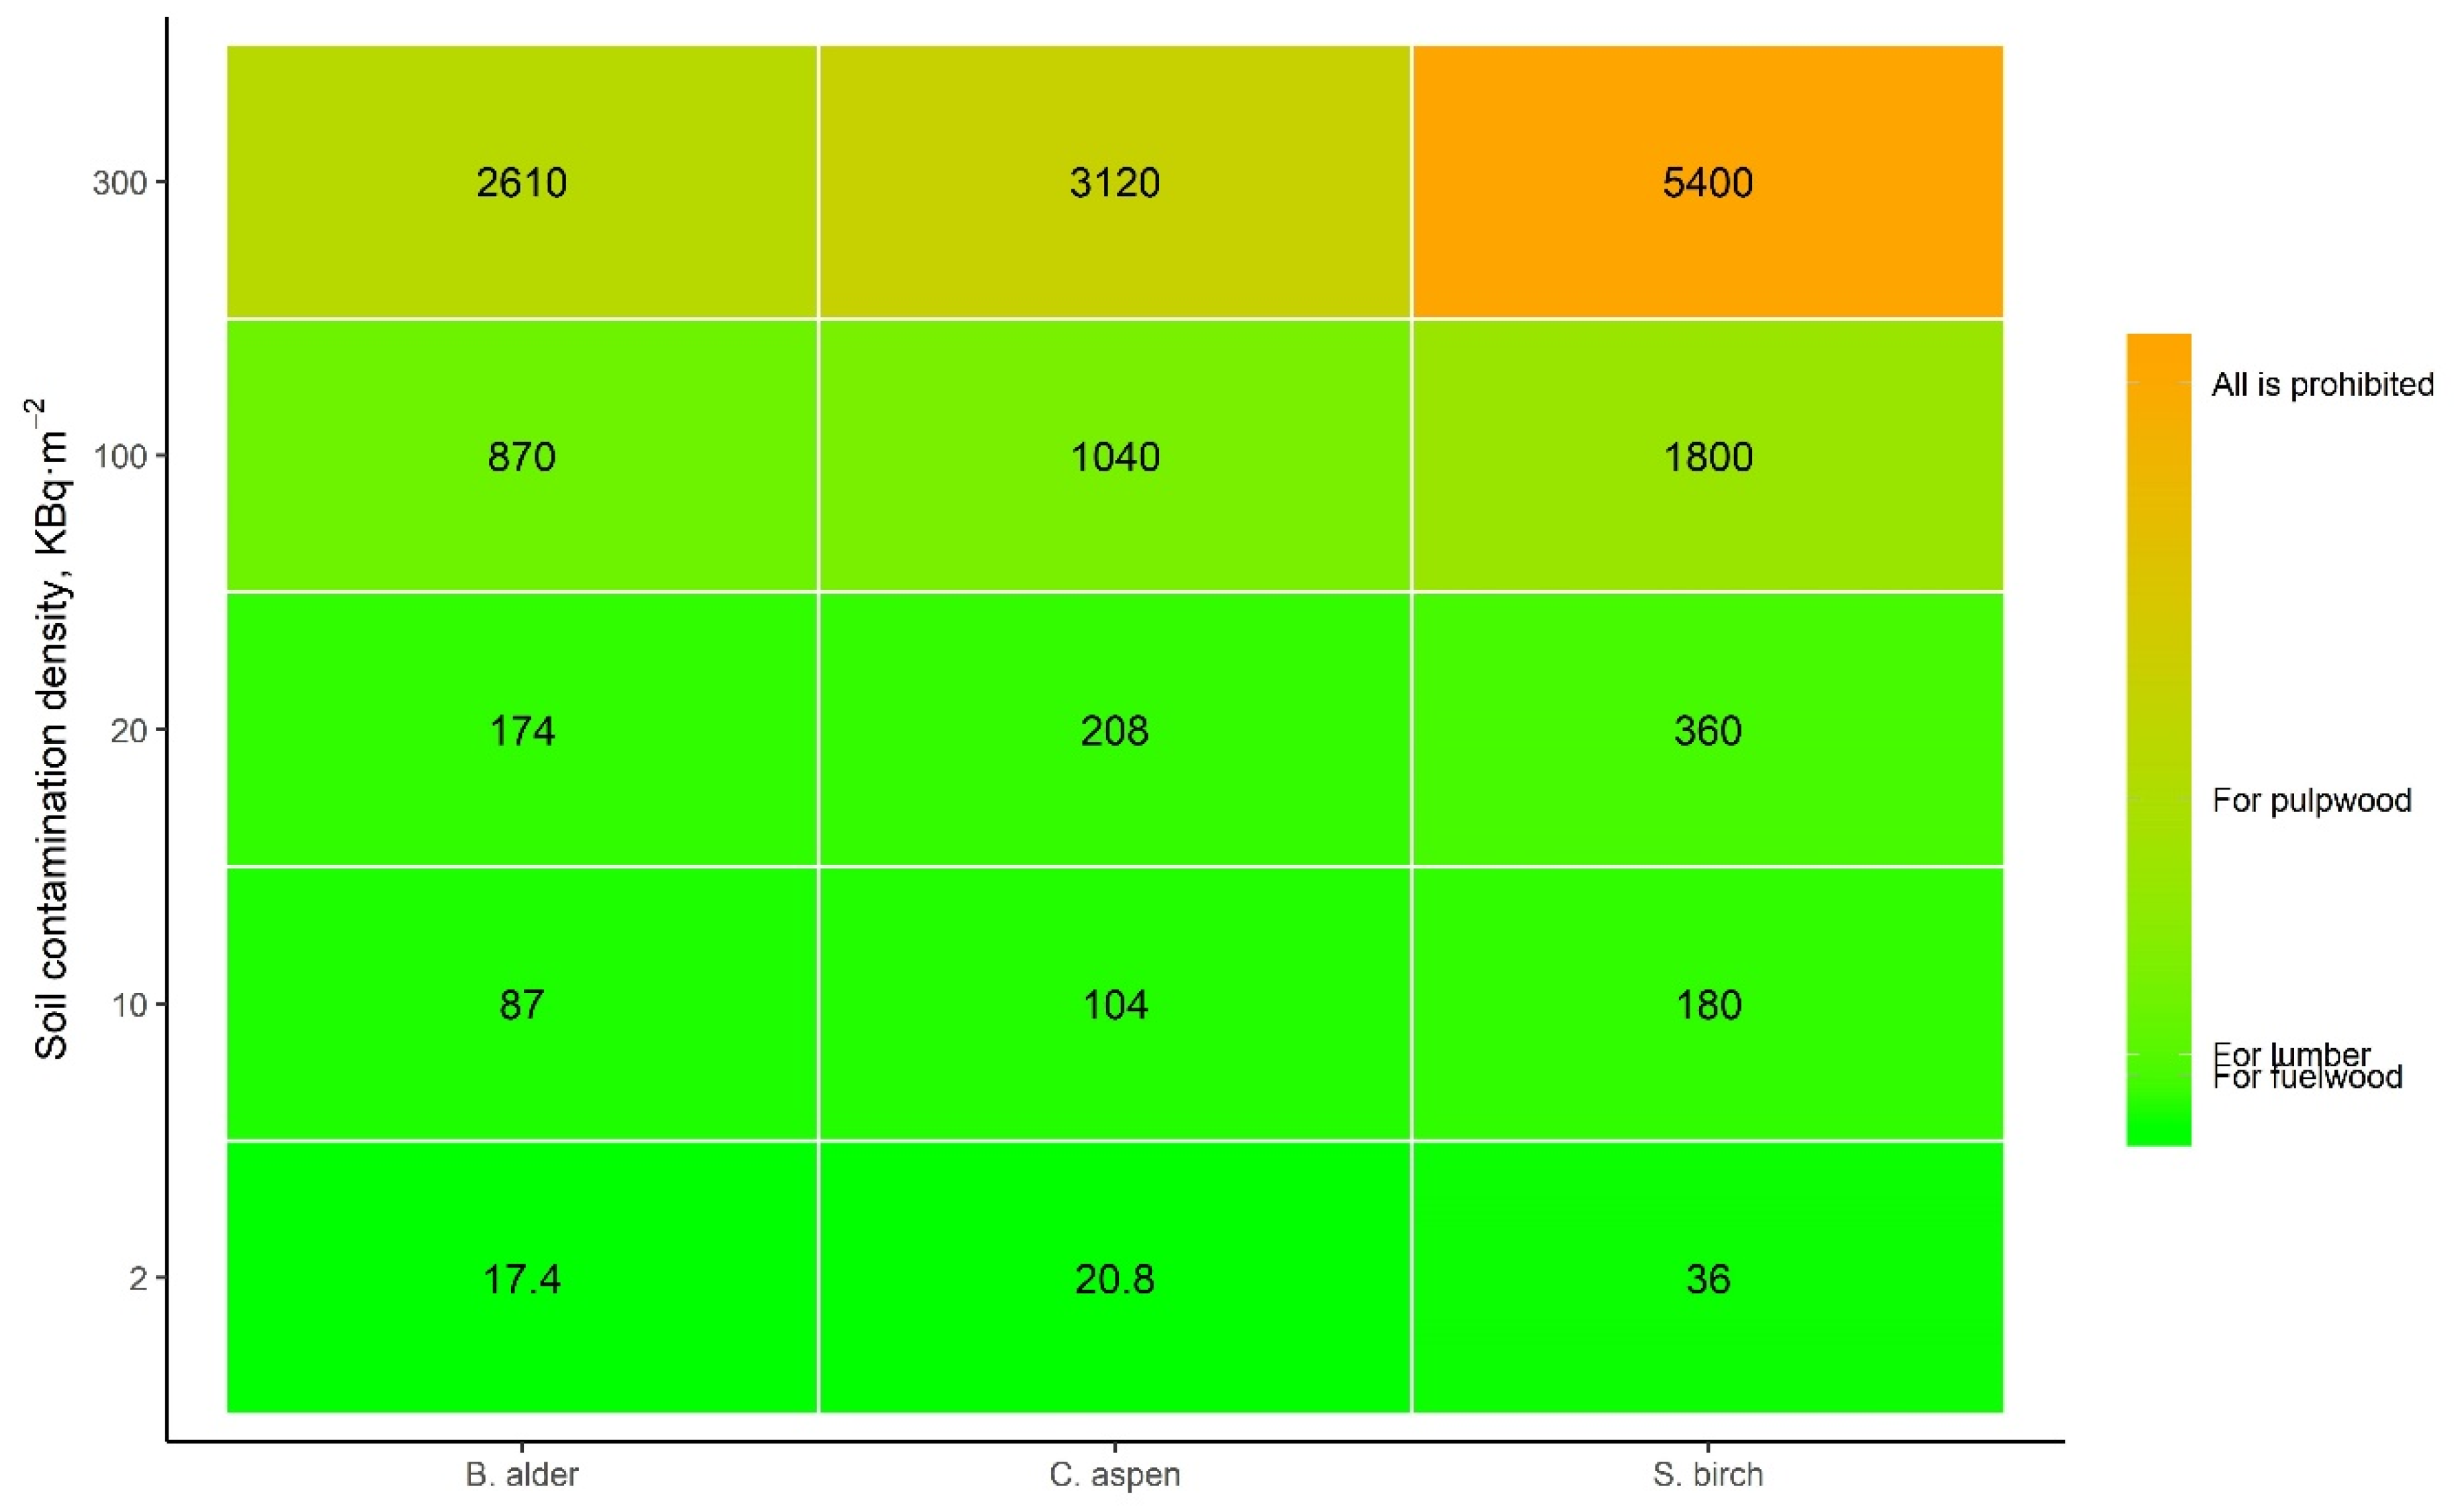
To date, there are no legal restrictions for woody product use according to the level of 90Sr contamination in Ukraine. Using respective standards implemented in the Russian Federation (Table 1, [8]) and estimated TFs (Table 4) for the stemwood, we can create a heatmap for all studied tree species (Figure 5), different soil contamination levels (2–100 KBq·m−2) and target commodities (use as a firewood, wood chips, sawn wood either for furniture or construction).
Only relatively high (>100 kBq·m−2) soil 90Sr contamination levels thus can entail prohibition to use local timber for the lumber materials, while the highest restrictions are met only for Silver birch at 300 kBq·m−2 soil contamination density (Figure 5). On the other hand, such large levels of soil contamination are presented only in a few areas within the Chernobyl Exclusion Zone [2], while forests of Ukrainian Polissya are mainly characterized by much lower 90Sr soil contamination level (IAEA, [26]). However, aiming to avoid credible biases and thus provide sufficient level of safety for people, there is an explicit necessity to develop and implement national regulations for wood use from the contaminated areas.
Exceeding the permissible level of 90Sr activity concentration in fuelwood (>60 Bq·kg−1) in Ukraine (Table 6) can be observed practically throughout the entire territory of the Chernobyl exclusion zone [10], as well as in the adjacent Ivankiv district of Kiev region and also Narodichy district of Zhytomyr region where 90Sr contamination density of soil is higher than 5.5 kBq·m−2 [2].
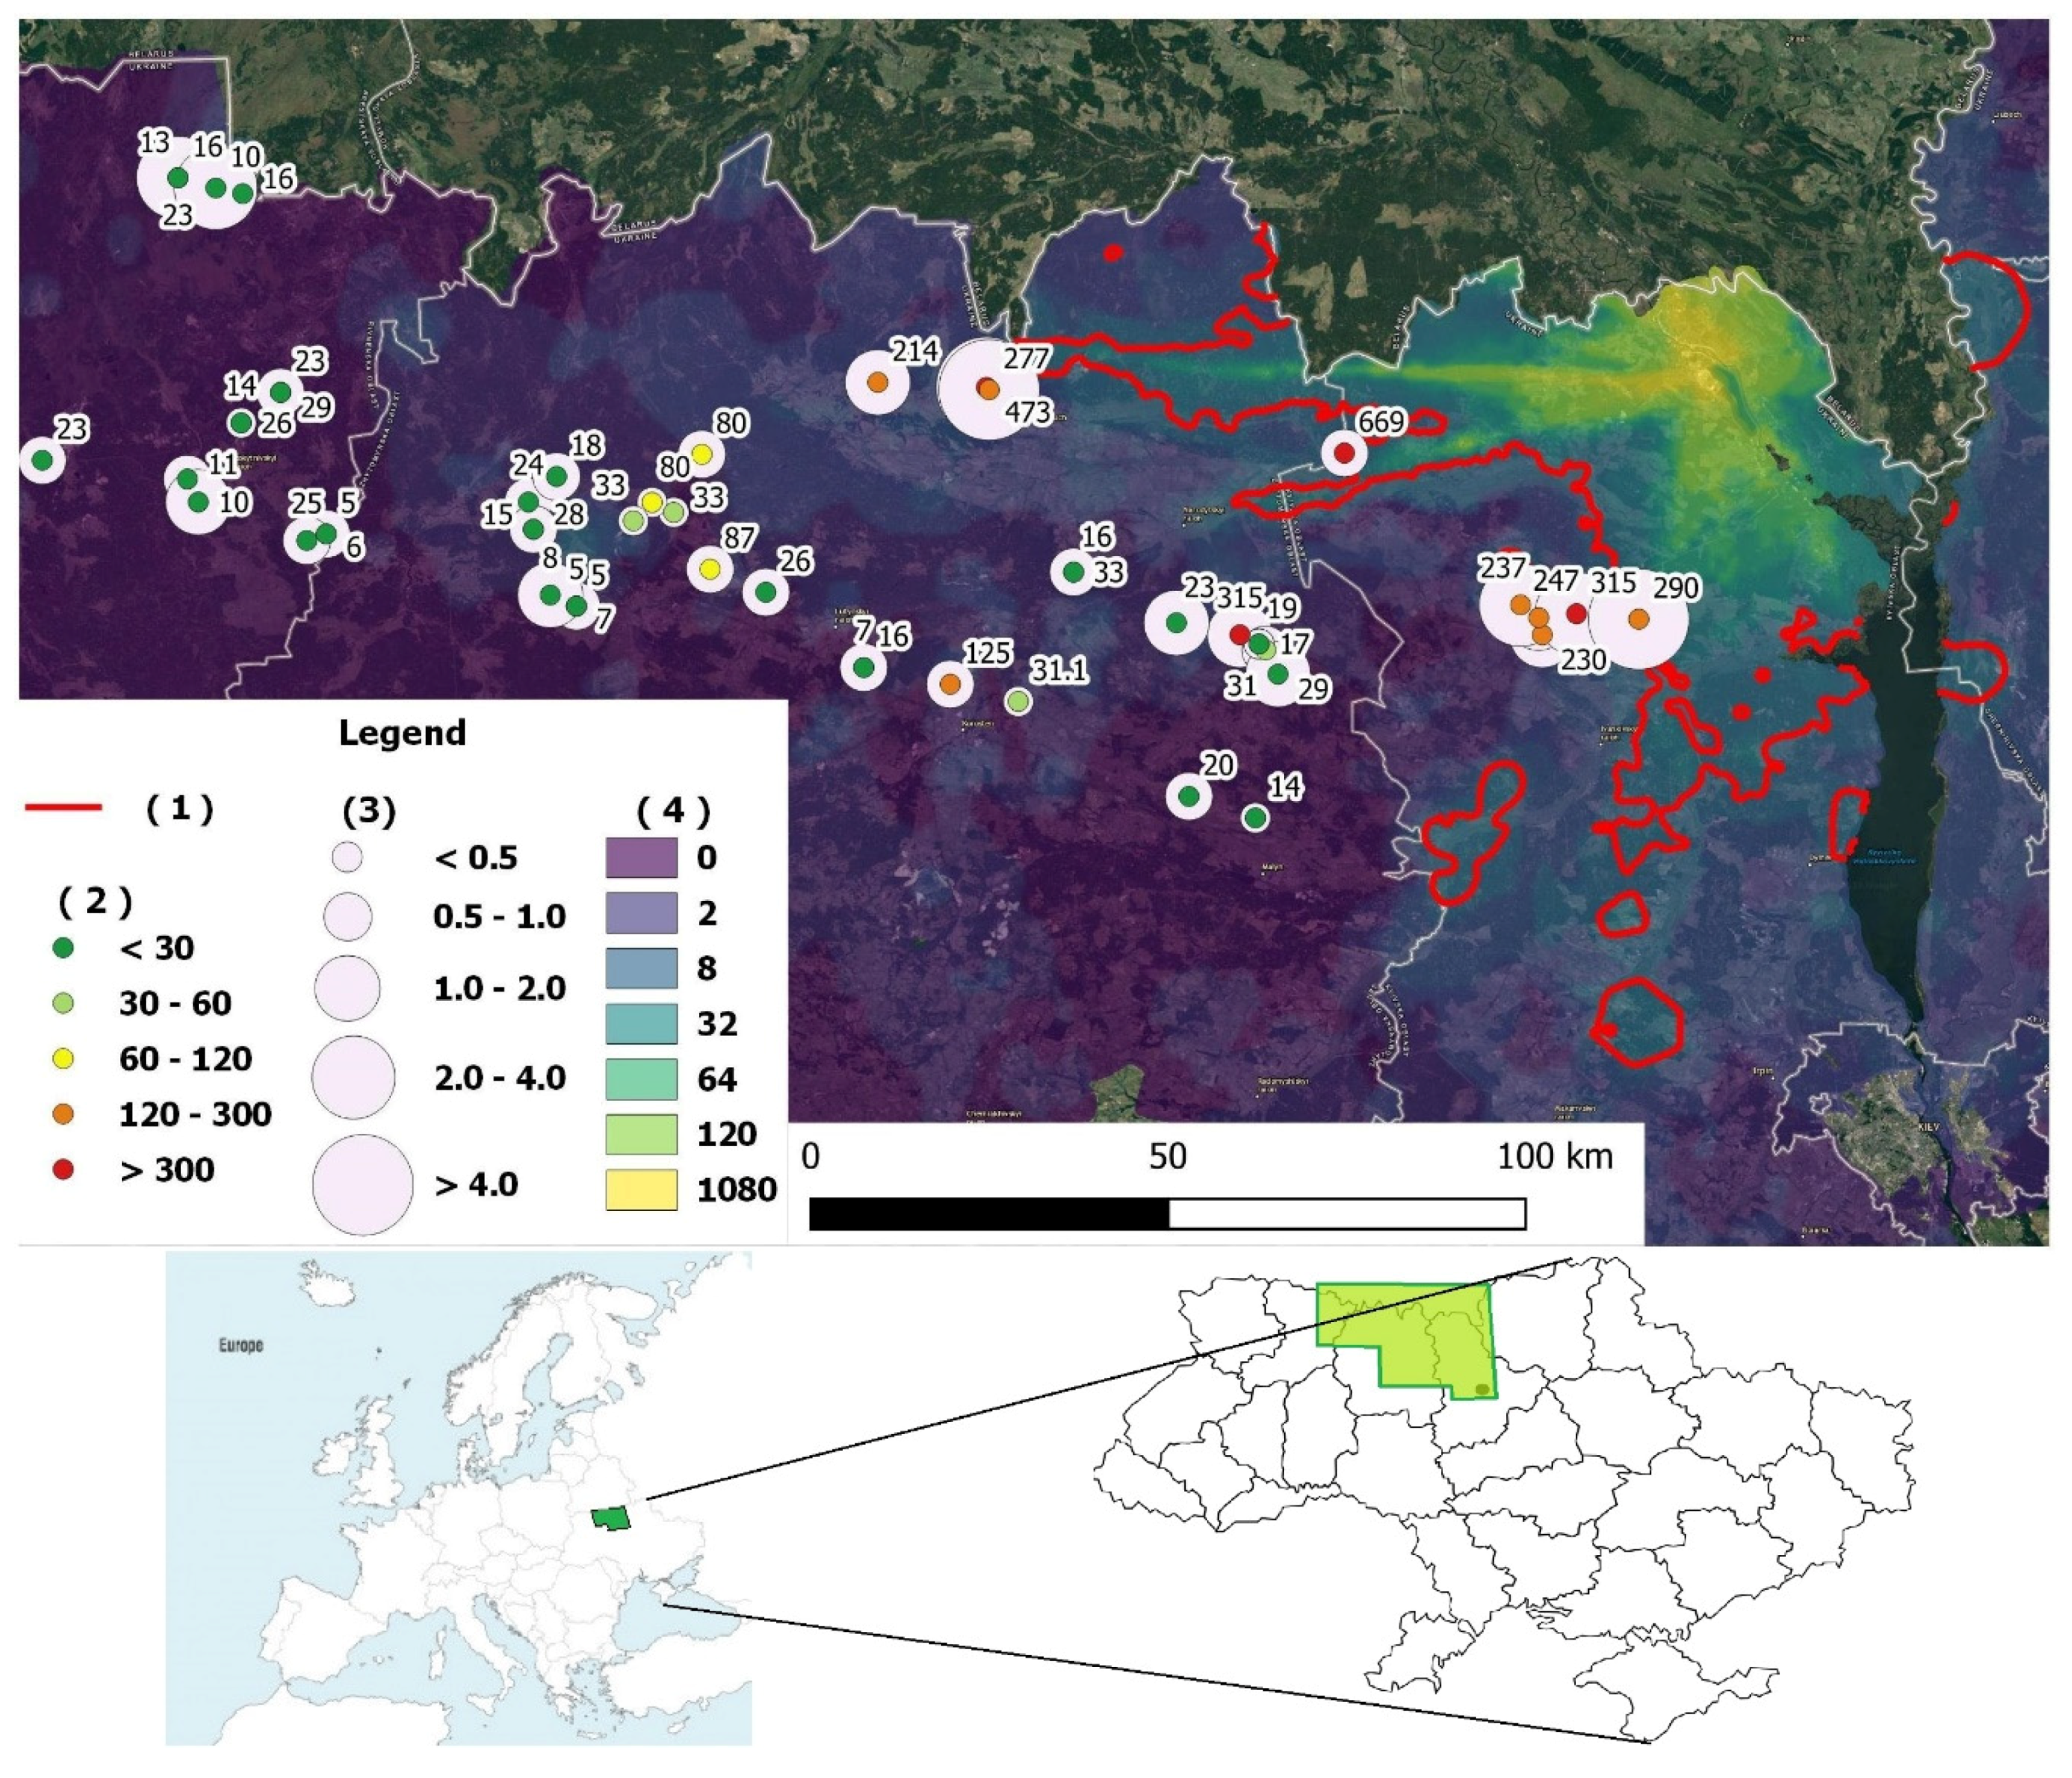
The data of dosimetry certification of the affected settlements as a result of radioactive contamination after the Chernobyl accident (Dosimetry certification, 1991) and field surveys [2] made it possible to allocate territories with 90Sr content more than 60 Bq·kg−1 in the stemwood for the studied species at a probability of 50% (Figure 6). The map (Figure 6) also shows sampling points of this research indicating the 90Sr activity concentration in wood and the density of soil contamination by radionuclide which was obtained as a result of laboratory measurements.
A deeper analysis of the geographical interpretation of the output data (Figure 6) indicates a significant likelihood of exceeding hygiene standards for 90Sr content of fuelwood from tree stems beyond the conditional line on the map. This is caused by the variability of the spatial contamination of radionuclides (point spots), even at considerable distances from the Chernobyl nuclear power plant (NPP), as well as by the growth of these species on the typical mineral poor soils of the region, where high 90Sr TF are usually observed. Such a situation is especially true for Silver birch, which is simultaneously deemed by calciphyte, and at a low content of exchange calcium in the soil, in tree organs happens to replaces calcium on chemically similar strontium, including radioactive strontium [11,13]. We have several sampling points with values of 90Sr activity concentration for Silver birch stemwood more than 60 Bq·kg−1 at a considerable distance from the Chernobyl exclusion zone. The real area with stem wood contaminated over the permitted level can be even larger, taking into account uneven distribution within the stem and higher level of 90Sr concentration in the bark [15].
Nowadays there is an issue related to forest management on contaminated areas. Importantly, there are three groups of stands according to land management features that require certain decision making. The first group is represented by state forests protected and managed by the Ukrainian forest service. Those stands are likely to be harvested after reaching the age of maturity. Logging will lead to spatial spreading of 90Sr accumulated in the tree stems with wood products during their entire life cycle. Second group includes forests within the Chernobyl Exclusion Zone, both existed before the disaster in 1986 and appeared after due to recovering of abandoned agricultural lands [17]. They accumulate 90Sr and its redistribution will be dependent on the fate of abovementioned stands.
The third group is presented by young forests that arose in Ukrainian Polissya after 1991 on abandoned arable land. Typically, these stands are owned by local settlers and do not have the official status of forest, and thus they do not have legal restrictions in their management and use. These occasionally can either reach maturity age or be cut with the aim to produce firewood or charcoal. The future of these three groups is likely to be different, and all of them will cause an impact on strontium redistribution in the environment. Thus, the study results confirm the hypothesis that by combining data of stand growth prediction and estimation of potential 90Sr content in the stemwood we can provide an informational basis for decision-making regarding radionuclide fluxes, and forest management and planning as well. Consequently, such an assessment opens the perspectives for further investigations of the secondary 90Sr environmental contamination emerged because of harvesting and other kinds of loggings.
Considering growth patterns of forest stands and transfer of 90Sr from the soil to wood biomass, we have predicted values of 90Sr content in the stemwood of studied tree species relating to soil contamination level, various site indexes and stand age (Appendix B). Use of such tables can foster previous analysis of the total 90Sr amount stored in the stemwood of forest ecosystems or that may be removed to the environment during logging.

5. Conclusions

Silver birch, Black alder, and Common aspen are fast growing and storing GSV species of Ukrainian Polissya. The largest growth velocity of S. birch and B. alder trees matches 10–40 years of stand age, while after 50 years this process tends to slow down, reaching the natural maturity age. Trees of Common aspen perform similarly, having the highest growth rate in age of 10–30 years and reaching the maturity age at above 50 years old.
Transfer factors of 90Sr to wood obtained in this study are dampening following the tree species order: Silver birch → Common aspen → Black alder. According to potential site productivity and soil contamination level, Silver birch forests can deposit in stemwood live biomass up to 300 MBq·ha−1, while for other species this value will be lower due to more limited growth capacity.
IAEA guidelines regarding 90Sr transfer factors from different soil to the stemwood are should be reviewed, since this study overall agrees with previous papers of other authors, which demonstrate the relatively high values of the developed TFs.
The paper demonstrates that 90Sr activity concentration of fuelwood of deciduous species can exceed critical level (according to the Ukrainian legislation) even at considerable distances (more than 50 km) from the Chernobyl Exclusion Zone.

Author Contributions

Conceptualization, A.B., V.K.; Methodology, A.S., D.S., A.B., D.H., and V.K.; Software, D.H.; Validation, M.M., D.H.; Formal analysis, M.M., D.S., V.M. and V.K.; Investigation, A.B., D.H. and M.M.; Resources, A.B. and D.S.; Data curation, A.B., D.H., M.M., L.O. and D.S.; Writing—original draft preparation, M.M., D.H. and A.B.; Writing—review and editing, A.S., V.K., D.S., V.M. and P.L.; Visualization, M.M. and D.H.; Supervision, A.B., D.S. and V.K.; Project administration, A.B., D.S.; Funding acquisition, D.S. All authors have read and agreed to the published version of the manuscript.

Funding

This research was funded by Ministry of Education and Science of Ukraine (Grant No. M/39-2019) and OeAD-GmbH (Grant No. UA 08/2018) within the joint scientific project "Disturbances impact on forest ecosystem services of Chernobyl Exclusion Zone".

Acknowledgments

The authors thank Liudmyla Yoschenko for technical support.

Conflicts of Interest

The authors declare no conflict of interest. The funders had no role in the design of the study; in the collection, analyses, or interpretation of data; in the writing of the manuscript; or in the decision to publish the results.

Appendix A

Table A1. Polynomial coefficients (3–5) of developed models of dynamics of major indicators of growth (Equation 2) for studied tree species.
Para-MetersModel Coefficients
c11c12c13c21c22c23c31c32c33
Silver birch (seed origin)
H3.1013E+01−4.1085E+00−1.1739E−032.9481E−02−1.5460E−053.4627E−051.3704E+00−7.0528E−049.3915E−04
D3.7892E+01−4.7129E+00−3.3323E−022.6053E−022.9035E−084.9777E−051.3579E+00−4.3205E−041.5840E−03
GSV2.5236E+02−4.4178E+011.1201E+005.0381E−024.5905E−05−2.6364E−052.6670E+001.7175E−03−1.0777E−03
Black alder (vegetative origin)
H3.3876E+01−4.1798E+004.3079E−032.4364E−021.0670E−04−2.4075E−058.2401E−011.4254E−03−4.8521E−04
D4.4881E+01−4.4452E+00−8.1368E−021.6278E−026.5589E−061.7410E−058.5576E−013.2882E−041.6957E−04
GSV4.1694E+02−8.3191E+013.4416E+004.4714E−026.5404E−05−1.0022E−041.5995E+001.8133E−03−2.8117E−03
Common aspen (vegetative origin)
H3.4820E+01−4.2585E+001.1593E−033.0171E−02−1.4408E−05−1.7904E−051.3725E+00−1.0778E−03−3.7602E−04
D4.7245E+01−5.1804E+00−4.4162E−022.3480E−02−3.6746E−05−7.3929E−061.3471E+00−3.1509E−03−4.4189E−04
GSV6.5557E+02−1.0606E+022.6089E+002.7809E−028.0186E−05−7.0258E−051.8449E+003.9320E−03−3.4469E−03

Appendix B

Table A2. Support tables of 90Sr content in stemwood live biomass of various stand age, tree species, and site indexes.
Stand Age90Sr Content in Stemwood Live Biomass, MBq·ha−1
Soil Contamination Level 2 kBq·m−2Soil Contamination Level 4 kBq·m−2Soil Contamination Level 10 kBq·m−2Soil Contamination Level 20 kBq·m−2Soil Contamination Level 40 kBq·m−2Soil Contamination Level 100 kBq·m−2
IaIIIIIIIVIaIIIIIIIVIaIIIIIIIVIaIIIIIIIVIaIIIIIIIVIaIIIIIIIV
Silver birch (seed origin)
100.40.30.30.20.10.80.60.60.40.221.51.510.54332186642201515105
150.90.70.60.40.31.81.41.20.80.64.53.5321.597643181412864535302015
201.41.10.90.70.52.82.21.81.4175.54.53.52.5141197528221814107055453525
251.91.61.310.73.83.22.621.49.586.553.519161310738322620149580655035
302.421.61.20.94.843.22.41.81210864.52420161294840322418120100806045
352.82.31.91.415.64.63.82.821411.59.57528231914105646382820140115957050
403.22.62.11.61.26.45.24.23.22.4161310.586322621161264524232241601301058060
453.52.92.31.81.375.84.63.62.617.514.511.596.5352923181370584636261751451159065
503.73.12.51.91.47.46.253.82.818.515.512.59.57373125191474625038281851551259570
553.93.22.621.47.86.45.242.819.516131073932262014786452402819516013010070
604.13.42.72.11.58.26.85.44.2320.51713.510.57.54134272115826854423020517013510575
654.23.52.82.21.58.475.64.432117.514117.54235282215847056443021017514011075
704.33.62.92.21.68.67.25.84.43.221.51814.51184336292216867258443221518014511080
Black alder (vegetative origin)
100.90.80.50.40.31.81.610.80.64.542.521.598543181610864540252015
151.51.20.80.60.432.41.61.20.87.5643215128643024161287560403020
2021.71.10.80.543.42.21.61108.55.542.520171185403422161010085554025
252.521.310.7542.621.412.5106.553.52520131075040262014125100655035
302.92.41.51.10.85.84.832.21.614.5127.55.542924151185848302216145120755540
353.22.61.71.30.96.45.23.42.61.816138.56.54.53226171396452342618160130856545
403.52.91.81.40.975.83.62.81.817.514.5974.53529181497058362818175145907045
453.73.11.91.417.46.23.82.8218.515.59.57537311914107462382820185155957050
503.93.221.51.17.86.4432.219.516107.55.5393220151178644030221951601007555
5543.32.11.61.186.64.23.22.22016.510.585.5403321161180664232222001651058055
604.13.42.21.61.18.26.84.43.22.220.5171185.5413422161182684432222051701108055
654.23.52.21.71.28.474.43.42.42117.5118.56423522171284704434242101751108560
704.33.62.31.71.28.67.24.63.42.421.51811.58.56433623171286724634242151801158560
Common aspen (vegetative origin)
100.30.30.20.20.10.60.60.40.40.21.51.5110.53322166442151510105
150.70.50.50.40.31.4110.80.63.52.52.521.575543141010863525252015
2010.80.70.50.421.61.410.8543.52.521087542016141085040352520
251.31.10.90.70.52.62.21.81.416.55.54.53.52.5131197526221814106555453525
301.71.41.10.90.73.42.82.21.81.48.575.54.53.51714119734282218148570554535
3521.71.41.10.843.42.82.21.6108.575.54201714118403428221610085705540
402.31.91.61.20.94.63.83.22.41.811.59.5864.5231916129463832241811595806045
452.52.11.81.4154.23.62.8212.510.597525211814105042362820125105907050
502.82.41.91.51.15.64.83.832.214129.57.55.528241915115648383022140120957555
5532.52.11.71.2654.23.42.41512.510.58.56302521171260504234241501251058560
603.22.72.21.81.36.45.44.43.62.61613.51196.5322722181364544436261601351109065

References

  1. Yoschenko, V.; Ohkubo, T.; Kashparov, V. Radioactive contaminated forests in Fukushima and Chernobyl. J. For. Res. 2018, 23, 3–14. [Google Scholar] [CrossRef]
  2. Kashparov, V.; Levchuk, S.; Zhurba, M.; Protsak, V.; Khomutinin, Y.; Beresford, N.A.; Chaplow, J.S. Spatial datasets of radionuclide contamination in the Ukrainian Chernobyl Exclusion Zone. Earth Syst. Sci. Data 2018, 10, 339–353. [Google Scholar] [CrossRef] [Green Version]
  3. Nadtochii, P.; Malynovskiy, A.; Mozhar, A. Experience of Chernobyl Disaster Consequences Overcoming (Agriculture and Forestry Sectors); Svit: Kyiv, Ukraine, 2003; p. 371. [Google Scholar]
  4. Jakob, P.; Fesenko, S.; Bogdevitch, I.; Kashparov, V.; Sanzharova, N.; Grebenshikova, N.; Isamov, N.; Lazarev, N.; Panov, A.; Ulanovsky, A.; et al. Rural lands affected by the Chernobyl accident: Radiation exposure and remediation strategies. Sci. Total Environ. 2009, 408, 14–25. [Google Scholar] [CrossRef] [PubMed]
  5. Fesenko, S.; Jacob, P.; Ulanovsky, A.; Chupov, A.; Bogdevich, I.; Sanzharova, N.; Kashparov, V.; Panov, A.; Zhuchenka, Y. Justification of remediation strategies in the long term after the Chernobyl accident. J. Environ. Radioact. 2013, 119, 39–47. [Google Scholar] [CrossRef] [PubMed]
  6. Gupta, D.K.; Walther, C. Behaviour of Strontium in Plants and the Environment; Springer International Publishing: Basel, Switzerland, 2017; pp. 1–145. [Google Scholar]
  7. HNPAR. Hygienic Standard of the Specific Activity of 137Cs and 90Sr Radionuclides in the Wood and Woody Products; Implemented by the Order of Ministry of Health of Ukraine: Kyiv, Ukraine, 2005; No. 573; p. 3. [Google Scholar]
  8. Russian Science Institute of Forestry Chemistry of Russian State Forestry. Allowable Levels of 137Cs and 90Sr Content in the Forestry Products; Russian Science Institute of Forestry Chemistry of Russian State Forestry: Moscow, Russia, 1999; p. 2. [Google Scholar]
  9. Otreshko, L.; Zhurba, M.; Bilous, A.; Yoschenko, L. 90Sr and 137Cs content in wood along the southern fuel trace of Chernobyl radioactive fallout. Nucl. Phys. Atomic Energy 2015, 16, 183–192. [Google Scholar] [CrossRef] [Green Version]
  10. Yoschenko, V.; Kashparov, V.; Ohkubo, T. Chapter 1. Radioactive Contamination in Forest by the Accident of Fukushima Daiichi Nuclear Power Plant: Comparison with Chernobyl. In Radiocesium Dynamics in a Japanese Forest Ecosystem: Initial Stage of Contamination After the Incident at Fukushima Daiichi Nuclear Power Plant; Takenaka, C., Hijii, N., Kaneko, N., Ohkubo, T., Eds.; Springer Singapore: Singapore, 2019; pp. 3–22. [Google Scholar] [CrossRef]
  11. Perevolotskiy, A. Redistribution of 137Cs and 90Sr in the Forest Biogeocoenoses; RNIUM ‘Insitute of Radiology’: Homel, Belarus, 2006; p. 255. [Google Scholar]
  12. Davydov, M.; Protas, I.; Savuschyk, M. Accumulation of radionuclides in the main compartments of forest ecosystems of Kyiv Polissya and Forest-Steppe. Nucl. Energy Environ. 2014, 2, 25–31. [Google Scholar]
  13. Scheglov, A. Biogeochemistry of Technogenic Radionuclides in Forest Ecosystems: Based on Materials of 10-Year Research in the Area Contaminated after Chernobyl NPP Disaster; Nauka: Moscow, Russia, 1999; p. 268. [Google Scholar]
  14. Orlov, A.; Krasnov, V.; Pryschepa, A. Radioactively contaminated forests as the critical landscapes: Radioactivity of the food stuff and impact on the dose formation of the internal humans’ exposure (analytical review). Zhytomyr ZITI 2002. [Google Scholar]
  15. Holiaka, D.; Levchuk, S.; Protsak, V.; Kashparov, V. Distribution of 137Cs activity concentration in wood Scots pine (Pinus sylvestris L.) of Zhytomyr Polissya after the Chernobyl accident. Nucl. Phys. Atomic Energy 2017, 18, 63–71. [Google Scholar] [CrossRef] [Green Version]
  16. Mamikhin, S.; Manahov, D.; Scheglov, A. Comparative analysis of radionuclides distribution and their chemical analogues in the aboveground compartments of the tree plants in a quasi-equilibrium state. Radiat. Biol. Radioecol. 2008, 48, 654–659. [Google Scholar]
  17. Bilous, A.; Myroniuk, V.; Holiaka, D.; Bilous, S.; See, L.; Schepaschenko, D. Mapping growing stock volume and forest live biomass: A case study of the Polissya region of Ukraine. Environ. Res. Lett. 2017, 12, 105001. [Google Scholar] [CrossRef] [Green Version]
  18. Bilous, A.M.; Voloshchuk, N.M.; Kovbasa, I. Peculiarities of mortmass mycobiota formation in soft-deciduous young forests on old-tillage soils of the chernihiv polissya. Mikrobiol. Zhurnal 2013, 75, 59–65. [Google Scholar]
  19. Lakyda, P.; Shvidenko, A.; Bilous, A.; Myroniuk, V.; Matsala, M.; Zibtsev, S.; Shepaschenko, D.; Holiaka, D.; Vasylyshyn, R.; Lakyda, I.; et al. Impact of disturbances on the carbon cycle of forest ecosystems in Ukrainian Polissya. Forests 2019, 10, 337. [Google Scholar] [CrossRef] [Green Version]
  20. Richards, F. A flexible growth function for empirical use. J. Exp. Bot. 1959, 290–300. [Google Scholar] [CrossRef]
  21. Ministry of Agrarian Policy and Food of Ukraine. The Quality of the Soil: Determining Density of the Contamination of Agricultural Land by Artificial Radionuclides; Ministry of Agrarian Policy and Food of Ukraine: Kyiv, Ukraine, 2006.
  22. Pavlotskaya, F. Main principles of radiochemical analysis of environment objects and methods of measurements of strontium and transuranium elements radionuclides. J. Anal. Chem. 1997, 52, 126–143. [Google Scholar]
  23. International Atomic Energy Agency. Handbook of Parameter Values for the Prediction of Radionuclide Transfer in Terrestrial and Fresh-Water Environments; IAEA-TRS-472; International Atomic Energy Agency: Vienna, Austria, 2010; p. 194. [Google Scholar]
  24. Salbu, B.; Kashparov, V.; Lind, O.C.; Garcia-Tenorio, R.; Johansen, M.P.; Child, D.P.; Roos, P.; Sancho, C.M. Challenges associated with the behavior of radioactive particles in the environment. J. Environ. Radioact. 2018, 186, 101–115. [Google Scholar] [CrossRef] [PubMed] [Green Version]
  25. Kashparov, V.; Salbu, B.; Levchuk, S.; Protsak, V.; Maloshtan, I.; Simonucci, C.; Courbet, C.; Nguyen, H.; Sanzharova, N.; Zabrotsky, V. Environmental behavior of radioactive particles from Chernobyl. J. Environ. Radioact. 2019, 208–209, 106025. [Google Scholar] [CrossRef] [PubMed]
  26. International Atomic Energy Agency. Environmental consequences of the Chernobyl accident and their remediation: Twenty years of experience. In Report of the Chernobyl Forum Expert Group ‘Environment’; IAEA: Vienna, Austria, 2006. [Google Scholar]
1
Silver birch (seed origin)
Figure 1. Observed versus predicted values: top row indicates D, middle - H and bottom - GSV. Plots are arranged according tree species: (a,d,g—Silver birch; b,e,h—Black alder; c,f,i—Common aspen). Red line illustrates 1:1 agreement between values.
Forests 11 00270 g001
Figure 2. Dependence of the 90Sr activity stock in stemwood (at 40 kBq·m−2 in soil and site index I) on various age of forest stands.
Forests 11 00270 g002
Figure 3. Dependence of the 90Sr activity stock in stemwood (at 40 kBq·m−2 in soil and stands age 60 years) on various site index of forest stands.
Forests 11 00270 g003
Figure 4. Comparison of transfer factors (TF) of 90Sr from soil to the stemwood of studied tree species (a—arithmetical means, b—geometrical means). Error bars show arithmetical standard deviations (SD) of TFs.
Forests 11 00270 g004
Figure 5. Heatmap of 90Sr transition to the stemwood at different soil contamination (kBq m−2) levels according to restrictions implemented in Russia. Only specific discrete values of the soil contamination density are given.
Forests 11 00270 g005
Figure 6. 90Sr contamination density of soil and sampling points for stem wood and soil within forest stands: 1—border of territories with contamination of stem wood >60 Bq·kg−1 at P = 50%; 290Sr activity concentration of stem wood from sampling point (with 90Sr activity concentration values on the map), Bq·kg−1; 390Sr contamination density of soil from sampling point, kBq·m−2; 490Sr contamination density of soil, kBq·m−2. Note: Google Maps and Environmental Systems Research Institute (ESRI) Boundaries and Place are a background of the map.
Forests 11 00270 g006
Table 1. Existing restrictions for forest products use according to 90Sr contamination.
Group of Products90Sr Activity Concentration, Bq·kg−1
Russia (1997), [7]Ukraine (2005), [6]
Round timber for constructions of residential buildings5200
Other round timber5200
Pulpwood2300
Firewood37060
Lumber, products made out of wood and woody materials for constructions of residential buildings5200
Lumber and other wood products520
Other non-food forest products520–2300
Table 2. Encoding system for site indexes.
ParameterAppropriateness
Site IndexIfIeIdIcIbIaIIIIIIIV
Respective code−5−4−3−2−101234
Mean tree height (m) at 50 years old (seed origin)35.933.130.327.525.121.818.916.113.210.4
Mean tree height (m) at 50 years old (vegetative origin)40.437.434.431.328.325.322.319.316.313.2
Table 3. Distribution of area of studied tree species by site indexes.
Tree SpeciesSite Index
IcIbIaIIIIIIIVOther
Silver birch0.73.09.228.041.712.33.41.7
Black alder0.41.25.020.154.016.81.90.6
Common aspen1.02.715.543.130.25.10.71.6
Table 4. Accuracy of developed growth models.
Metrics of Model PerformanceBiophysical Parameters of the Stands
Silver BirchBlack AlderCommon Aspen
D, cmH, mGSV, m3D, cmH, mGSV, m3D, cmH, mGSV, m3
RMSE4.32.158.44.22.082.34.12.365.3
RSS215450440,5228179540388,2523213662952,8953
ME0.730.880.580.790.870.430.720.900.78
Table 5. Experimental data on estimated transfer factors (TFs) for 90Sr (as of January 2018).
Tree SpeciesNo. of SamplingsTF from Soil to Stemwood,
n × 10−3 m2·kg−1
Arithmetic MeanSDGeometrical MeanGSD
Silver birch3227.526.618.02.1
Black alder612.810.18.72.8
Common aspen612.67.310.46.0
Table 6. Probability of excess for 90Sr activity concentration in fuel wood (>60 Bq·kg−1).
Tree SpeciesTF × 103, m2·kg−1At a Density Contamination Larger, kBq⋅m−2
p = 50%p = 95%p = 99%p = 50%p = 95%p = 99%
Silver birch18.077973.330.780.62
Black alder8.748686.901.250.88
Common aspen10.438535.771.561.14

