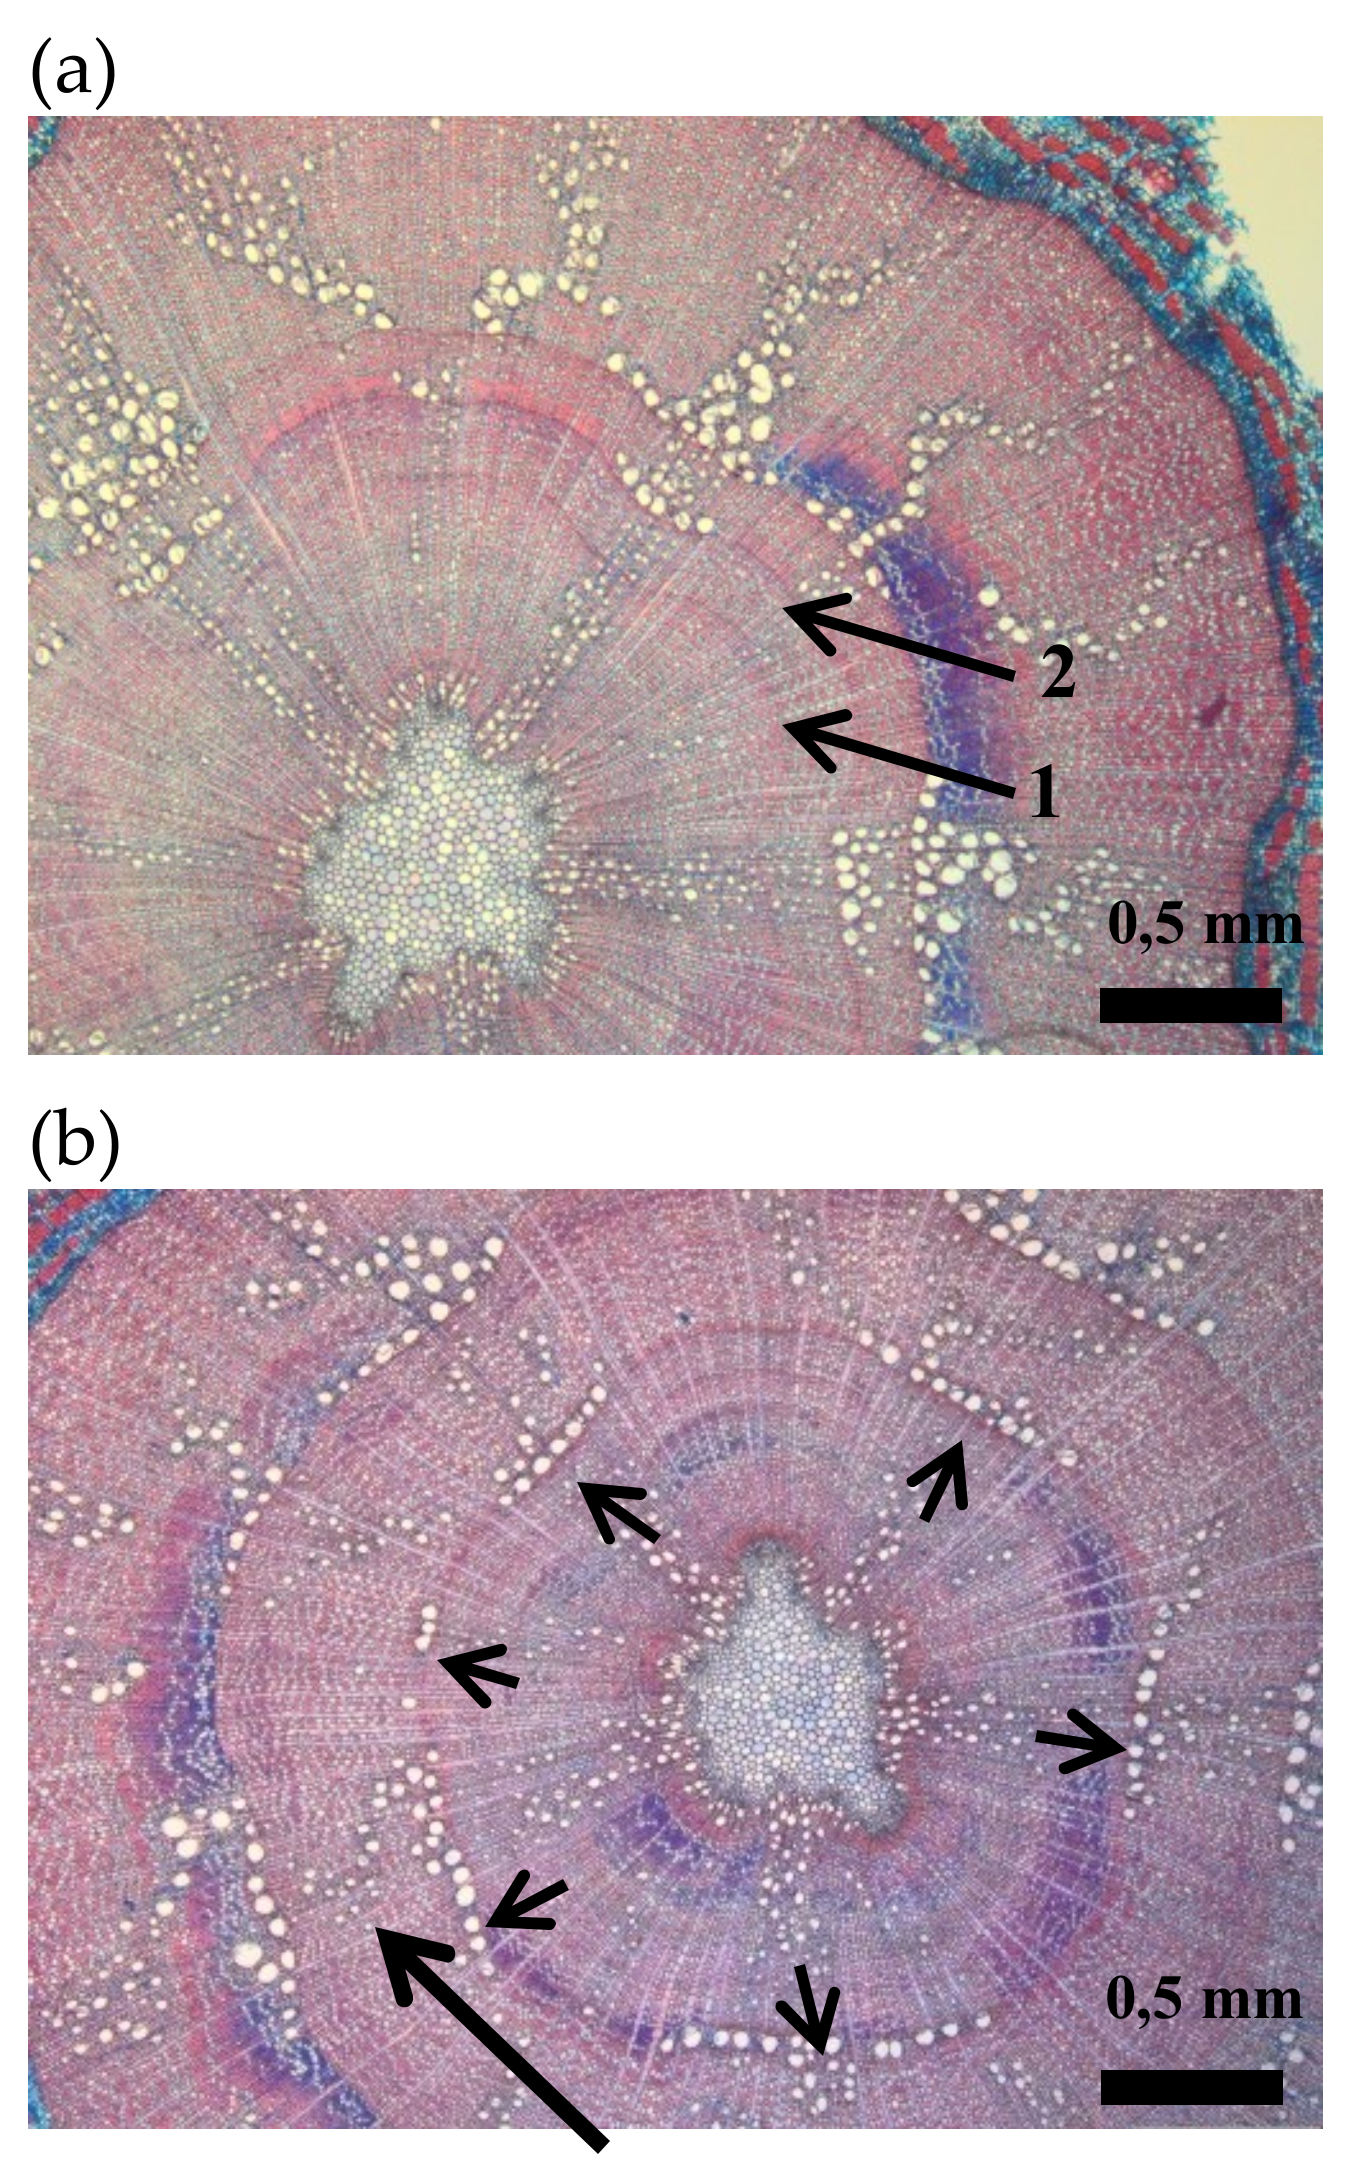
Figure 1.
Cross sections of oak seedlings: (a) intra-annual density fluctuation (arrow n° 1) in the secondary xylem of the first growing season. Arrow n° 2 indicates the year ring border between the first and the second growing season. (b) Cross section indicating a dendritic pattern of latewood vessels in the second growing season (long arrow) and a 50% of vessel ring closure at the onset of the earlywood in the second growing season (short arrows).
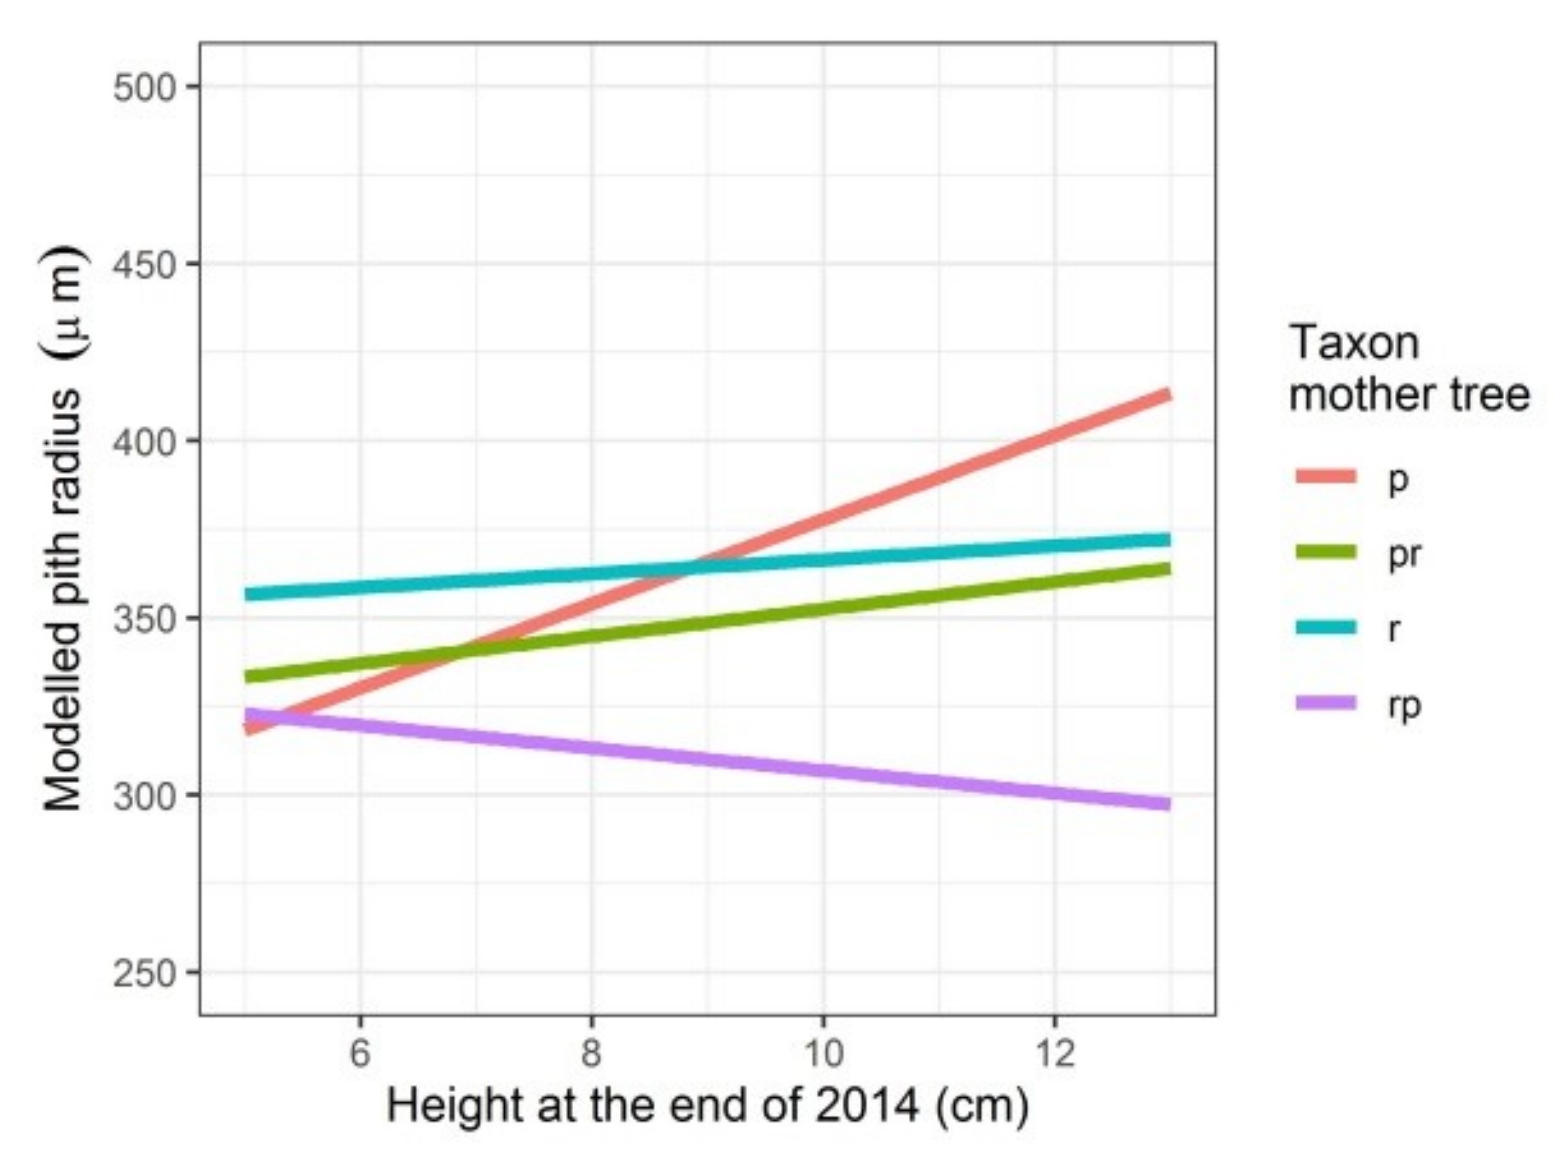
Figure 2.
Modelled pith radius depending on the height the seedlings attained in the first growing season and on the taxon of the mother tree. p: Q. petraea, pr: long stalked intermediate, r: Q. robur, rp: short-stalked intermediate.
Figure 2.
Modelled pith radius depending on the height the seedlings attained in the first growing season and on the taxon of the mother tree. p: Q. petraea, pr: long stalked intermediate, r: Q. robur, rp: short-stalked intermediate.
Figure 3.
Modelled ring widths in the first three growing seasons (2014, 2015 and 2016), depending on the height of the seedlings in 2014 or on the relative growth rate in height (2015 and 2016), on the taxon of the mother trees and, only for 2015 and 2016, on the adjusted relative extractable water in 2014. p: Q. petraea, pr: long stalked intermediate, r: Q. robur, rp: short-stalked intermediate: (a) first growing season 2014; (b) second growing season 2015; (c) third growing season 2016.
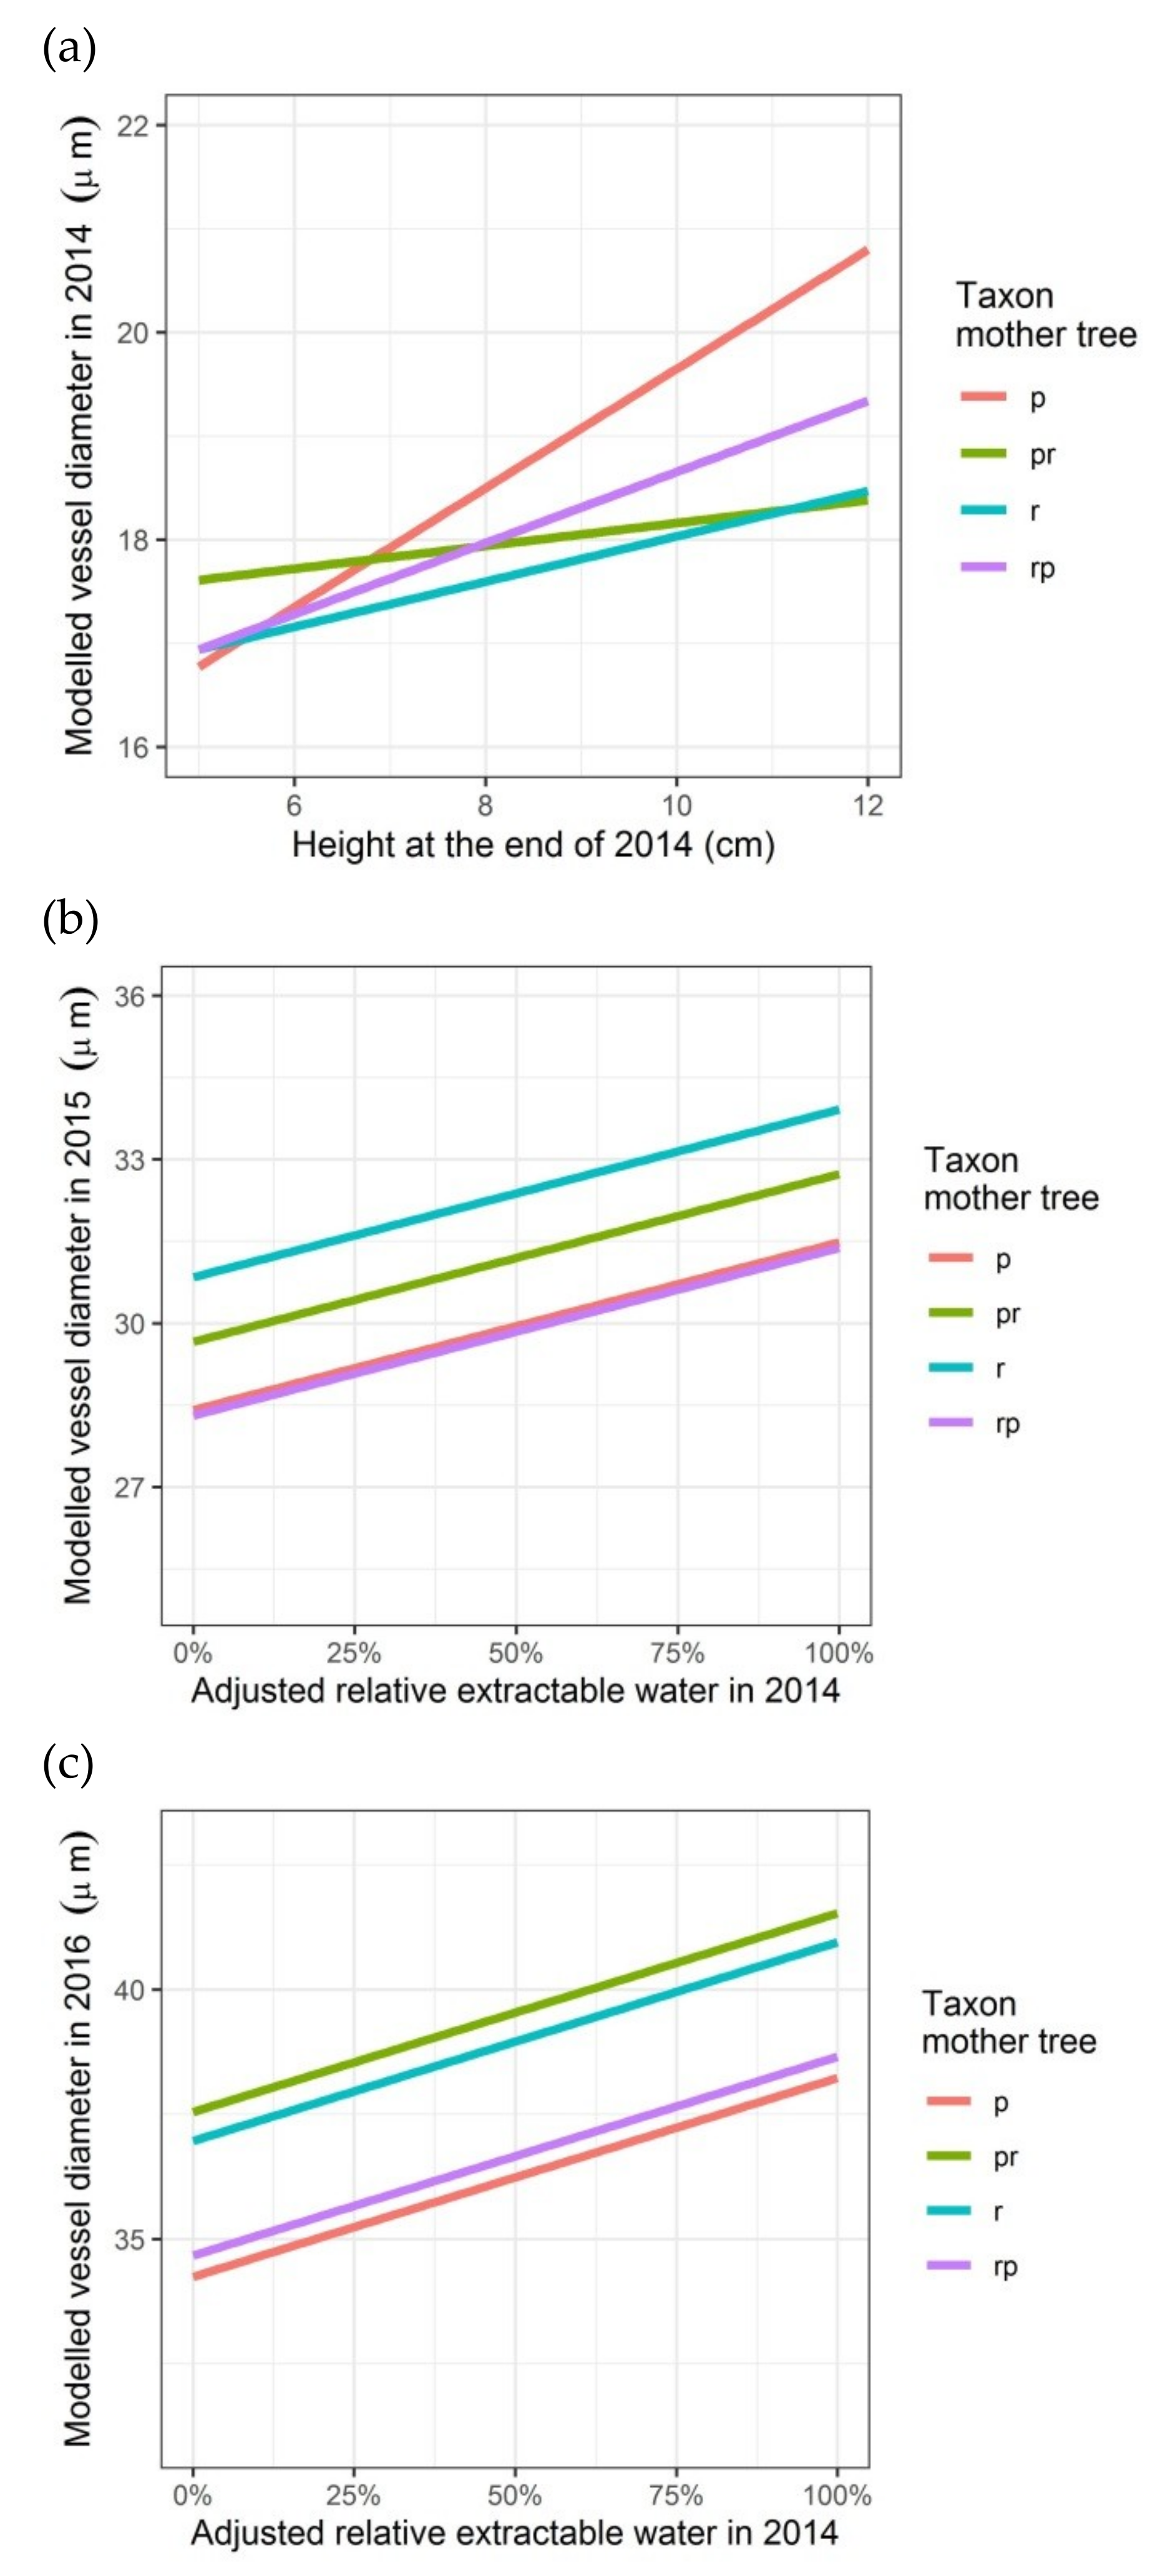
Figure 4.
Modelled vessel diameter depending on the height of the seedlings (2014) or on the relative growth rate in height (2015), on the adjusted relative extractable water in 2014 (latewood vessel diameters in rings of 2015 and 2016) and on the taxon of the mother trees (latewood vessel diameters in rings of 2014, 2015 and 2016): (a) first growing season 2014; (b) second growing season 2015; (c) third growing season 2016. p: Q. petraea, pr: long stalked intermediate form, r: Q. robur, rp: short-stalked intermediate form.
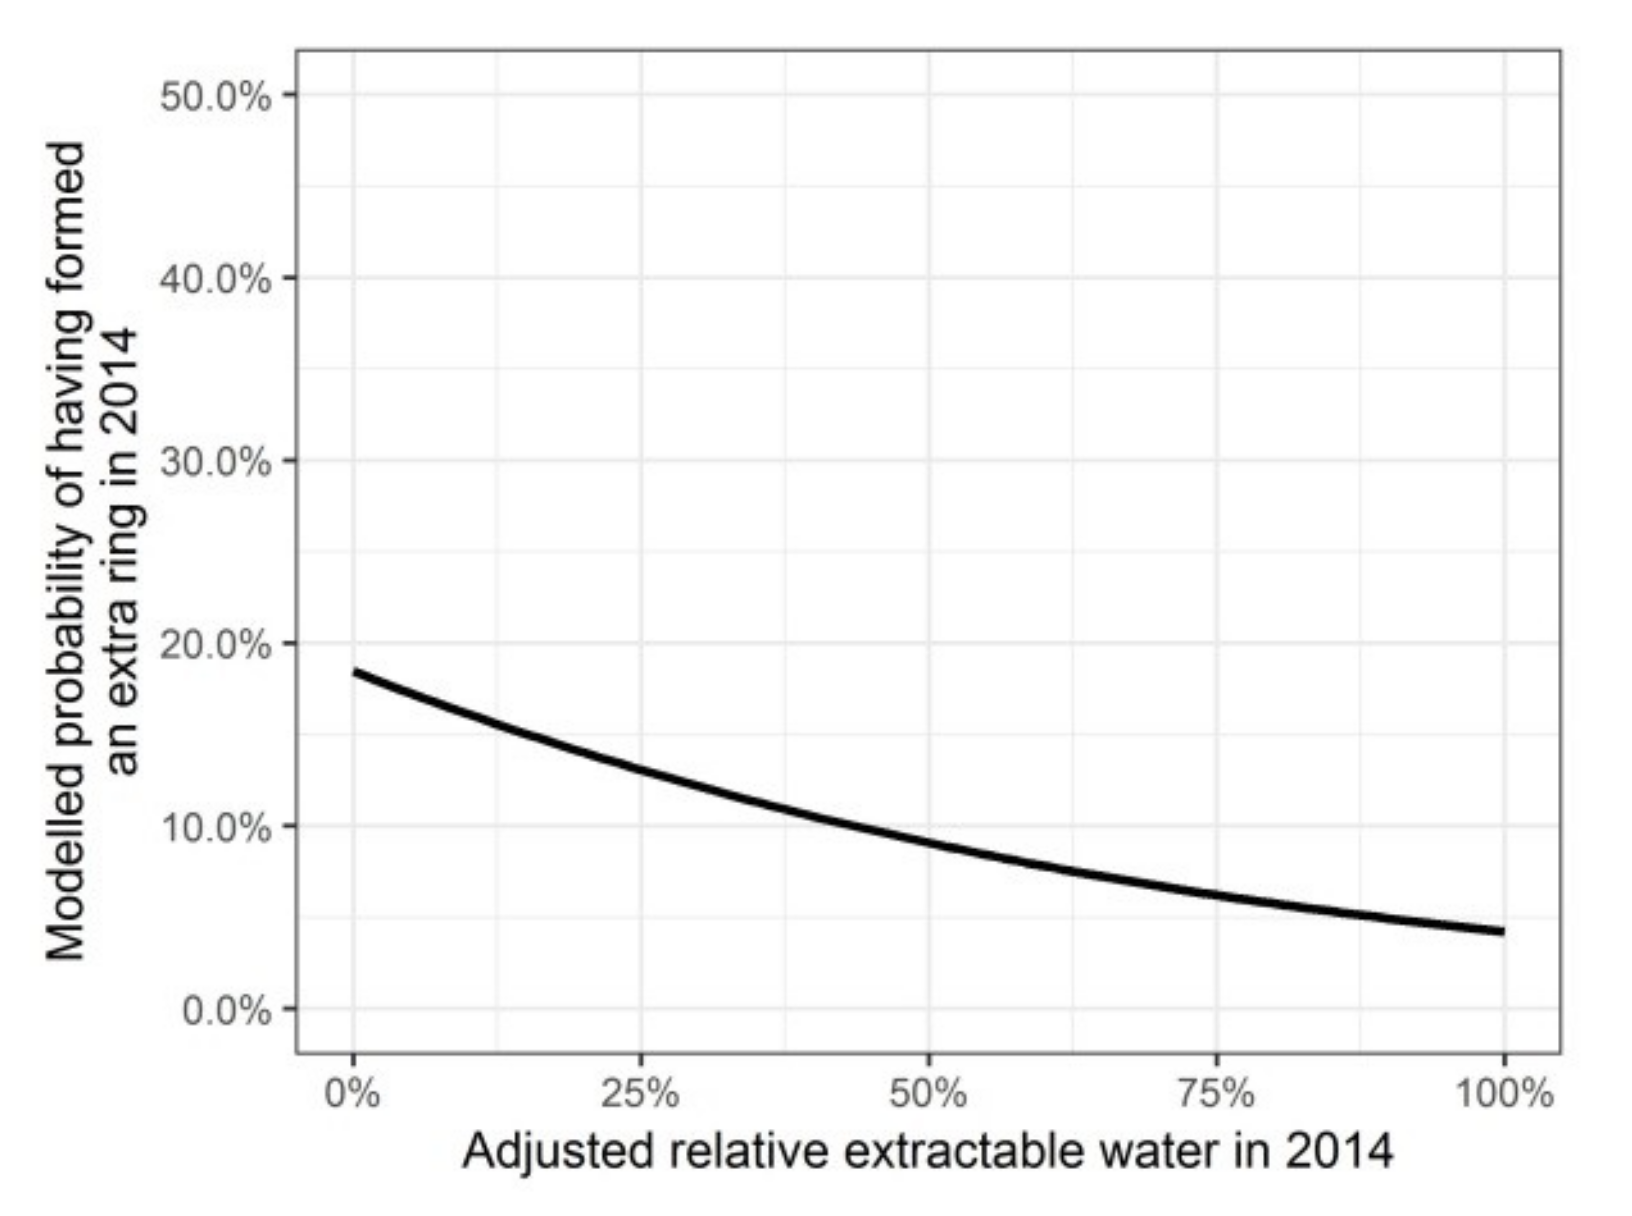
Figure 5.
Modelled probability of having formed an intra-annual density fluctuation in the secondary xylem in 2014, depending on the adjusted relative extractable water in 2014.
Figure 5.
Modelled probability of having formed an intra-annual density fluctuation in the secondary xylem in 2014, depending on the adjusted relative extractable water in 2014.
Figure 6.
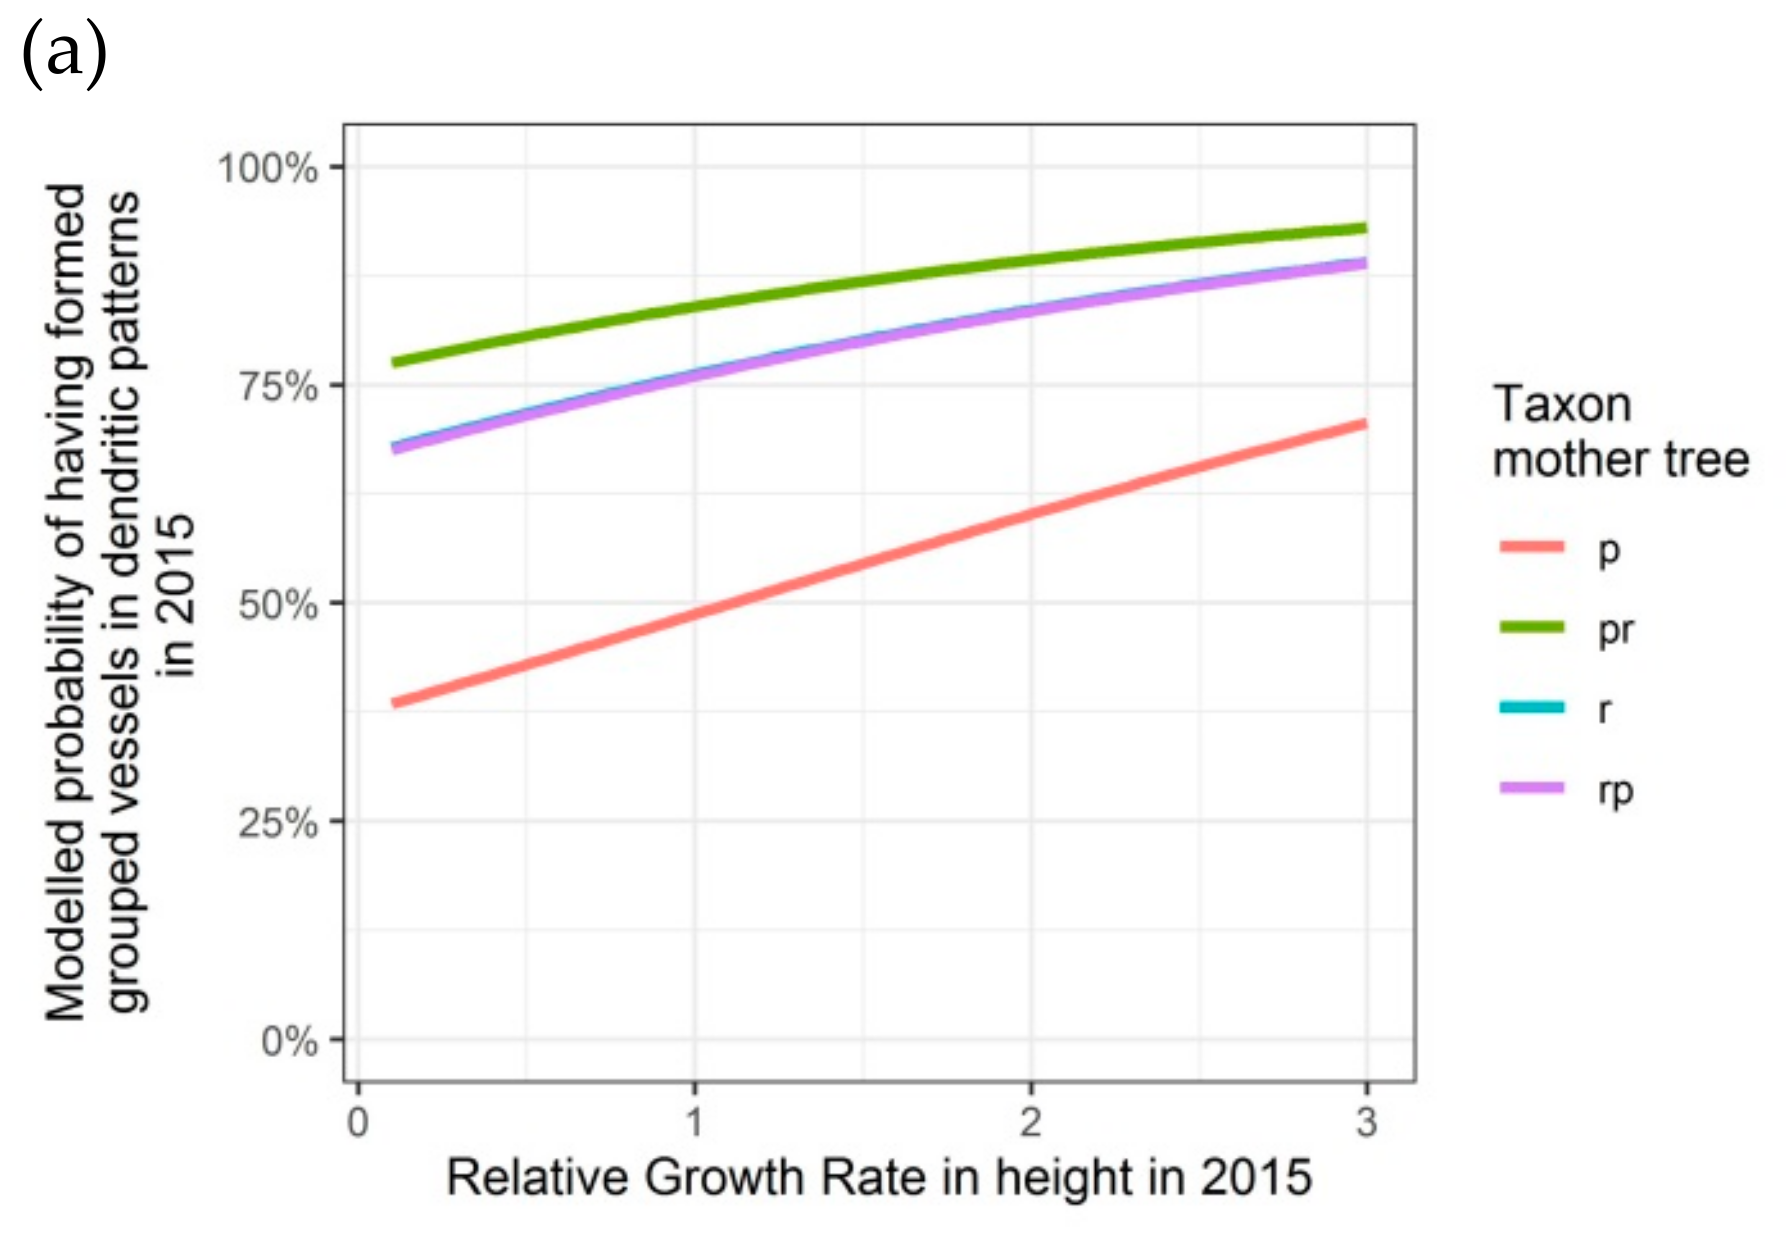
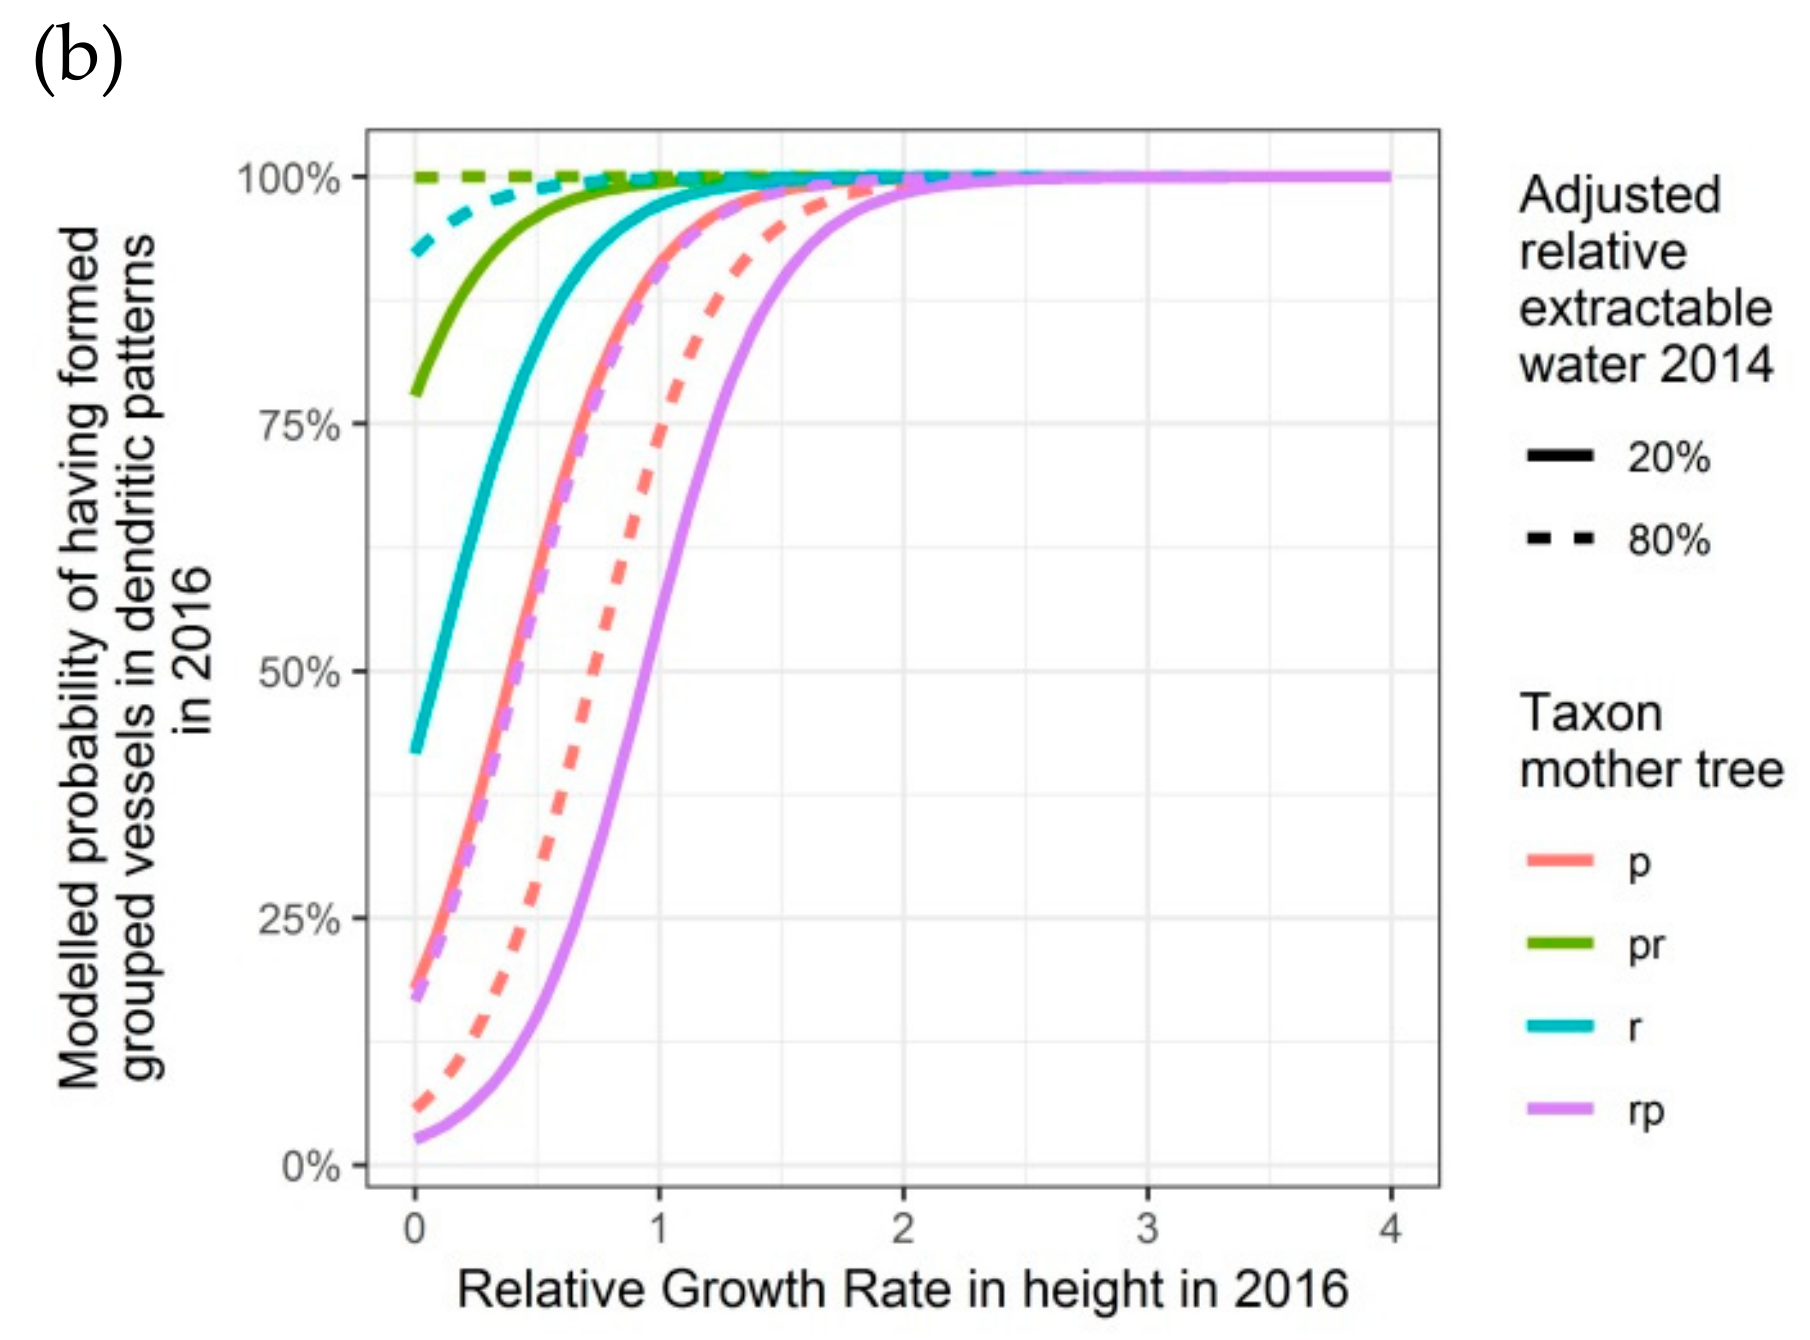
Modelled probability of having formed dendritic patterns (grouped vessels in flame-like structures) in the latewood xylem, depending on the relative growth rate in height, on the taxon of the mother tree and, only for 2016, on the adjusted relative extractable water in 2014: (a) second growing season 2015; (b) third growing season 2016. p: Q. petraea, pr: long stalked intermediate form, r: Q. robur, rp: short-stalked intermediate form.
Figure 7.
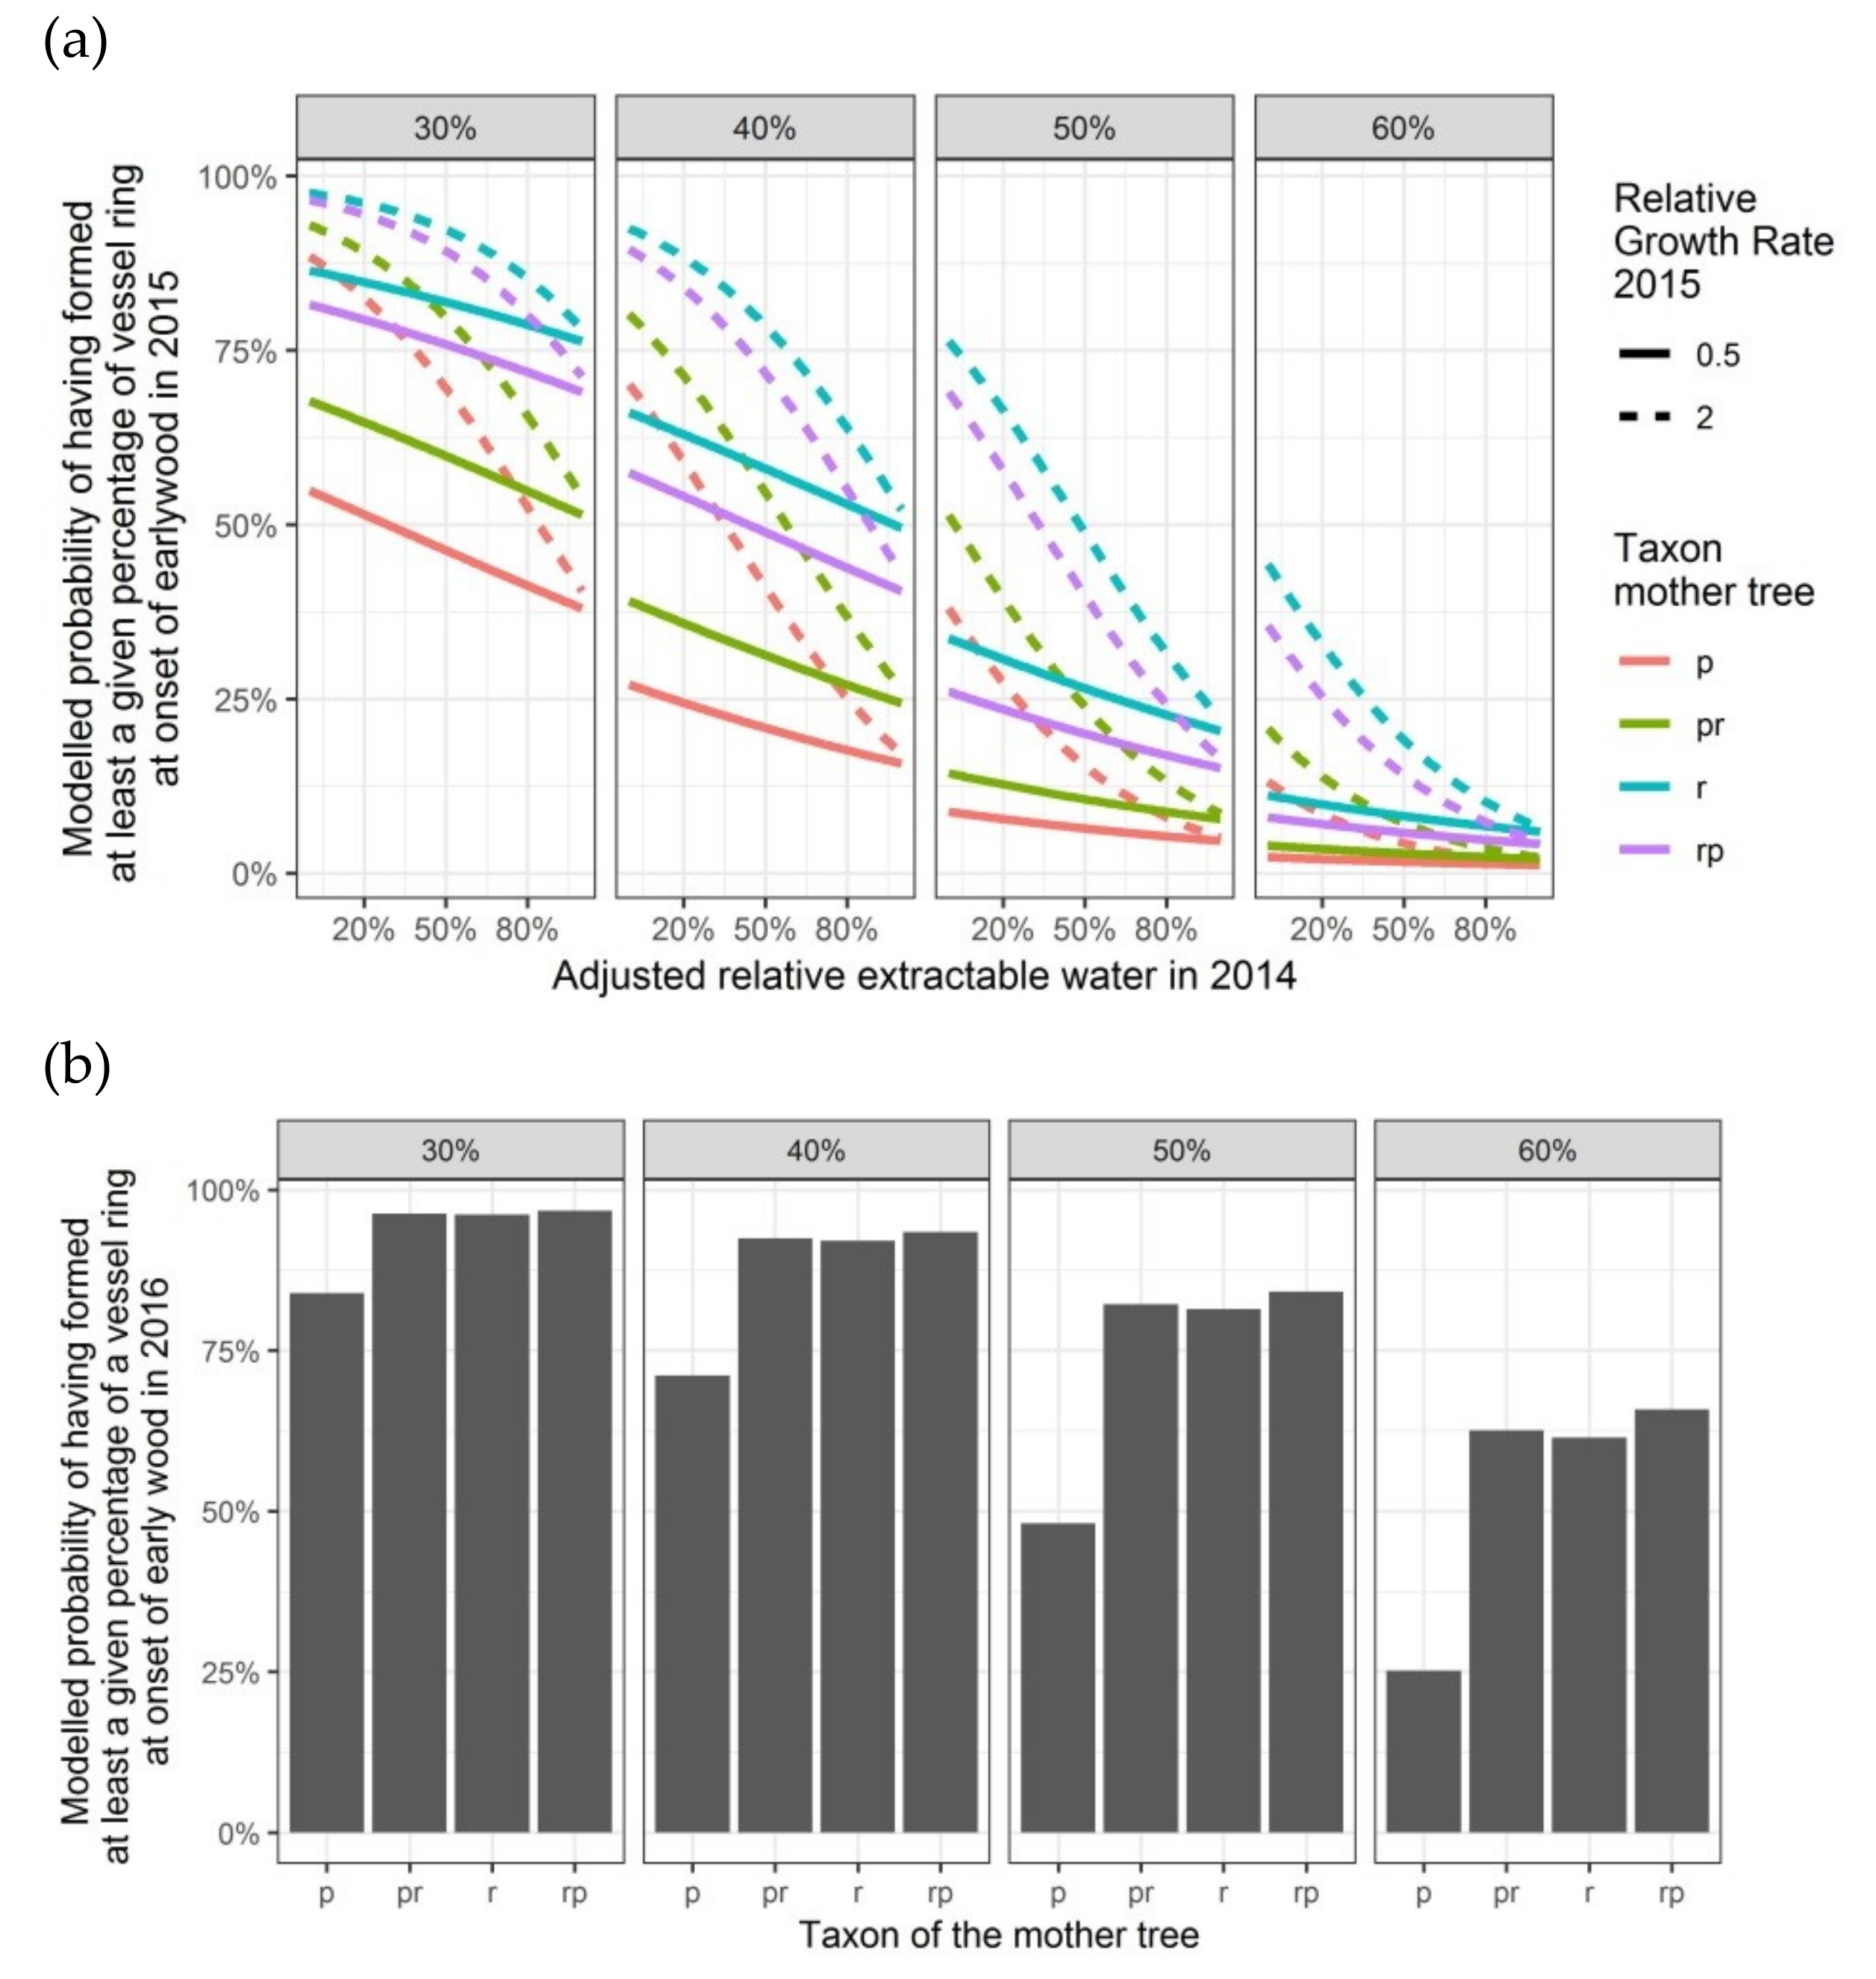
Modelled probabilities for a given level of vessel ring closure at the onset of the earlywood in the second and the third growing season, depending on the taxon of the mother tree and, only for 2015, on the adjusted relative extractable water in 2014 and on the relative growth rate in height in 2015: (a) probabilities for having formed 30%, 40%, 50% or 60% of the vessel ring in the second growing season 2015; (b) probabilities for having formed 30%, 40%, 50% or 60% of the vessel ring in the third growing season 2016. p: Q. petraea, pr: long stalked intermediate form, r: Q. robur, rp: short-stalked intermediate form.
Table 1.
Number of oak seedlings (n) according to the drought treatment in 2014 and the taxon of the mother tree.
Table 1.
Number of oak seedlings (n) according to the drought treatment in 2014 and the taxon of the mother tree.
| Treatment | Taxon Mother Tree * | n |
|---|
| control | p | 42 |
| | pr | 10 |
| | r | 35 |
| | rp | 27 |
| drought | p | 30 |
| | pr | 10 |
| | r | 27 |
| | rp | 29 |
Table 2.
Model statistics for the response variables pith radius and ring widths in 2014, 2015 and 2016. The standard level of the categorical variable taxon of the mother tree (T) was Q. petraea, to which the other taxa were compared with. Tpr: long stalked intermediate form, Tr: Q. robur, Trp: short-stalked intermediate form. H2014: height at the end of the first growing season. RGR2015 and RGR2016: relative growth rates in height for 2015 and 2016, respectively. W: adjusted relative extractable water in 2014.
| Pith | | | | | Ring 2014 | | | | |
|---|
| | Estimate | Std. Error | T-Value | p-Value | | Estimate | Std. Error | T-Value | p-Value |
|---|
| (Intercept) | 258.8 | 26.5 | 9.77 | <0.001 *** | (Intercept) | 290.3 | 68.0 | 4.26 | <0.001 *** |
| Tpr | 55.2 | 57.1 | 0.97 | 0.335 | Tpr | −28.6 | 146.7 | −0.20 | 0.846 |
| Tr | 87.9 | 32.5 | 2.70 | 0.007 ** | Tr | 298.2 | 83.6 | 3.57 | <0.001 *** |
| Trp | 79.9 | 36.8 | 2.17 | 0.031 * | Trp | 191.4 | 94.4 | 2.03 | 0.044 * |
| H2014 | 11.9 | 3.1 | 3.78 | <0.001 *** | H2014 | 48.5 | 8.1 | 6.02 | <0.001 *** |
| Tpr : H2014 | −8.1 | 6.1 | −1.32 | 0.190 | Tpr : H2014 | −2.7 | 15.7 | −0.17 | 0.862 |
| Tr : H2014 | −9.9 | 3.4 | −2.96 | 0.004 ** | Tr : H2014 | −25.1 | 8.6 | −2.91 | 0.004 ** |
| Trp : H2014 | −15.1 | 4.3 | −3.51 | <0.001 *** | Trp : H2014 | −12.2 | 11.0 | −1.11 | 0.269 |
| Ring 2015 | | | | | Ring 2016 | | | | |
| | Estimate | Std. Error | T-Value | p-Value | | Estimate | Std. Error | T-Value | p-Value |
| (Intercept) | 197.1 | 21.9 | 9.02 | <0.001 *** | (Intercept) | 246.2 | 72.2 | 3.41 | <0.001 *** |
| W | 93.7 | 26.3 | 3.56 | <0.001 *** | W | 194.3 | 97.4 | 2.00 | 0.048 * |
| Tpr | 108.7 | 37.5 | 2.90 | 0.004 ** | Tpr | 324.3 | 162.5 | 2.00 | 0.047 * |
| Tr | 35.8 | 25.6 | 1.40 | 0.163 | Tr | 586.3 | 119.6 | 4.90 | <0.001 *** |
| Trp | 34.7 | 26.6 | 1.31 | 0.193 | Trp | −38.1 | 115.6 | −0.33 | 0.742 |
| RGR2015 | 62.0 | 8.9 | 6.98 | <0.001 *** | RGR2016 | 127.5 | 29.7 | 4.30 | <0.001 *** |
| | | | | | W : Tpr | 203.6 | 198.9 | 1.02 | 0.307 |
| | | | | | W : Tr | −85.7 | 134.1 | −0.64 | 0.524 |
| | | | | | W : Trp | 401.6 | 146.1 | 2.75 | 0.007 ** |
| | | | | | Tpr : RGR2016 | 43.1 | 76.5 | 0.56 | 0.574 |
| | | | | | Tr : RGR2016 | −112.9 | 44.1 | −2.56 | 0.011 * |
| | | | | | Trp : RGR2016 | 28.5 | 44.9 | 0.63 | 0.527 |
Table 3.
Model statistics for the response variable latewood vessel diameter. The standard level of the categorical variable taxon of the mother tree (T) was Q. petraea, to which the other taxa were compared with. Tpr: long stalked intermediate form, Tr: Q. robur, Trp: short-stalked intermediate form. H2014: height at the end of the first growing season. RGR2015 and RGR2016: relative growth rates in height for 2015 and 2016, respectively. W: adjusted relative extractable water in 2014.
| | | | Ring 2014 | | | | | | | | |
|---|
| | | | | Estimate | Std. Error | df | T-Value | p-Value | | | |
|---|
| | | | (Intercept) | 13.89 | 0.74 | 5041 | 18.79 | <0.001 *** | | | |
| | | | H2014 | 0.58 | 0.09 | 201 | 6.58 | <0.001 *** | | | |
| | | | Tpr | 3.16 | 1.59 | 201 | 1.99 | 0.048 * | | | |
| | | | Tr | 1.95 | 0.91 | 201 | 2.15 | 0.033 * | | | |
| | | | Trp | 1.33 | 1.03 | 201 | 1.29 | 0.197 | | | |
| | | | Tpr : H2014 | −0.47 | 0.17 | 201 | −2.73 | 0.007 ** | | | |
| | | | Tr : H2014 | −0.36 | 0.09 | 201 | −3.81 | <0.001 *** | | | |
| | | | Trp : H2014 | −0.23 | 0.12 | 201 | −1.94 | 0.054 | | | |
| Ring 2015 | | | | | | Ring 2016 | | | | | |
| | Estimate | Std. Error | df | T-Value | p-Value | | Estimate | Std. Error | df | T-Value | p-Value |
| (Intercept) | 28.81 | 0.71 | 5041 | 40.56 | <0.001 *** | (Intercept) | 34.24 | 0.81 | 4896 | 42.12 | <0.001 *** |
| RGR2015 | −0.55 | 0.29 | 203 | −1.91 | 0.057 | | | | | | |
| W | 3.07 | 0.86 | 203 | 3.57 | <0.001 *** | W | 3.99 | 0.99 | 199 | 4.01 | <0.001 *** |
| Tpr | 1.25 | 1.22 | 203 | 1.03 | 0.306 | Tpr | 3.30 | 1.40 | 199 | 2.36 | 0.019 * |
| Tr | 2.43 | 0.83 | 203 | 2.92 | 0.004 ** | Tr | 2.72 | 0.97 | 199 | 2.79 | 0.006 ** |
| Trp | −0.10 | 0.87 | 203 | −0.12 | 0.742 | Trp | 0.43 | 1.00 | 199 | 0.43 | 0.671 |
Table 4.
Number of seedlings showing an intra-annual density fluctuation in the secondary xylem, depending on the water limiting treatment experienced by the seedlings in 2014.
Table 4.
Number of seedlings showing an intra-annual density fluctuation in the secondary xylem, depending on the water limiting treatment experienced by the seedlings in 2014.
| Growing Season | n of Plants with Extra Ring |
|---|
| Control | Drought |
|---|
| 2014 | 5 | 23 |
| 2015 | 2 | 1 |
| 2016 | 2 | 1 |
Table 5.
Statistics from the logistic regression model with the absence/presence of an intra-annual density fluctuation in the secondary xylem of the first growing season as response variable. W: adjusted relative extractable water in 2014.
Table 5.
Statistics from the logistic regression model with the absence/presence of an intra-annual density fluctuation in the secondary xylem of the first growing season as response variable. W: adjusted relative extractable water in 2014.
| | Estimate | Std. Error | Z-Value | p-Value |
|---|
| (Intercept) | −1.49 | 0.25 | −5.93 | <0.001 *** |
| W | −1.64 | 0.61 | −2.70 | 0.007 ** |
Table 6.
Statistics from the logistic regression models with the absence/presence of dendritic patterns (flame-like structures of grouped latewood vessels) in the secondary xylem in 2015 and 2016 as response variables. The standard level of the categorical variable taxon of the mother tree (T) was Q. petraea, to which the other taxa were compared with. Tpr: long stalked intermediate form, Tr: Q. robur, Trp: short-stalked intermediate form. RGR2015 and RGR2016: relative growth rate of height in 2015 and 2016, respectively.
| Ring 2015 | | | | | Ring 2016 | | | |
|---|
| | Estimate | Std. Error | Z-Value | p-Value | | Estimate | Std. Error | Z-Value | p-Value |
|---|
| (Intercept) | −0.51 | 0.28 | −1.82 | 0.069 | (Intercept) | −1.10 | 0.78 | −1.41 | 0.159 |
| | | | | | W | −2.15 | 1.27 | −1.70 | 0.089 |
| Tpr | 1.71 | 0.68 | 2.51 | 0.012 * | Tpr | −0.12 | 1.82 | −0.07 | 0.946 |
| Tr | 1.21 | 0.39 | 3.15 | 0.002 ** | Tr | −0.17 | 1.67 | −0.11 | 0.917 |
| Trp | 1.20 | 0.40 | 2.98 | 0.003 ** | Trp | −3.22 | 1.19 | −2.71 | 0.007 ** |
| RGR2015 | 0.46 | 0.22 | 2.15 | 0.032 * | RGR2016 | 3.86 | 0.92 | 4.19 | <0.001 *** |
| | | | | | W : Tpr | 14.54 | 41.58 | 0.35 | 0.727 |
| | | | | | W : Tr | 6.83 | 6.57 | 1.04 | 0.299 |
| | | | | | W : Trp | 5.54 | 2.04 | 2.72 | 0.006** |
Table 7.
Statistics from the cumulative logistic regression models with the level of vessel ring closure at the onset of the earlywood in the second and third growing season as response variables. The standard level of the categorical variable taxon of the mother tree (T) was Q. petraea, to which the other taxa were compared with. Tpr: long stalked intermediate form, Tr: Q. robur, Trp: short-stalked intermediate form. RGR2015: relative growth rate in height in the second growing season. W: adjusted relative extractable water in 2014.
| Ring 2015 | | | | | Ring 2016 | | | |
|---|
| | Estimate | Std. Error | Z-Value | p-Value | | Estimate | Std. Error | Z-Value | p-Value |
|---|
| W | 0.15 | 0.44 | 0.35 | 0.727 | | | | | |
| Tpr | −0.61 | 0.46 | −1.35 | 0.177 | Tpr | −1.61 | 0.46 | −3.46 | <0.001 *** |
| Tr | −1.64 | 0.34 | −4.80 | <0.001 *** | Tr | −1.55 | 0.33 | −4.78 | <0.001 *** |
| Trp | −1.28 | 0.34 | −3.80 | <0.001 *** | Trp | −1.75 | 0.35 | −5.05 | <0.001 *** |
| RGR2015 | −1.12 | 0.26 | −4.41 | <0.001 *** | | | | | |
| W : RGR2015 | 1.06 | 0.31 | 3.43 | <0.001 *** | | | | | |
