Article

Leaf Bilateral Symmetry and the Scaling of the Perimeter vs. the Surface Area in 15 Vine Species

1
Bamboo Research Institute, College of Biology and the Environment, Nanjing Forestry University, Nanjing 210037, China
2
Tropical Silviculture and Forest Ecology, University of Göttingen, 37077 Göttingen, Germany
3
Institute of Agricultural and Environmental Sciences, Estonian University of Life Sciences, 51006 Tartu, Estonia
4
Estonian Academy of Sciences, 10130 Tallinn, Estonia
5
Centre for Invasion Biology, Department of Mathematical Sciences, Stellenbosch University, Matieland 7602, South Africa
6
Mathematical and Physical Biosciences, African Institute for Mathematical Sciences, Cape Town 7945, South Africa
7
Plant Biology Section, School of Integrative Plant Science, Cornell University, Ithaca, NY 14853, USA
*
Authors to whom correspondence should be addressed.
Forests 2020, 11(2), 246; https://doi.org/10.3390/f11020246
Submission received: 22 December 2019 / Revised: 18 February 2020 / Accepted: 21 February 2020 / Published: 23 February 2020
(This article belongs to the Section Forest Ecophysiology and Biology)

Abstract

:
The leaves of vines exhibit a high degree of variability in shape, from simple oval to highly dissected palmatifid leaves. However, little is known about the extent of leaf bilateral symmetry in vines, how leaf perimeter scales with leaf surface area, and how this relationship depends on leaf shape. We studied 15 species of vines and calculated (i) the areal ratio (AR) of both sides of the lamina per leaf, (ii) the standardized symmetry index (SI) to estimate the deviation from leaf bilateral symmetry, and (iii) the dissection index (DI) to measure leaf-shape complexity. In addition, we examined whether there is a scaling relationship between leaf perimeter and area for each species. A total of 14 out of 15 species had no significant differences in average ln(AR), and mean ln(AR) approximated zero, indicating that the areas of the two lamina sides tended to be equal. Nevertheless, SI values among the 15 species had significant differences. A statistically strong scaling relationship between leaf perimeter and area was observed for each species, and the scaling exponents of 12 out of 15 species fell in the range of 0.49−0.55. These data show that vines tend to generate a similar number of left- and right-skewed leaves, which might contribute to optimizing light interception. Weaker scaling relationships between leaf perimeter and area were associated with a greater DI and a greater variation in DI. Thus, DI provides a useful measure of the degree of the complexity of leaf outline.

1. Introduction

Leaves are the primary photosynthetic organs in most plants. Leaf shape is considered to be closely associated with leaf photosynthetic potential [1,2]. Leaf dissection, lobes, margin serration and margin toothiness have been found to change the light-capture efficiency of leaves [3] and also alter leaf energy balance via enhancing the rate of convective cooling, thereby potentially enhancing the photosynthetic activity during the growing season in drier habitats [3,4,5]. Leaf shape can also significantly influence leaf venation patterns that directly determine the photosynthetic capacity of plants through changes in vein density [6,7,8]. Leaf shape also alters leaf biomass distribution, which determines the biomass cost for leaf biomechanical support [1]. In a recent study, using 101 bamboo taxa, we found that leaf shape could even affect the scaling relationship between leaf dry mass and surface area [9].
Some studies have identified a number of leaf-shape controlling genes in several model plants [10,11,12]. However, how adaptation to different environments has resulted in evolution of leaf-shape controlling genes is currently not understood. It is difficult to directly relate environmental selection pressures to the evolution and expression of leaf-shape controlling genes based on available evidence of the origin and relatedness of leaf-shape determining genes. Some investigators have attempted to address this area of research by examining how or if environmental factors have led to leaf-shape changes [4,13,14,15,16]. Royer and Wilf [4] measured the seasonal patterns in photosynthesis and transpiration in relation to leaf-margin characteristics using 60 woody plants from two cold-climate regions in the north of the United States. They report that species with toothed leaves tend to have increased transpiration and photosynthesis rates earlier in the growing season compared to untoothed species, and they suggest that more toothed leaves are advantageous because they can maximize carbon gain in colder climates where temperature is limiting but moisture and nutrient availability are not. Peppe et al. [14] studied the correlation between leaf size, shape, and climates for 92 globally distributed, climatically diverse sites. They found that leaves in colder areas typically have larger, more numerous teeth, and are more highly dissected, while those in wet areas have fewer and smaller teeth. Importantly, there is evidence that using mean annual temperature and mean annual precipitation can provide better explanations for the variation in leaf size and shape than using univariate approaches [14]. In fact, Wright et al. [5] demonstrate that the combination of temperature and precipitation can account for leaf size changes at a global scale, although these authors did not test whether the two variables can also affect leaf shape.
Nevertheless, there is no consensus on how to best characterize the complexity of leaf shape. For similar leaves whose width and length can be easily measured, the ratio of leaf width to length is usually used as a leaf-shape measure. A similar index is leaf elongation, which is the ratio of leaf major to minor perpendicular semi-axes [1]. Lin et al. [17] proposed a leaf-shape indicator based on a parameter in the simplified Gielis equation [18], where the original Gielis equation is a generalized geometric model that can describe a circle, ellipse, square, triangle, and even many asymmetric and irregular shapes [19], to quantify the shapes of bamboo leaves. However, Shi et al. [20] found that this indicator can be expressed by leaf length and width for the leaf shapes that can be described by the simplified Gielis equation. In several studies, the ratio of perimeter (P) to twice the square root of the product of π and leaf surface area (A) has been used, a parameter that has been defined as the leaf dissection index (DI) [13,21,22]. Although the DI has been used to study leaf shape in several species, it has not been shown to be valid using large sample sets (≥ 30 leaves). An analogous leaf shape index is leaf roundness calculated as 4πA/P2, which in theory can vary from 1 (circle) to 0 (line) [23,24,25,26]. Leaf scaling (i.e., power–law relationships) has been used to depict the asynchronous growth between any two morphometric measures, and the leaf scaling relationship between leaf dry (or fresh) weight and leaf surface area has been widely used for many plants [27,28,29]. These studies show that an increase in leaf biomass does not keep pace with that of leaf surface, and most estimated scaling exponents (slopes) of dry biomass vs. area are greater than unity [28]. However, only a few studies have focused on the scaling relationship between leaf perimeter and area and on how environmental factors affect this relationship. Thomas and Bazzaz [13] studied the effects of the atmospheric carbon dioxide concentration on the leaf shapes of three plant species and found that there is a statistically robust scaling exponent (i.e., unequal to unity) between leaf perimeter and the area for each species (with < 100 data points for each species). These authors found that the estimated leaf scaling exponents of leaf perimeter vs. the area of leaves grown under two different CO2 concentrations were not significantly different; however, they report a significant difference between the estimated intercepts. Yu et al. [16] investigated the effects of four different salt concentrations on the shapes of Pyrus betulifolia Bunge leaves. However, they did not directly use the scaling relationship between the leaf perimeter and area; instead, they looked at the relationship between the ratio of leaf perimeter to area and leaf area, using >200 leaves for each treatment. The slopes and intercepts under four different salt concentrations were found to have no significant difference, and the 95% confidence intervals of the slopes all included −0.5, which indicates a ½ power relationship between leaf perimeter and area. In contrast, for three Nothofagus species, leaf roundness moderately decreased with increasing long-term light availability [24], whereas, in Agathis australis, light positively affected leaf roundness [25]. In addition, leaves in older trees of Agathis australis had greater roundness than leaves in younger trees [25].
The limited and sometimes conflicting information concerning leaf area and perimeter relationships may be associated with the difficulty of measuring leaf perimeter. Although there are several computer programs that can be used to calculate leaf perimeter [21,30], the available methods cannot calculate leaf perimeters for multiple leaves simultaneously. Recently, rapid methods for leaf perimeter estimation for a large number of leaves have been developed [20,31,32].
Climbing plants play important roles in community succession and composition [33], and woody vines contribute ca. 25% of the abundance (i.e., overall biomass) of woody species and species richness in many tropical forests [34]. Some herbaceous vines act as pioneers in vacant habitats [35]; some lianas compete with trees and even kill them by producing leaves that prevent tree leaves from capturing sufficient light [36], whereas others start as epiphytic vines on the top of tree canopies and become ultimately rooted in the soil, at which point multiple vine stems grow together and form a tree that ultimately kills the host tree (e.g., the strangler figs, see refs. [37,38]). The leaf shapes of vines exhibit a high degree of variability, even for the species belonging to the same genus, from a simple oval leaf to a complex palmatifid leaf. The leaves growing at different nodes along the main stem of even the same species can have different shapes, even on the same individual plant, e.g., Begonia dregei Otto et Dietr [39]. Gianoli and Carrasco-Urra [40] report that the leaves of Boquila trifoliolata (DC.) Decne, a woody vine, can mimic the size, shape, color, orientation, petiole length, and even the tip spininess of the leaves of its host trees. Leaf shape change is apparently an adaption of plants to their environments. Thus, the study of the variation in leaf shape of vines can provide representative information of overall differences in the scaling of leaf perimeter vs. area and its correlation with different leaf shape indices. In the present study, we selected 15 species of vines, including eight woody vines and seven herbaceous vines, and used a large sample size (> 310 leaves for each species) to study (i) the overall variability in DI among different species and the validity of DI in quantitatively describing leaf shapes in different species, especially the shapes of dissected and lobed leaves, (ii) the relationship between leaf perimeter and surface area, and (iii) whether scaling exponents are approximately equal to 0.5, i.e., an allometric scaling of the two leaf measures.

2. Materials and Methods

2.1. Study Area and Plant Material

We selected two sites in Nanjing, Jiangsu Province, China: Nanjing Forestry University Campus (Table 1 for geographic coordinates and altitude) and the White Horse Experimental Station of Nanjing Forestry University (Table 1 for geographic coordinates and altitude). Nine species were sampled in the campus, and six species in the station. The plants cover 11 families, among which 8 species are woody vines [Trachelospermum jasminoides (Lindl.) Lem, Vinca major L., Hedera nepalensis K. Koch var. sinensis (Tobl.) Rehd., Lonicera japonica Thunb., Euonymus fortunei (Turcz.) Hand.-Mazz., Cocculus orbiculatus (L.) DC., Parthenocissus tricuspidata (S. et Z.) Planch., and Vitis bryoniifolia Bunge], and the remaining 7 species are herbaceous [Ipomoea triloba L., Pharbitis nil (L.) Choisy, Dioscorea opposita Thunb., Humulus scandens (Lour.) Merr., Fallopia multiflora (Thunb.) Harald., Polygonum perfoliatum L., and Paederia scandens (Lour.) Merr.].
We selected the 15 vine species based on the following three criteria: (i) the leaf shapes of the plants must be as diverse as possible so that we can compare the complexity of leaf shape among different species and so that they can also be used to test whether the scaling exponents of leaf perimeter vs. surface area have the same or approximate values for those plants (i.e., the generality of the scaling relationship between leaf perimeter and area); (ii) the plants should be abundant so that we can obtain a lot of leaves (i.e., a big sample size for each species) to make the following analysis robust; (iii) the plants should grow in the same or approximate habitats to avoid the influences of climate and soil heterogeneity on leaf shape.
Many of the vine species examined in this study have different leaf shapes, grow in the wild, and occupy many different microhabitats. For each species, ≥310 mature (fully expanded) leaves were randomly collected from different parts of healthy plants without distinguishing sun and shade leaves. The plants were sampled from 3–6 plots with each plot ranging from 2 by 2 m to 4 by 4 m depending on vegetational density. Table 1 provides detailed collection information. Figure 1 shows representative leaf images of the 15 species of vines. It was difficult to judge the age of plants or leaf plastochron indices for perennial herbaceous and woody vines. For this reason, we increased the sample size of leaves and confined the study to mature (fully expanded) leaves. As a consequence, leaf shape did not vary or change greatly among conspecifics, and thus had little to no effect on the results of the analysis. Nanjing belongs to the subtropical monsoon climate, with a mean annual temperature of 15.6 °C, a mean annual precipitation level of 1058 mm, a mean relative humidity of 75.7%, and a mean annual sunshine duration of 2038 h (China Meteorological Data Service Center, http://www.data.cma.cn).

2.2. Data Acquisition

We collected fresh leaves from healthy plants and put them into plastic self-sealing bags (28 cm × 20 cm). Then, we used a foam box (29 cm × 16 cm × 18 cm) with ice to hold these bags to prevent leaf deformation and water loss before bringing them back to the laboratory. The fresh leaves were scanned at a 600-dpi resolution with a flatbed scanner (Aficio MP 7502; Ricoh, Tokyo, Japan). All leaf images were separately saved as black-white bitmap images, so it was convenient for us to use the Matlab (version ≥ 2009a) procedure developed by Shi et al. [20] to extract the planar coordinates of leaves in batches. The number of data points on the boundary of a leaf fell into a range of 1000 to 5000 (that clearly form a leaf margin) depending on the size of the image for the given leaf. The planar coordinates were automatically saved as comma-separated value (CSV) files. Then, the files were read to calculate leaf surface area and perimeter using the R (version 3.6.0) [41] script developed by Shi et al. [20] and Su et al. [32].

2.3. Leaf Symmetry and Leaf Shape Complexity Measures

The following two indicators were used to measure the extent of leaf bilateral symmetry: the areal ratio (AR) of the left side to the right side of the given leaf, and the standardized index (SI) [31]. See Figure 2. A leaf was divided into two sides by a straight line through leaf base and apex: left and right sides. The leaf is dissected into n subregions (in Figure 2, n = 5 to simply show the calculation process) using a group of parallel and equidistant straight vertical strips, which are perpendicular to the straight line through the leaf base and apex. AR is the areal quotient of the left and the right sides of this leaf.
AR   =   i   =   1 n L i i   =   1 n R i
where Li and Ri are the intersected left and right areas between the i-th subregion and the leaf.
SI   =   1 n i   =   1 n | L i R i | | L i + R i |
SI is actually the average of the relative areal differences of the n subregions (see Figure 2 for details). In actual calculations, n was set to 1000 for each leaf.
The dissection index (DI) was used to evaluate the extent of leaf complexity [21]:
DI   =   P 2 π   A
where P represents leaf perimeter, and A represents leaf surface area.
The coefficient of variation (CV = standard deviation/mean) was used to check the intraspecific difference in the variability of leaf shape and bilateral symmetry.

2.4. Statistical Analysis

We used Tukey’s Honestly Significant Difference (HSD) test with a 0.05 significance level [42] to test whether there is a significant difference in symmetry extents among 15 species of climbing plants. To satisfy the criterion of normality, the natural logarithmic transformations of AR and SI were used. In this case, if the absolute value of ln(AR) approaches 0, it indicates a good symmetry for the areas of both sides; the smaller the ln(SI), the closer the leaf follows bilateral symmetry. We also used Tukey’s HSD test with a 0.05 significance level to test the significance of the difference in leaf area, perimeter, and dissection index among the 15 species of vines.
To test whether the scaling relationship between leaf perimeter and area holds, we used reduced major axis regression [43] to fit the following linearized equation:
y = γ + α x
where γ is the intercept (normalization constant), α is the slope (the scaling exponent), y represents the natural logarithm of leaf perimeter, and x represents the natural logarithm of leaf surface area. To examine the significance of the difference in the estimated slope (and intercept) among the 15 species of vines, the bootstrap percentile method [44,45] was used. All statistical analyses were performed using R (version 3.6.0) [41].

3. Results

The log-transformation of AR and SI values improved the normality of data for most species. The exception was L. japonica. The mean and median of the data were approximately the same for all of the other species (Figure 3A,B). With the exception of T. jasminoides, there was no significant difference in ln(AR) among 14 species of climbing plants. The average ln(AR) of T. jasminoides was only greater than those of four other species (Figure 3A). The data indicate that vines tend to produce the same number of left- and right-skewed leaves (i.e., leaves in which the left and right sides of the lamina midvein are larger, respectively). Although individual leaves have different leaf areas, the mean of the left side’s area is approximately equal to the mean of the right side’s area. Thus, leaves exhibit a symmetry in their leaf area. Although ln(AR) varied little among species, a strict bilateral symmetry cannot be adduced, as there was significant interspecific variation in ln(SI) (Figure 3B). F. multiflora had the most pronounced bilateral asymmetry (Figure 3B) and the largest CV in bilateral symmetry (see the numbers below the whiskers of the boxes in Figure 3B), whereas the leaves of V. major were the most bilaterally symmetrical (Figure 3B).
H. scandens has the largest leaf area, the largest perimeter, and the most complex shape (Figure 4A,B,C). However, the CV for the DI of this species was comparatively small, i.e., 8.8% (Figure 4C). V. bryoniifolia and I. triloba had the second and third largest DI values, respectively. Their corresponding CVs for DI both exceeded 20%. T. jasminoides had the largest CV for its DI (=29.5%); C. orbiculatus and E. fortunei also had high CVs for their DI values, i.e., >20%. These features indicated that the intraspecific variation in leaf shape complexity can be large despite a small mean leaf complexity.
The scaling relationship of leaf perimeter vs. area was statistically strong for each investigated species (Figure 5; P < 0.01 for all linear relationships between ln(P) and ln(A)). The coefficients of determination (r2) were greater than 0.90 for 13 out of the 15 species studied. The coefficients of determination for I. triloba and V. bryoniifolia, which have the second and third largest DI values and high CVs, were still greater than 0.85. Although H. scandens had the largest DI, its r2 was still large (>0.93; Figure 5J), as the result of the lowest CV in DI. There were significant differences in the estimated slopes and intercepts among the 15 species (Figure 6). However, most estimated slopes and their corresponding 95% confidence intervals fell in a range of 0.45 to 0.60. E. fortunei and V. bryoniifolia had the smallest and largest slopes, respectively. For any two species within the same family, the estimated slopes were different (Figure 6A), whereas the estimated intercepts were almost equal (Figure 6B).

4. Discussion

The frequency distributions of AR and SI tend to be right-skewed because these parameters are proportional data. This phenomenology can be understood by considering the following. Assume that two leaves have a total area of 5 cm2, but the area of one on the leaf left side is 2 cm2, whereas, for the other, the area is 3 cm2. For the first leaf, AR value is 0.67, whereas for the other it is 1.5. AR values of the two leaves have an unequal divergence from 1; consequently more values are expected to fall in the range of 0.5 and 1. In this hypothetical case, a log-transformation is necessary [46] to normalize the data. An direct comparison of AR or SI values without using the log-transformation among different classes may therefore violate the condition of normality required for the HSD test. Shi et al. [31] found that AR values of four species of bamboos and six species of trees were not significantly different. The medians of AR values were found to be approximately equal to one. The present study confirms the findings of these and other previous studies, because ln(AR) values are approximately equal to 0. The leaves of the majority of species are typically not entirely bilaterally symmetric and thus manifest large SI values. However, the median of AR values can be approximately equal to one (Figure 7)—that is, two sides of leaves can have equal areas to the left and right side of their midveins and yet still be bilaterally asymmetric. In fact, most of the vine species investigated in this study have different degrees of bilateral asymmetry (Figure 3B). With the exception of two species in the family Vitaceae, SI values of the leaves of six other woody vine species are smaller than those of the leaves of the herbaceous vine species (Figure 3B), which indicates that the leaves of woody vines are more bilaterally symmetric than those of the herbaceous vines investigated in this study. Greater symmetry might result from a more regular distribution of leaves along the stems of these woody plants. Shi et al. [31] found that there is a power–law relationship between the mean and variance (i.e., Taylor’s power law) [47,48,49,50] of the absolute areal differences of the left and right sub-regions of the leaf lamina (Figure 2) based on four Indocalamus species. The estimated exponent of variance vs. the mean is described by a power function with an exponent of 1.89. We also examined the relationship between the mean and variance of leaf bilateral symmetry measures for the 15 species of vines examined in this study and observed a strong scaling relationship for the pooled data. A numerical value of 1.892 for scaling exponent was observed (Figure 8), which is nearly the same as the scaling exponent reported for the four Indocalamus species. Wang et al. [51] also confirmed Taylor’s power law for the leaf bilateral symmetry measure using three groups of plants (10 geographical populations of Parrotia subaequalis (H.T. Chang) R.M. Hao et H.T. Wei, 10 species of Bambusoideae, and 10 species of Rosaceae). These authors found that there were significant numerical differences in the scaling exponents.
These results indicate that leaves cluster into groups defined by their leaf bilateral symmetry measure based on their SI values. Thus, leaf shape differences among broad-leaved species do not follow a normal distribution, indicating that the leaves from different groups with different shapes may reflect different adaptive strategies for light competition. Cohen and Xu [48] report that the skewness of the frequency distribution (of any nonnegative measures in ecology or physics) is proportional to the estimated scaling exponent of variance vs. the mean. The pooled SI values of the 15 vine species investigated in our study follow a skewed distribution that is much smoother regardless of interspecific leaf-shape differences because of the large sample size (n = 5601). Nevertheless, whether leaf bilateral symmetry measures follow a general Taylor’s power law deserves further investigation with more species with varying and different leaf shapes (Figure 8).
Kincaid and Schneider [21] report that for entire leaves, the DI value is slightly larger than unity, and that deeply lobed, dissected, or lanceolate leaves have larger DI values. We observed a similar trend. H. scandens, V. bryoniifolia, I. triloba, P. tricuspidata, and D. opposita have the first to fifth largest DI values, respectively, which reflects the lobes and dissection of their leaves (Figure 1 and Figure 4C). The triangular leaf shape of P. perfoliatum is consistent with this index, whereas the DI values of D. opposita, F. multiflora, and P. perfoliatum leaves have no significant numerical differences. However, Kincaid and Schneider [21] only estimated DI values for some individual leaves, and this index has been largely neglected in subsequent investigations.
For example, McLellan [39] used log-transformed DI values to compare heteroblastic leaves from the first ten nodes along the main stem of B. dregei. However, the average replicate number of leaves for each position was only 11, which did not permit the authors to calculate accurate CV values in DI for each position and the corresponding scaling relationship of leaf perimeter vs. area. Thomas and Bazzaz [13] used DI to compare differences in leaf shape in relation to leaf position among three species grown under two CO2 concentrations (350 vs. 700 ppm). For leaf numbers 3−9, they found that there was a consistent trend toward higher DI values at elevated CO2. Santiago and Kim [22] used DI to systematically compare leaf-shape differences in 15 woody Sonchus species using nine replicate leaves per species. According to their data (see Table 2 published in ref. [22]), the average ln(DI) values (and the corresponding CVs) for forest and cliff species of Sonchus were 1.32 and 1.83 (and 27.1% and 23.3%), respectively. These values are significantly larger than those of the vines in our study. However, it is important to emphasize that large sample sizes for any species are required to make robust comparisons among species. A small sample size, such as nine leaves, can result in unreliable average values if the variation in DI values is large. The present study differs from all previous studies by using a large sample size (>310 leaves) for each species to calculate the DI values. This sample size provides much more accurate information regarding the complexity of leaf outline in these vines.
According to a recent study [16], environmental stress can result in changes in leaf shape, but seems not to affect the scaling relationship between leaf perimeter and area. If this holds true across all or most species, data for one variable can be used to predict the other variable, even under different environmental conditions. Although Thomas and Bazzaz [13] found that an elevated CO2 concentration can change the leaf shape of Taraxacum officinale Weber, the estimated slopes of perimeter vs. area did not differ between the two concentrations. Nevertheless, they found a significant difference between the two intercepts (i.e., normalization constants). Yu et al. [16] report that the numerical values of the slopes and intercepts for the leaves of Pyrus betulifolia Bunge under four salt concentrations are not statistically significantly different. However, salt concentration can change DI values. Shi et al. [52] found that the Montgomery equation (which assumes that leaf area is proportional to the product between leaf length and width [53]) applies to all of the data sets of broad-leaved plants used in their study, and the goodness of fit for each species was reasonably good. That is, leaf area can be expressed as a proportion of the product of leaf length and width. Since leaf perimeter manifests a good scaling relationship with respect to leaf area (Figure 5), leaf perimeter is consequently related to the product of leaf length and width (Figure 9). Although leaf perimeter is also affected by leaf shape, it is also affected by leaf size, and accordingly, scales with the product of leaf length and width. Shi et al. [20] and Su et al. [32] demonstrate that leaf-shape changes for many broad-leaved plants mainly as a result of changes in leaf width rather than leaf length. Thomas and Bazzaz [13] also show that leaf length manifests weaker variation between two CO2 concentrations than leaf width. Thus, changes in leaf area for different species appear to be more likely associated with changes in leaf width. Assuming that the Montgomery equation still holds between two or more different environmental conditions, we can further conclude that changes in leaf area are consequences of proportional changes in leaf width. If true, leaf shape changes caused by environmental stresses can be further represented by changes in the ratio of leaf width to length. Because only a few studies [13,16] have examined the scaling relationship between leaf perimeter and leaf surface area under different environmental stress, further investigation on whether environmental factors can change the scaling relationship between leaf area and perimeter, and whether the ratio of leaf width to length can account for such changes [24,25], is required.

5. Conclusions

Most species (14/15) examined in this study show no significant differences in average ln(AR), and have means approximated by zero, indicating that the areas of two sides of the lamina tend to be equal. Nevertheless, SI values among the 15 species have significant differences, which implies that the extent of leaf bilateral asymmetry among the 15 vine species is different. A statistically strong scaling relationship between leaf perimeter and area was observed for each species, and the scaling exponents of 12 out of 15 species fell within the range of 0.49−0.55. These data indicate that leaf surface area is approximately proportional to the square of lamina perimeter. The data also show that vines tend to generate similar left- and right-skewed leaves, a factor that might contribute to optimizing light interception. Weaker scaling relationships between leaf perimeter and area are associated with greater DI and a greater variation in DI. Thus, DI provides a useful measure of the degree of the complexity of leaf outline.

Author Contributions

K.J.N., D.H. and P.S. conceived and designed the experiment together. X.Y. collected the data. P.S. performed statistical analyses. P.S., Ü.N., C.H., K.J.N., and D.H. wrote the manuscript. All authors have read and agreed to the published version of the manuscript.

Funding

This research was funded by the Jiangsu Government Scholarship for Overseas Studies (grant number: JS-2018-038), the Priority Academic Program Development of Jiangsu Higher Education Institutions, the German Research Foundation, and the Open Access Publication Funds of University of Göttingen.

Acknowledgments

We thank Honghua Ruan for his useful help, and we are also thankful to two anonymous reviewers for their valuable comments on the earlier version of this manuscript.

Conflicts of Interest

The authors declare no conflict of interest.

References

  1. Niinemets, Ü.; Portsmuth, A.; Tobias, M. Leaf-shape and venation pattern alter the support investments within leaf lamina in temperate species: A neglected source of leaf physiological differentiation? Funct. Ecol. 2007, 21, 28–40. [Google Scholar] [CrossRef]
  2. Nicotra, A.B.; Leigh, A.; Boyce, C.K.; Jones, C.S.; Niklas, K.J.; Royer, D.L.; Tsukaya, H. The evolution and functional significance of leaf shape in the angiosperms. Funct. Plant Biol. 2011, 38, 535–552. [Google Scholar] [CrossRef] [Green Version]
  3. Smith, W.K.; Vogelmann, T.C.; DeLucia, E.H.; Bell, D.T.; Shepherd, K.A. Leaf form and photosynthesis: Do leaf structure and orientation interact to regulate internal light and carbon dioxide? BioScience 1997, 47, 785–793. [Google Scholar] [CrossRef]
  4. Royer, D.L.; Wilf, P. Why do toothed leaves correlate with cold climates? Gas exchange at leaf margins provides new insights into a classic paleotemperature proxy. Int. J. Plant Sci. 2006, 167, 11–18. [Google Scholar] [CrossRef] [Green Version]
  5. Wright, I.J.; Dong, N.; Maire, V.; Prentice, I.C.; Westoby, M.; Díaz, S.; Gallagher, R.V.; Jacobs, B.F.; Kooyman, R.; Law, E.A.; et al. Global climatic drivers of leaf size. Science 2017, 357, 917–921. [Google Scholar] [CrossRef] [Green Version]
  6. Runions, A.; Fuhrer, M.; Lane, B.; Federl, P.; Rolland-Lagan, A.-G.; Prusinkiewicz, P. Modeling and visualization of leaf venation patterns. ACM Trans. Gr. 2005, 24, 702–711. [Google Scholar] [CrossRef] [Green Version]
  7. Runions, A.; Tsiantis, M.; Prusinkiewicz, P. A common developmental program can produce diverse leaf shapes. New Phytol. 2017, 216, 401–418. [Google Scholar] [CrossRef] [Green Version]
  8. Brodribb, T.J.; Feild, T.S.; Jordan, G.J. Leaf maximum photosynthetic rate and venation area linked by hydraulics. Plant Physiol. 2007, 144, 1890–1898. [Google Scholar] [CrossRef] [Green Version]
  9. Lin, S.; Niklas, K.J.; Wan, Y.; Hölscher, D.; Hui, C.; Ding, Y.; Shi, P. Leaf shape influences the scaling of leaf dry mass vs. area: A test case using bamboos. Ann. Forest Sci. 2020, 77, 11. [Google Scholar] [CrossRef] [Green Version]
  10. Piazza, P.; Jasinski, S.; Tsiantis, M. Evolution of leaf developmental mechanisms. New Phytol. 2005, 167, 693–710. [Google Scholar] [CrossRef]
  11. Bar, M.; Ori, N. Leaf development and morphogenesis. Development 2014, 141, 4219–4230. [Google Scholar] [CrossRef] [Green Version]
  12. Chitwood, D.H.; Ranjan, A.; Martinez, C.C.; Headland, L.R.; Thiem, T.; Kumar, R.; Covington, M.F.; Hatcher, T.; Naylor, D.T.; Zimmerman, S.; et al. A modern ampelography: A genetic basis for leaf shape and venation patterning in grape. Plant Physiol. 2014, 164, 259–272. [Google Scholar] [CrossRef] [Green Version]
  13. Thomas, S.C.; Bazzaz, F.A. Elevated CO2 and leaf shape: Are dandelions getting toothier? Am. J. Bot. 1996, 83, 106–111. [Google Scholar] [CrossRef]
  14. Peppe, D.J.; Royer, D.L.; Gariglino, B.; Oliver, S.Y.; Newman, S.; Leight, E.; Enikolopov, G.; Fernandez-Burgos, M.; Herrera, F.; Adams, J.M.; et al. Sensitivity of leaf size and shape to climate: Global patterns and paleoclimatic applications. New Phytol. 2011, 190, 724–739. [Google Scholar] [CrossRef] [Green Version]
  15. Royer, D.L.; Peppe, D.J.; Wheeler, E.A.; Niinemets, Ü. Roles of climate and functional traits in controlling toothed vs. untoothed leaf margins. Am. J. Bot. 2012, 99, 915–922. [Google Scholar] [CrossRef] [Green Version]
  16. Yu, X.; Shi, P.; Hui, C.; Miao, L.; Liu, C.; Zhang, Q.; Feng, C. Effects of salt stress on the leaf shape and scaling of Pyrus betulifolia Bunge. Symmetry 2019, 11, 991. [Google Scholar] [CrossRef] [Green Version]
  17. Lin, S.; Zhang, L.; Reddy, G.V.P.; Hui, C.; Gielis, J.; Ding, Y.; Shi, P. A geometrical model for testing bilateral symmetry of bamboo leaf with a simplified Gielis equation. Ecol. Evol. 2016, 6, 6798–6806. [Google Scholar] [CrossRef]
  18. Shi, P.; Xu, Q.; Sandhu, H.S.; Gielis, J.; Ding, Y.; Li, H.; Dong, X. Comparison of dwarf bamboos (Indocalamus sp.) leaf parameters to determine relationship between spatial density of plants and total leaf area per plant. Ecol. Evol. 2015, 5, 4578–4589. [Google Scholar] [CrossRef]
  19. Gielis, J. A generic geometric transformation that unifies a wide range of natural and abstract shapes. Am. J. Bot. 2003, 90, 333–338. [Google Scholar] [CrossRef]
  20. Shi, P.; Ratkowsky, D.A.; Li, Y.; Zhang, L.; Lin, S.; Gielis, J. General leaf-area geometric formula exists for plants—Evidence from the simplified Gielis equation. Forests 2018, 9, 714. [Google Scholar] [CrossRef] [Green Version]
  21. Kincaid, D.T.; Schneider, R.B. Quantification of leaf shape with a microcomputer and Fourier transform. Can. J. Bot. 1983, 61, 2333–2342. [Google Scholar] [CrossRef]
  22. Santiago, L.S.; Kim, S.-C. Correlated evolution of leaf shape and physiology in the woody Sonchus alliance (Asteraceae: Sonchinae) in Macaronesia. Int. J. Plant Sci. 2009, 170, 83–92. [Google Scholar] [CrossRef] [Green Version]
  23. Baxes, G.A. Digital Image Processing: Principles and Applications; John Wiley and Sons, Inc.: New York, NY, USA, 1994. [Google Scholar]
  24. Niinemets, Ü.; Cescatti, A.; Christian, R. Constraints on light interception efficiency due to shoot architecture in broad-leaved Nothofagus species. Tree Physiol. 2004, 24, 617–630. [Google Scholar] [CrossRef] [Green Version]
  25. Niinemets, Ü.; Sparrow, A.; Cescatti, A. Light capture efficiency decreases with increasing tree age and size in the southern hemisphere gymnosperm Agathis australis. Trees Struct. Funct. 2005, 19, 177–190. [Google Scholar] [CrossRef]
  26. Roth-Nebelsick, A.; Konrad, W. Fossil leaf traits as archives for the past—And lessons for the future? Flora 2019, 254, 59–70. [Google Scholar] [CrossRef]
  27. Milla, R.; Reich, P.B. The scaling of leaf area and mass: The cost of light interception increases with leaf size. Proc. R. Soc. Biol. Sci. 2007, 274, 2109–2114. [Google Scholar] [CrossRef] [Green Version]
  28. Niklas, K.J.; Cobb, E.D.; Niinemets, Ü.; Reich, P.B.; Sellin, A.; Shipley, B.; Wright, I.J. ‘Diminishing returns’ in the scaling of functional leaf traits across and within species groups. Proc. Natl. Acad. Sci. USA 2007, 104, 8891–8896. [Google Scholar] [CrossRef] [Green Version]
  29. Huang, W.; Ratkowsky, D.A.; Hui, C.; Wang, P.; Su, J.; Shi, P. Leaf fresh weight versus dry weight: Which is better for describing the scaling relationship between leaf biomass and leaf area for broad-leaved plants? Forests 2019, 10, 256. [Google Scholar] [CrossRef] [Green Version]
  30. Price, C.A.; Symonova, O.; Mileyko, Y.; Hilley, T.; Weitz, J.S. Leaf extraction and analysis framework graphical user interface: Segmenting and analyzing the structure of leaf veins and areoles. Plant Physiol. 2011, 155, 236–245. [Google Scholar] [CrossRef] [Green Version]
  31. Shi, P.; Zheng, X.; Ratkowsky, D.A.; Li, Y.; Wang, P.; Cheng, L. A simple method for measuring the bilateral symmetry of leaves. Symmetry 2018, 10, 118. [Google Scholar] [CrossRef] [Green Version]
  32. Su, J.; Niklas, K.J.; Huang, W.; Yu, X.; Yang, Y.; Shi, P. Lamina shape does not correlate with lamina surface area: An analysis based on the simplified Gielis equation. Glob. Ecol. Conserv. 2019, 19, e00666. [Google Scholar] [CrossRef]
  33. Schnitzer, S.A.; Bongers, F. The ecology of lianas and their role in forests. Trends Ecol. Evol. 2002, 17, 223–230. [Google Scholar] [CrossRef] [Green Version]
  34. Appanah, S.; Gentry, A.H.; LaFrankie, J.V. Liana diversity and species richness of Malaysian rain forests. J. Trop. For. Sci. 1993, 6, 116–123. [Google Scholar]
  35. Li, W.; Cui, L.; Sun, B.; Zhao, X.; Gao, C.; Zhang, Y.; Zhang, M.; Pan, X.; Lei, Y.; Ma, W. Distribution patterns of plant communities and their associations with environmental soil factors on the eastern shore of Lake Taihu, China. Ecosyst. Health Sustain. 2017, 3, 1385004. [Google Scholar] [CrossRef]
  36. Gianoli, E. The behavioural ecology of climbing plants. AOB Plants 2015, 7, plv013. [Google Scholar] [CrossRef] [Green Version]
  37. Putz, F.E.; Holbrook, N.M. Strangler fig rooting habits and nutrient relations in the Llanos of Venezuela. Am. J. Bot. 1989, 76, 781–788. [Google Scholar] [CrossRef]
  38. Holbrook, N.M.; Putz, F.E. Water relations of epiphytic and terrestrially-rooted strangler figs in a Venezuelan palm savanna. Oecologia 1996, 106, 424–431. [Google Scholar] [CrossRef]
  39. McLellan, T. The roles of heterochrony and heteroblasty in the diversification of leaf shapes in Begonia dregei (Begoniaceae). Am. J. Bot. 1993, 80, 796–804. [Google Scholar] [CrossRef]
  40. Gianoli, E.; Carrasco-Urra, F. Leaf mimicry in a climbing plant protects against herbivory. Curr. Biol. 2014, 24, 984–987. [Google Scholar] [CrossRef] [Green Version]
  41. R Core Team. R: A Language and Environment for Statistical Computing; R Foundation for Statistical Computing: Vienna, Austria, 2019; Available online: https://www.R-project.org/ (accessed on 1 June 2019).
  42. Hsu, J.C. Multiple Comparisons: Theory and Methods; Chapman and Hall/CRC: New York, NY, USA, 1996. [Google Scholar]
  43. Smith, R.J. Use and misuse of the reduced major axis for line-fitting. Am. J. Phys. Anthropol. 2009, 140, 476–486. [Google Scholar] [CrossRef]
  44. Efron, B.; Tibshirani, R.J. An Introduction to the Bootstrap; Chapman and Hall/CRC: New York, NY, USA, 1993. [Google Scholar]
  45. Sandhu, H.S.; Shi, P.; Kuang, X.; Xue, F.; Ge, F. Applications of the bootstrap to insect physiology. Florida Entomol. 2011, 94, 1036–1041. [Google Scholar] [CrossRef]
  46. Ratkowsky, D.A. Handbook of Nonlinear Regression Models; Marcel Dekker: New York, NY, USA, 1990. [Google Scholar]
  47. Taylor, L.R. Aggregation, variance and the mean. Nature 1961, 189, 732–735. [Google Scholar] [CrossRef]
  48. Cohen, J.E.; Xu, M. Random sampling of skewed distributions implies Taylor’s power law of fluctuation scaling. Proc. Natl. Acad. Sci. USA 2015, 112, 7749–7754. [Google Scholar] [CrossRef] [PubMed] [Green Version]
  49. Giometto, A.; Formentin, M.; Rinaldo, A.; Cohen, J.E.; Maritan, A. Sample and population exponents of generalized Taylor’s law. Proc. Natl. Acad. Sci. USA 2015, 112, 7755–7760. [Google Scholar] [CrossRef] [PubMed] [Green Version]
  50. Shi, P.; Sandhu, H.S.; Reddy, G.V.P. Dispersal distance determines the exponent of the spatial Taylor’s power law. Ecol. Model. 2016, 335, 48–53. [Google Scholar] [CrossRef] [Green Version]
  51. Wang, P.; Ratkowsky, D.A.; Xiao, X.; Yu, X.; Su, J.; Zhang, L.; Shi, P. Taylor’s power law for leaf bilateral symmetry. Forests 2018, 9, 500. [Google Scholar] [CrossRef] [Green Version]
  52. Shi, P.; Liu, M.; Ratkowsky, D.A.; Gielis, J.; Su, J.; Yu, X.; Wang, P.; Zhang, L.; Lin, Z.; Schrader, J. Leaf area-length allometry and its implications in leaf-shape evolution. Trees Struct. Funct. 2019, 33, 1073–1085. [Google Scholar] [CrossRef]
  53. Montgomery, E.G. Correlation Studies in Corn. In Annual Report no. 24; Agricultural Experimental Station: Lincoln, NB, USA, 1911; pp. 108–159. [Google Scholar]
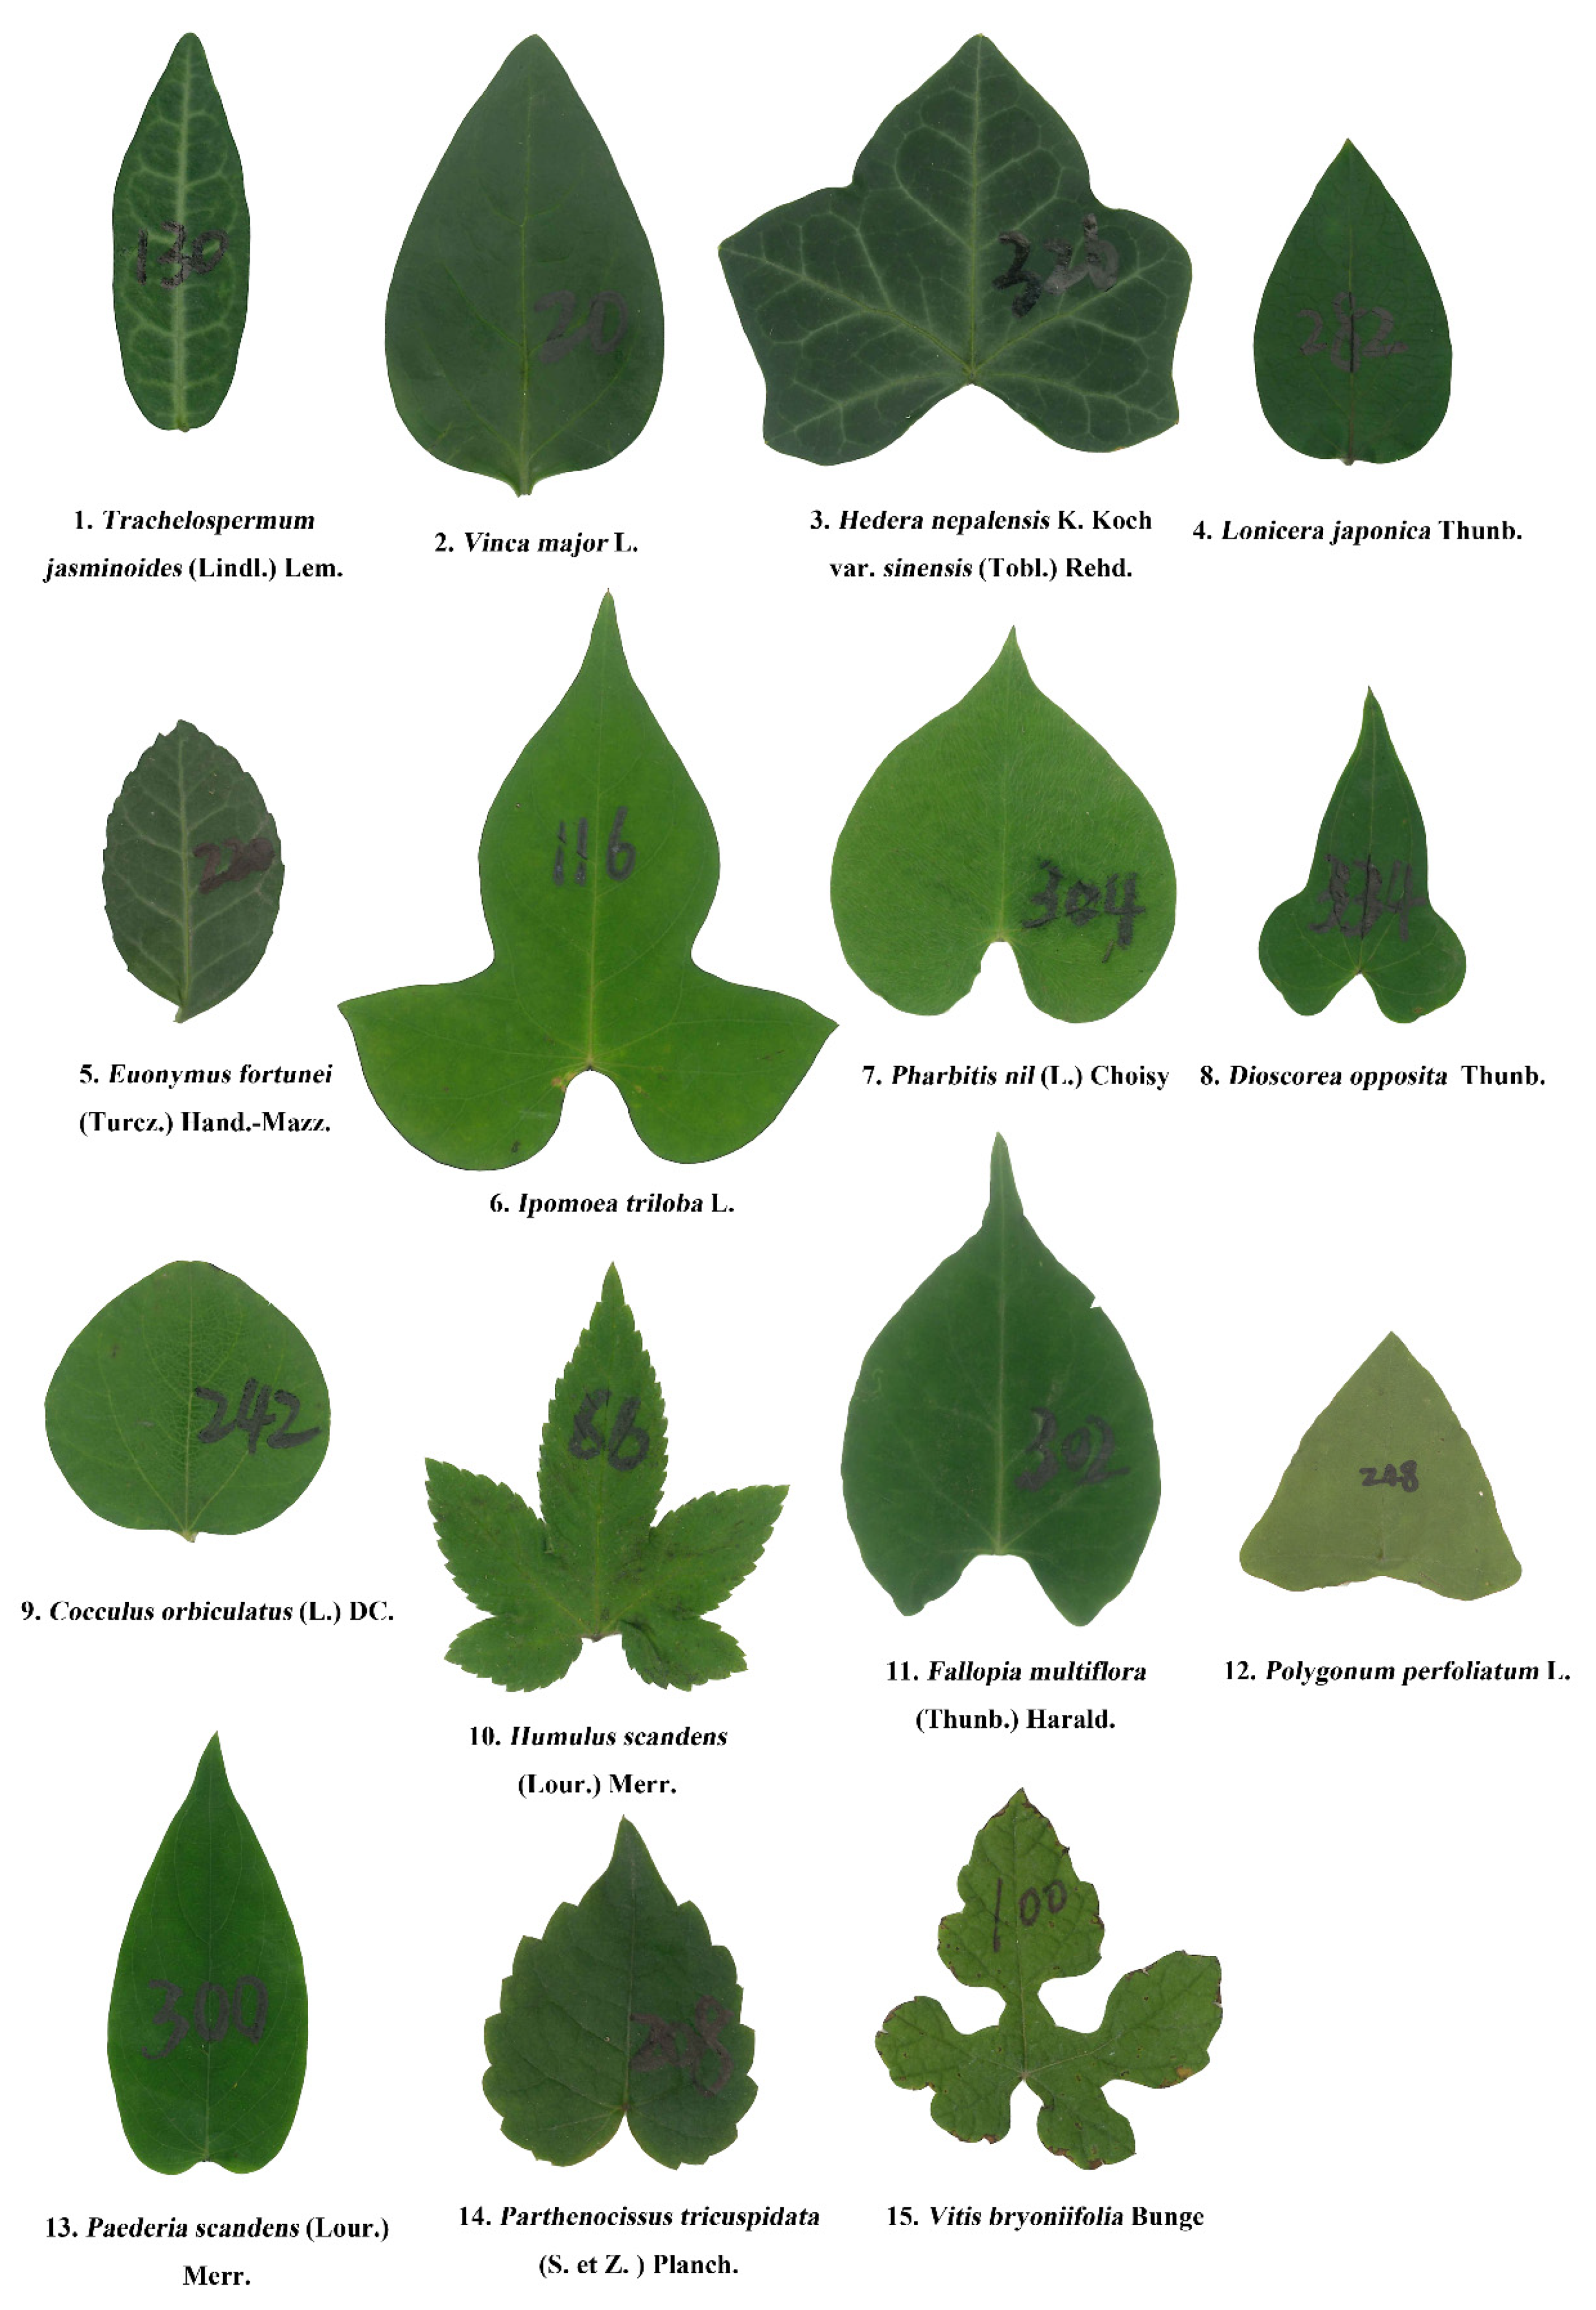
Figure 1. Representative leaf images of 15 species of climbing plants. Species 1−5, 9, 14, and 15 are woody vines, and the remaining seven species are herbaceous vines.
Forests 11 00246 g001
Figure 2. Illustration of the calculations for the areal ratio (AR) of the left side to the right side, and the standardized index (SI) for measuring leaf bilateral symmetry. L1 to L5 represent the areas of the upper (left) subregions (i.e., the intersections between strips that were formed by the adjacent blue vertical lines with the left side of this leaf), and R1 to R5 represent the areas of the lower (right) subregions. AR = (L1+L2+L3+L4+L5) / (R1+R2+R3+R4+R5), and SI = [|L1−R1| / (L1+R1) + |L2−R2| / (L2+R2) + |L3−R3| / (L3+R3) + |L4−R4| / (L4+R4) + |L5−R5| / (L5+R5)] / 5. In this figure, we only used 5 strips (that were formed by two adjacent blue vertical lines) for conveniently showing the calculation process, and during the actual calculations we used 1000 strips within a given leaf using the computer codes developed by Shi et al. [20] and Su et al. [32].
Forests 11 00246 g002
Figure 3. Boxplots of the natural logarithm of the areal ratio (AR) of the left side to right side of a leaf (A), and the natural logarithm of the standardized index (SI) for measuring leaf bilateral symmetry (B). In panel B, the numbers below the whiskers of boxes represent the coefficients of variation of ln(SI). The bold segments in the boxes represent the medians, and the points near the bold segments represent the means. Different colors represent different species of vines.
Forests 11 00246 g003
Figure 4. Boxplots of leaf surface area (A), leaf perimeter (B), and the natural logarithm of the ratio of leaf perimeter to a proportionality of the square root of leaf surface area (C). The numbers on the whiskers of the boxes in panel C represent the coefficients of variation in ln(DI), where DI is equal to P / 2 π A , P is the leaf perimeter, and A is the area. The numbers on the top of the whiskers refer to the coefficients of variation of the dissection indices. Different colors represent different species of vines.
Forests 11 00246 g004
Figure 5. Scaling relationships between leaf perimeter and area for the 15 species of vines. Panels (AO) represent different vine species. In each panel, y represents the natural logarithm of leaf perimeter in cm; x represents the natural logarithm of leaf area in cm2; CI represents the 95% confidence intervals of the slope based on 3000 bootstrapping; r2 is the coefficient of determination, which measures the goodness of fit for a reduced major axis regression; and n is the sample size (i.e., the number of data points).
Forests 11 00246 g005
Figure 6. Boxplots of the slope (A) and intercept (B) for a linearized equation of the scaling relationship between ln(leaf perimeter) and ln(leaf area) (see Figure 5 for details). Different colors represent different species of vines.
Forests 11 00246 g006
Figure 7. Fishtail plot for leaf bilateral symmetry. The smaller the ln(SI), the more bilaterally symmetric the leaf is. If ln(AR) is equal to 0, it indicates that the areas of the left side and that of the right side of a leaf are equal (Figure 2 for calculation). ln(AR) can provide information on whether the area of the left side is equal to that of the right side of a leaf, but it cannot be used to measure the strict bilateral symmetry for a leaf. Different colors represent different species of vines, and each point corresponds to a single leaf.
Forests 11 00246 g007
Figure 8. Scaling relationship between the mean and variance of leaf bilateral symmetry measure for the pooled data of 15 vines. y represents the natural logarithm of variance; x represents the natural logarithm of mean; CI represents the 95% confidence intervals of the slope based on bootstrapping (3000 resamples); r2 is the coefficient of determination, which measures the goodness of fit for a reduced major axis regression; and n is the sample size. Different colors represent different species of vines, and each point corresponds to a single leaf.
Forests 11 00246 g008
Figure 9. Scaling relationships between leaf perimeter and the product of leaf length and width for the 15 species of vines. Panels (AO) represent different vine species. In each panel, y represents the natural logarithm of leaf perimeter in cm; x represents the natural logarithm of the product between leaf length and width in cm2; CI represents the 95% confidence intervals of the slope based on bootstrapping (3000 resamples); r2 is the coefficient of determination, which measures the goodness of fit for a reduced major axis regression; and n is the sample size (i.e., the number of data points).
Forests 11 00246 g009
Table 1. Leaf collection information of 15 species of climbing plants.
Data SetFamilyLatin NameTypeSampling TimeCollection LocationAltitude (m)
1ApocynaceaeTrachelospermum jasminoides (Lindl.) Lem.Perennial woody20 July 201932°04′40″N, 118°48′30″E13
2ApocynaceaeVinca major L.Perennial woody15 October 201832°04′46″N, 118°48′32″E16
3AraliaceaeHedera nepalensis K. Koch var. sinensis (Tobl.) Rehd.Perennial woody23 October 201832°04′38″N, 118°48′32″E14
4CaprifoliaceaeLonicera japonica Thunb.Perennial woody20 July 201932°04′50″N, 118°48′34″E16
5CelastraceaeEuonymus fortunei (Turcz.) Hand.-Mazz.Perennial woody13 August 201932°04′30″N, 118°48′33″E19
6ConvolvulaceaeIpomoea triloba L.Annual herbaceous12 October 201831°36′08″N, 119°10′36″E37
7ConvolvulaceaePharbitis nil (L.) ChoisyAnnual herbaceous12 October 201831°36′07″N, 119°10′36″E37
8DioscoreaceaeDioscorea opposita Thunb.Perennial herbaceous21 July 201932°04′48″N, 118°48′44″E17
9MenispermaceaeCocculus orbiculatus (L.) DC.Perennial woody12 October 201831°36′07″N, 119°10′43″E37
10MoraceaeHumulus scandens (Lour.) Merr.Perennial herbaceous12 October 201831°36′07″N, 119°10′35″E37
11PolygonaceaeFallopia multiflora (Thunb.) Harald.Perennial herbaceous9 April 201932°05′03″N, 118°48′45″E25
12PolygonaceaePolygonum perfoliatum L.Annual herbaceous30 September 201831°36′19″N, 119°10′35″ E39
13RubiaceaePaederia scandens (Lour.) Merr.Perennial herbaceous21 July 201932°04′44″N, 118°48′44″E20
14VitaceaeParthenocissus tricuspidata (S. et Z.) Planch.Perennial woody13 August 201932°04′30″N, 118°48′33″E19
15VitaceaeVitis bryoniifolia BungePerennial woody12 August 201931°36′07″N, 119°10′40″E35

