Assessing Environmental Control of Sap Flux of Three Tree Species Plantations in Degraded Hilly Lands in South China


 , ,
, ,
Abstract
1. Introduction
2. Materials and Methods
2.1. Site description
2.2. Measurements
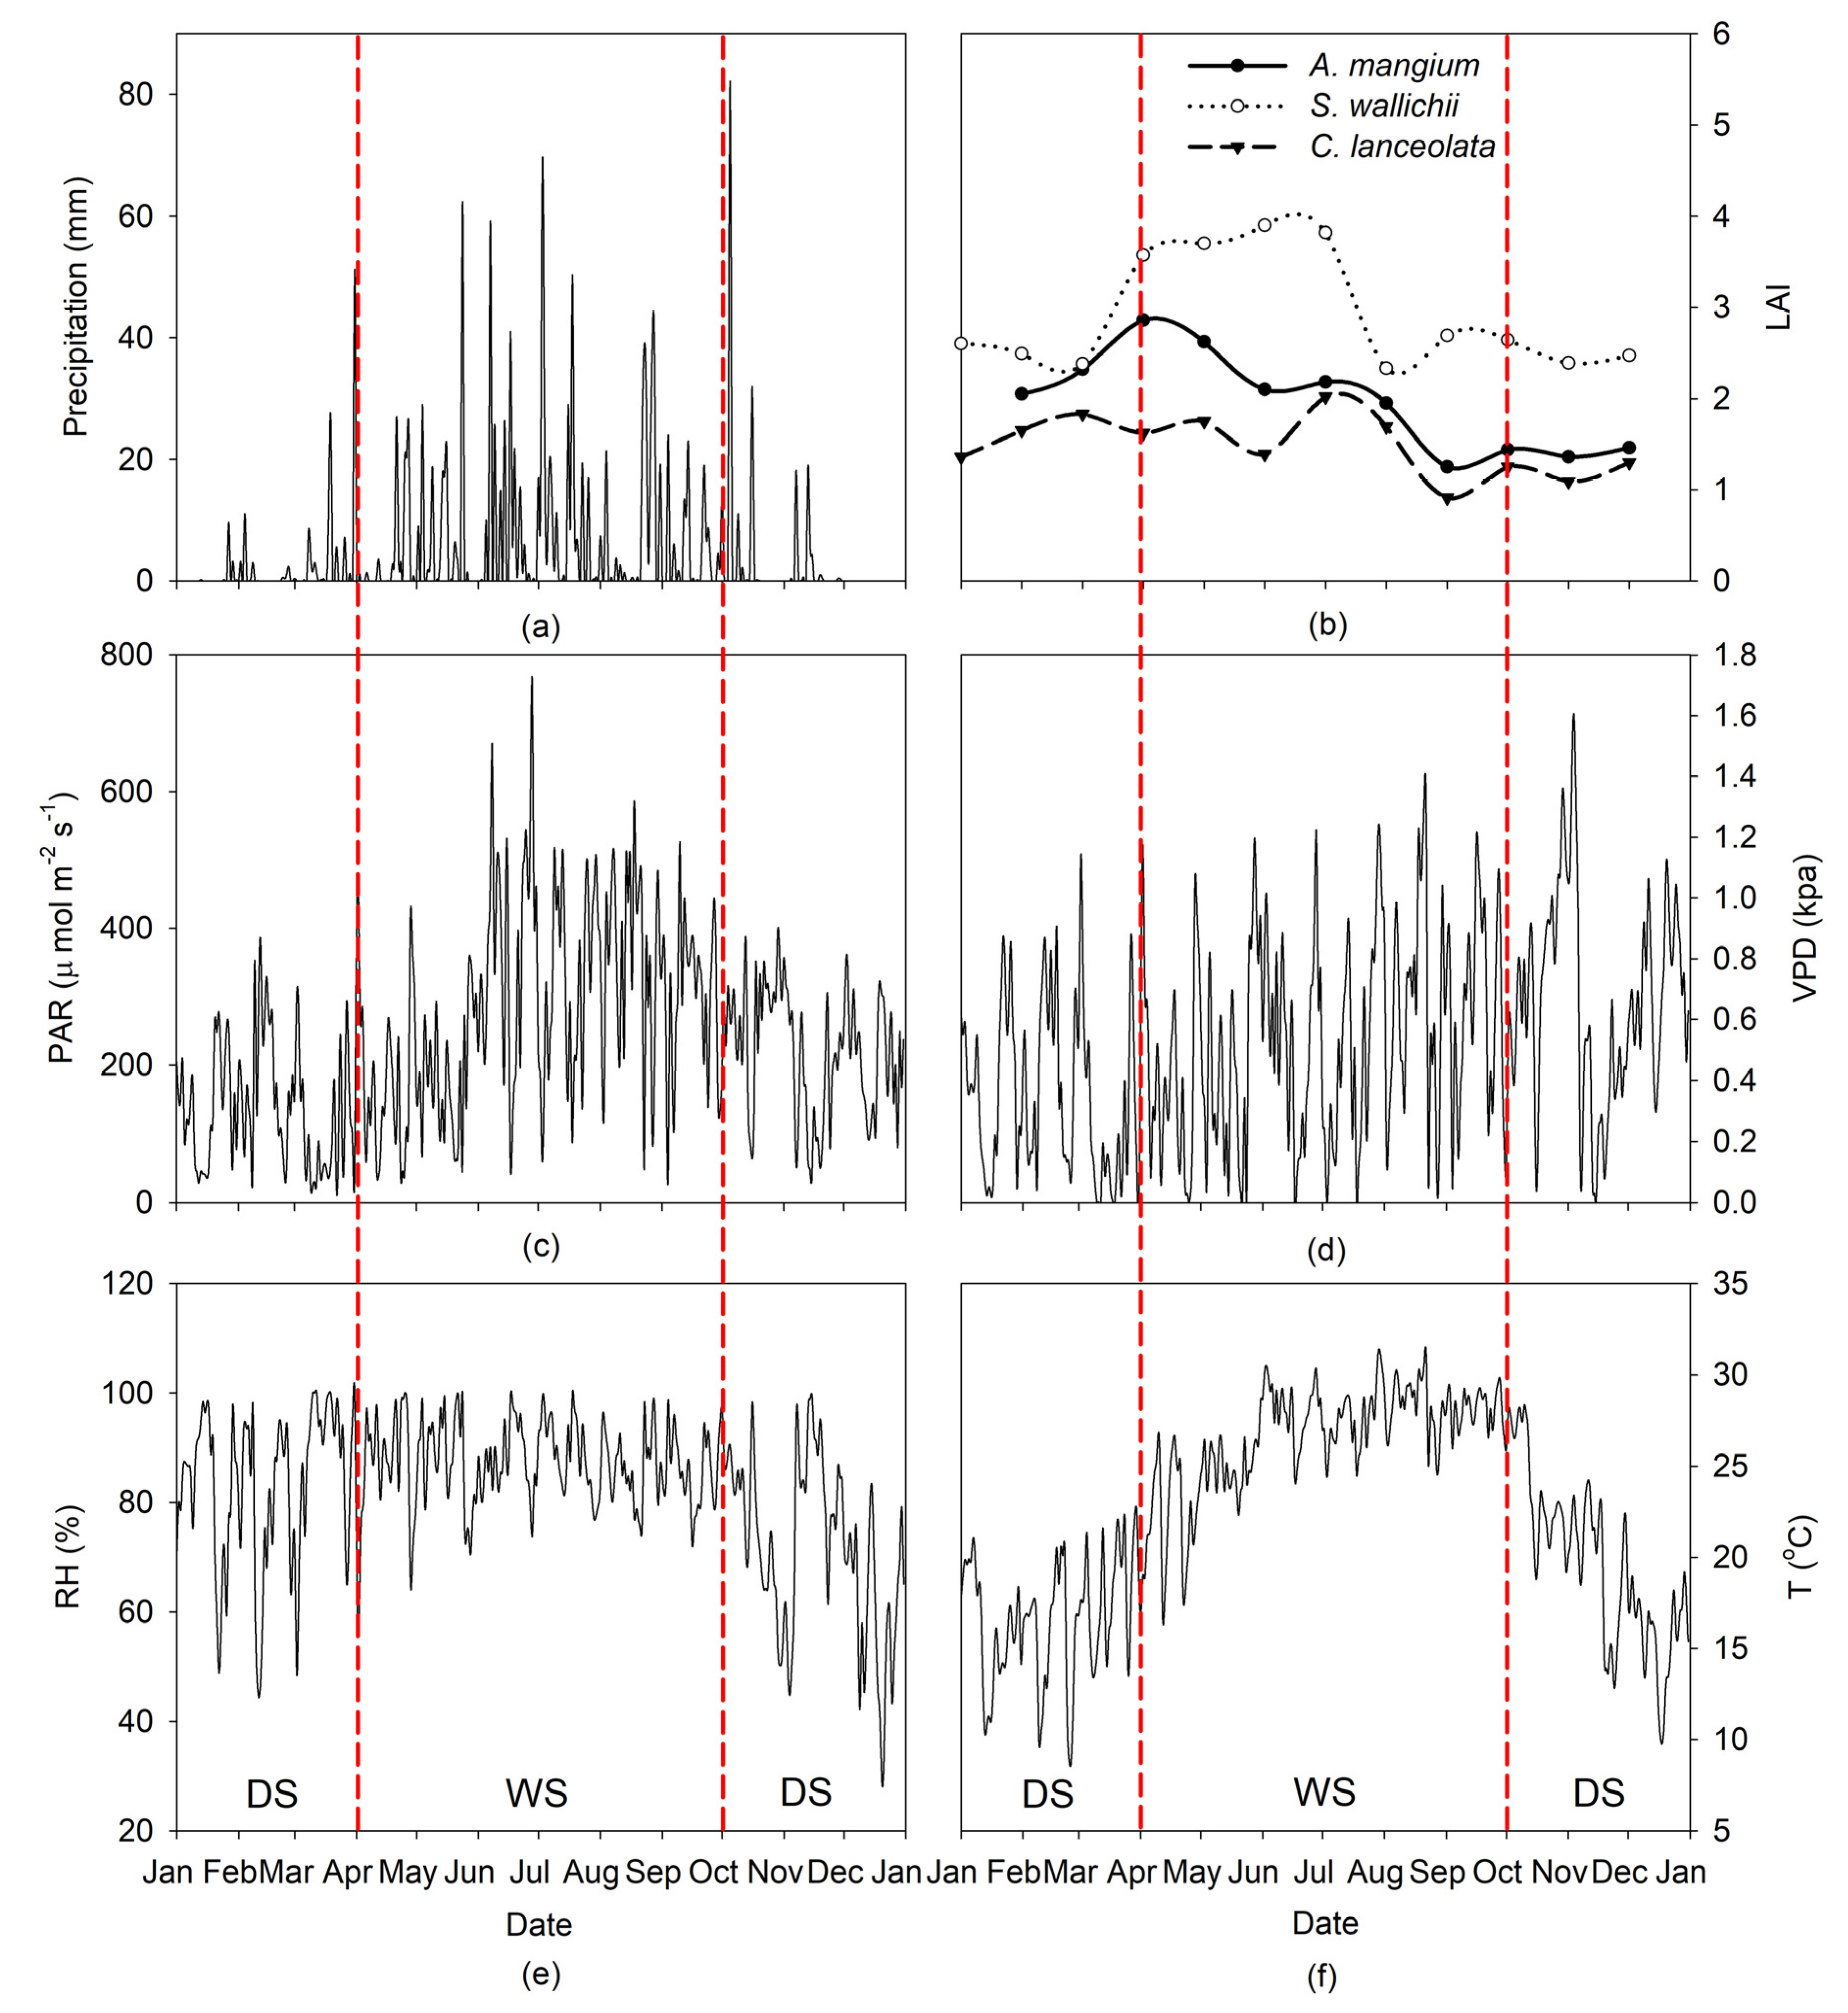
2.2.1. Microclimate
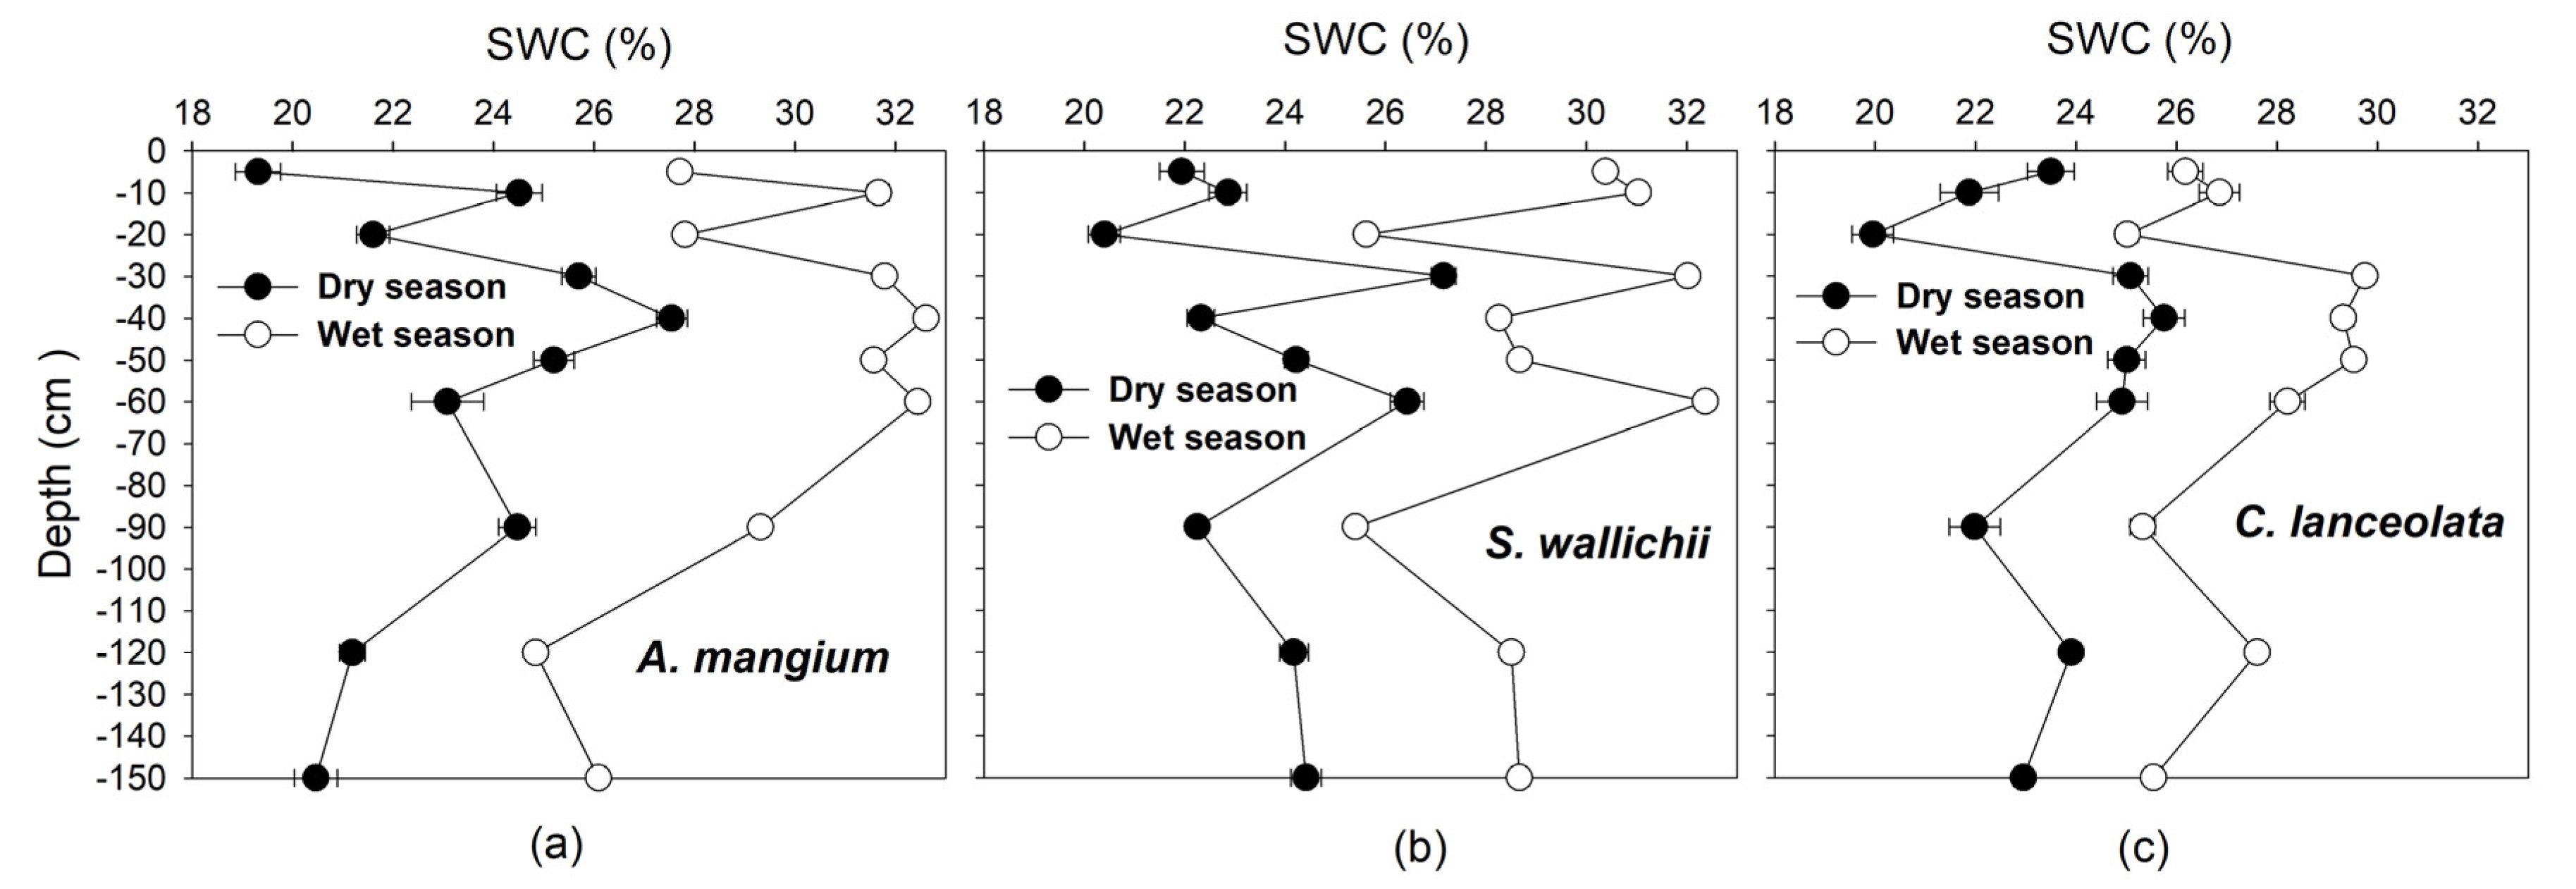
2.2.2. Soil Water Content
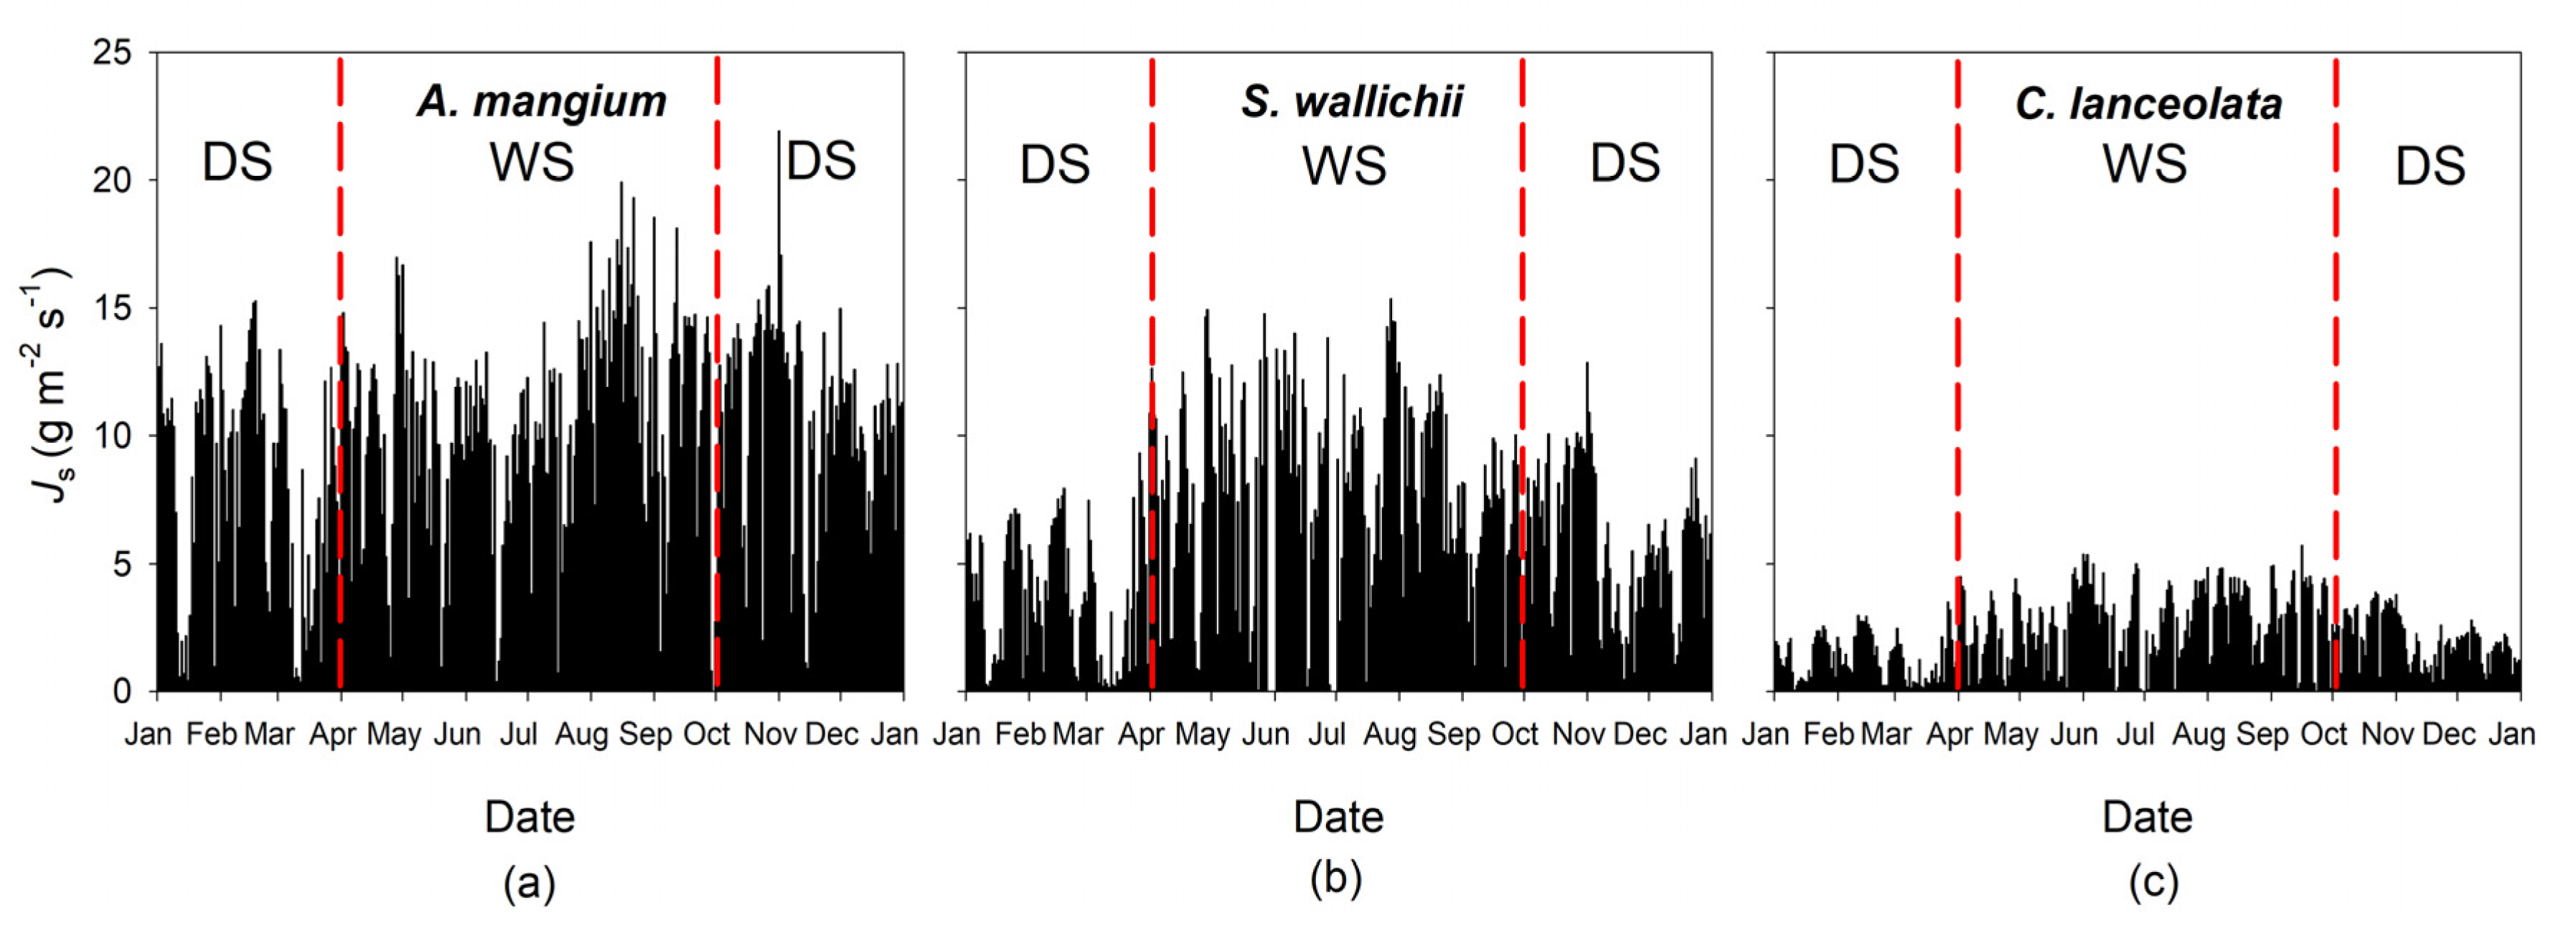
2.2.3. Sap Flow
2.2.4. Canopy Conductance per Sapwood Area
2.3. Data Analysis and Modeling
3. Results
3.1. Micrometeorology
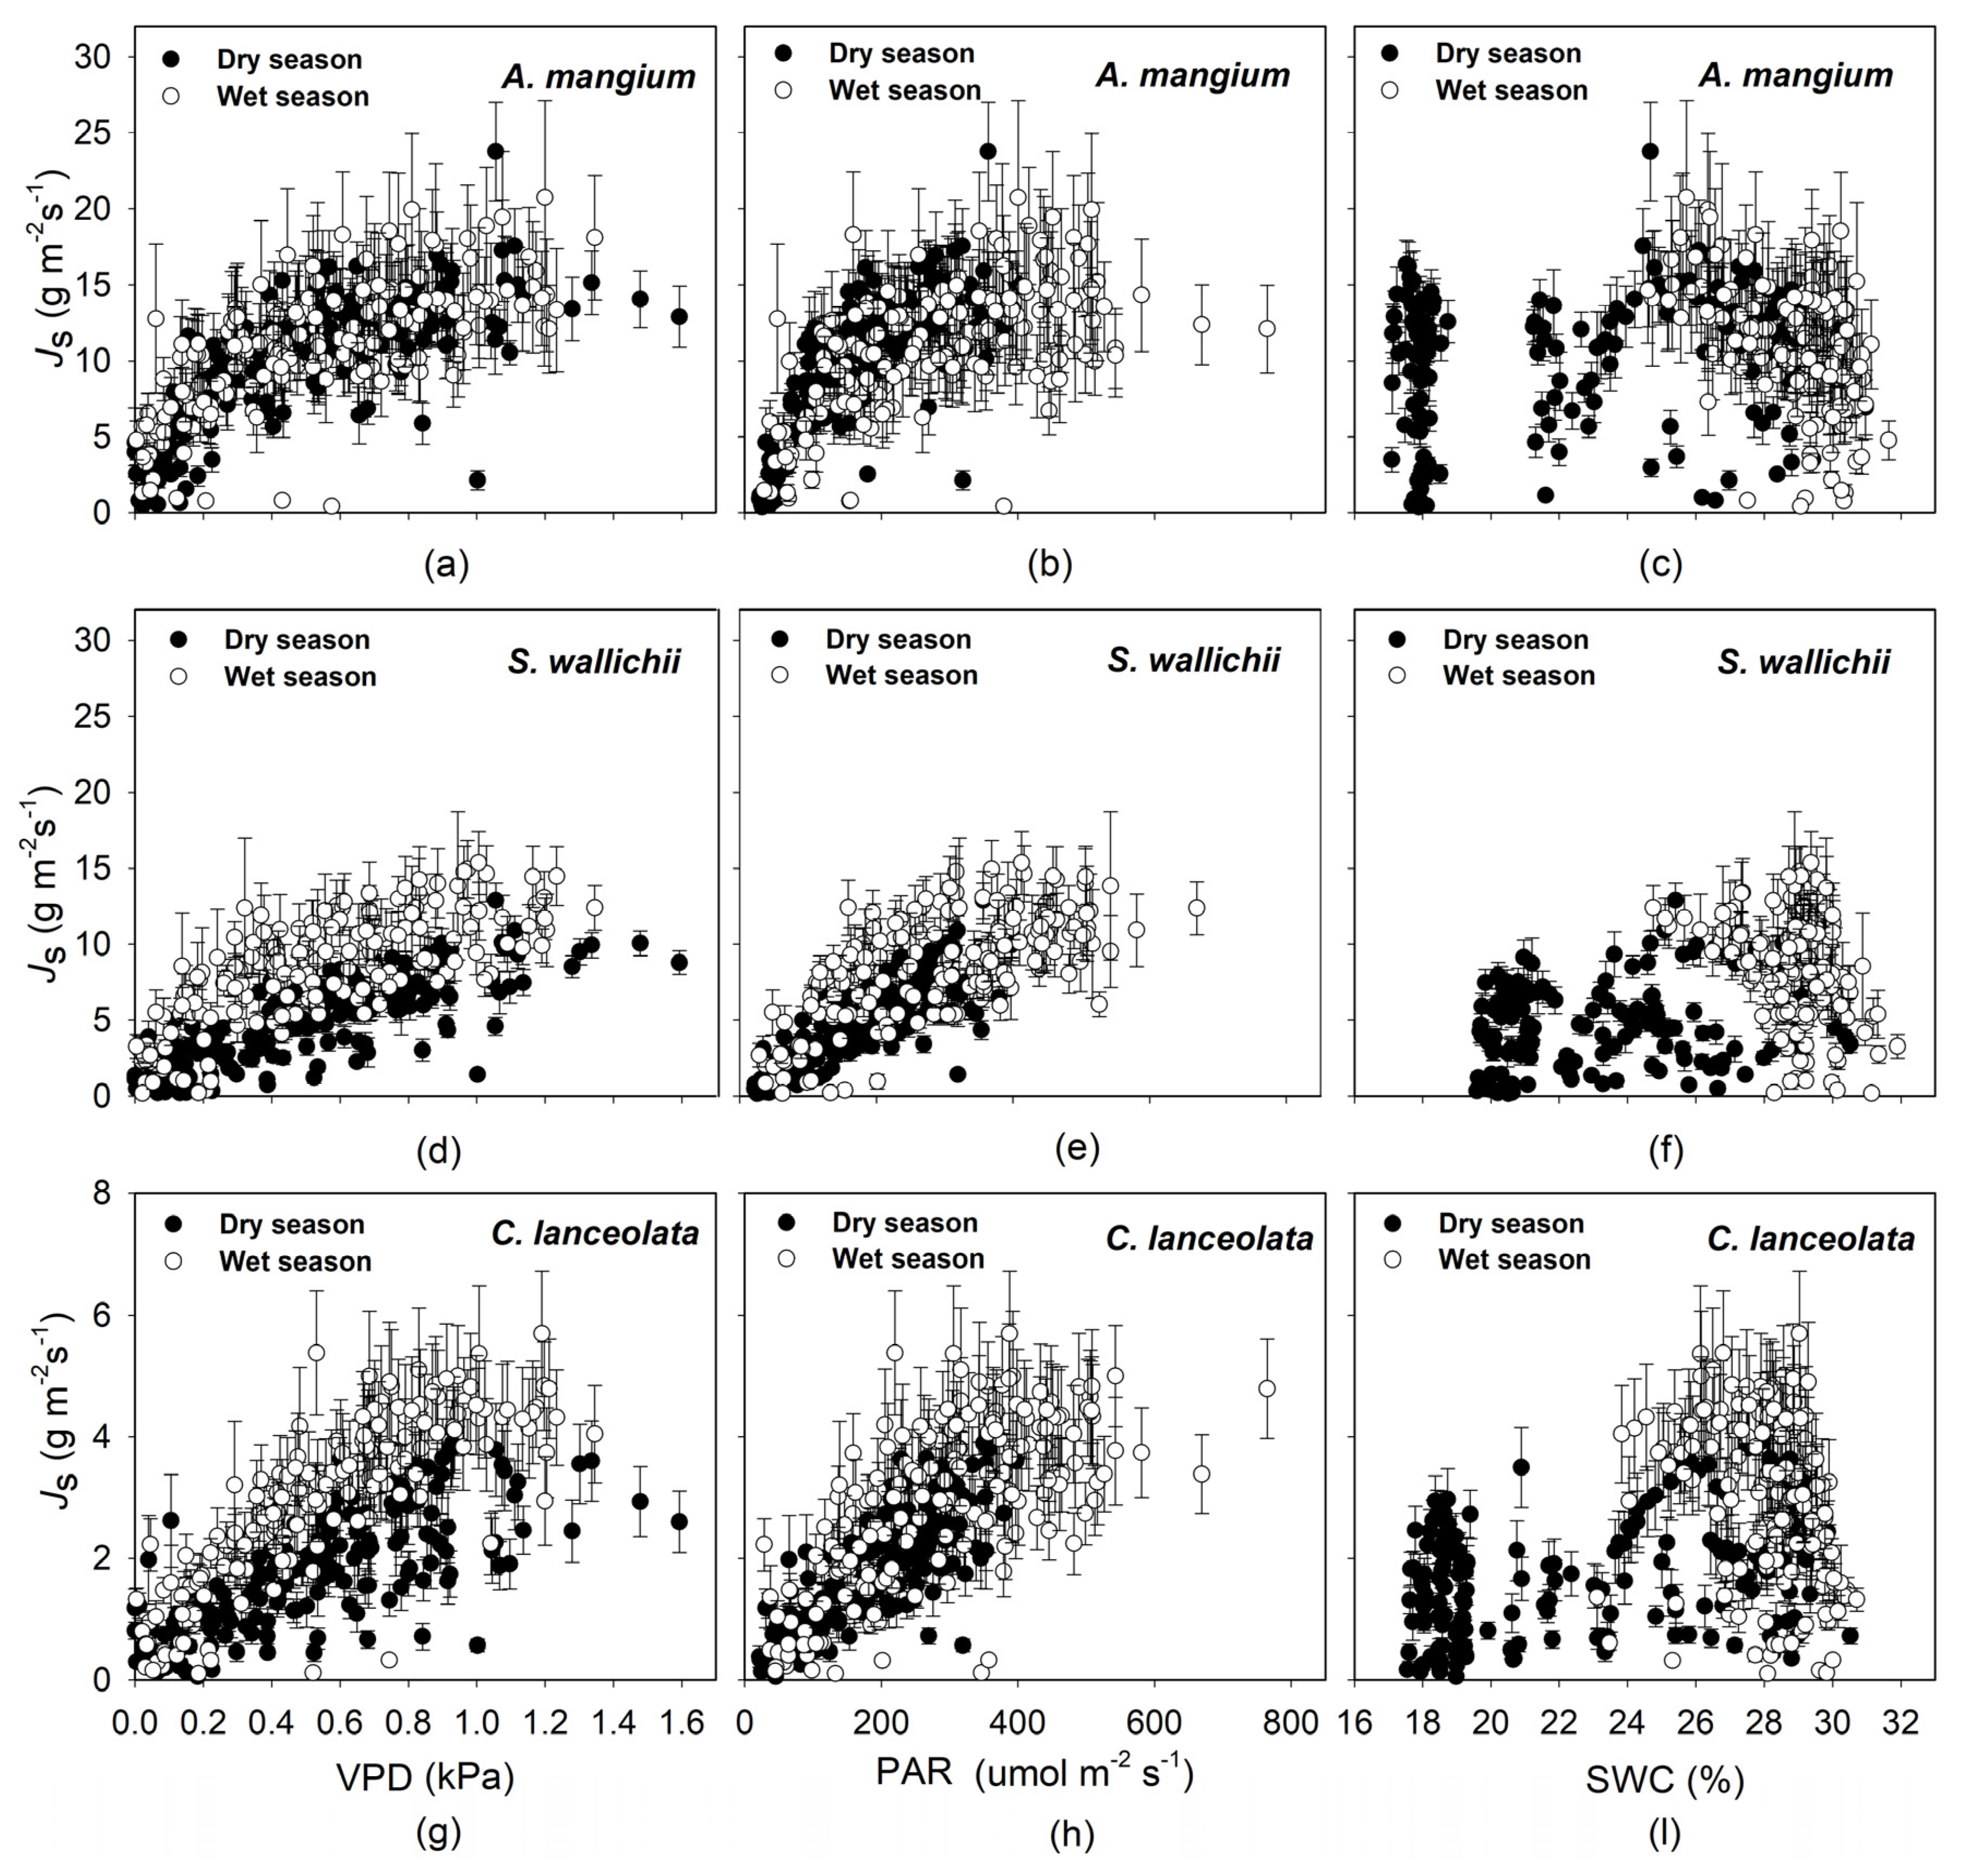
3.2. Sap Flow Density and Environmental Effects
4. Discussion
5. Conclusions
Supplementary Materials
Author Contributions
Funding
Acknowledgments
Conflicts of Interest
References
- FAO. Global Forest Resources Assessment 2010; FAO Forestry Paper No. 163; UN Food and Agriculture Organization: Rome, Italy, 2010. [Google Scholar]
- Forest Stewardship Council (FSC). Strategic Review on the Future of Forest Plantations; FSC: Helsinki, Finland, 2012. [Google Scholar]
- China Forestry Administration Returning Farmland to Forest Office. The National Forest Area is 3.12 Billion mu and the Forest Coverage Rate is the Highest in Fujian Province. 2018. Available online: http://www.forestry.gov.cn (accessed on 13 March 2018).
- Zhou, G.Y.; Wei, X.H.; Luo, Y.; Zhang, M.F.; Li, Y.L.; Qiao, Y.N.; Liu, H.G.; Wang, C.L. Forest recovery and river discharge at the regional scale of Guangdong Province, China. Water Resour. Res. 2010, 46. [Google Scholar] [CrossRef]
- Peng, S.L.; Hou, Y.P.; Chen, B.M. Vegetation Restoration and Its Effects on Carbon Balance in Guangdong Province, China. Restor. Ecol. 2009, 17, 487–494. [Google Scholar] [CrossRef]
- Statistical Bureau of Guangdong Province. Guangdong Statistical Yearbook; China Statistical Publishing House: Guangzhou, China, 2016. Available online: www.stats.gov.cn/tjsj/ndsj/2016/indexeh.htm (accessed on 17 October 2016).
- Calder, I.R. Forests and water-Ensuring forest benefits outweigh water costs. For. Ecol. Manag. 2007, 251, 110–120. [Google Scholar] [CrossRef]
- Jackson, R.B.; Jobbagy, E.G.; Avissar, R.; Roy, S.B.; Barrett, D.J.; Cook, C.W.; Farley, K.A.; le Maitre, D.C.; McCarl, B.A.; Murray, B.C. Trading water for carbon with biological sequestration. Science 2005, 310, 1944–1947. [Google Scholar] [CrossRef] [PubMed]
- Peng, H.; Tague, C.; Jia, Y. Evaluating the eco-hydrologic impacts of reforestation in the Loess Plateau, China, using an eco-hydrologic model. Ecohydrology 2016, 9, 498–513. [Google Scholar] [CrossRef]
- Ferraz, S.F.; Lima, W.D.; Rodrigues, C.B. Managing forest plantation landscapes for water conservation. For. Ecol. Manag. 2013, 301, 58–66. [Google Scholar] [CrossRef]
- Booth, T.; Yan, H. Identifying Climatic Areas in China Suitable for Acacia mearnsii and A. mangium; ACIAR Proceedings Series; Australian Centre for International Agricultural Research: Canberra, Australia, 1991.
- Zhao, P.; Zou, L.; Rao, X.; Ma, L.; Ni, G.; Zeng, X.; Cai, X.A. Water consumption and annual variation of transpiration in mature Acacia mangium plantation. Acta Ecol. Sin. 2011, 31, 6038–6048. [Google Scholar]
- Yu, Z.Y.; Peng, S.L. Ecological Study of Vegetation Restoration in Tropical and Subtropical Degraded Ecosystems; Guangdong Science and Technology Press: Guangzhou, China, 1996. [Google Scholar]
- Wang, H.; Zhao, P.; Holscher, D.; Wang, Q.; Lu, P.; Cai, X.A.; Zeng, X.P. Nighttime sap flow of Acacia mangium and its implications for nighttime transpiration and stem water storage. J. Plant Ecol. 2012, 5, 294–304. [Google Scholar] [CrossRef]
- Li-Zhen, W.; Li, Z.W. Study on applied effectiveness of biological firebreak network of Schima. Scientia Silvae Sinicae 1997, 33, 338–348. [Google Scholar]
- Tian, D.L. The Functioning of Chinese Fir Plantation Ecosystem; Science Press: Beijing, China, 2005. [Google Scholar]
- Fang, J.Y.; Chen, A.P.; Peng, C.H.; Zhao, S.Q.; Ci, L. Changes in forest biomass carbon storage in China between 1949 and 1998. Science 2001, 292, 2320–2322. [Google Scholar] [CrossRef]
- Tian, D.L.; Yan, W.D.; Chen, X.Y.; Deng, X.W.; Peng, Y.Y.; Kane, W.X.; Peng, C.H. Variation in runoff with age of Chinese fir plantations in Central South China. Hydrol. Res. 2008, 22, 4870–4876. [Google Scholar] [CrossRef]
- Yan, W.D.; Deng, X.W.; Chen, X.Y.; Tian, D.L.; Xiang, W.H.; Peng, Y.Y. Long-term variations of rainfall interception in different growth stages of Chinese fir plantations. Hydrol. Sci. 2015, 60, 2178–2188. [Google Scholar] [CrossRef]
- Van Dijk, A.I.; Keenan, R.J. Planted forests and water in perspective. For. Ecol. Manag. 2007, 251, 1–9. [Google Scholar] [CrossRef]
- Murgue, C.; Therond, O.; Leenhardt, D. Toward integrated water and agricultural land management: Participatory design of agricultural landscapes. Land Use Policy 2015, 45, 52–63. [Google Scholar] [CrossRef]
- Fu, S.L.; Lin, Y.B.; Rao, X.Q.; Liu, S.P. The Dataset of Observation and Research on Chinese Ecosystem: Forest Ecosystem of Heshan Station, Guangdong Province (1998–2008); China Agriculture Press: Beijing, China, 2011. [Google Scholar]
- Wang, Q.; Gao, J.G.; Zhao, P.; Zhu, L.W.; Ouyang, L.; Ni, G.Y.; Zhao, X.H. Biotic- and abiotic-driven variations of the night-time sap flux of three co-occurring tree species in a low subtropical secondary broadleaf forest. AoB Plants 2018, 10, ply025. [Google Scholar] [CrossRef]
- Zhou, G.Y.; Wei, X.H.; Wu, Y.P.; Liu, S.G.; Huang, Y.H.; Yan, J.H.; Zhang, D.Q.; Zhang, Q.M.; Liu, J.X.; Meng, Z.; et al. Quantifying the hydrological responses to climate change in an intact forested small watershed in Southern China. Glob. Chang. Biol. 2011, 17, 3736–3746. [Google Scholar] [CrossRef]
- Granier, A. Evalution of transpration in a Douglas-fir stand by means of sap flow measurements. Tree Physiol. 1987, 3, 309–319. [Google Scholar] [CrossRef]
- Hu, Y.T.; Zhao, P.; Shen, W.J.; Zhu, L.W.; Ni, G.Y.; Zhao, X.H.; Zhang, Z.Z.; Rao, X.Q.; Ouyang, L.; Zeng, X.M.; et al. Responses of Tree Transpiration and Growth to Seasonal Rainfall Redistribution in a Subtropical Evergreen Broad-Leaved Forest. Ecosystems 2018, 21, 811–826. [Google Scholar] [CrossRef]
- Campbell, G.S.; Norman, J.M. An Introduction to Environmental Biophysics, 2nd ed.; Springer: New York, NY, USA, 1998. [Google Scholar]
- Lu, P.; Urban, L.; Zhao, P. Granier’s thermal dissipation probe (TDP) method for measuring sap flow in trees: Theory and practice. Acta Bot. Sin. 2004, 46, 631–646. [Google Scholar]
- Oishi, A.C.; Hawthorne, D.; Oren, R. Baseliner: An open-source, interactive tool for processing sap flux data from thermal dissipation probes. SoftwareX 2016, 5, 139–143. [Google Scholar] [CrossRef]
- Barnard, H.R.; Ryan, M.G. A test of the hydraulic limitation hypothesis in fast-growing Eucalyptus saligna. Plant Cell Environ. 2003, 26, 1235–1245. [Google Scholar] [CrossRef]
- Gao, J.G.; Zhao, P.; Shen, W.J.; Niu, J.F.; Zhu, L.W.; Ni, G.Y. Biophysical limits to responses of water flux to vapor pressure deficit in seven tree species with contrasting land use regimes. Agric. For. Meteorol. 2015, 200, 258–269. [Google Scholar] [CrossRef]
- Martinez-Vilalta, J.; Korakaki, E.; Vanderklein, D.; Mencuccini, M. Below-ground hydraulic conductance is a function of environmental conditions and tree size in Scots pine. Funct. Ecol. 2007, 21, 1072–1083. [Google Scholar] [CrossRef]
- Burgess, S.S.; Dawson, T.E. Using branch and basal trunk sap flow measurements to estimate whole-plant water capacitance: A caution. Plant Soil 2008, 305, 5–13. [Google Scholar] [CrossRef]
- Holtta, T.; Linkosalo, T.; Riikonen, A.; Sevanto, S.; Nikinmaa, E. An analysis of Granier sap flow method, its sensitivity to heat storage and a new approach to improve its time dynamics. Agric. For. Meteorol. 2015, 211, 2–12. [Google Scholar] [CrossRef]
- Fetcher, N.; Oberbauer, S.F.; Chazdon, R.L. Physiological ecology of trees, shrubs, and herbs at La Selva. In La Selva: Ecology and Natural History of a Neotropical Rainforest; McDade, L.A., Bawa, K.S., Hespenheide, H.A., Hartshorn, G.S., Eds.; University of Chicago Press: Chicago, IL, USA, 1994; pp. 128–141. [Google Scholar]
- Granier, A.; Huc, R.; Colin, F. Transpiration and Stomatal Conductance of Two Rain Forest Species Growing in Plantations (Simarouba amara and Goupia glabra) in French Guyana; Annales des Sciences Forestières; EDP Sciences: Les Ulis, France, 1992. [Google Scholar]
- O’Brien, J.J.; Oberbauer, S.F.; Clark, D.B. Whole tree xylem sap flow responses to multiple environmental variables in a wet tropical forest. Plant Cell Environ. 2004, 27, 551–567. [Google Scholar] [CrossRef]
- Tardieu, F.; Davies, W.J. Stomatal response to abscisic-acid is a function of current plant water status. Plant Physiol. 1992, 98, 540–545. [Google Scholar] [CrossRef]
- Eamus, D.; Shanahan, S.T. A rate equation model of stomatal responses to vapour pressure deficit and drought. BMC Ecol. 2002, 2, 8. [Google Scholar] [CrossRef]
- Hogg, E.H.; Hurdle, P.A. Sap flow in trembling aspen: Implications for stomatal responses to vapor pressure deficit. Tree Physiol. 1997, 17, 501–509. [Google Scholar] [CrossRef]
- Phillips, N.G.; Oren, R.; Licata, J.; Linder, S. Time series diagnosis of tree hydraulic characteristics. Tree Physiol. 2004, 24, 879–890. [Google Scholar] [CrossRef]
- Phillips, N.; Nagchaudhuri, A.; Oren, R.; Katul, G. Time constant for water transport in loblolly pine trees estimated from time series of evaporative demand and stem sapflow. Trees-Struct. Funct. 1997, 11, 412–419. [Google Scholar] [CrossRef]
- Daley, M.J.; Phillips, N.G. Interspecific variation in nighttime transpiration and stomatal conductance in a mixed New England deciduous forest. Tree Physiol. 2006, 26, 411–419. [Google Scholar] [CrossRef] [PubMed]
- Phillips, N.G.; Ryan, M.G.; Bond, B.J.; McDowell, N.G.; Hinckley, T.M.; Cermak, J. Reliance on stored water increases with tree size in three species in the Pacific Northwest. Tree Physiol. 2003, 23, 237–245. [Google Scholar] [CrossRef] [PubMed]
- Hölttä, T.; Cochard, H.; Nikinmaa, E.; Mencuccini, M. Capacitive effect of cavitation in xylem conduits: Results from a dynamic model. Plant Cell Environ. 2009, 32, 10–21. [Google Scholar] [CrossRef] [PubMed]
- Liu, P.; Zhang, J.C.; Zhuang, J.Y.; Gu, Z.Y.; Han, C.H.; Wu, Y.W. Factors of sap flow of Chinese fir sapling and its contribution to transpiration of Chinese fir forest bulletin of soil and water conservation. Bull. Soil Water Conserv. 2014, 34, 73–78. [Google Scholar]
- Nobel, P.S. Physicochemical and Environmental Plant Physiology; Academic Press: San Diego, CA, USA, 2005. [Google Scholar]
- Knapp, A.K.; Smith, W.K. Effect of water-stress on stomatal and photosynthetic responses in subalpine plants to cloud patterns. Am. J. Bot. 1988, 75, 851–858. [Google Scholar] [CrossRef]
- Niinemets, U.; Valladares, F. Tolerance to shade, drought, and waterlogging of temperate Northern Hemisphere trees and shrubs. Ecol. Monogr. 2006, 76, 521–547. [Google Scholar] [CrossRef]
- DFSC. Acacia mangium Willd; Danida Forest Seed Centre: Humlebaek, Denmark, 2000; 2p. [Google Scholar]
- Xu, X.Y.; Tong, L.; Li, F.S.; Kang, S.Z.; Qu, Y.P. Sap flow of irrigated Populus alba var. pyramidalis and its relationship with environmental factors and leaf area index in an arid region of Northwest China. J. For. Res. JPN 2011, 16, 144–152. [Google Scholar] [CrossRef]
- Pan, Z.G.; Feng, S.; Lin, H.S. Introduction, growth and use of Acacia mangium. Trop. For. 1996, 24, 144–152. [Google Scholar]
- Cienciala, E.; Kucera, J.; Malmer, A. Tree sap flow and stand transpiration of two Acacia mangium plantations in Sabah, Borneo. J. Hydrol. 2000, 236, 109–120. [Google Scholar] [CrossRef]
- Germon, A.; Guerrini, I.A.; Bordron, B.; Bouillet, J.P.; Nouvellon, Y.; de Moraes Goncalves, J.L.; Jourdan, C.; Paula, R.R.; Laclau, J.P. Consequences of mixing Acacia mangium and Eucalyptus grandis trees on soil exploration by fine-roots down to a depth of 17 m. Plant Soil 2018, 424, 203–220. [Google Scholar] [CrossRef]
- Liao, Y.C.; McCormack, M.L.; Fan, H.B.; Wang, H.M.; Wu, J.P.; Tu, J.; Liu, W.F.; Guo, D.L. Relation of fine root distribution to soil C in a Cunninghamia lanceolata plantation in subtropical China. Plant Soil 2014, 381, 225–234. [Google Scholar] [CrossRef]
- Zeng, T.X. Multi-purpose tree species-Schima wallichii Choisy. Guangdong For. Sci. Technol. 1988, 1, 7–10. [Google Scholar]
- Stone, E.L.; Kalisz, P.J. On the maximum extent of tree roots. For. Ecol. Manag. 1991, 46, 59–102. [Google Scholar] [CrossRef]
- Kunert, N.; Schwendenmann, L.; Hölscher, D. Seasonal Dynamics of Tree Sap Flux and Water Use in Nine Species in Panamanian Forest Plantations. Agric. For. Meteorol. 2010, 150, 411–419. [Google Scholar] [CrossRef]
- Ghimire, C.P.; Lubczynski, M.W.; Bruijnzeel, L.A.; Chavarro-Rincón, D. Transpiration and Canopy Conductance of Two Contrasting Forest Types in the Lesser Himalaya of Central Nepal. Agric. For. Meteorol. 2014, 197, 76–90. [Google Scholar] [CrossRef]
- Meinzer, F.C.; Bond, B.J.; Warren, J.M.; Woodruff, D.R. Does Water Transport Scale Universally With Tree Size? Funct. Ecol. 2005, 19, 558–565. [Google Scholar] [CrossRef]
- Zhou, C.M.; Gu, D.X.; Huang, Y.Q.; Zhao, P.; Huang, K.C.; He, W.; Zeng, D.J.; Sun, Y.J. Analyses on Water Consumption Characteristics of Eucalyptus Urophylla × E. Grandis, Cunninghamia Lanceolata and Cinnamomun Camphora. Eucalypt Sci. Technol. 2017, 34, 9–15. [Google Scholar]
- Zhang, X.; Zhang, H.L.; Wang, Y.J.; Wang, Y.Q.; Liu, C.X.; Yang, P.P.; Pan, S.L. Characteristics of Daily Sap Flow for Typical Species in Jinyun Mountain of Chongqing in Relation to Meteorological Factors. J. Beijing For. Univ. 2016, 38, 11–20. [Google Scholar]
- Ouyang, S.; Xiao, K.; Zhao, Z.; Xiang, W.; Xu, C.; Lei, P.; Deng, X.; Li, J. Stand Transpiration Estimates from Recalibrated Parameters for the Granier Equation in a Chinese Fir (Cunninghamia Lanceolata) Plantation in Southern China. Forests 2018, 9, 162. [Google Scholar] [CrossRef]
- Minghe, L.; Ritchie, G.A. Eight Hundred Years of Clonal Forestry in China: I. Traditional Afforestation With Chinese Fir (Cunninghamia Lanceolata (Lamb.) Hook.). New For. 1999, 18, 131–142. [Google Scholar] [CrossRef]
- Jøker, D. Acacia Mangium Willd. Seed Leafl. 2000, 3. [Google Scholar]
- McJannet, D.; Fitch, P.; Disher, M.; Wallace, J. Measurement of Transpiration Infour Tropical Rainforest Types of North Queensland. Aust. Hydrol. Processes. 2007, 21, 3549–3564. [Google Scholar] [CrossRef]
- Otieno, D.; Li, Y.; Ou, Y.; Cheng, J.; Liu, S.; Tang, X.; Zhang, Q.; Jung, E.-Y.; Zhang, D.; Tenhunen, J. Stand Characteristics and Water Use at Two Elevations in a Sub-Tropical Evergreen Forest in Southern China. Agric. For. Meteorol. 2014, 194, 155–166. [Google Scholar] [CrossRef]
- Horna, V.; Schuldt, B.; Brix, S.; Leuschner, C. Environment and Tree Size Controlling Stem Sap Flux in a Perhumid Tropical Forest of Central Sulawesi, Indonesia. Ann. For. Sci. 2011, 68, 1027–1038. [Google Scholar] [CrossRef]


| Site | Plot Size (m2) | Tree Density (No. ha−1) | Total Stand Basal Area (m2 ha−1) | Mean DBH ± Standard error (cm) | Mean Height ± Standard error (m) |
|---|---|---|---|---|---|
| A. mangium | 1600 | 519 | 26.2 | 23.5 ± 1.1 | 14.5 ± 0.5 |
| S. wallichii | 900 | 867 | 31.0 | 20.2 ± 0.8 | 12.2 ± 0.5 |
| C. lanceolata | 800 | 725 | 11.1 | 11.8 ± 1.0 | 9.5 ± 0.6 |
| Site | Soil Bulk Density (g·cm−3) | Maximum Water-Holding Capacity (g·kg−1) | Field Capacity (%) | Non-Capillary Porosity (%) | Capillary Porosity (%) | Total Porosity (%) |
|---|---|---|---|---|---|---|
| A. mangium | 1.3 ± 0.04 | 327.0 ± 17.2 | 25.6 ± 0.9 | 8.6 ± 1.1 | 33.9 ± 1.0 | 42.5 ± 0.8 |
| S. wallichii | 1.4 ± 0.04 | 296.3 ± 17.3 | 24.4 ± 1.2 | 7.0 ± 0.6 | 33.5 ± 0.8 | 40.5 ± 1.0 |
| C. lanceolata | 1.4 ± 0.04 | 290.8 ± 14.6 | 23.4 ± 0.7 | 7.6 ± 1.2 | 32.5 ± 0.7 | 40.1 ± 0.8 |
| Species | A. mangium | S. wallichii | C. lanceolata | ||||||
|---|---|---|---|---|---|---|---|---|---|
| Tree No. | DBH (cm) | Height (m) | Mean Daily Jsmax (g m−2 s−1) | DBH (cm) | Height (m) | Mean Daily Jsmax (g m−2 s−1) | DBH (cm) | Height (m) | Mean Daily Jsmax (g m−2 s−1) |
| 1 | 27.6 | 16.3 | 34.4 ± 1.0 | 22.9 | 14 | 18.7 ± 0.7 | 17.5 | 13.5 | 3.8 ± 0.1 |
| 2 | 16 | 14.9 | 14.2 ± 1.1 | 23.3 | 13 | 18.7 ± 0.7 | 24.2 | 13.8 | 18.2 ± 0.6 |
| 3 | 40.3 | 17.8 | 56.7 ± 1.2 | 20.1 | 13 | 25.2 ± 1.3 | 22 | 13.5 | 5.7 ± 0.2 |
| 4 | 23.6 | 17.5 | 8.8 ± 0.4 | 16.4 | 10.6 | 19.2 ± 0.7 | 19 | 13 | 5.3 ± 0.2 |
| 5 | 27.3 | 17 | 24.4 ± 1.1 | 19 | 12.3 | 19.1 ± 0.7 | 14.3 | 11 | 6.2 ± 0.2 |
| 6 | 17.4 | 15.6 | 17.2 ± 0.6 | 30.3 | 15.5 | 38.5 ± 1.4 | 18.6 | 13.13 | 8.2 ± 0.3 |
| 7 | 33.9 | 17 | 39.2 ± 1.1 | 13.1 | 11 | 13.7 ± 0.7 | 18.1 | 13 | 12.4 ± 0.4 |
| 8 | 19.8 | 11 | 30.8 ± 0.8 | 16.6 | 12 | 10.7 ± 0.5 | 10.5 | 10.6 | 3.0 ± 0.1 |
| 9 | 29.2 | 17 | 54.9 ± 1.3 | 16.1 | 11 | 24.2 ± 0.9 | 21.2 | 11.5 | 7.9 ± 0.3 |
| 10 | 32.1 | 16.2 | 28.2 ± 1.4 | 19.3 | 14 | 32.4 ± 1.0 | 16.5 | 10.5 | 6.4 ± 0.2 |
| 11 | 40 | 17.5 | 43.6 ± 1.5 | 18.4 | 11.5 | 13.8 ± 0.5 | 22 | 13 | 4.0 ± 0.1 |
| 12 | 28.6 | 16.5 | 16.3 ± 0.9 | 21.1 | 13 | 26.4 ± 1.0 | 11.2 | 10.5 | 13.5 ± 1.2 |
| 13 | 34.8 | 15 | 38.1 ± 1.1 | 32.2 | 17 | 29.4 ± 0.9 | 18.3 | 11.1 | 9.1 ± 0.3 |
| 14 | 27.5 | 11 | 10.2 ± 0.6 | 18.2 | 12.5 | 29.3 ± 1.0 | 13.7 | 11.5 | 3.4 ± 0.1 |
| 15 | 30.5 | 15.2 | 24.0 ± 1.1 | 17.4 | 12.3 | 21.2 ± 1.0 | 19 | 13 | 9.5 ± 0.4 |
| Effect | A. mangium | S. wallichii | C. lanceolata | |||
|---|---|---|---|---|---|---|
| Season | Wet | Dry | Wet | Dry | Wet | Dry |
| In (Js) = In (α) + β1 × In (PAR) + β2 × In (VPD)+ β3 × In (SWC) | ||||||
| In (α) | −0.40A | −1.91 *a | 0.27A | −4.00 *b | −1.46 *A | −4.31 *b |
| T-value | −0.81 | −5.28 | 0.40 | −10.15 | −3.31 | −12.17 |
| β1 | 0.24 *A | 0.70 *a | 0.32 *A | 1.25 *b | 0.38 *A | 1.00 *c |
| T-value | 6.30 | 14.74 | 6.93 | 25.82 | 10.40 | 21.20 |
| β2 | 0.19 *A | 0.27 *a | 0.33 *B | 0.07 *b | 0.39 *B | −0.01 b |
| T-value | 8.29 | 8.82 | 11.00 | 2.10 | 17.86 | −0.37 |
| β3 | −0.83 *A | −0.32 *a | −0.05A | 0.78 *b | −0.32A | 0.35 *b |
| T-value | −3.12 | −3.71 | −0.11 | 5.68 | −1.31 | 3.87 |
| Effect | A. mangium | S. wallichii | C. lanceolata | |||
|---|---|---|---|---|---|---|
| Season | Wet | Dry | Wet | Dry | Wet | Dry |
| In (Js) = In (α) + β1 × In (PAR) + β2 × In (VPD) | ||||||
| In (α) | −0.27A | −0.06 a | -0.28A | −1.26 *b | −0.75 *A | −1.20 *b |
| T-value | −0.89 | −5.28 | 0.40 | −10.93 | −4.46 | −7.67 |
| β1 | 0.33 *A | 0.37 *a | 0.38 *B | 0.49 *b | 0.26 *C | 0.29 *c |
| T-value | 47.20 | 58.08 | 38.86 | 57.51 | 35.11 | 39.24 |
| β2 | 0.18 *A | 0.40 *a | 0.42 *B | 0.73 *b | 0.53 *C | 0.54 *c |
| T-value | 20.08 | 37.74 | 40.02 | 60.11 | 55.78 | 43.13 |
| Effect | A. mangium | S. wallichii | C. lanceolata | ||||||
|---|---|---|---|---|---|---|---|---|---|
| Level | SWC1 | SWC2 | SWC3 | SWC1 | SWC2 | SWC3 | SWC1 | SWC2 | SWC3 |
| In (Js) = In (α) + β1 × In (PAR) + β2 × In (VPD) + β3 × In (SWC) | |||||||||
| In (α) | −1.81 * | −1.32 * | −1.72 * | −1.43 * | −0.74 | −1.74 * | −3.04 * | −3.33 * | −2.99 * |
| β1 | 0.55 * | 0.51 * | 0.52 * | 0.70 * | 0.65 * | 0.74 * | 0.73 * | 0.76 * | 0.74 * |
| β2 | 0.26 * | 0.29 * | 0.29 * | 0.32 * | 0.34 * | 0.29 * | 0.26 * | 0.24 * | 0.25 * |
| β3 | −0.67 * | −0.55 * | −0.71 * | 0.48 * | 0.85 * | 0.44 | 0.18 * | 0.11 | 0.28 |
| Species Effect | Wet Season | Dry Season | ||
|---|---|---|---|---|
| R | p | R | p | |
| A. mangium | 0.04 | 0.08 | 0.13 | <0.0001 |
| S. wallichii | −0.01 | 0.654 | 0.08 | 0.01 |
| C. lanceolata | 0.07 | 0.01 | 0.09 | <0.0001 |
© 2020 by the authors. Licensee MDPI, Basel, Switzerland. This article is an open access article distributed under the terms and conditions of the Creative Commons Attribution (CC BY) license (http://creativecommons.org/licenses/by/4.0/).
Share and Cite
Wang, Q.; Lintunen, A.; Zhao, P.; Shen, W.; Salmon, Y.; Chen, X.; Ouyang, L.; Zhu, L.; Ni, G.; Sun, D.; et al. Assessing Environmental Control of Sap Flux of Three Tree Species Plantations in Degraded Hilly Lands in South China. Forests 2020, 11, 206. https://doi.org/10.3390/f11020206
Wang Q, Lintunen A, Zhao P, Shen W, Salmon Y, Chen X, Ouyang L, Zhu L, Ni G, Sun D, et al. Assessing Environmental Control of Sap Flux of Three Tree Species Plantations in Degraded Hilly Lands in South China. Forests. 2020; 11(2):206. https://doi.org/10.3390/f11020206
Chicago/Turabian StyleWang, Qian, Anna Lintunen, Ping Zhao, Weijun Shen, Yann Salmon, Xia Chen, Lei Ouyang, Liwei Zhu, Guangyan Ni, Dan Sun, and et al. 2020. "Assessing Environmental Control of Sap Flux of Three Tree Species Plantations in Degraded Hilly Lands in South China" Forests 11, no. 2: 206. https://doi.org/10.3390/f11020206
APA StyleWang, Q., Lintunen, A., Zhao, P., Shen, W., Salmon, Y., Chen, X., Ouyang, L., Zhu, L., Ni, G., Sun, D., Rao, X., & Hölttä, T. (2020). Assessing Environmental Control of Sap Flux of Three Tree Species Plantations in Degraded Hilly Lands in South China. Forests, 11(2), 206. https://doi.org/10.3390/f11020206