Article

Sustainable Timber Trade: A Study on Discrepancies in Chinese Logs and Lumber Trade Statistics

1
School of Economics and Management, Beijing Forestry University, Beijing 100083, China
2
Center for International Trade in Forest Products (CINTRAFOR), School of Environmental and Forest Sciences, University of Washington, Seattle, WA 98195, USA
*
Author to whom correspondence should be addressed.
Forests 2020, 11(2), 205; https://doi.org/10.3390/f11020205
Submission received: 20 January 2020 / Revised: 4 February 2020 / Accepted: 8 February 2020 / Published: 12 February 2020
(This article belongs to the Section Forest Economics, Policy, and Social Science)

Abstract

:
Discrepancies in trade statistics can be normal or benign and attributed to a wide variety of unintentional factors, or in some instances within the timber products sector, such discrepancies can be associated with “systemic” factors that distort trade statistics, including (i) measurement and shipment issues, (ii) misreporting of product volumes, (iii) misclassification of timber product types, and (iv) government regulations concerned about trade. This study measured trade discrepancies in logs and lumber trade statistics for China and its trading partner countries from 2002 to 2018 using a time-lagged function, based on the customs data available from Global Trade Information Services (GTIS), with the aim of exploring a more nuanced understanding of trade discrepancies and their “systemic” factors. The results showed that the range of overall discrepancies in logs and lumber trade statistics shrunk over time, from [−0.069, 1.207] in 2002–2007 to [−0.120, 0.408] in 2013–2018. The larger trade flows of logs and lumber from Russia, New Zealand, and the U.S. (each above 10% of total China’s import) showed small trade statistics discrepancy ratios, which were less than ± 0.06. However, trade discrepancies still remained large at the disaggregated level, and significant differences of trade discrepancies between tropical and non-tropical countries. The range of trade discrepancies in hardwood logs increased from 2002 to 2018 and appeared to be attributed to misclassification and misreporting in tropical countries such as Indonesia, the Philippines, Thailand, and Ghana. However, these countries’ trade flows are becoming relatively minor over time. Government policies are suggested to play an important role in influencing both the occurrence and resolution of trade discrepancies.

1. Introduction

Trade discrepancies refer to a significant difference between the recorded data of the importing country compared with the data reported by the exporting country for a specific product within a defined time frame. According to data from the Global Trade Information Services (GTIS), the total global trade volume of logs and lumber hit an all-time high in 2018 of 992.92 million m3, a growth of 13.69% since 2017 [1]. In terms of imports, logs and lumber amounted to 476.34 million m3 by volume in 2018, but exports amounted to 516.58 million m3, with a gap of 40.24 million m3. The data indicate a large trade-discrepancy remains, and this is not unique to 2018. Every year there are large discrepancies in timber trade statistics.
Timber products, especially logs and lumber, are basic raw materials for people’s living and livelihoods. Trade discrepancies in timber trade statistics have attracted special attention as they have the potential to lead to poor policy decisions relating to forestry management and forest products manufacture and trade, a misunderstanding of what is happening in a country’s forestry sector, a loss of income for the forestry industry, and even a degradation of forest resources [2]. Some factors associated with trade discrepancies, like shipment time-lag, scaling methods, scaling units, unit conversion, etc., are discoverable and fairly consistent (see Table 1).
Likewise, national data collection and classification systems reflect trade discrepancies but can be adjusted. In general, trade statistics and information are sourced directly from domestic agencies, or they can be obtained from organizations that compile and disseminate global trade data. The Food and Agriculture Organization of the United Nations (FAO) employs the Standard International Trade Classification (STIC) system as their statistical classification criteria for timber, which reclassifies products after collecting data from national governments, customs, and other organizations [3]. Large trade discrepancies can appear when comparing data from FAO and others using STIC with sources that use the Harmonization System Code (HS code). These are recognizable causes of trade discrepancies that, along with shipment timing issues, statistical errors, and compliance issues related to various government regulations, are considered unintentional causes of discrepancies that can be understood and mitigated but are difficult to be avoided.
On the other hand, misreporting, misclassification and smuggling have become significant concerns relating to timber products [4,5]. Laws and regulations regarding the legality of timber, export taxes, and export bans have been implemented in many countries. Protected timber species are listed by CITES to combat harvesting and trade associated with illegal timber, protect forest resources and preserve ecological environments [6,7]. These rules and protections lead some exporters to deliberately under-reported or not report their export quantities of timber, sometimes reporting timber products that have a high value or high tariff as timber with a low value or low tariff or common products to evade high export/import duties or to avoid restrictive export policies. Illegal smuggling may be one explanation for misreporting and misclassification to obtain greater economic benefits and avoid restrictions [8]. However, when goods are truly smuggled, bypassing legal checkpoints, there is seldom documentation and statistics. Vincent [9] tried to use econometric methods to reveal illegal trade activities in the Romanian forest sector by a potential indicator of trade discrepancies, but the results appeared impractical. Illegal smuggling is difficult to detect in official statistics [10], and will not be considered as a factor nor discussed in this paper. These factors may be considered when significant trade discrepancies and trade flow cannot be explained by the factors identified previously.
The varying degrees of trade discrepancies and their factors which might be attributed to the benign cause have attracted considerable attention in recent years. Particularly, in 2009 and 2012, reports published by Chinese and American commercial departments indicated that trade discrepancies have existed in China and U.S. trade statistics that were largely affected by factors associated with shipment issues (e.g., transshipment through Hong Kong) [22,23]. Supplying countries might ship via Hong Kong but record exports that are ultimately destined for the mainland as exports to Hong Kong, according to the principle of destination and origin recording rules [21,24,25]. By adjusting the factors of re-exports and their price, adjusting free alongside ship (FAS) or cost, insurance, and freight (CIF) basis to free on board (FOB) basis, trade discrepancies in goods (and services) trade statistics in China and European countries have shrunk by 80% of the total but still remain, accounting for $20.6 billion in gross terms [26]. Trade discrepancies have also been examined by “mirror data” on China and its major partners from 2003 to 2014. There was evidence that the misreporting of exports to Hong Kong had caused increased volatility in Chinese export data since 2012 [27]. Benita et al. found that trade discrepancies were large in China–Latin American countries during 2009–2014, which might be due to poor statistical systems in Latin America, as well as to capital flight [28]. The case of Vietnam also applied a variety of mirror statistics in 2010–2016 and indicated that the quantities of timber imports recorded by China were often higher than the reported quantities Vietnam exports, except for lumber [29]. International trade of hardwood products in the 1980s has been examined to determine whether discrepancies exist [14]. The results highlighted that problems associated with the collection and processing of individual export transaction records had a significant impact on trade discrepancies.
In another China case, trade-discrepancy estimation was conducted using an asymmetric measurement [30]. With the adjustment of Hong Kong transshipment and re-export, a new and growing discrepancy emerged which amounted to $46 billion in 2005. The author then used asymmetric ratios of import data and corresponding export data to identify trade discrepancies and the results showed strong statistical evidence of under-reporting exports at the Chinese border to avoid paying value-added tax (estimated at $6.5 billion) during 2002–2008 [31]. Eastin et al. measured discrepancies within the forest products sector in the data on the U.S. and its partners in 2001 using an asymmetric equation [13]. The results were calculated based on the import values and showed that the discrepancy ratio became smaller as the degree of processing increased. Another study particularly focused on the input-output model to discuss trade discrepancies [17]. However, the input-output tables (I-O tables) have several assumptions in the preparation process, for example, assuming that an exporting individual and a non-exporting individual behave similarly in the industrial sector and a fixed industry structure is applied, which is inconsistent with the data of various countries. These studies did not consider the discrepancies that may result from transportation and the resulting lag between report of the export and recording of the import. The study used import and export recording dates from the U.S.. and China to calculate the time lag, which indicated that the U.S. (eastbound) imports were reduced by $3.05 billion in 2010 [23]. Substantial and detailed custom documents were difficult to investigate and access. Therefore, this study will develop a formula to calculate trade discrepancies considering the shipment time-lag and explore the influencing factors associated with trade discrepancies.
The effectiveness of any analysis and the resulting conclusions depends, of course, on the accuracy of the data utilized. Trade discrepancies can lead to policy errors, misdirection in the industry, a misunderstanding of trade imbalances, and even potentially a trade war [16,32,33]. Within the global timber supply chain, China is a key supply chain node within the remanufacturing and redistribution hub and is ranked as the top destination for logs and lumber imports [1]. Therefore, this study will take China logs and lumber as a case study to explore a more nuanced understanding of the discrepancies in timber trade statistics and the factors contributing to these trade discrepancies in order to establish policies or reforms that help reduce trade discrepancies and allow timber trade to remain sustainable.

1.1. Background

1.1.1. Trade Flow

China is the largest importer of logs and lumber in the world, which accounted for $20 billion (34.9% of total global imports) by value and 109 million m3 (22.9%) by volume in 2018 [1]. China has become a wood product remanufacturing and redistribution center due to the combination of scarce domestic forest resources, low-cost manufacturing, and surging foreign demand [
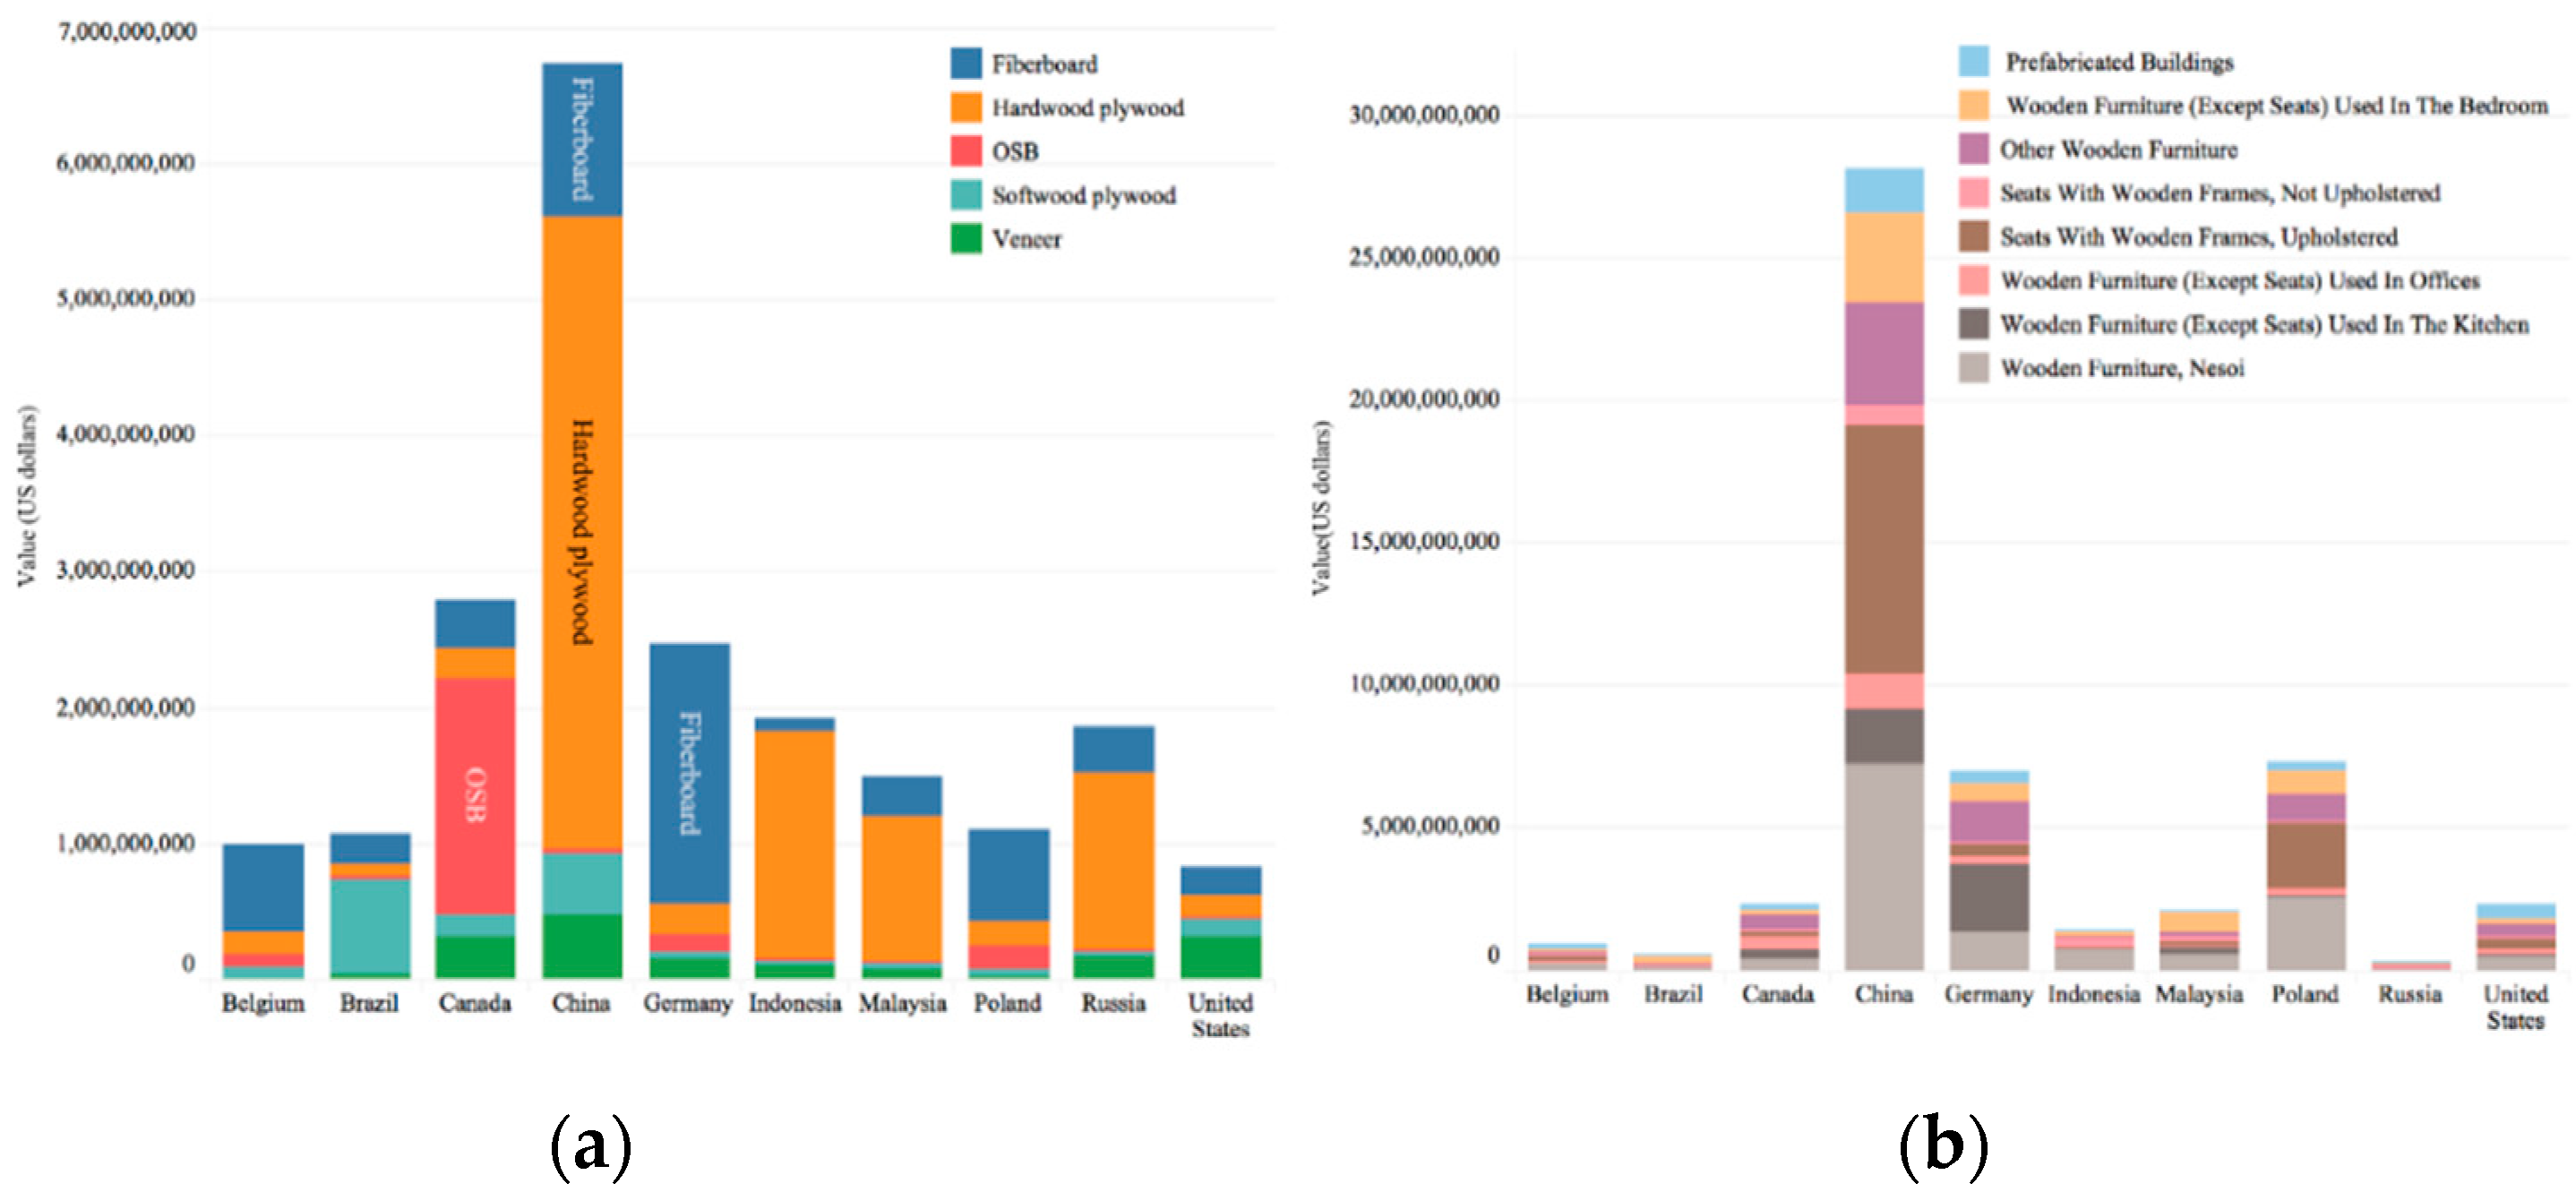
34]. China then consumes much of this wood domestically but also exports a large amount of wood furniture and plywood throughout the world, particularly to the European Union countries and the United States [1]. China now is playing a leadership role in the export of wood furniture and wooden panels in the world, amounting to $ 35 billion in 2018 (see Figure 1).
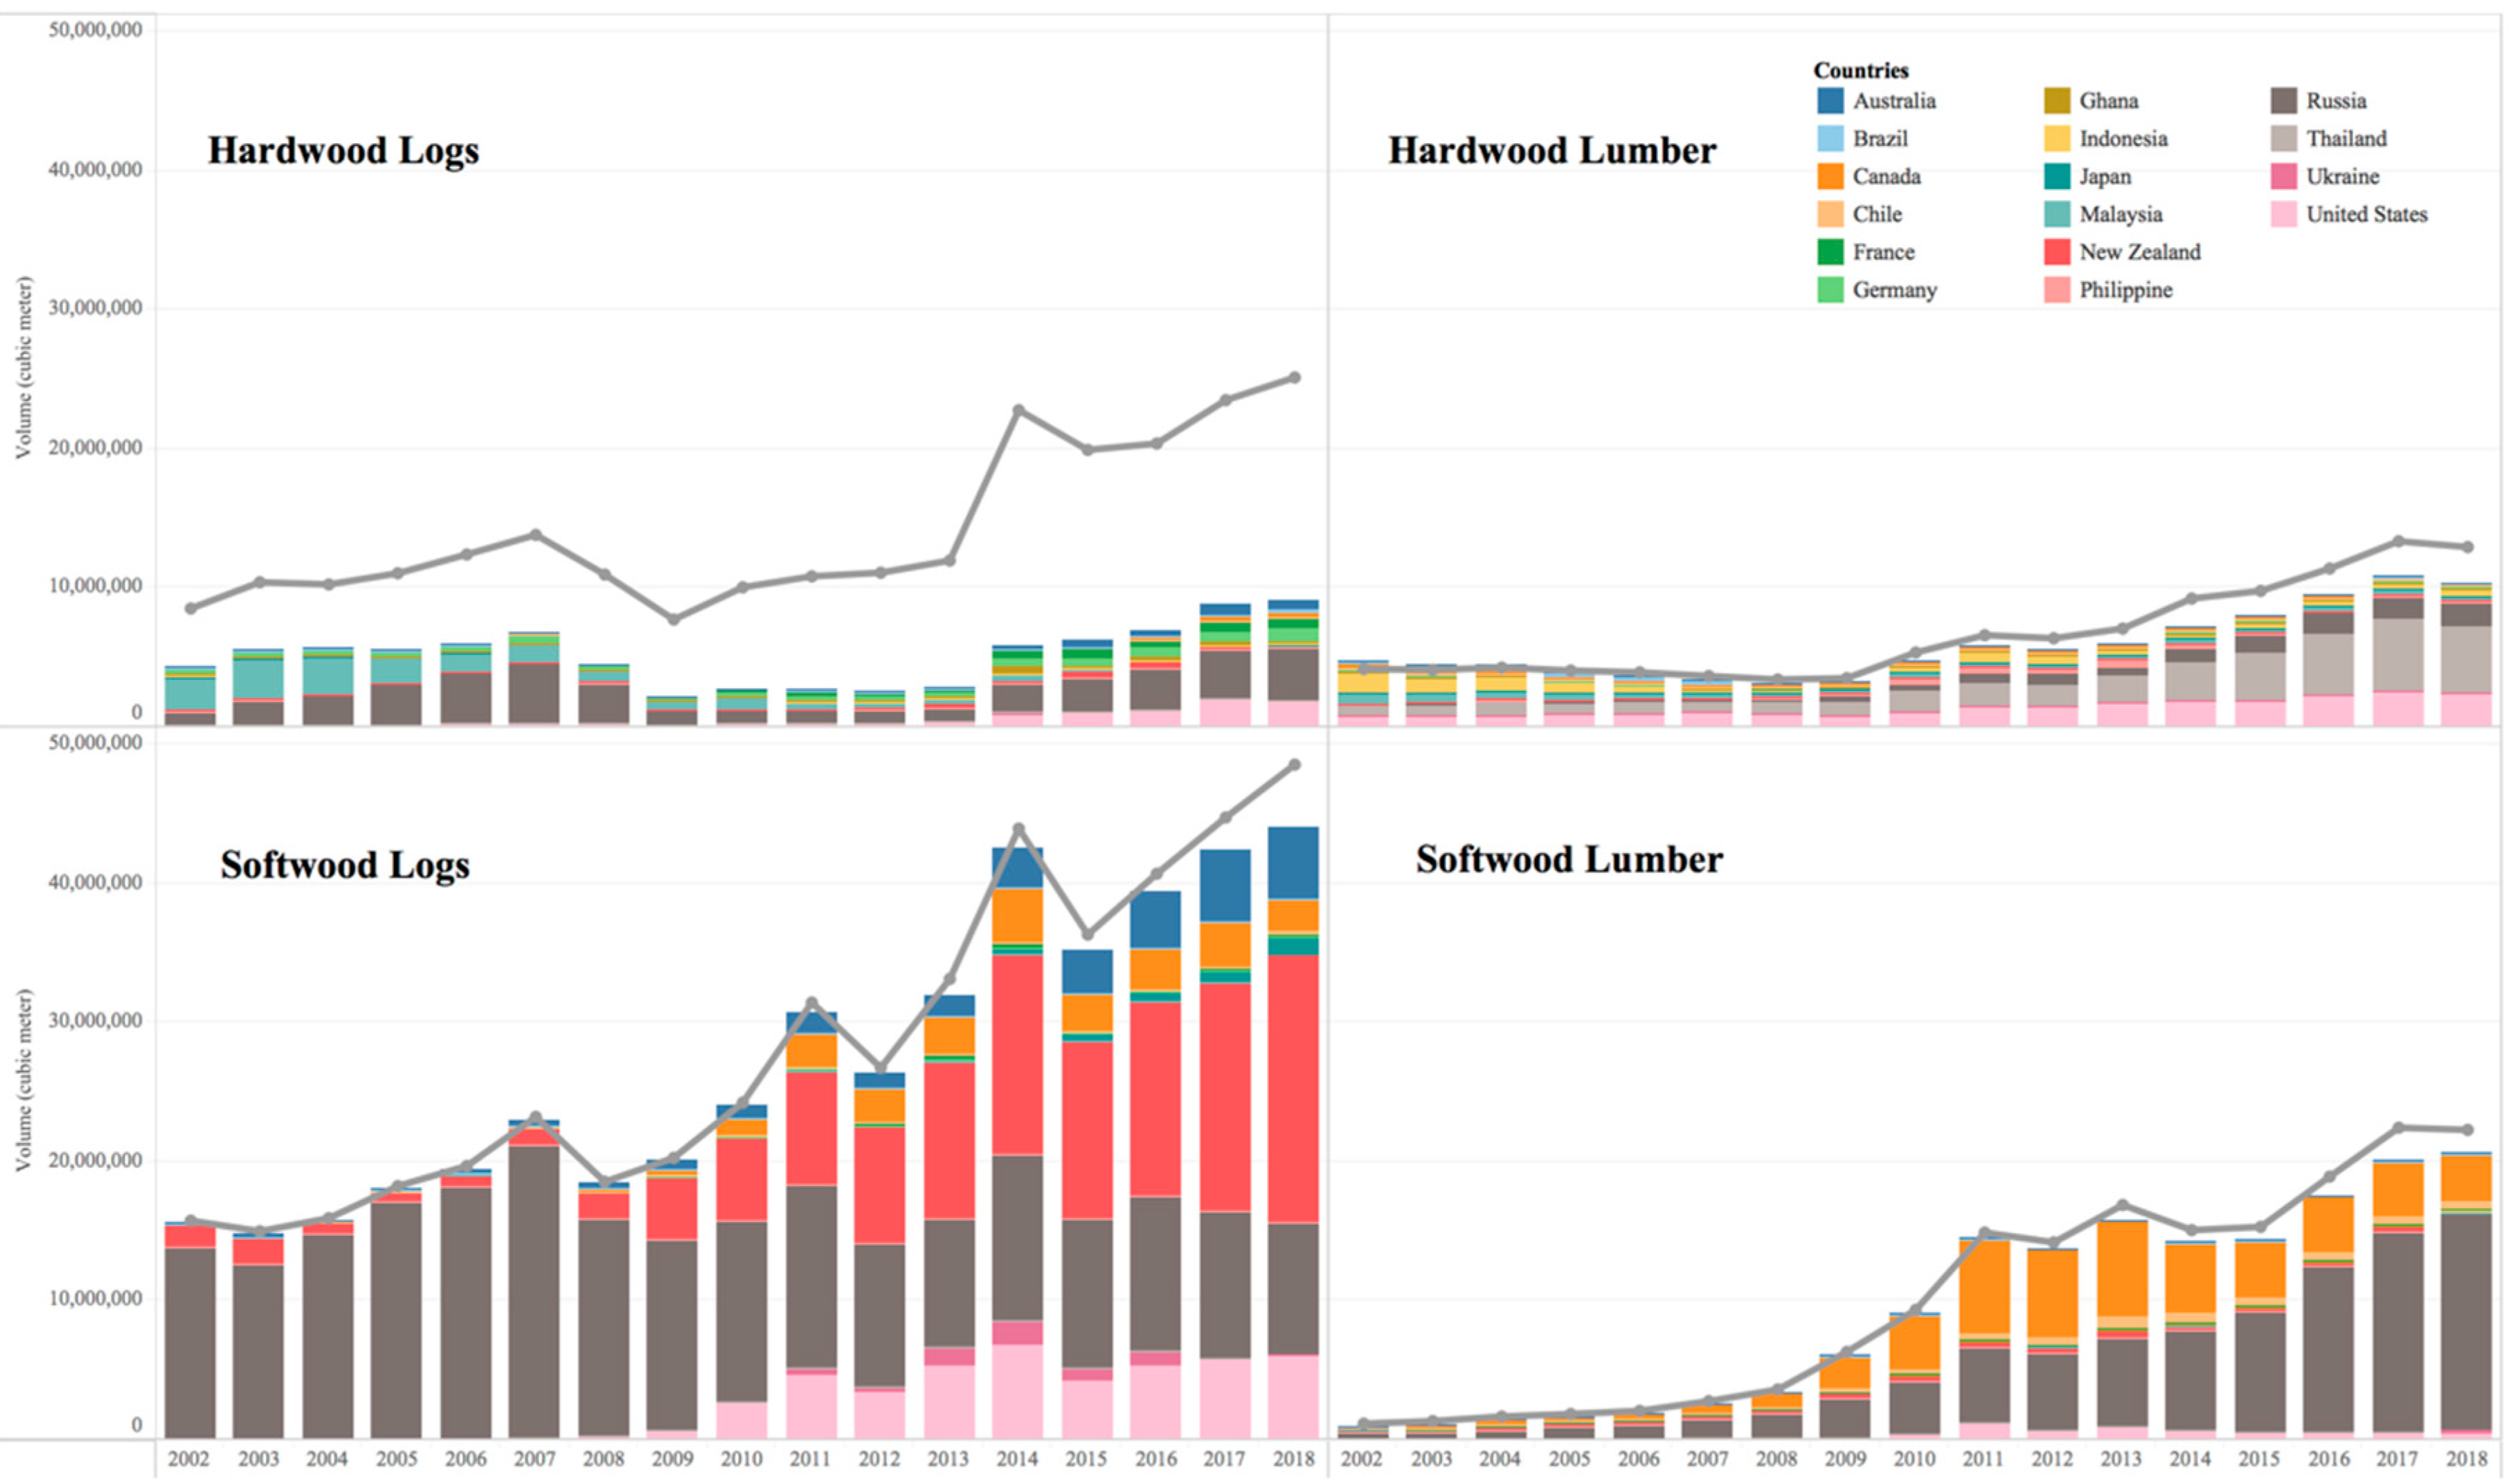
More than 150 countries export logs and lumber to China. New Zealand (39.6% of total imports), Russia (19.6%), and the United States (12.5%) are the three largest softwood log suppliers in 2018, and Russia (48.3% of total imports), Thailand(13.5%), Canada (9.6%) and the United States (7.8%) are largest lumber suppliers in 2018 (see Figure 2). Other countries, such as France, Germany, Brazil, Indonesia, Malaysia, Philippines, Chile, Finland, Sweden, Ukraine, Ghana, and Japan, are also major exporters to China, but with a smaller proportion. China also imports logs from some developing and tropical countries that have led to China being considered as a key consumer of illegally-sourced timber [35]. Some log exporters in these countries do not pay required royalties to the exporting nations nor do they exercise proper environmental control over harvest operations [36]. Looking specifically at China’s supply of tropical hardwood logs, African countries, the Solomon Islands and Papua New Guinea account for around 30% of China’s imports. While we would like to include these countries in this study, they do not report their exports to GTIS and we, therefore, cannot calculate a trade discrepancy within the data we have available.

1.1.2. Government Policies for Forest Harvesting and Timber Trade

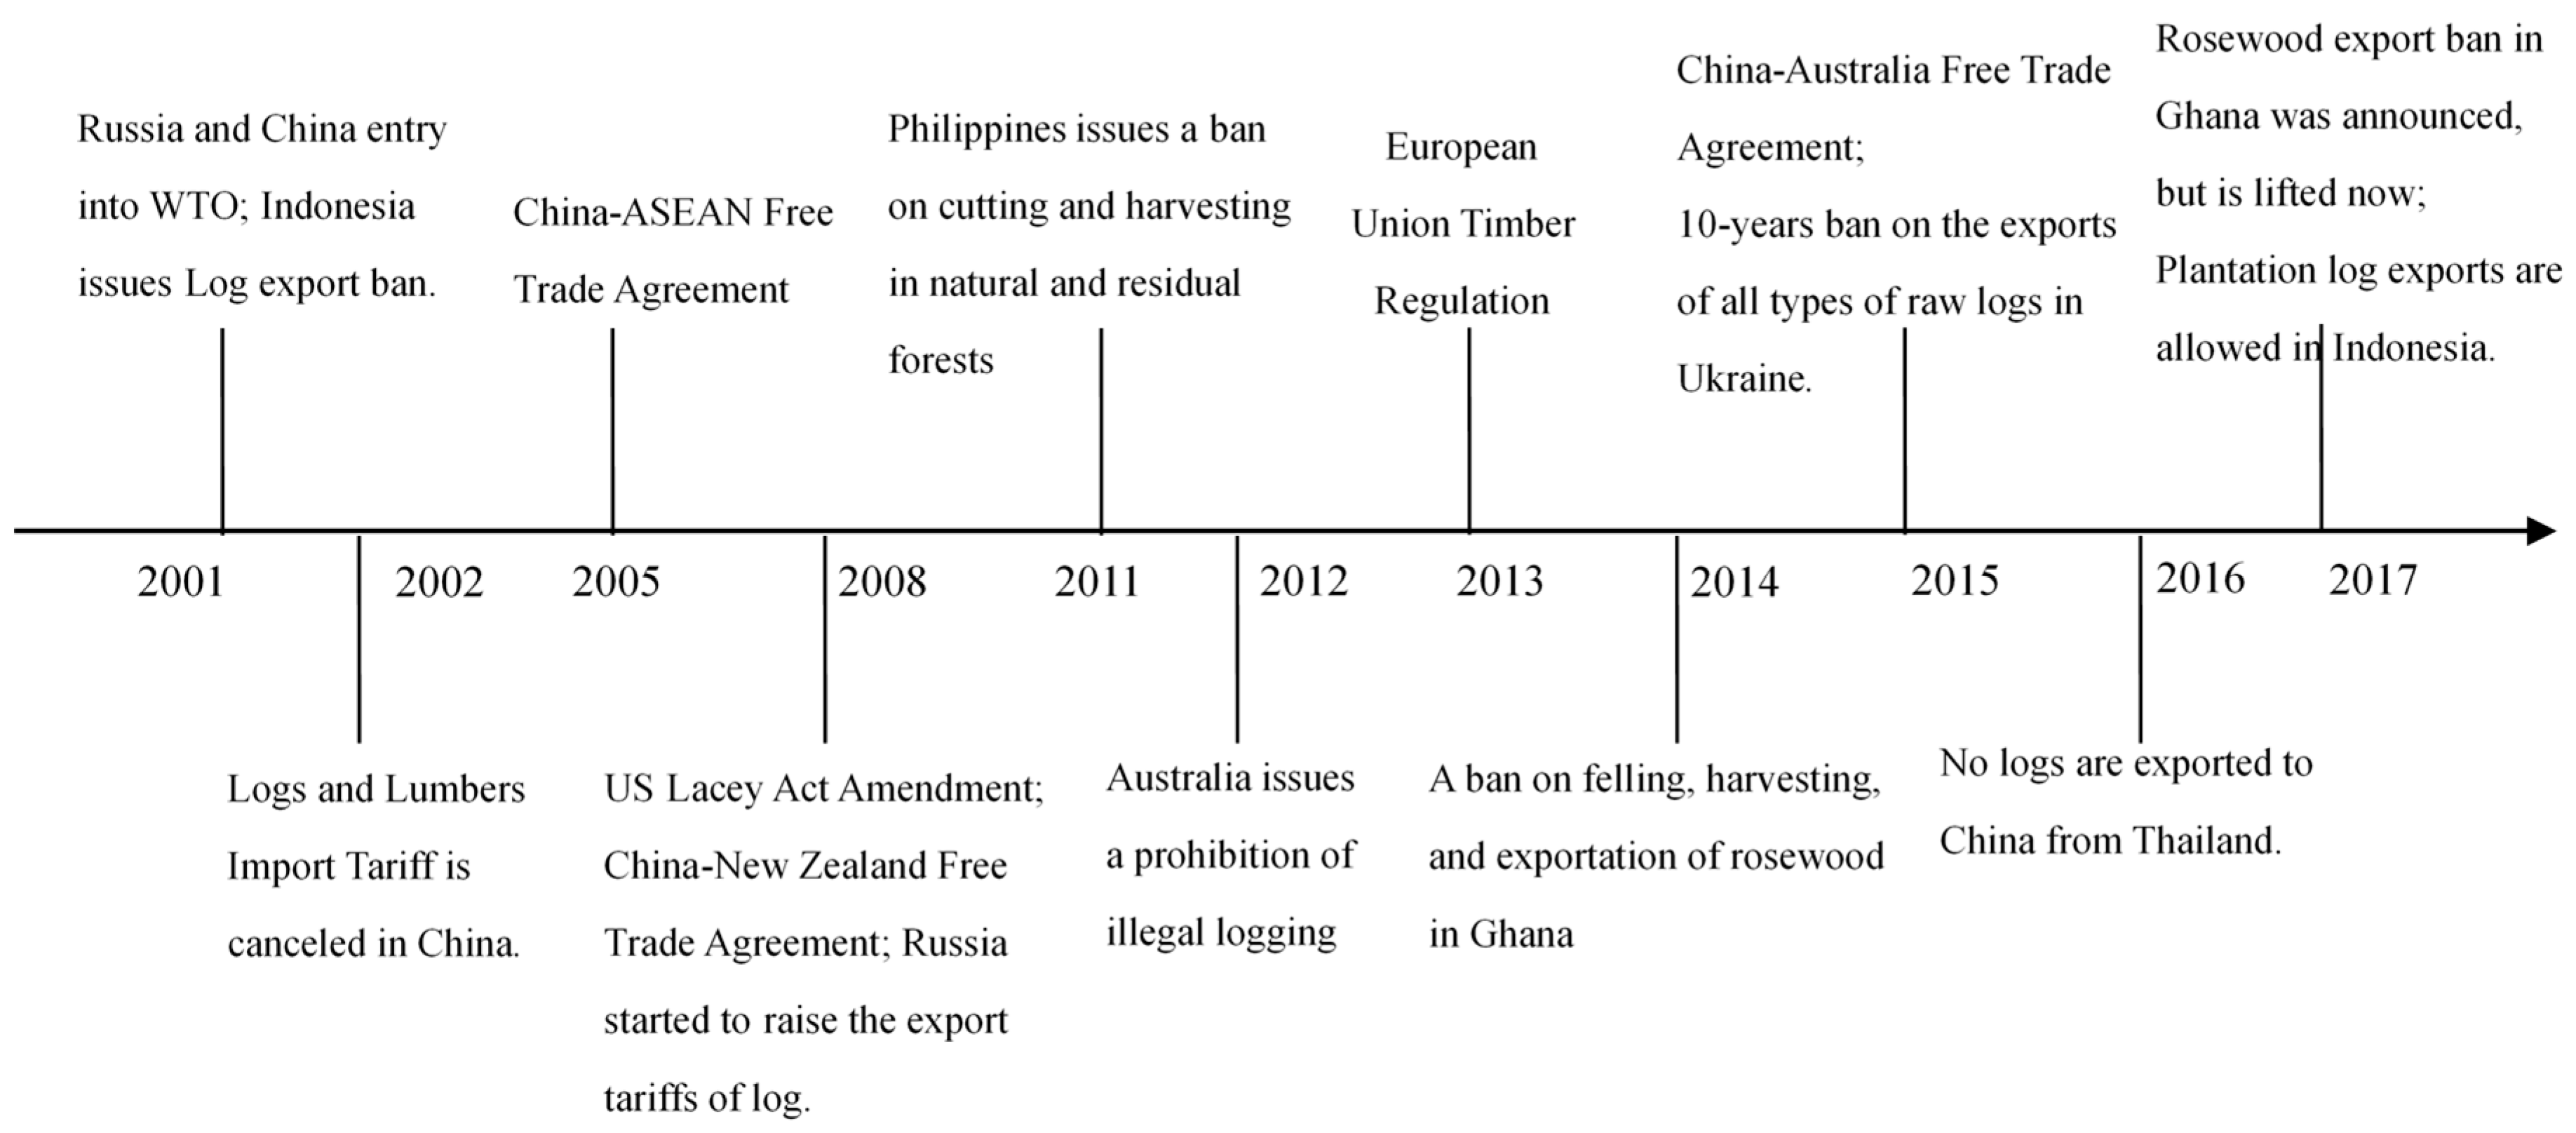
Figure 3 shows a timeline of the major government policies for forest harvesting and timber trade in China and its partner countries. Regarding trade policies for timber products, China has maintained an open market and low tariffs in bilateral trade since joining the WTO in 2001, which has provided more benefits and opportunities for countries to export to China. Zero import tariffs on logs and lower value-added tax and customs duty on logs and lumber (7% on logs and 13% on lumber), combined with relatively low wages and high productivity, have created a competitive advantage for China in world forest products markets and trade [34,37]. Concurrently, China has signed bilateral free trade agreements with many forest products partner countries, which has led to the growth and expansion of China’s import and export trade and has developed mutually beneficial markets with these countries (see Figure 3). Recently, a ban on the commercial harvesting of natural forests was enacted in 2017, which has limited China’s domestic timber supply [38]. Importing more logs and lumber has enabled China to meet a rapidly growing international and domestic manufacturing and construction demand.
Many supplying countries have enacted protective trade policies and are advocates of combating illegal timber harvesting and trade. Since the G8 organization proposed the Forest Action Project in 1998, the United States, EU, and several other countries have introduced rules, laws, and regulations to combat illegal logging and timber trade. In 2008, the United States introduced an amendment to the Lacey Act, requiring that forest products, such as wood and furniture imported into the United States have proof of legal sourcing [39]. In the same year, Russia added quotas and an export tax to restrict log exports, reduce the loss of forest resources, and increase domestic processing, job creation, and revenue for the domestic forestry industry [40]. Since that time, there has been a dramatic change in Russia’s wood exports to China, with log exports declining substantially and lumber exports increasing rapidly (see Figure 2).
In 2009, the European Union adopted the Forest Law Enforcement, Governance and Trade (FLEGT) plan to reduce illegal and unsustainable logging in supplying countries [41]. Subsequently, they enacted the EU Timber Regulation and implemented Voluntary Partnership Agreements (VPAs) to achieve the goals of FLEGT. About 90% of the imported timber products in the EU market were covered by the EUTR in 2013 [42]. Supplier countries with abundant forest resources, such as Indonesia, Malaysia, Philippines, Ghana, Thailand, and Ukraine, have successively proposed bans on log exports, limiting the loss and harvesting of precious species of wood and protecting the ecological environment [43]. In addition, these countries implemented export or logging bans to create job opportunities and improve their forestry industry [41].
The Chinese government has been taking actions to combat illegal timber trade, including the promulgation of the 2010 Public Timber Harvesting and Purchase policy and the promotion of forest certification [34]. Many NGO organizations have taken steps to encourage companies to remove illegal or unsustainable timber from their supply chains. Supplying and trading corporations, both public and private, now use voluntary certification systems, such as FSC and PEFC, to identify their sustainable and legal products [36]. All the work has had a positive effect on the sustainable trade of wood products [44]. The proportion of illegally sourced timber has decreased and the proportion of certified wood products is increasing [34].

1.2. Objectives

The results of existing studies may be less applicable in the recent timber markets considering the substantial changes in trade flow and trade policies, particularly after China joined in WTO in 2001. For example, as Russia raised log export tariffs in 2008, the import volume of softwood logs from Russia to China declined from 21.1 million m3 in 2007 to 9.5 million m3 in 2018 [1]. China also switched to importing softwood logs from sustainably managed plantations in New Zealand, reaching 19.2 million m3 and 39.2% of the total imports in 2018. Factors relating to trade discrepancies need to be further explored and updated. This study seeks to measure the discrepancies in timber trade statistics using a time-lagged function, and specifically considers China and its partners’ logs and lumber trade data from 2002 to 2018 as a case study based on customs data available in GTIS. The study hopes to fill a gap in the literature by attempting to isolate both the unintentional and intentional factors behind identified discrepancies and provide an account of the reasonable explanations and incentives for trade discrepancies. By doing so, this study hopes to add to our collective ability to effectively interpret, control and reduce discrepancies in the timber trade, and improve the accuracy and reliability of trade data. Accordingly, the three objectives of this study are:
  • To develop the time-lagged function in order to estimate timber trade discrepancies, after adjusting the measurement and transshipment factors;
  • to summarize the characteristics and trends of discrepancies in log and lumber trade statistics and analyze the possible factors contributing to large discrepancies;
    (a)
    to describe the historical variation of trade discrepancies;
    (b)
    to summarize and analyze the characteristics and changes of trade discrepancies by country;
    (c)
    to compare trade discrepancies of different classifications and regions using statistical tests; and
  • to discuss the possible factors that may impact the occurrence and scale of trade discrepancies, like international trade policies and regulations.

2. Materials and Methods

The data in this study were sourced from the Global Trade Atlas, a trade database developed and maintained by Global Trade Information Services, Inc. (GTIS). GTIS purchases, collects and publishes trade data from over 80 countries and regions, going as far back as 1990. GTIS data were gathered from the official customs or national statistics agency of each reporting country responsible for tracking and managing trade. The system provides information on the value, quantity, and unit price and was classified using the Harmonized System. While some countries do not share trade data in the GTIS, such as Papua New Guinea, Solomon Islands, Vietnam, and much of Africa, in terms of volume and value, GTIS captures most of the world’s trade flows across all industries and products, compared to other data sources.
China was one of the reporting countries that provided both volume and value data to GTIS by the China Custom. However, some of China’s partner countries were not GTIS reporting countries. Given the data availability and quality, 14 hardwood log trade partners, 10 softwood log trade partners, 13 hardwood lumber partners, and 10 softwood lumber partners were considered in this study, as shown in Table A1. These representative partner countries accounted for more than 80% of China’s log and lumber imports on average. Such data processing focused on the largest trade flows helped to avoid time-consuming analyses of discrepancies that may appear large as a percentage but were insignificant in terms of actual volume. It also improved the interpretability of the results. The countries’ reporting data, including Australia, Brazil, Canada, France, Ghana, Indonesia, Malaysia, New Zealand, Philippines, were sourced from their national statistics agencies. Some of the supplying countries’ trade data (Chile, Russia, Thailand, and Ukraine) were sourced from their official customs. Some of the supplying countries’ trade data were sourced from Eurostat (Germany), Ministry of Finance (Japan), and Department of Commerce (U.S.).
Moreover, this study used a consistent unit of cubic meters for logs and lumber, for which GTIS applied a conversion factor of one metric ton is equivalent to 1.4268 cubic meters [1] to minimize the errors caused by the scaling measurement and the different units.
Classification System: Goods are most commonly classified using the Harmonized Commodity Description and Coding System (HS), which uses a nomenclature of ‘HS Codes’, developed by the World Customs Organization to classify commodity groups [45]. This system is used by more than 200 countries and economies as a basis for customs tariffs and the collection of international trade statistics. The HS Code allows for the subdivision of wood products both by product type as well as by species.
Many prior studies of trade discrepancies used four-digit or two-digit level HS codes [46]. This study applied six-digit level HS codes for logs and lumber products. Hardwood logs (HS code 440312, 440331–440335, 440341, 440349, 440391–440399, 440341, and 440349), softwood logs (HS code 440320–440326, and 440311), hardwood lumber (HS code 440721–440729, and 440790–440799) and softwood lumber (HS code 440710–440712 and 440719) were employed in this study. The changes in the classification system were considered and checked in our analysis, such as the code changes for softwood logs and softwood lumber in 2017.
Hong Kong Transit Factor: While Hong Kong’s role as a major cause of trade discrepancies has diminished since 2005 [31], Hong Kong remains one of the mainland’s main ports. There were few records indicating that mainland China imports logs and lumber from Hong Kong, but the Hong Kong records still listed unreciprocated volumes of logs and lumber exported to mainland China. The volume of logs and lumber from Hong Kong accounted for about 15% of China’s imports in GTIS. Therefore, this study combined the import trade data on Hong Kong and China to remove re-export and transit through the Hong Kong port to reduce this source of unintentional discrepancies.
Shipment Time-Lag Factor: Importing countries reporting shipments in a different time period is normal due to long distances and the period for transit, especially when there is a number of timber products exported at the end of the quarter/year that may not arrive at the importing country until the following quarter/year. This study assumed that the change should be the same on the import side within the period [t, t + 1] and the export side within period [t − 1, t], if the transportation time was 1. This was also observed and discussed in numerous previous studies [5,11,12,26,47], which indicated that import data in time t should be equal to the exporters’ data in time t − 1, if the transportation time was 1. Shen [47] took the time-lag factor into analysis and calculated the factor based on the export data, but others didn’t consider it. Prior studies also indicated that import data were more reliable than the corresponding export data [13,30]. In this study, the time-lag adjusted factor formula (Equation (1)) was established with these assumptions according to Shen [47], then modified based on the import data. In this equation, the time-lag factor lit is modeled as a function of T, which represents the transportation time in months and the ratio of the import volume for periods t + 1 (Mit+1) and t (Mit). This ratio represents the change ratio of the import volume in transportation time.
Generally, the actual transportation time was difficult to estimate and can vary by weather conditions, custom clearance processes, and complex transportation routes. For example, the transportation time from the east coast of China to the east coast of the U.S. would be quite different from that from the east coast of China to the west coast of the U.S. [23]. Table 2 shows the average transportation time used in this study, according to a Ningbo transportation enterprise, which settled at the main seaports on the east coast of China (in Zhejiang province). The shipping time is the estimated time for arriving at Ningbo port, considering possible transshipment routes.
The time-lag factor lit is the “adjustment coefficient” of China’s imports after factoring in the transportation time. Quarterly data series were used in this study, which considered a reasonable shipping time between China and its partners. Accordingly, the “new” time-lagged export data were calculated using Equation (2).
l i t = ( M i t + 1 M i t ) T 3 1
X i t * = X i t 1 + l i t
where Mit is the reported imports of China from exporter country i in the time period t; Xit is the reported exports of exporter i to China at time t, and T represents the transportation time period in months.
Discrepancy Measure: The discrepancies measure presented in Equation (3) is based on Ferrantino et al. [31]. The natural logarithm of the ratio of the imports (Mit) and the time-lagged exports, as the trade discrepancy measurement, is used in this study. Then, we use the time-lag factor and the “new” export data (time-lagged exports) to estimate the discrepancy ratios by Equation (4).
D i t = ln ( M i t X i t * ) = ln ( M i t ) ln ( X i t * )
D i t = ln ( M i t ) ln ( X i t 1 + l i t ) = ln ( M i t ) ln ( X i t × ( M i t M i t + 1 ) T 3 )
Equation (2) is a relative measure that represents the discrepancy measures as a proportion of the overall reported imports, making the score independent of the overall volume traded. However, the time-lagged factor in Equations (2) and (4) depends on changes of the imports, and the new export data are thus estimated based on the time-lagged factor, then the trend of the new export data and import data is performed similarly according to the aforementioned assumption. Through this process it is not unusual for trade discrepancies to change between negative and positive after adjustment. Table 3 shows an example of lumber trade discrepancies between China and the U.S. in 2015. The gap between the trade discrepancies with the time-lag factor, compared to without the time-lag factor, has narrowed and is much closer to zero. Therefore, these adjustable factors—the classification system, the Hong Kong transit factor and the shipment time-lag factor have helped reduce discrepancies. Trade discrepancies of lumber in China-U.S. show the smallest discrepancies in the first quarter of 2015 with the value of −0.012, which indicates that China reports 0.988 (equals to e−0.012) times lower import volume than the U.S. reports as the export volume. A deeper understanding of trade discrepancies and their variation will be obtained by using the discrepancy measurement formula above as developed in this study.

3. Results

3.1. Discrepancy Ratios in the Trade Statistics for Logs and Lumber

If discrepancy ratios in bilateral trade statistics were around or close to the “zero” line, this would indicate “good” or “normal” recording by both importing and exporting countries for logs and lumber statistics. The “zero” line indicates that the export recorded data completely matched the import recorded data. In fact, no pair of trade partners had “zero” trade discrepancies, while the “normal” variation of discrepancies fluctuates up and down and was considered a “white noise” series. Figure 4 presents trade discrepancy ratios for logs and lumber between China and its partner countries from 2002 to 2018. The discrepancies were observed mostly above the “zero” line in 2002–2007, falling within the range of −0.069 and 1.027, indicating that China and its partner countries had large trade discrepancies, with the export data under-reported or import data over-reported. After 2008, the discrepancy ratios are moved downward and fall within the range of −0.227 and 0.861 during 2008–2012, tightening even further within the range of −0.120 and 0.408 in 2013–2018. The range of discrepancies for logs and lumber has narrowed, and the ratios of discrepancies gradually fluctuate up and down near the baseline.
The ratios over the “zero” line represent under-reported exports by exporters, and the data below the baseline represent under-reported imports by China. About 61% of the discrepancy ratios on average among these countries were over the “zero” line, and 39% of the discrepancy ratios were below the baseline. The mean of the discrepancies distribution in three time periods was 0.433 with a standard deviation of 2.028 in 2002–2007, 0.119 with a standard deviation of 1.307 in 2008–2012, and 0.159 with a standard deviation of 0.904 in 2013–2018. As shown in Figure 5, 68% of the discrepancy ratios in logs and lumber trade statistics fell in the “normal” range of −1.595–2.461 in 2002–2007, −1.251–1.489 in 2008–2012, −0.745–1.063 in 2013–2018, which was identified by approximately one standard deviation of the mean discrepancy. If ones trade-discrepancy ratio fell in the “normal” range, the discrepancy was considered to be fluctuating normally in this study.
Regarding countries, Ghana went well beyond the “normal” range and fell within the range of 5 to 8 for logs trade discrepancies during 2002–2007, indicating that Ghana reported more than 148 (equal to e5) times lower export volume than China reported as the import volume. After 2010, 50% of Ghana’s trade-discrepancy ratios fell in the “normal” range. Indonesia’s trade discrepancies varied from negative before 2011 to positive after 2011. France and Chile appeared to report higher export volumes than China reported as imports, especially in recent years. The coefficient of variation was 4.684 in 2002–2007, 11.498 in 2008–2012, 5.684 in 2013–2018, indicating that the difference of trade discrepancies between countries became larger over time.

3.2. Trade Discrepancies for Logs Import

The distribution of discrepancies in logs trade statistics across countries was fragmented and extremely scattered, as shown in Figure 6. About 69% of the discrepancy ratios among these countries were positive and above the baseline. The means of logs trade discrepancies were 1.074 with a standard deviation of 2.579 in 2002–2007, 1.296 with a standard deviation of 2.855 in 2008–2012, and 1.468 with a standard deviation of 2.862 in 2013–2018, indicating that 68% of the discrepancy ratios fell in the “normal” range of −1.505–3.653 in 2002–2007, −1.558–4.151 in 2008–2012, and −1.394–4.330 in 2013–2018. Specifically, Indonesia’s trade discrepancies show large positive discrepancies that ranged from 3 to 9, which indicate that Ghana reports 20–2980 (equal to e3–e8) times lower export volume than China reports as the import volume. Given the large positive discrepancies between China and tropical countries, the “normal” range of discrepancies spread wider and wider. The gap in the normal range from 2013–2018 expanded to 5.724.
As shown in Figure 7, 96% of trade discrepancies are above the “zero” line in China–tropical countries, indicating that the selected tropical countries under-reported their export data of hardwood logs, or China over-reported their import data. 68% of the discrepancy ratios fell in the “normal” range of −1.204–3.915 in 2002–2007, −1.664–5.109 in 2008–2012, and −1.045–4.927 in 2013–2018. The “normal” range of discrepancy ratios moved upward, indicating that more and more countries had positive discrepancies for hardwood logs. The coefficient of variation was 1.889 in 2002–2007, 1.966 in 2008–2012, 1.544 in 2013–2018, which indicates that in addition to discrepancies increasing in scale, the variation of discrepancies between countries were getting smaller and smaller over time.
The trade discrepancies in softwood logs were narrowly distributed and fluctuate around the baseline. About 49% of the discrepancy ratios among these countries were negative and below the baseline. 68% of the discrepancy ratios fall in the “normal” range of −2.593–1.740 in 2002–2007, −2.000–1.778 in 2008–2012, and −0.976–1.142 in 2013–2018. Compared to hardwood logs trade discrepancies, the “normal” range of softwood logs discrepancies was narrowed and was close to zero (see Figure 8). The coefficient of variation was −5.075 in 2002–2007, −17.005 in 2008–2012, 12.800 in 2013–2017, indicating that the variation of softwood logs’ trade discrepancies between countries became larger over time. The trade data for the Ukraine, France, Germany, and Brazil were larger than the corresponding Chinese data in some years, showing large negative discrepancy ratios. Some countries’ trade discrepancies were exceeding the “normal” range and above “zero” line, such as Brazil in 2011 and 2012, and Germany in 2003, 2004, 2012, 2016 and 2017. It is worth mentioning that Russia, which accounts for the leading position in China’s log imports, as well as the United States, were not exceeding the “normal” range.

3.3. Trade Discrepancies for Lumber Import

Compared with logs, the discrepancies in lumber import statistics were relatively minor. About 51% of discrepancy ratios in lumber among these countries were positive and above the baseline (see Figure 9). The means of the discrepancy ratios in lumber trade statistics were 0.541 with a standard deviation of 1.992 in 2002–2007, 0.084 with a standard deviation of 1.288 in 2008–2012, and −0.133 with a standard deviation of 0.873, in 2013–2018, indicating that 68% of the discrepancy ratios fell in the “normal” range of −1.451–2.533 in 2002–2007, −1.204–1.372 in 2008–2012, and −1.006–0.741 in 2013–2018. The largest discrepancy in lumber imports appeared in Ghana in 2006, reaching 7.49, followed by Ghana in 2007 at 7.13. This indicates that Ghana reported 1790 (equal to e7.49) times and 1249 (equal to e7.13) lower export volume than China reported as the import volume in 2006 and 2007 respectively. Ghana’s trade-discrepancy ratios varied from positive to negative, while Indonesia’s trade-discrepancy ratios turned from negative to positive.
In terms of hardwood lumber trade discrepancies, there were four out of five tropical countries for which the discrepancies were outside of the normal range, with the normal range narrowing obviously (see Figure 10). 68% of the discrepancy ratios fell in the “normal” range of −1.446–2.967 in 2002–2007, −1.190–1.618 in 2008–2012, and −0.502–1.031 in 2013–2018. The coefficient of variation was 2.901 in 2002–2007, 6.561 in 2008–2012, 2.899 in 2013–2018, indicating that the variation of hardwood lumber trade discrepancies between countries has become smaller in recent years. Trade discrepancies for hardwood lumber (HS six-digit level) are larger than that for lumber (HS four-digit level).
The normal ranges of softwood lumber trade discrepancies were moving downward, and 97% of discrepancy ratios were below the “zero” line in 2013–2018 (see Figure 11). 68% of the discrepancy ratios fell in the “normal” range of −0.922–0.955 in 2002–2007, −0.867–0.579 in 2008–2012, and −0.688–0.042 in 2013–2018. As such, Chile’s export data were larger than China’s import records in 2007–2015. Ukraine then showed the largest negative discrepancy ratio in 2009, reaching −3.36. The coefficient of variation was 55.970 in 2002–2007, −5.024 in 2008–2012, −1.130 in 2013–2017, indicating that the variation of softwood lumber’s trade discrepancies between countries became smaller and smaller over time. Subsequently, this study conducted an analysis of variance to summarize and verify the distribution of the discrepancy ratios statistically.

3.4. Statistical Analysis

Distribution tests of the trade discrepancy ratios were performed in this section. A statistical analysis of the distribution of trade-discrepancy ratios showed that the kurtosis value for the distribution of log trade-discrepancy ratios was 1.917, indicating that this distribution clusters more than a normal distribution (see Table 4). The skewness statistic for the log trade-discrepancy distribution was 1.388 suggesting that the distribution has a longer right tail and, since the skewness statistic was more than twice as large as the standard error (SE = 0.077), the distribution of log trade-discrepancy ratios was not a normal distribution. In contrast, the skewness value for developed countries’ trade-discrepancy ratios was −1.439, indicating that the distribution for developed countries’ trade-discrepancy ratios had a longer left tail. The description statistics show that the distribution of trade-discrepancy ratios for non-tropical countries was nowhere near as skewed as any other category discrepancy distribution, and clustered around the mean (0.014), with a kurtosis value of 19.2.
The results of the t-test indicate that there is a statistical difference between logs and lumber (p = 0.000), softwood and hardwood (p = 0.000), developed countries and developing countries (p = 0.000), non-tropical countries and tropical countries (p = 0.000) for all products (see Table 4). The mean discrepancy ratio for hardwood was significantly higher than that for softwood, and the mean discrepancy ratio for logs was significantly higher than that for lumber. It was also significantly higher for developing countries than for developed countries, and it was significantly higher for tropical countries than for non-tropical countries. The non-tropical countries’ trade discrepancies were the smallest, while the gap between the non-tropical countries and tropical countries was the largest.
One-way ANOVA tests were used to determine if there was a statistical difference between the three-time periods (see Table 5). The results indicate that there was a significant change in the distribution of trade statistic discrepancy ratios from 2002 to 2018 in hardwood lumber (p = 0.000), softwood logs (p = 0.000), and softwood lumber (p = 0.007). For example, the trade discrepancy for hardwood lumber trade has decreased significantly in recent years, and the effect size was 2.4% suggesting the variation of hardwood lumber trade discrepancies is slightly obvious. However, the trade discrepancies in softwood logs and lumber are changing dramatically. The trade discrepancies in softwood logs changes from negative (−0.427) to positive (0.083). The variation of trade discrepancies for softwood lumber in three periods was the most significant in these categories, the effect size of which was 3.8%. However, there was no significant variation/reduction in the developing countries’ and tropical countries’ trade discrepancies (p = 0.198 and p = 0.459, respectively). The discrepancies in tropical countries were all over 1.5, with an increasing trend from 2002 to 2018. Conversely, the discrepancies in non-tropical countries have been reduced significantly, reaching 0.054 in 2013–2018. With respect to specific wood products and country groups, these statistical tests have verified that the variation of the trade discrepancies is similar to the results analyzed in the previous sections.

4. Discussion

The results of this study demonstrate that there remain large trade discrepancies in logs and lumber data that fall outside of the “normal” range in some cases. Given that factors associated with the time-lag shipment and statistical errors have been adjusted and explained, there remain factors that affected the size, distribution, and variation of the trade discrepancies.
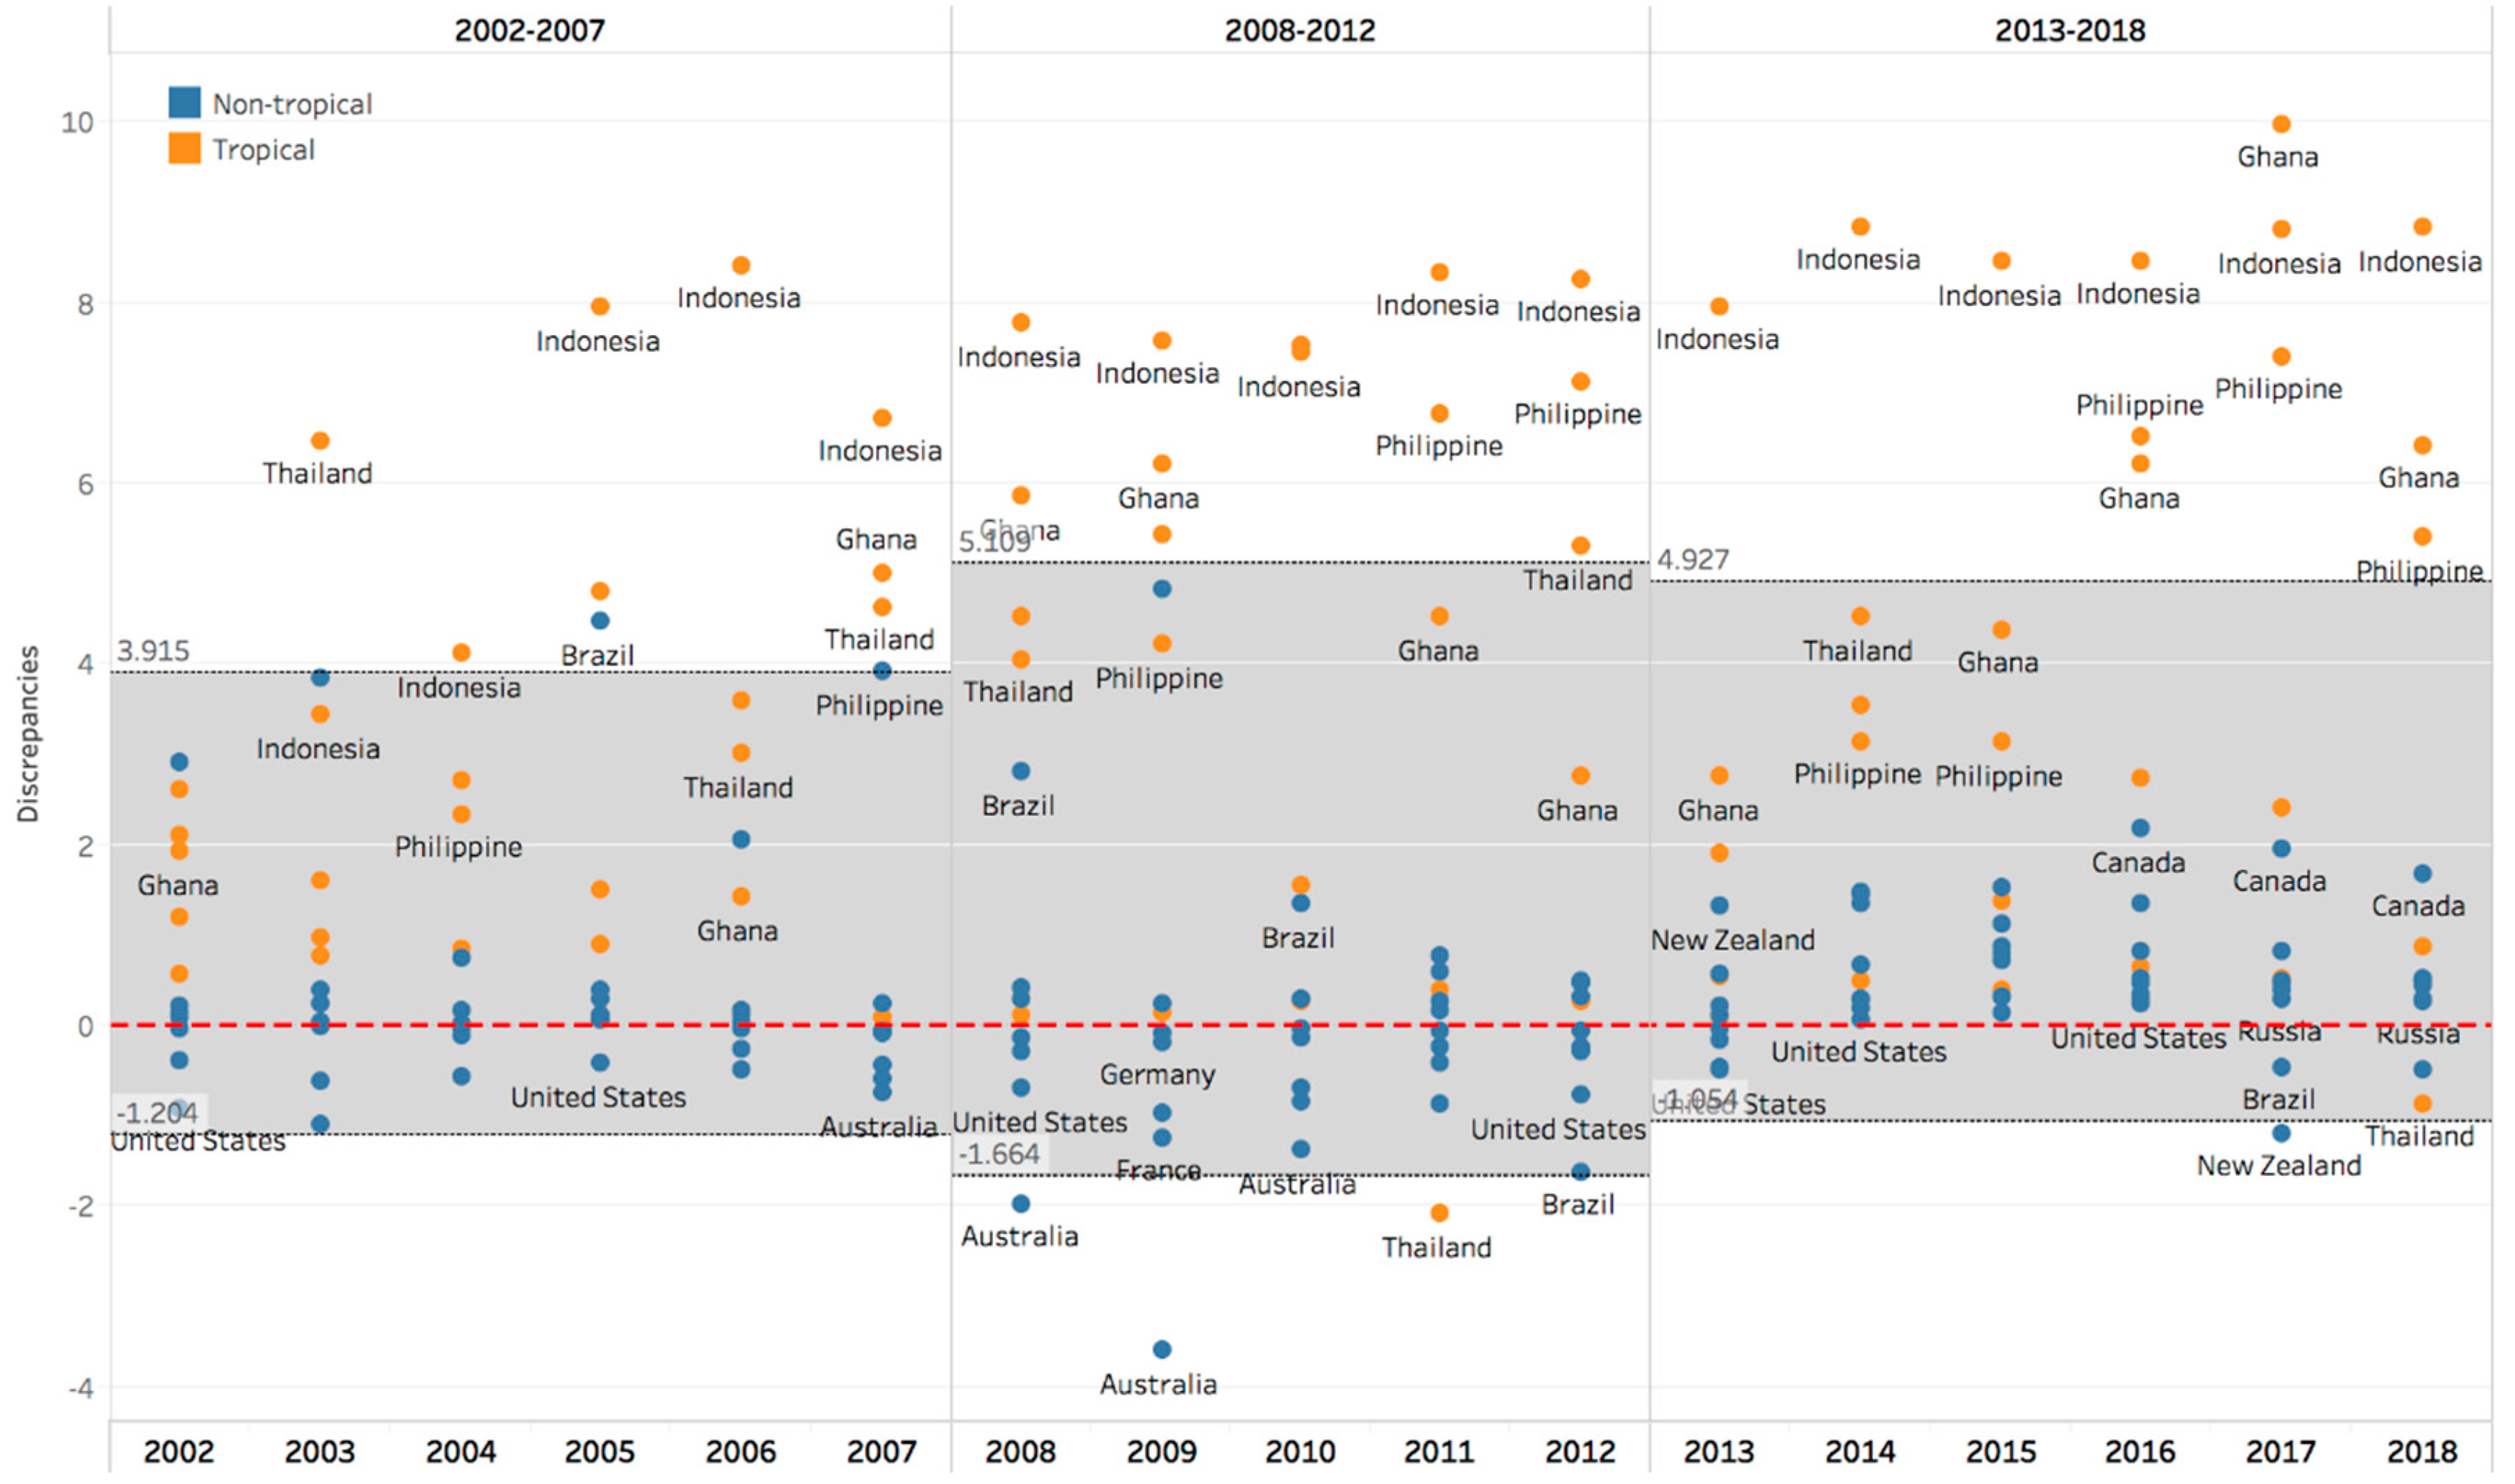
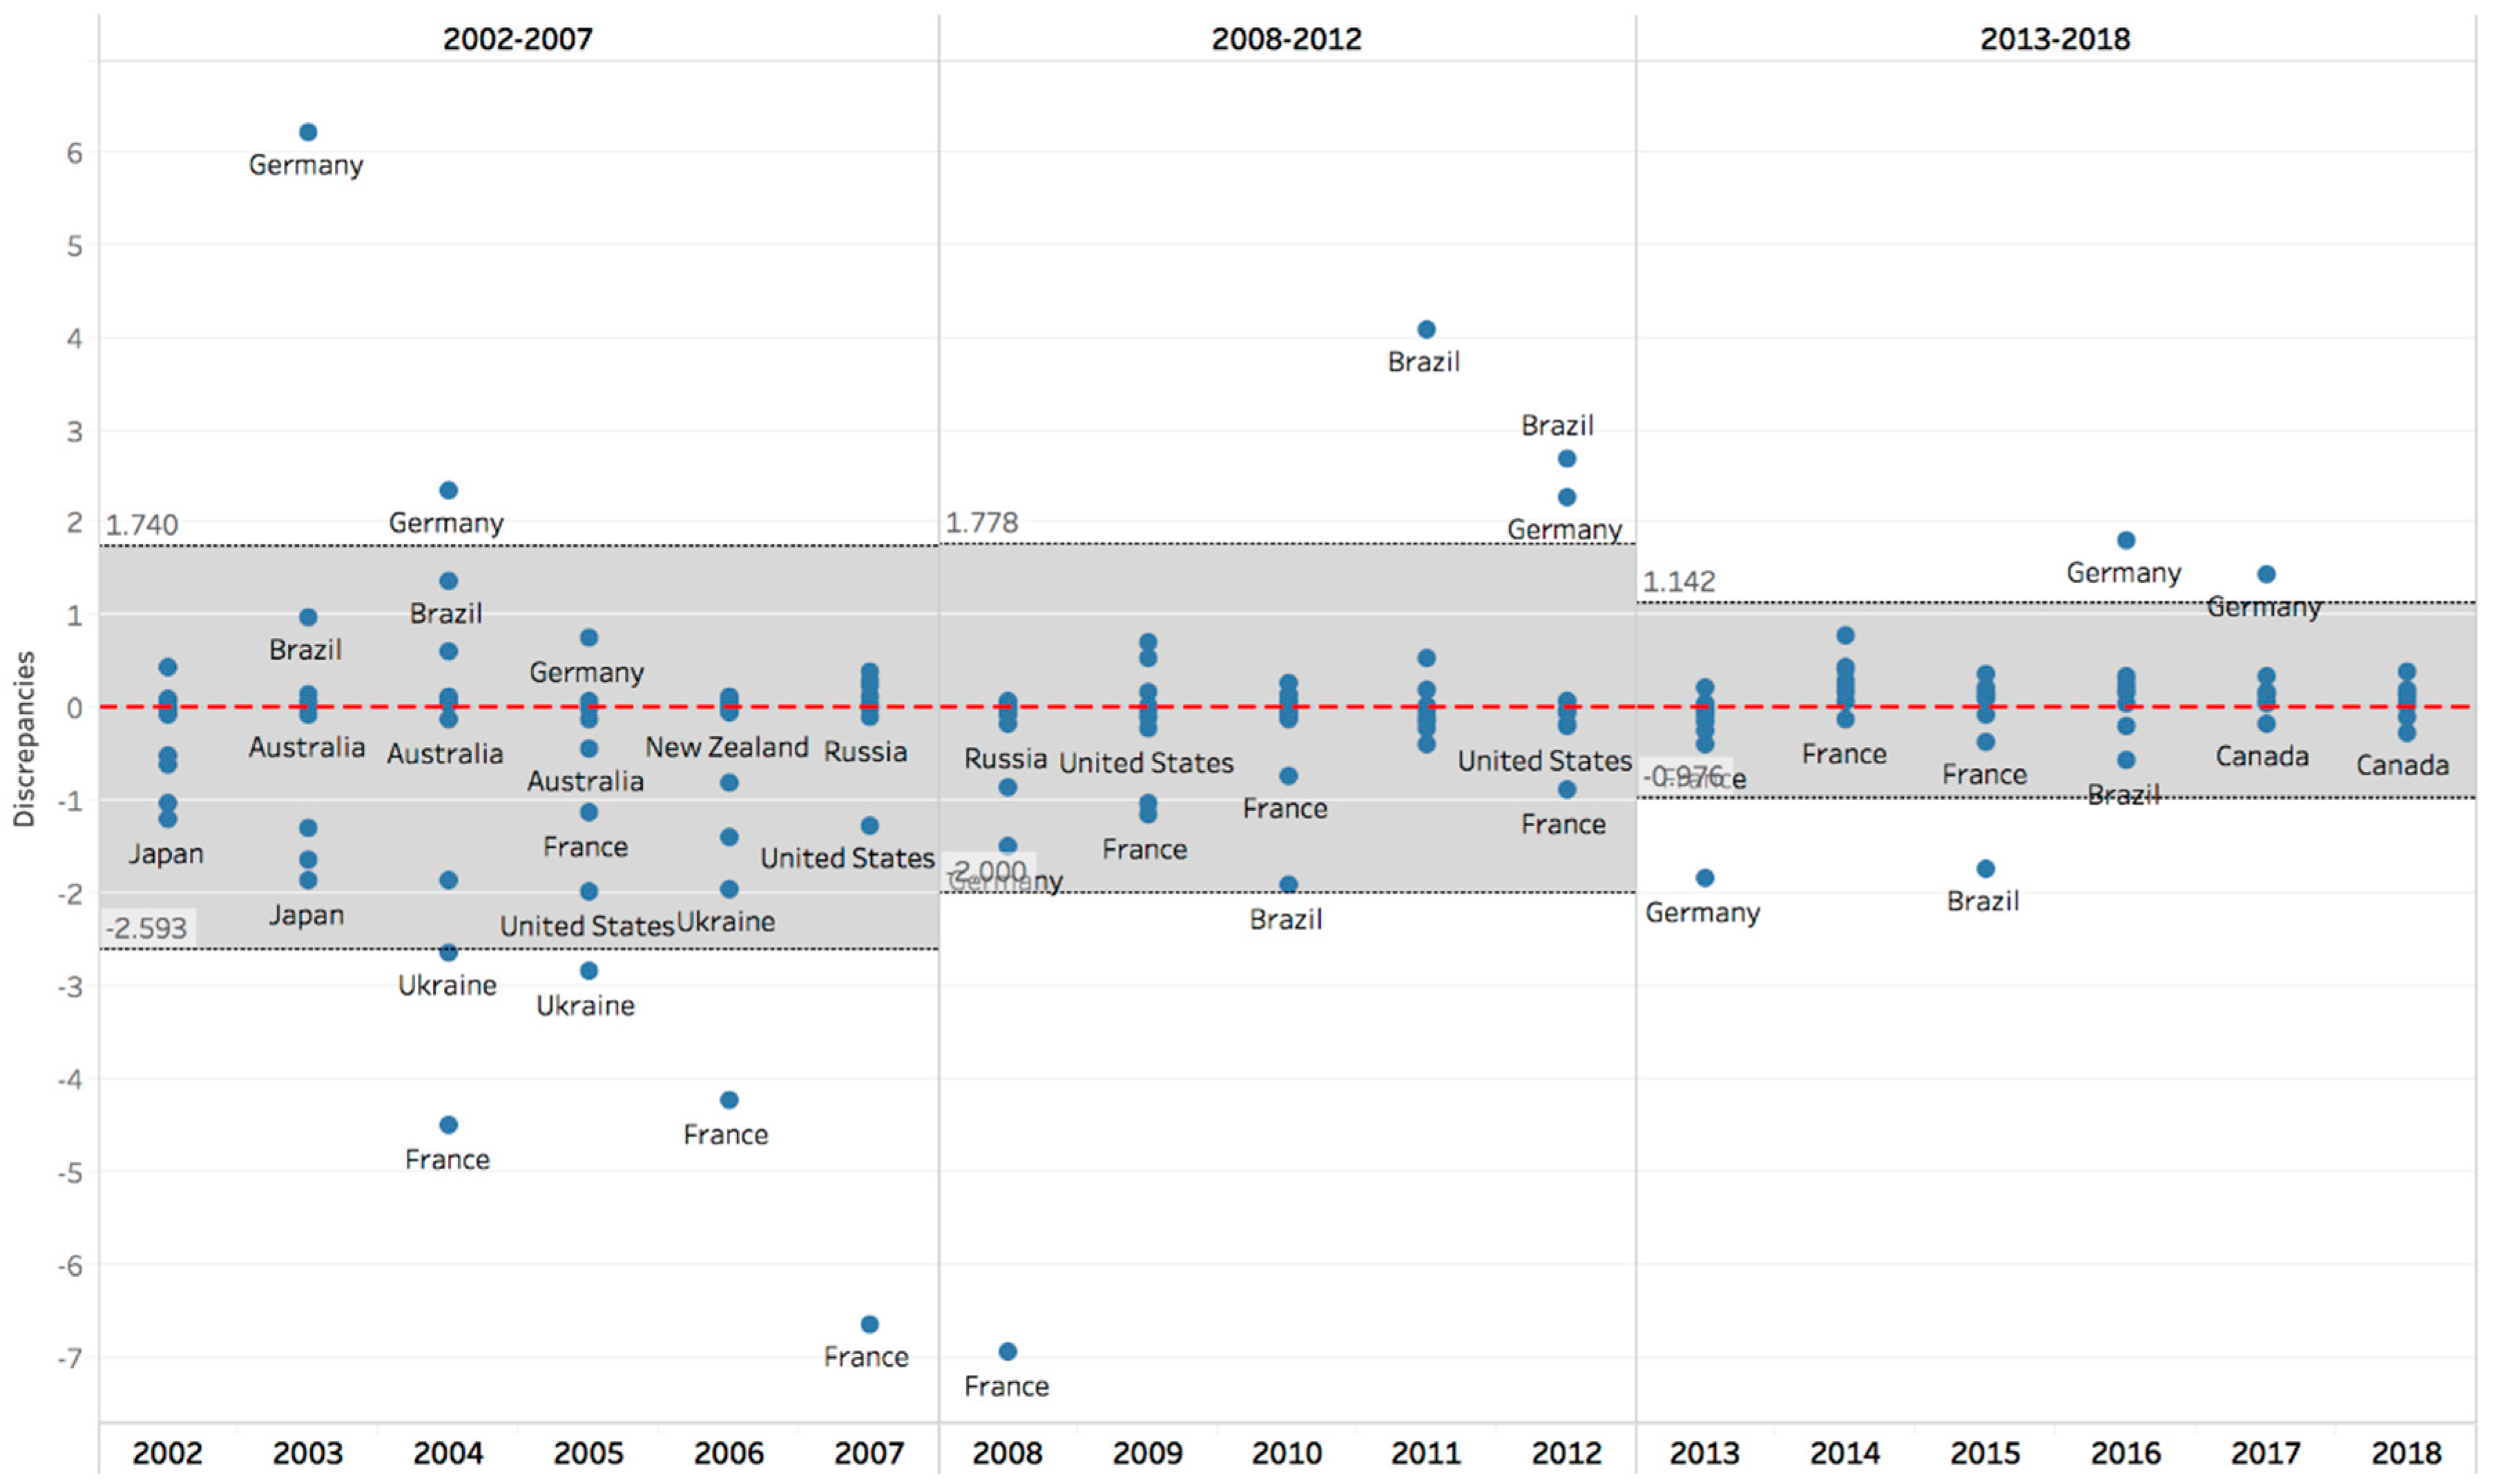
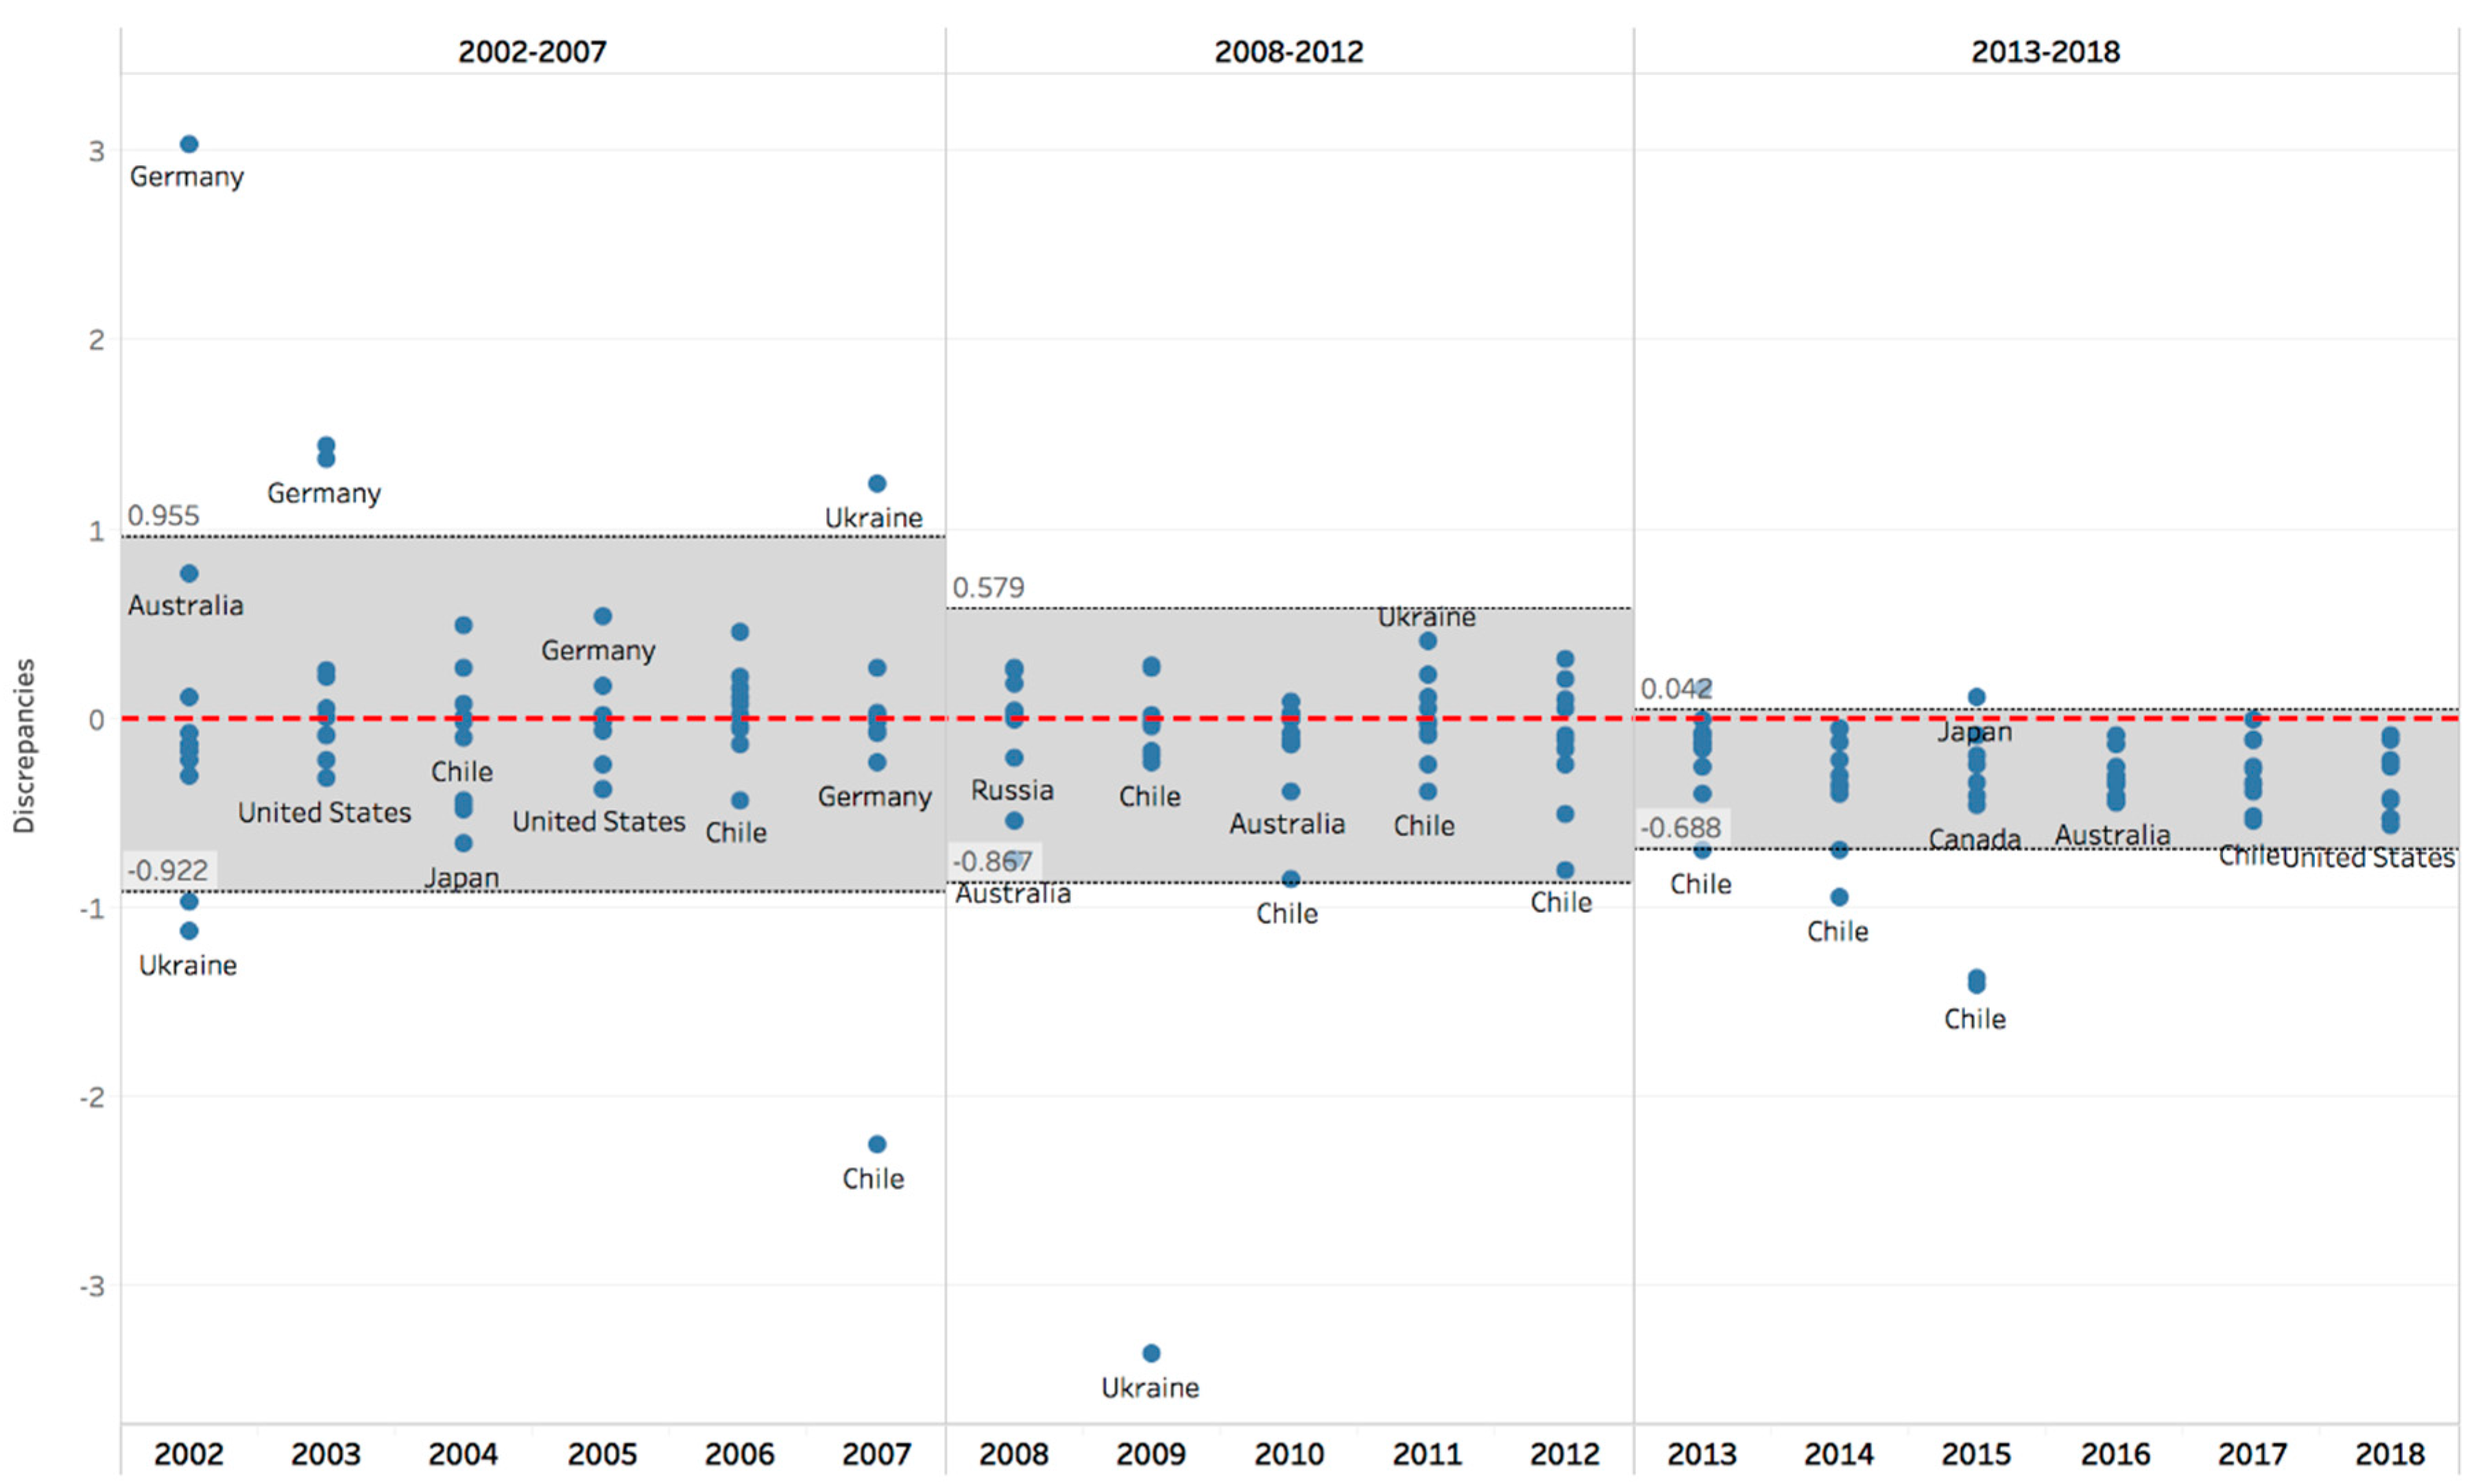
One of these factors is re-export. It still exists in China-Chile due to the characteristics of their geographical locations. Chile reported higher exports than China imports in softwood logs and lumber in 2015–2017 (see Figure 9 and Figure 11). Bolivia, which is rich in forest resources, has historically always imported and exported through Chilean ports [48].The Chilean export records consequently include domestic exports and volumes re-exported through Chilean ports, but when goods were delivered to China, customs recorded these re-exports or transshipped goods as sourced from their original export territory and only the Chilean domestic goods as sourced from Chile. Hence, re-exports created a discrepancy in the international account. Similarly, goods from European countries such as France and Germany are exported to another destination, creating substantial re-export/transshipments in the process. While transshipments are not included in re-export data, discrepancies may remain because goods are shipped via a third country but without clearing customs.
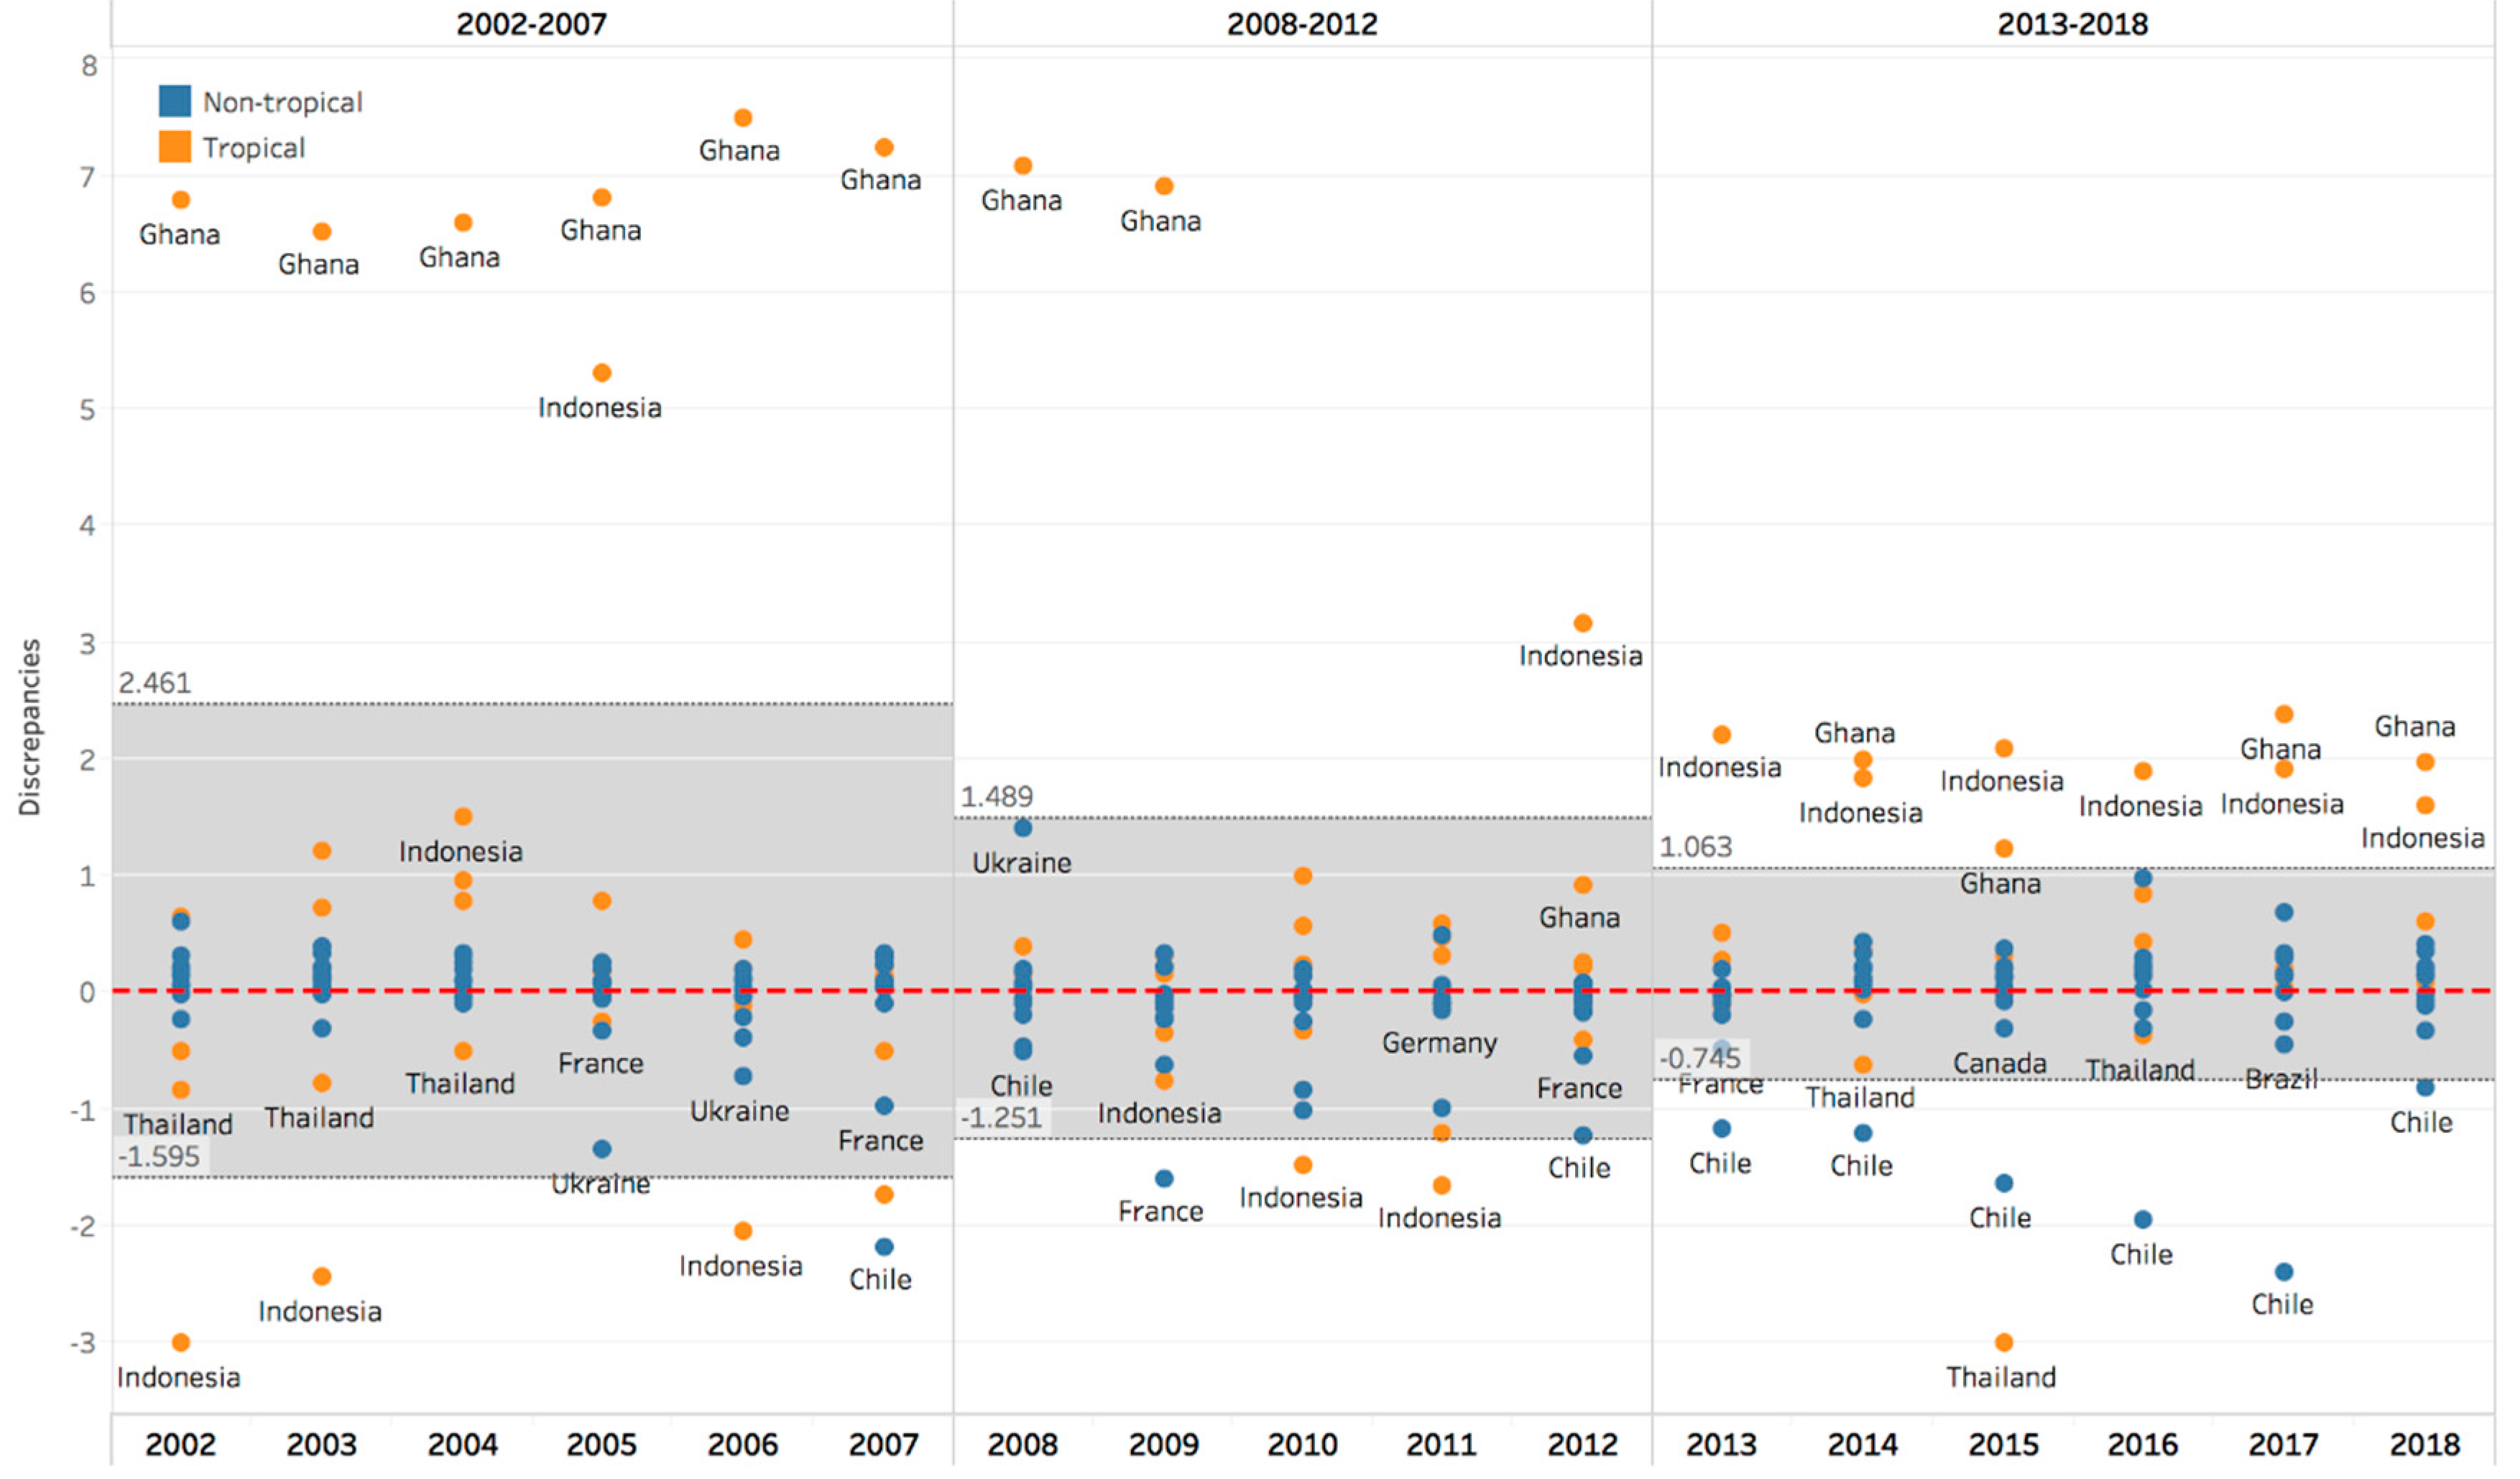
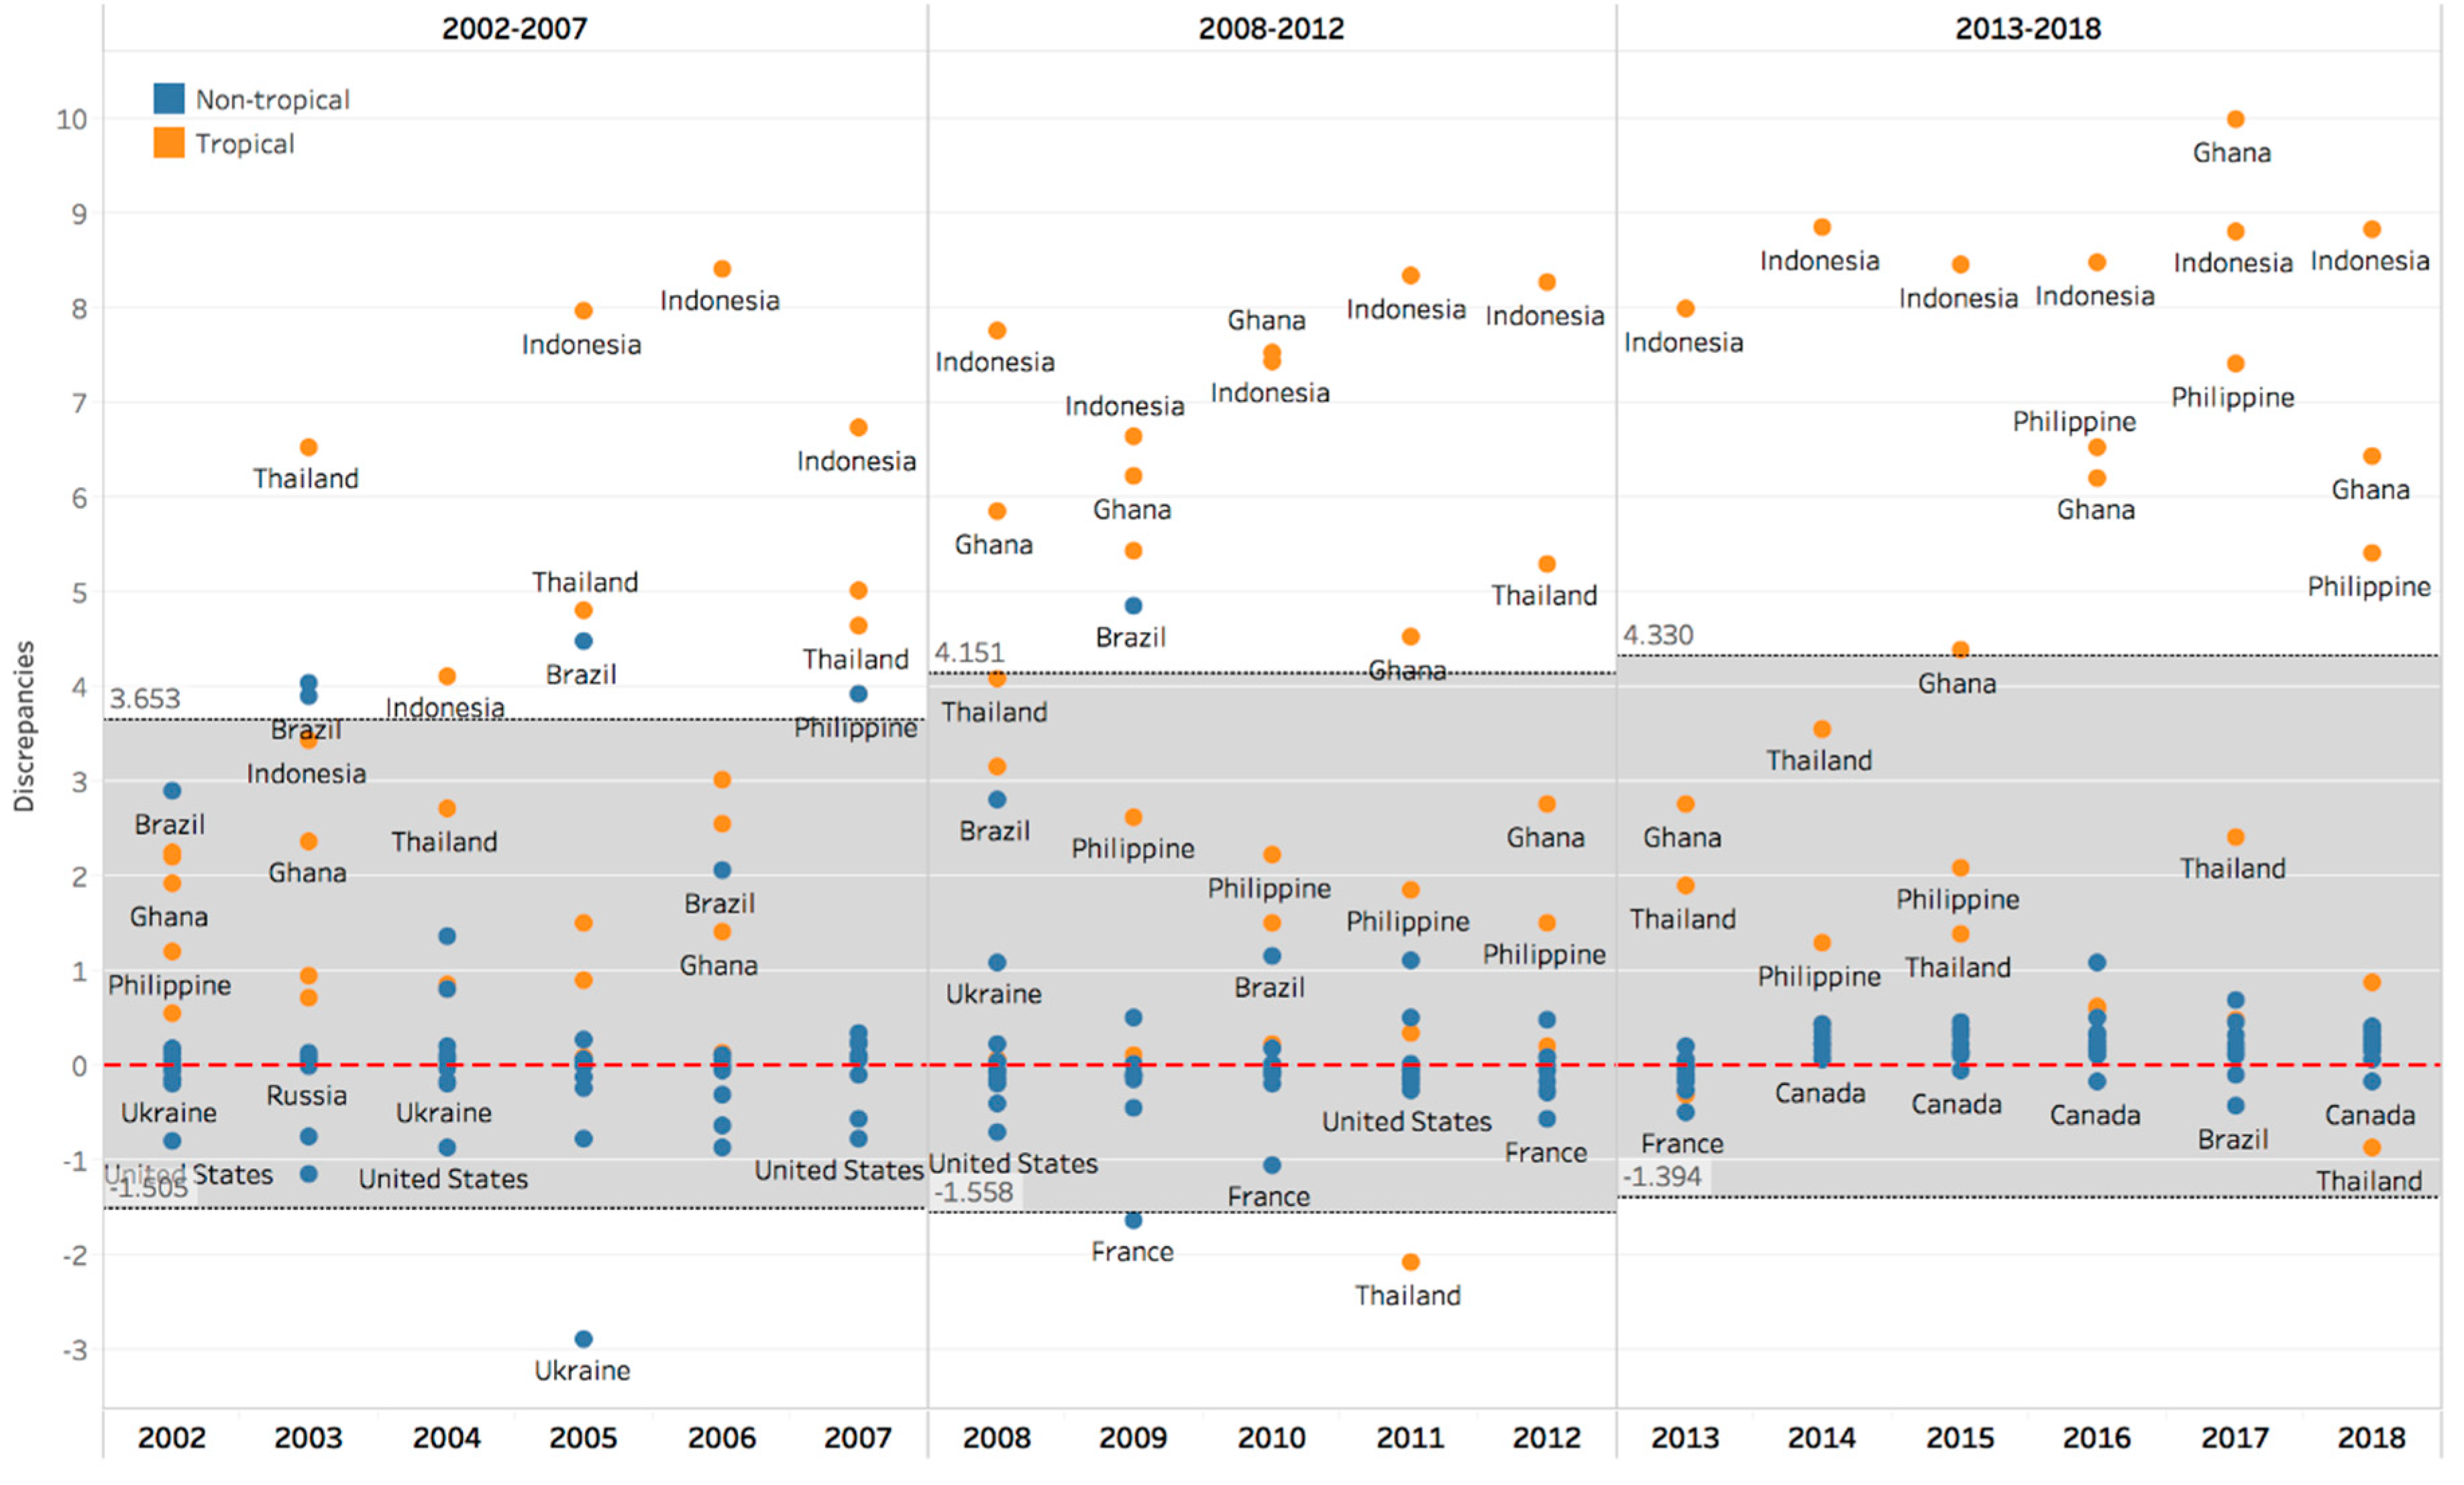
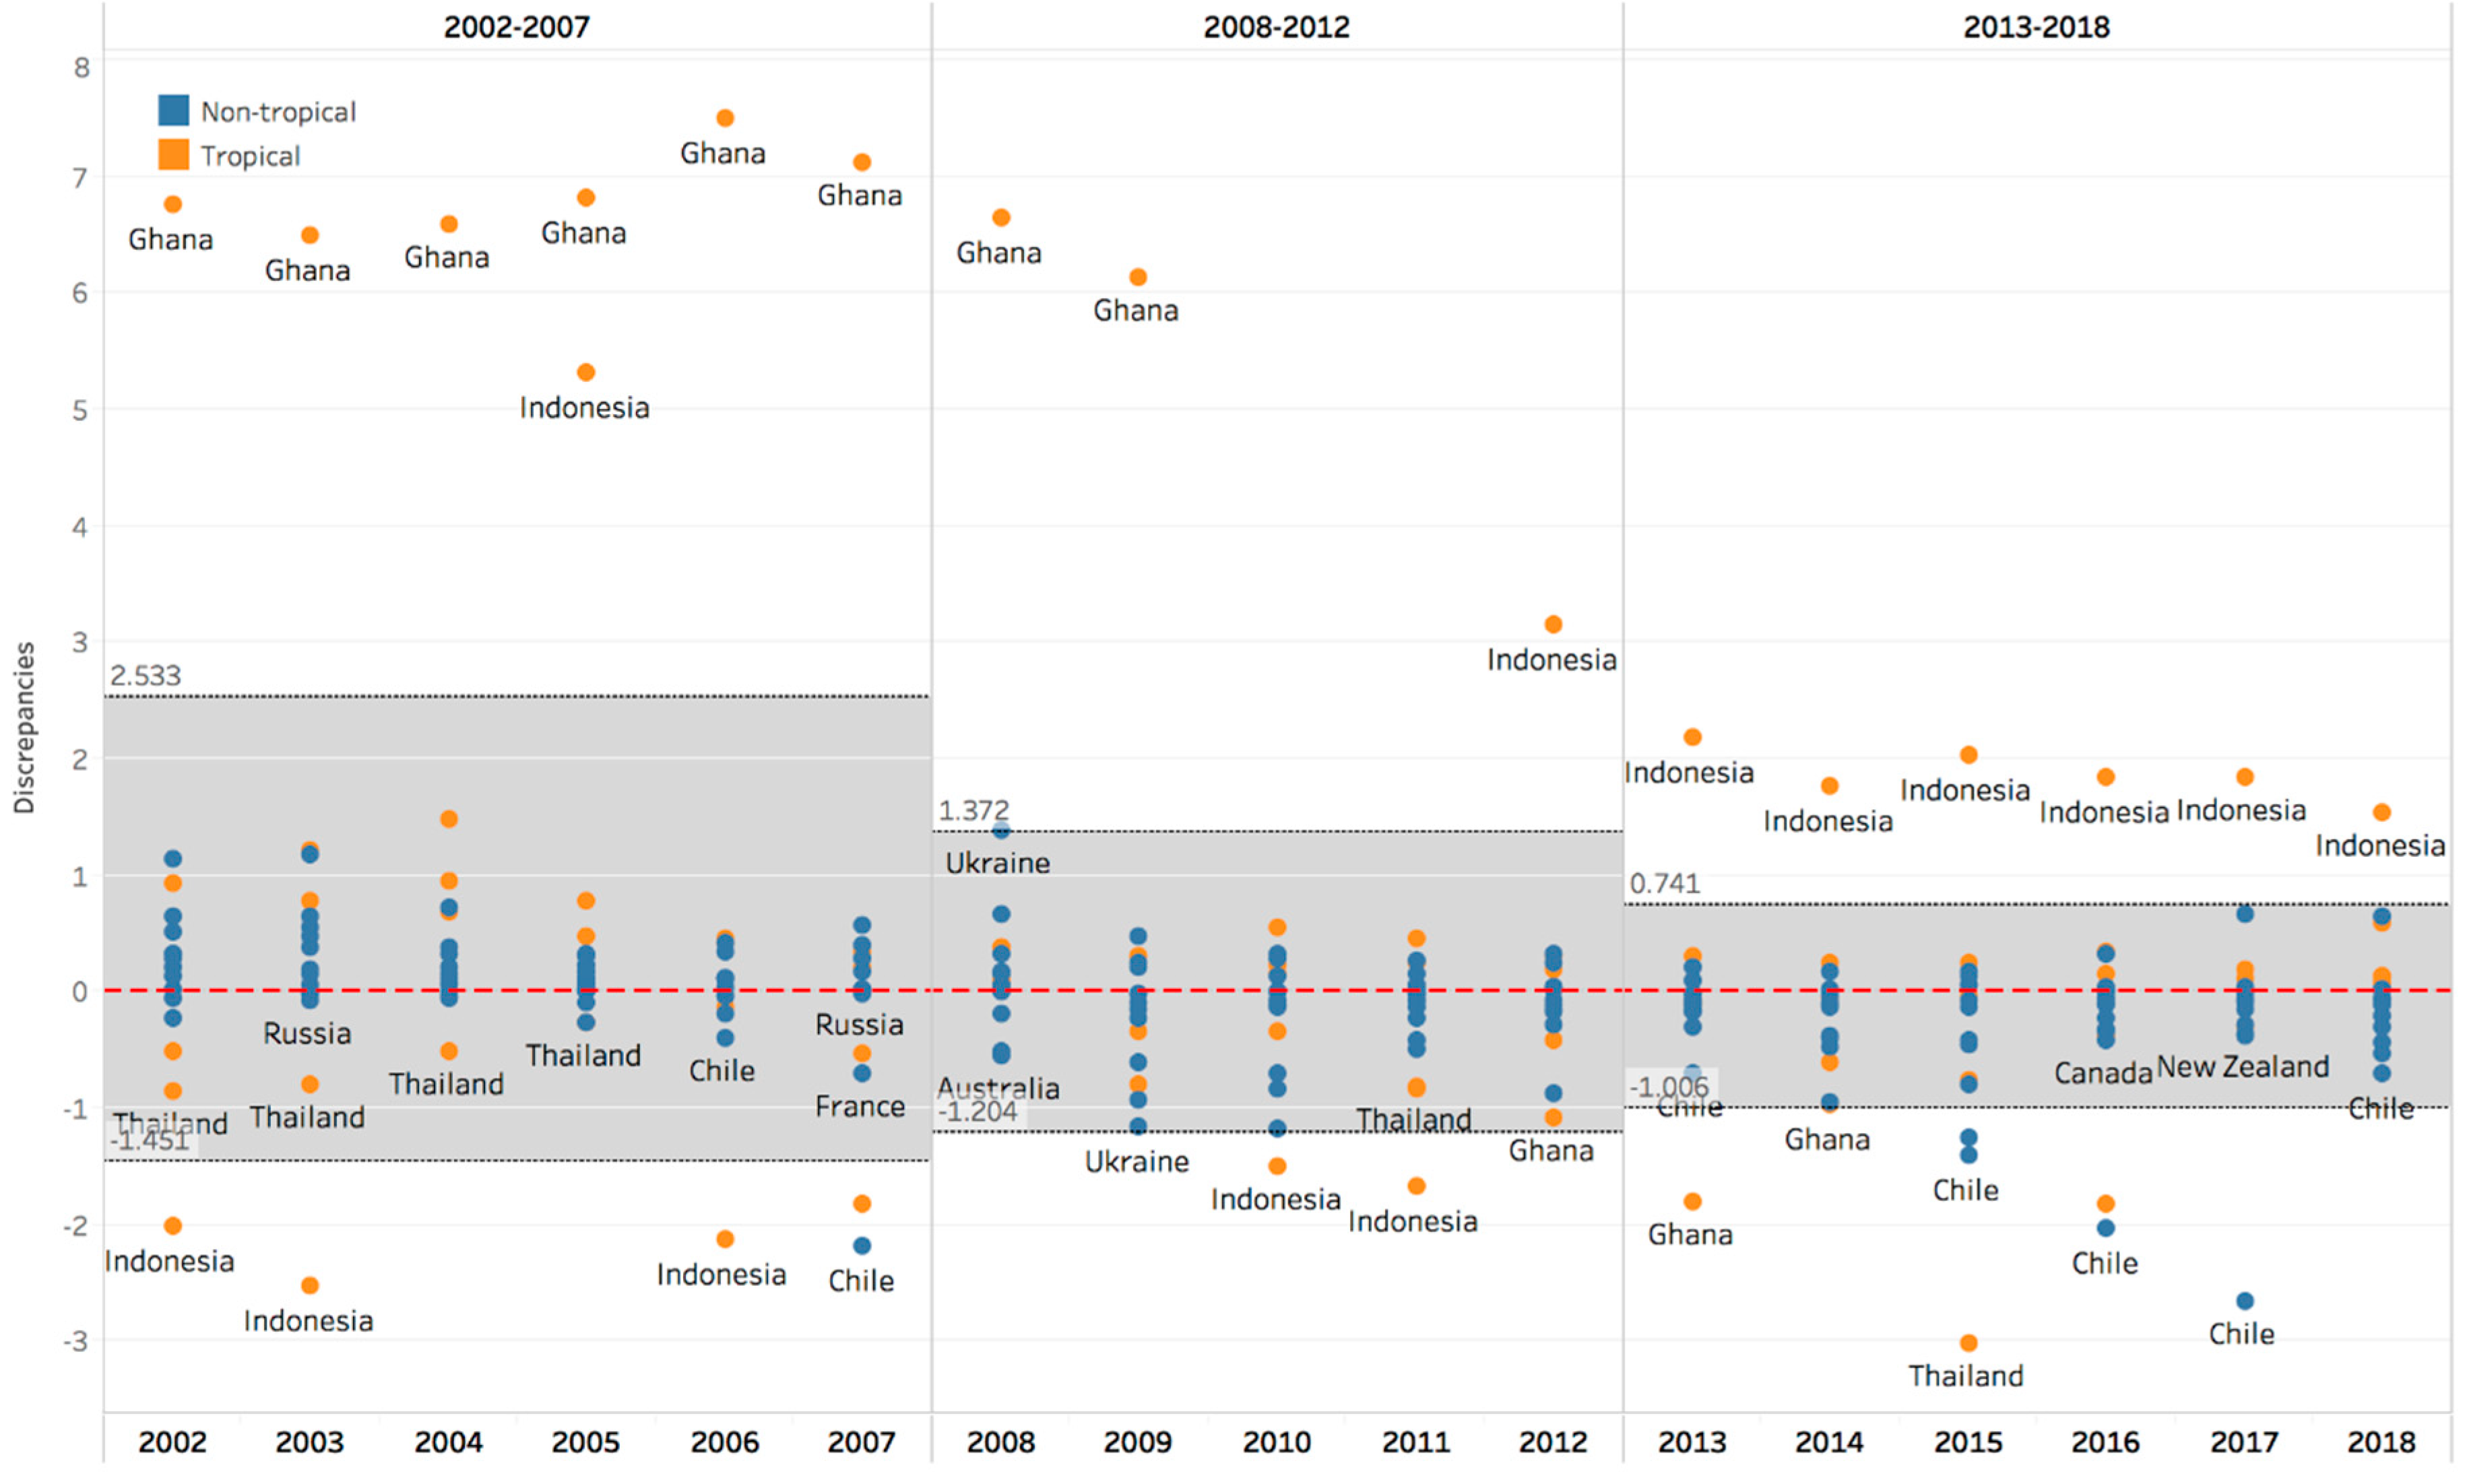
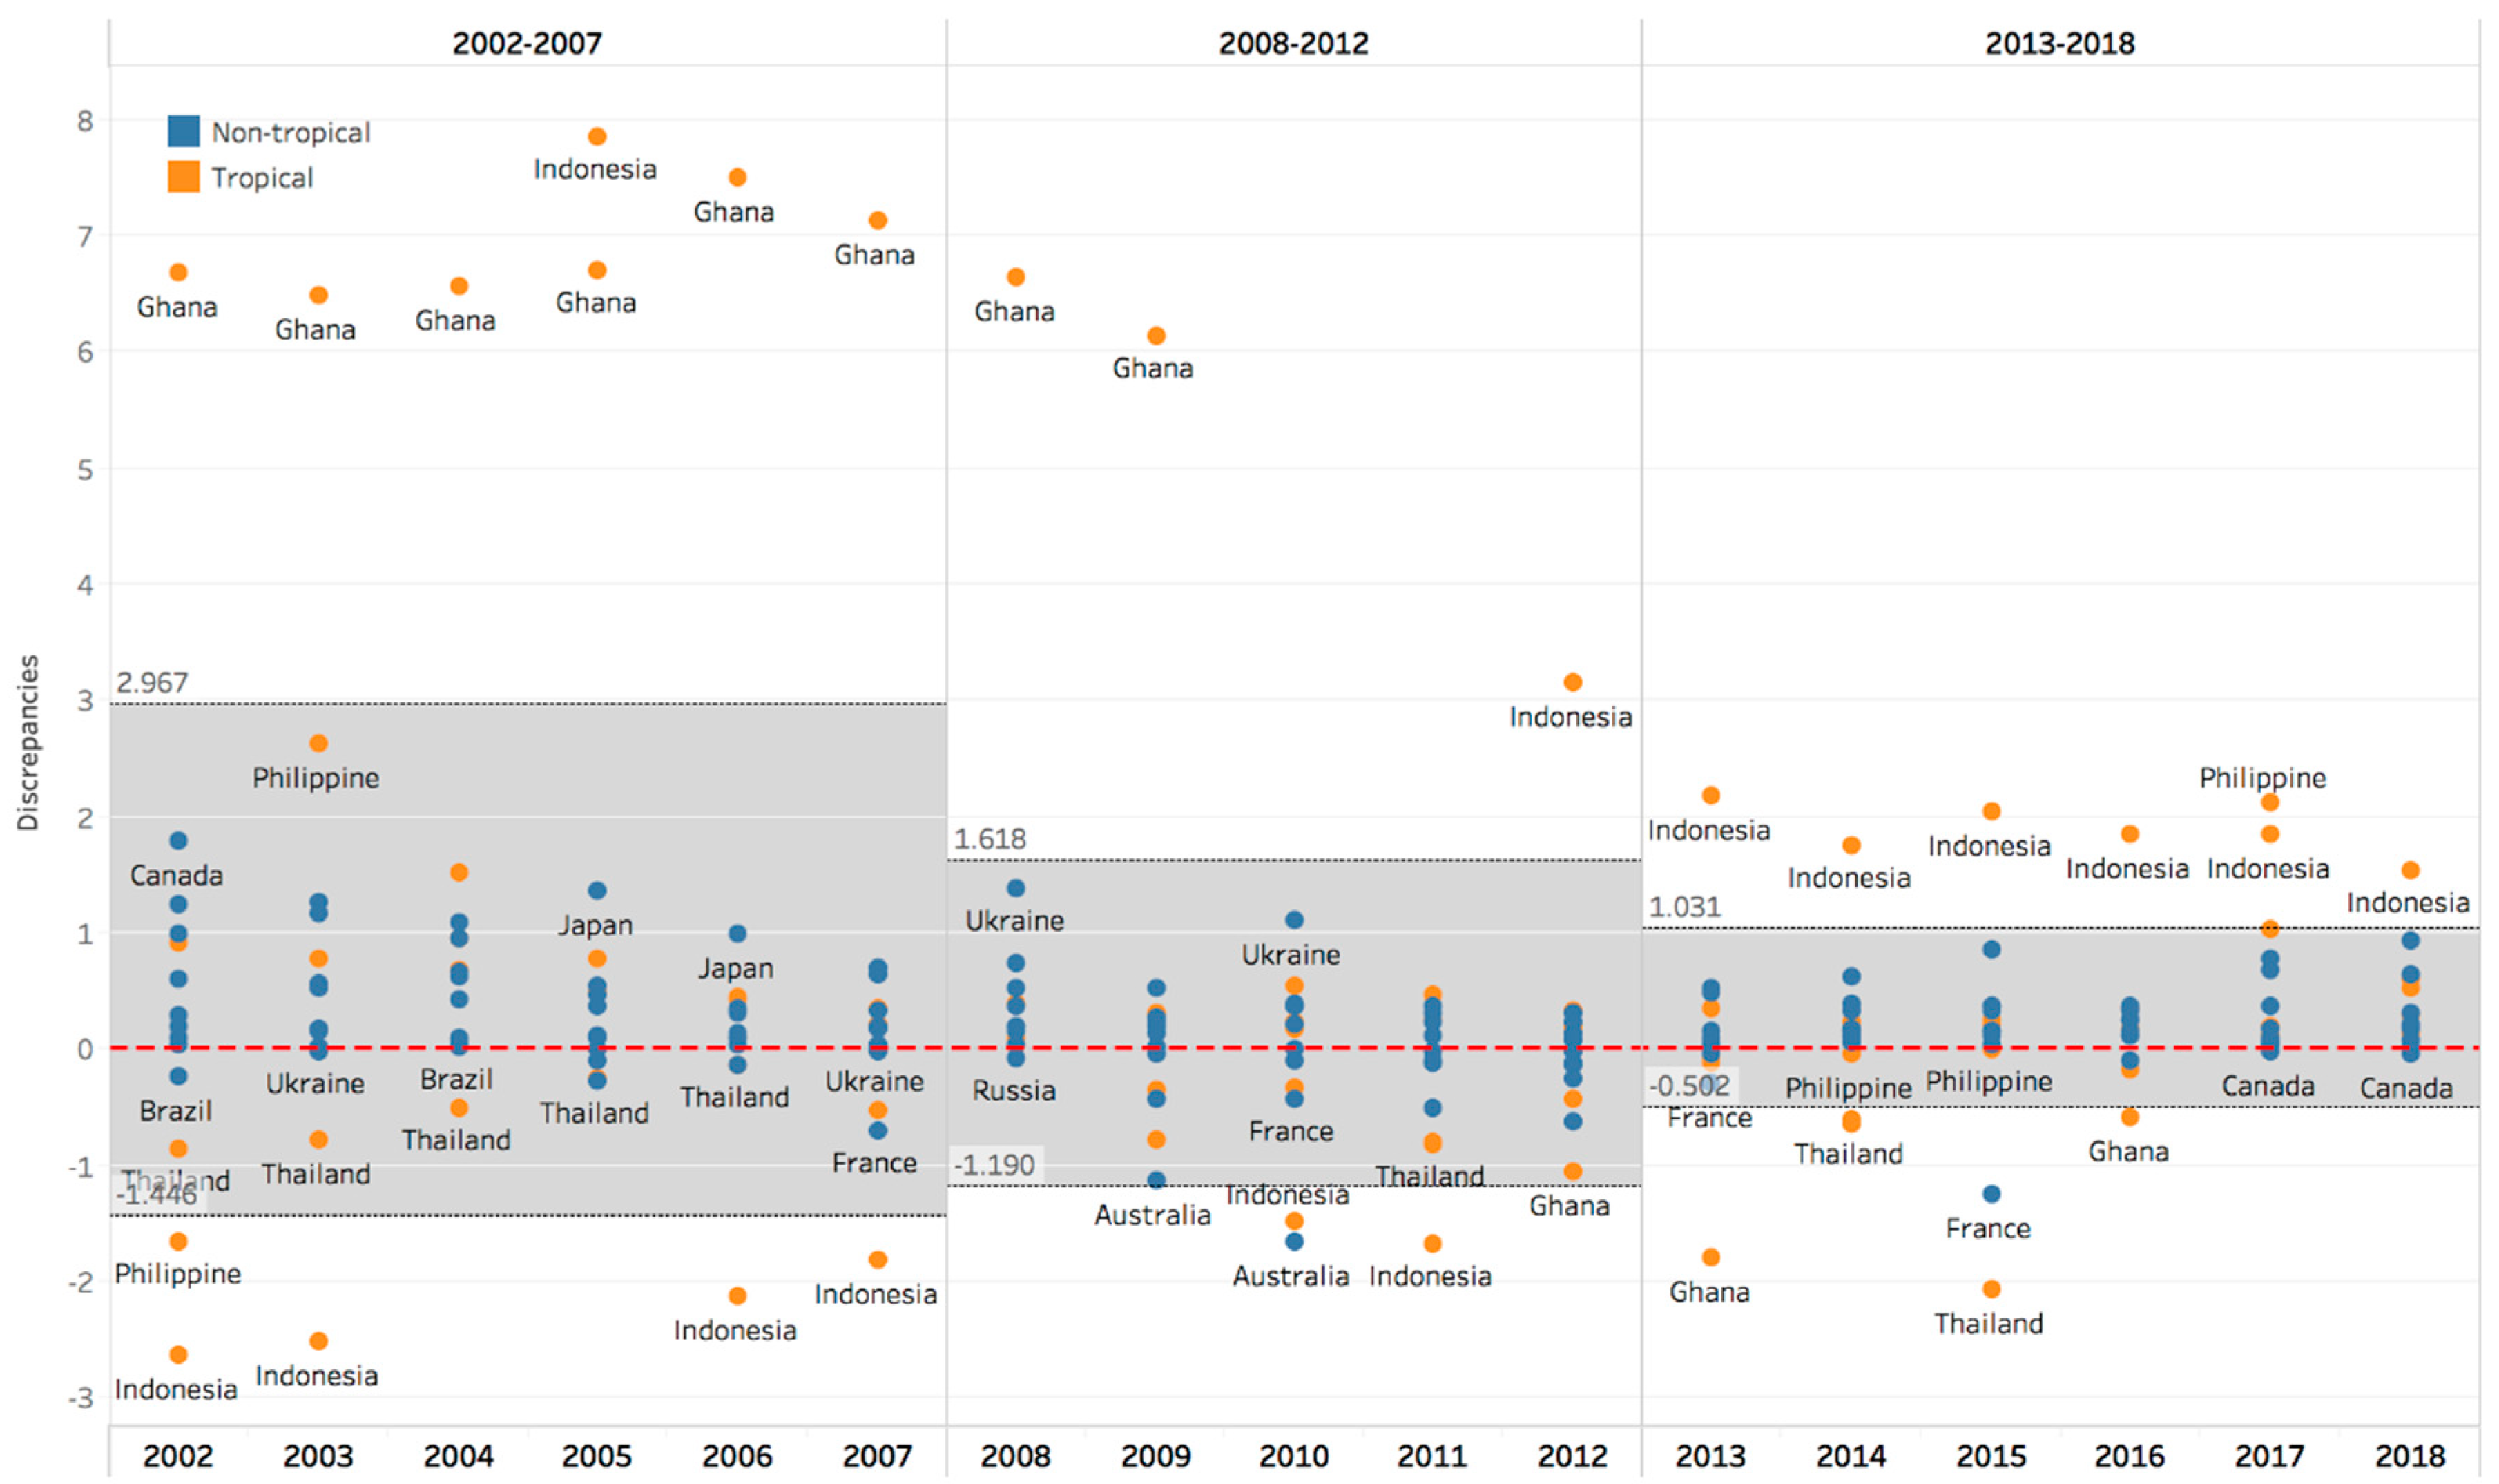
There are still many unexplained large discrepancies in the trade statistics for hardwood logs and lumber imported by China from Southeast Asian countries and Ghana (see Figure 7 and Figure 10). As discussed in previous studies, under-reporting or non-reporting appears to have existed widely in the hardwood logs and lumber trade in these countries [49,50,
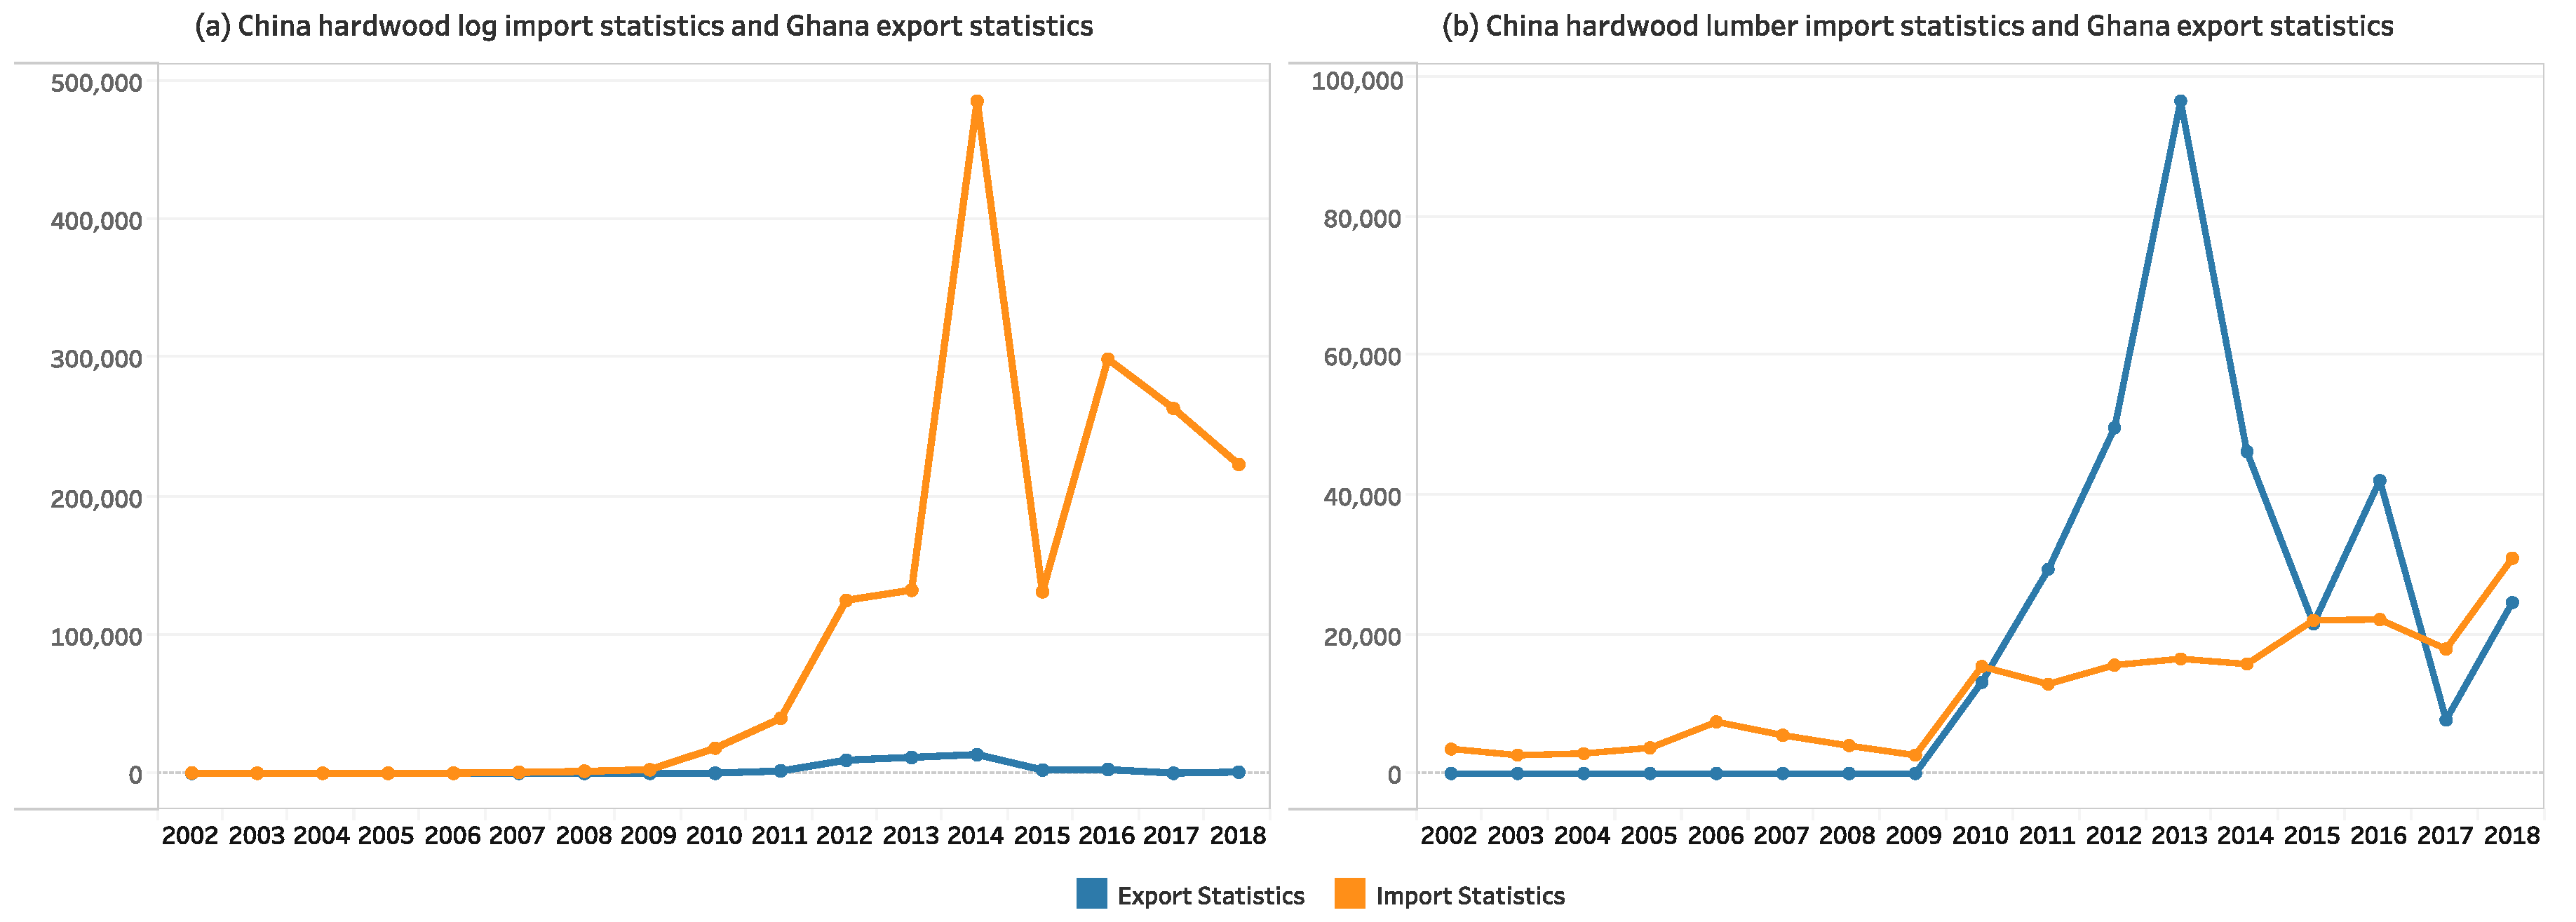
51]. As such, Ghana’s hardwood log export volumes were quite low, compared with China’s recorded imports, while the recorded hardwood lumber exports from Ghana to China were much higher than the imports recorded by China in 2011–2016 (see Figure 7 and Figure 10). In addition, the trends in China’s log import statistics line up fairly well with the trends in the lumber exports reported by Ghana (see Figure 12). The gap in the trade statistics in China–Ghana has shrunk by about 10% when aggregating products, indicating that misclassification of lumber and logs may occur in Ghana–China trade. It should be noted that Ghana implemented a Rosewood harvesting and exporting ban in 2014 (see Figure 3). Exporters may misclassify or misreport the products to avoid export bans, quotas or taxes, taking advantage of possible weaknesses in the government’s management system [52,53,54]. Misclassification may not be a result of smuggling or tax avoidance, but rather may be due to inconsistencies in classification practices, it can account for as much as 3%–5% of discrepancies [55].
Likewise, the reported exports of hardwood logs from Indonesia are only 35.9% of total China’s reported import data during 2002–2018 [1], which are showing large positive discrepancies in Figure 7. Raw log export restrictions and logging bans were announced in Indonesia in 2002, which could be considered as incentives to under-report or non-report [8]. Exporters may forge transport documents for domestic forest over-harvesting and ignore the legal restrictions and regulations of the government. Indonesia’s forest management system and institutions are often said to be manipulated and corrupt [56], and policies are inefficient instruments for correcting their domestic distortions [57]. While large discrepancies may be unintentionally recorded errors, a continuous under-reporting of exports seems evident and not an accident. Misreporting or misclassification is largely contributed to the unexplained discrepancies. The same considerations are valid for the large positive trade discrepancies between China and the Philippines, China and Thailand. Another possibility is that China deliberately reported high imports, but there is no supportive and strong evidences to explain such behavior. There may be incentives for a Chinese importer to under-report, but intentionally over-reporting is difficult to explain. More in-depth explanations and surveys are required, which may be sought through the use of tracking systems.
Tropical countries, including Malaysia, Indonesia, the Philippines, Thailand and Ghana, played an important role in China’s hardwood log imports in the past but have contributed less in recent years, accounting for 57.8% and 1.3% of China’s total hardwood logs imports in 2002 and 2018, respectively, as show in Figure 2. Trade flows of Chile, France and Germany accounted for 0.7%, 0.8%, and 1.2% of total China’s import data, while they have large trade discrepancies (see Figure 2). These countries’ trade flows are relatively minor within the overall context of logs and lumber trade with China. In contrast, the larger trade flows of logs and lumber between Russia, New Zealand, and the U.S. (above 10% of total China’s import) showed small trade statistics discrepancy ratios, which were less than ± 0.06.
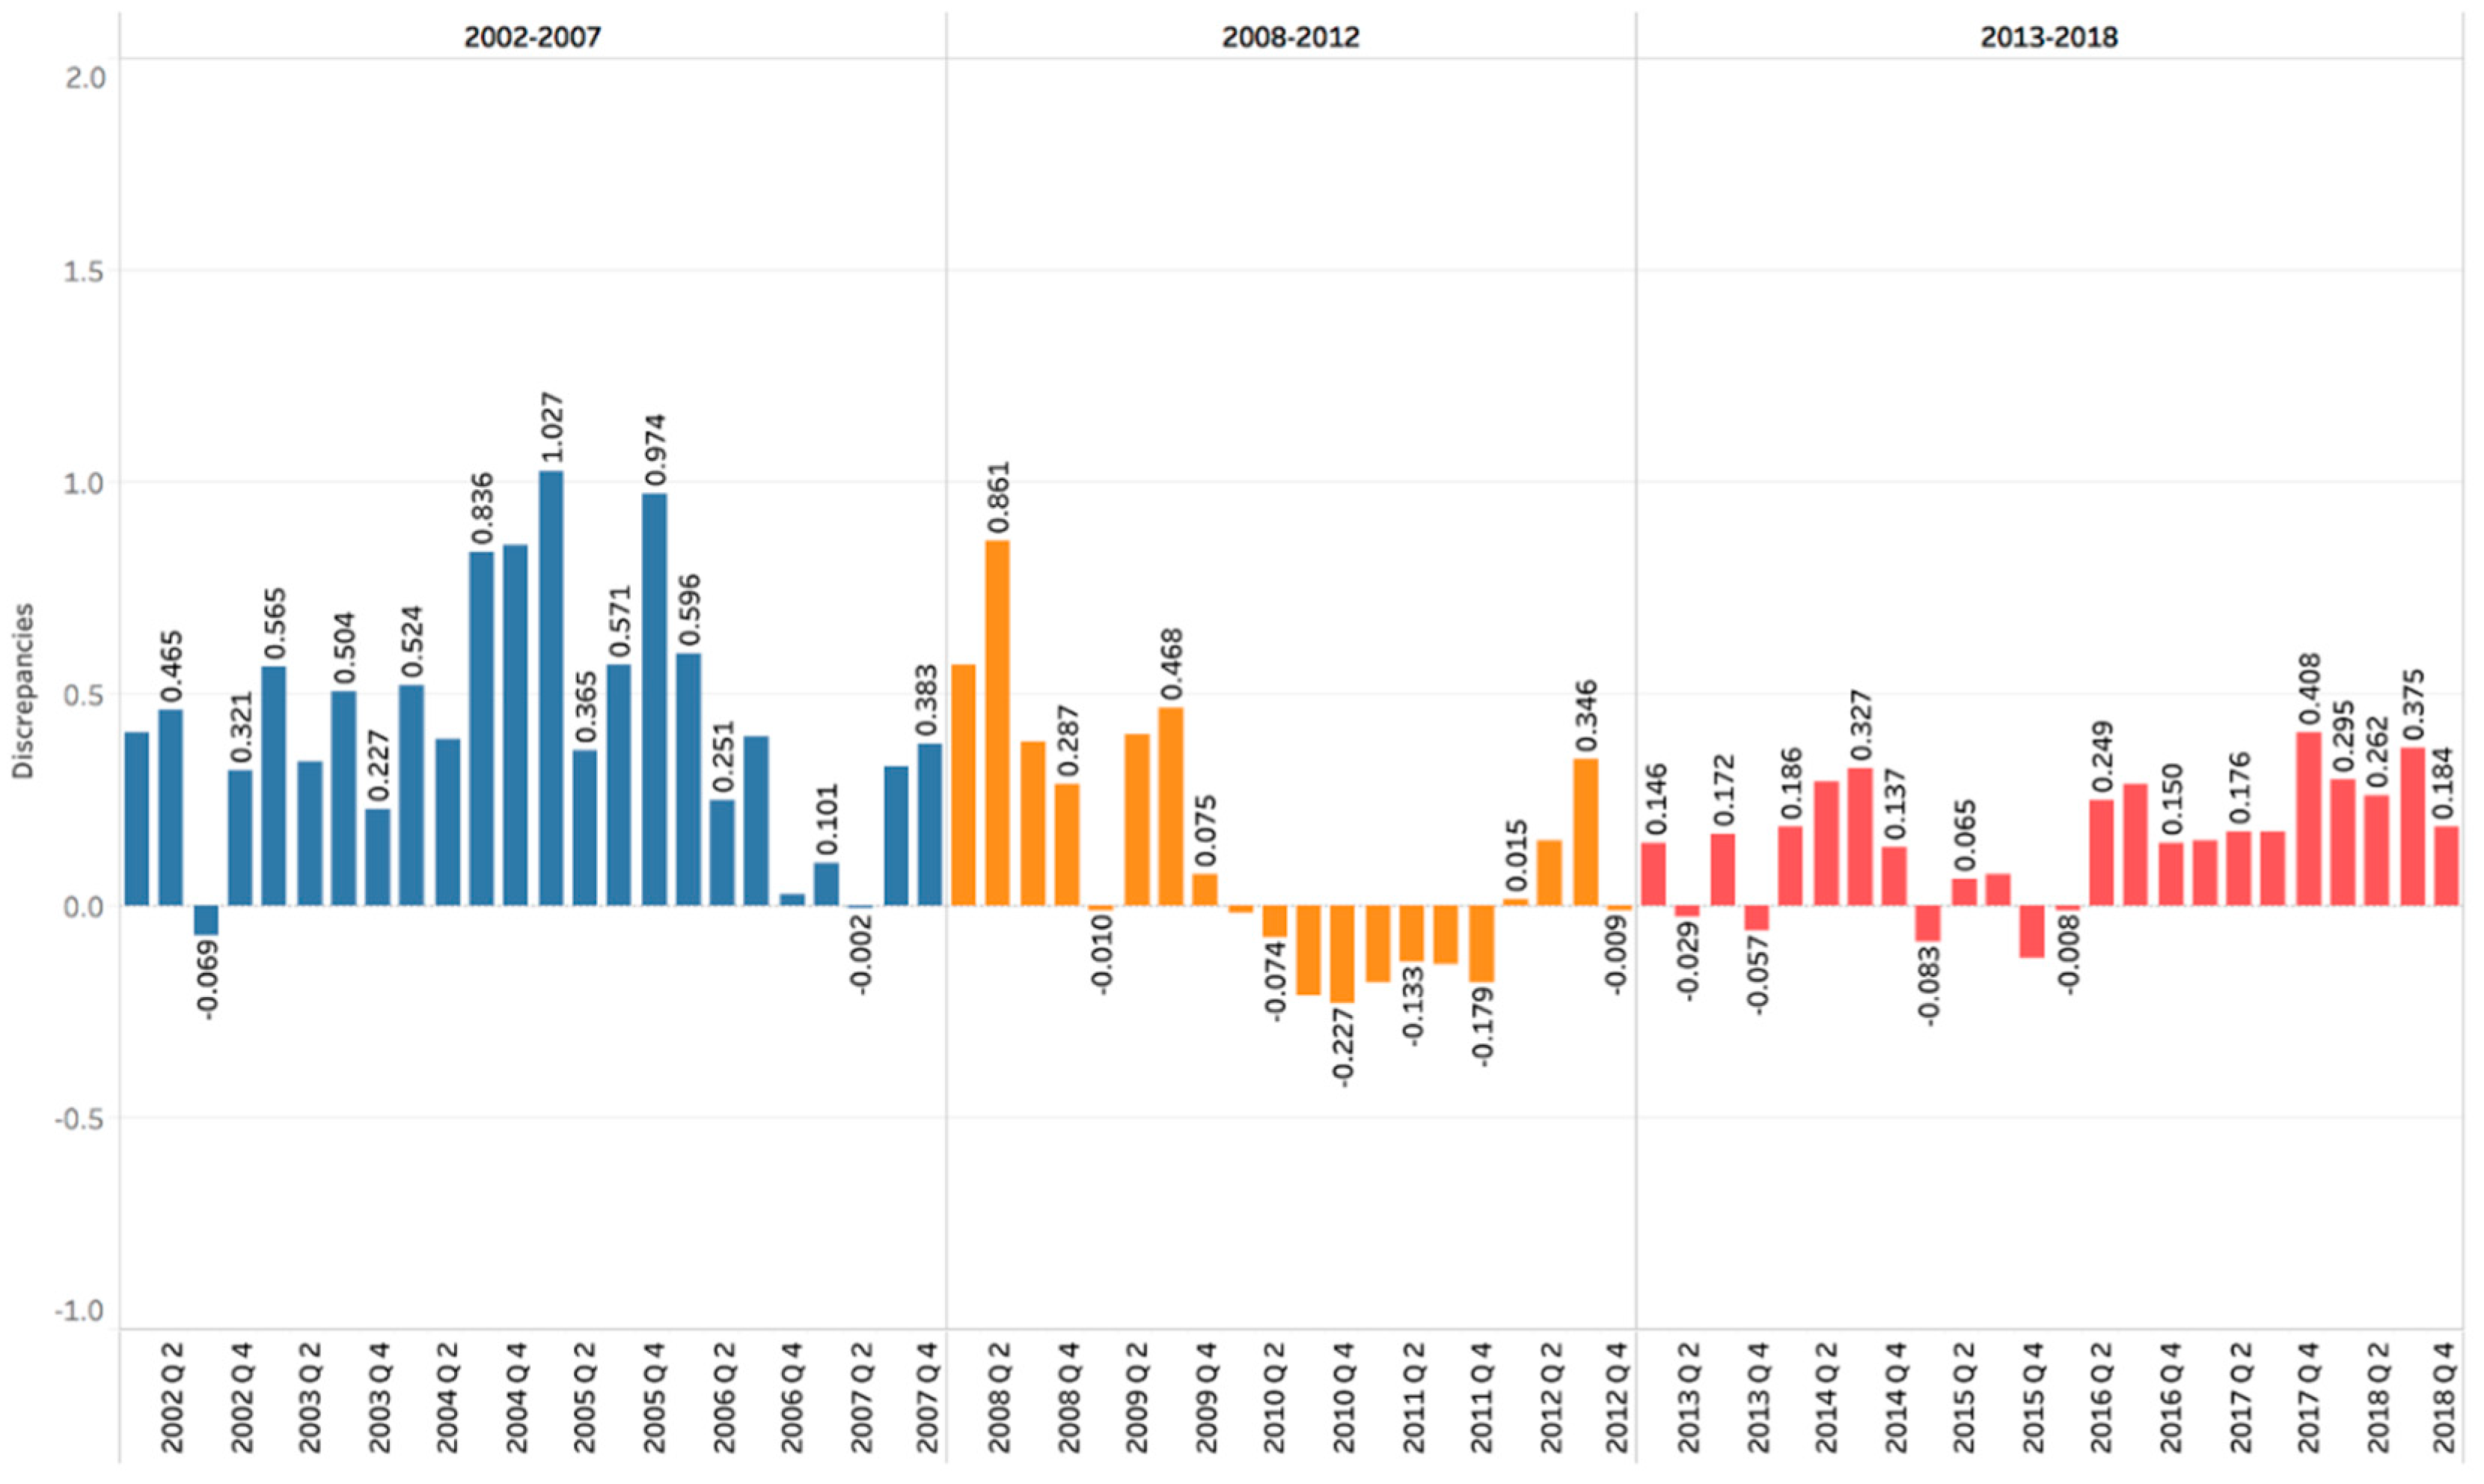
In addition, overall trade discrepancies in logs and lumber have been reduced significantly since 2008 (see Figure 5). This may due to the implementation of the U.S. Lacey Act 2008, which impacted the Chinese timber trade [39,42]. Imported logs and lumber in China are heavily used for manufacturing furniture and wooden flooring and are mainly exported to the U.S. and Europe. With the growing recognition of legality sourcing and the certification of forest products, Chinese exporters have begun to prefer the importation of legally sourced logs and lumber from the U.S. [58,59]. The trade statistics also showed that China has concentrated on importing logs and lumber from the U.S., Canada, New Zealand, and Russia, which are not suspected as countries that employ illegal sourcing (there is some suspicion regarding hardwood log exports from Russia, but this has been diminished significantly). Thus, fewer trade discrepancies are expected as a result of this timber legality legislation, and this may be the reason for why overall trade discrepancies are decreasing with time. In summary, government policies, both legality policies and export bans play an important role in influencing the trade discrepancies.
It should be noted that there are still some discrepancies in logs and lumber trade with China. As discussed above, these trade discrepancies are possibly due to re-exports and transshipment, misreporting or misclassification. This research has helped identify areas in need of further examination. Though the time-lagged function reduced part of the trade discrepancies in this study, the adjusted transport time did not fully explain the trade discrepancies. To determine an exact shipping time, further information and documents are needed. Further adjustments through considerable investigations and statistical methods are also worth considering.
Minimizing trade discrepancies can not only reduce the loss of trade revenue and avoid conflicts caused by trade imbalances but also provide policymakers with a reliable reference basis. Legislators, government bureaucrats, business leaders and academic researchers who rely on international trade data, therefore, expect and support efforts to improve trade statistics. Exploring the influencing factors in various countries associated with trade discrepancies at the disaggregated product level helps us to propose management and supervision suggestions and insights regarding irregular behaviors and activities to ensure the sustainability of the timber trade.
Recommendations for further reducing and eliminating trade discrepancies include the following. Strict timber harvesting and the trading system should continue to be improved and established to help local governments eliminate corruption, misreporting, and smuggling. Fair competition for sustainably produced timber products and the legal supply chain of raw materials from the forest sector must be encouraged and enabled within timber markets. It is also necessary to strengthen international cooperation in trade statistics. The trade statistics system requires data from all participating countries involved in trade and investment between countries and even subdivides into international import and export enterprises. The great amount of data needed are difficult to obtain by one country alone. International cooperation to improve the accuracy of trade statistics should be pursued.

5. Conclusions

This study developed a time-lagged function to calculate the timber trade discrepancies between China and its partner countries, with some adjustments associated with shipment issues and statistical errors, then discussed possible factors and incentives for specific trade discrepancies. The range of overall discrepancies in the logs and lumber trade statistics have been significantly reduced over time. However, both trend analyses and statistical tests indicated that there are still large discrepancies at a disaggregated level, especially for hardwood logs and tropical countries. To provide a more specific understanding of the trade discrepancies, the trans-shipment or re-export through the European and Latin American countries may explain the large negative trade discrepancies in France and Chile, and misclassification and misreporting are considered to explain a significant proportion of the large positive trade discrepancies in Southeast Asian and African countries like Ghana, Indonesia, the Philippines, and Thailand.
Given the expansion and development of the timber trade market, government policies, especially legality regulation and export bans, may play an important role in the variation of timber trade discrepancies. More specifically, Ghana, Indonesia, Thailand, and the Philippines have reported positive trade discrepancies, which indicated that these countries reported much lower export values than China reported as imports. If exporters under-report quantities intentionally in order to evade export taxes or quotas, then one might expect the reported exports to be lower than the reported imports. It is widely recognized that under-reporting, non-reporting or misclassification may exist due to poor management systems and corruption in local governments, which lead to significant trade discrepancies. However, with smaller amounts of China’s imported logs and lumber coming from Southeast Asia countries in recent years due to the implementation of legality policies and other improvements in trade control have narrowed the range of trade discrepancies for logs and lumber on the whole.
While intentional factors associated with trade discrepancies have recently attracted attention as potential illegal practices, there is not sufficient evidence to indicate and detect these using the current official datasets. The identification of detailed behaviors associated with trade discrepancies requires further and considerable investigations or interviews. Then a more in-depth analysis and adjustment of these problematic trade discrepancies should be conducted to determine the incentives for possible factors, and recommendations and policies should be developed to reduce the discrepancies in trade statistics and facilitate sustainable timber trade in the future.

Author Contributions

Conceptualization, F.L. and I.G.; methodology and formal analysis, F.L.; writing—original draft preparation, F.L.; writing—review and editing, K.W., I.G. and M.H.; visualization, F.L.; supervision, I.G. and M.H. All authors have read and agreed to the published version of the manuscript.

Funding

This research received no external funding.

Acknowledgments

This work was supported by the China Scholarship Council (CSC, grant number 201606510048) to perform the research project by Fei Liu in CINTRAFOR at the University of Washington supervising by Indroneil Ganguly. The authors acknowledge three anonymous reviewers for constructive comments on the original manuscript.

Conflicts of Interest

The authors declare no conflict of interest.

Appendix A

Table A1. Sample selected for China’s log and lumber import partners.
CountriesLogsLumberLogs and Lumber
HardwoodSoftwoodHardwoodSoftwoodHardwoodSoftwood
AustraliaXXXXXX
BrazilXXXXXX
CanadaXXXXXX
Chile X X
FranceXXX XX
GermanyXXXXXX
IndonesiaX X X
Japan XXXXX
MalaysiaX X X
New ZealandXX XXX
PhilippinesX X X
RussiaXXXXXX
ThailandX X X
Ukraine XXXXX
United StatesXXXXXX
GhanaX X X

References

  1. GTIS Global Trade Atlas ®. 2019. Available online: https://www.gtis.com/gta/secure/default.cfm (accessed on 30 August 2019).
  2. Blundell, A.G.; Mascia, M.B. Discrepancies in Reported Levels of International Wildlife Trade. Conserv. Biol. 2005, 19, 2020–2025. [Google Scholar] [CrossRef]
  3. Pepke, E. International Forest Products Statistics: Growing and better than ever! For. Prod. J. 2002, 52, 12–23. [Google Scholar]
  4. Federico, G.; Tena, A. On the accuracy of foreign trade statistics (1909–1935): Morgenstern revisited. Explor. Econ. Hist. 1991, 28, 259–273. [Google Scholar] [CrossRef]
  5. Makhoul, B.; Otterstrom, S.M. Exploring the accuracy of international trade statistics. Appl. Econ. 1998, 30, 1603–1616. [Google Scholar] [CrossRef]
  6. Keong, C.H. CITES as a tool in combating illegal logging. Int. For. Rev. 2007, 9, 805–810. [Google Scholar] [CrossRef]
  7. Giurca, A.; Jonsson, R.; Rinaldi, F.; Priyadi, H. Ambiguity in Timber Trade Regarding Efforts to Combat Illegal Logging: Potential Impacts on Trade between South-East Asia and Europe. Forests 2013, 4, 730–750. [Google Scholar] [CrossRef] [Green Version]
  8. Hamanaka, S. Quality of the Trade Statistics of the Lao PDR: Incompatibility with International Standards and Inaccuracies Due to Smuggling. South East Asia Res. 2011, 19, 595–633. [Google Scholar] [CrossRef]
  9. Vincent, J.R. Detecting Illegal Trade Practices by Analyzing Discrepancies in Forest Products Trade Statistics: An Application to Europe, with a Focus on Romania; Policy Research Working Papers; The World Bank: Washington, DC, USA, 2004. [Google Scholar]
  10. McDonald, D.C. Trade Data Discrepancies and the Incentive to Smuggle: An Empirical Analysis (Divergences dans les donnees sur les echanges commerciaux et attrait de la contrebande: Analyse empirique) (Discrepancias de los datos sobre el comercio e incentivo al contrabando: Analisis empirico). IMF Staff Pap. 1985, 32, 668–692. [Google Scholar]
  11. Fung, K.C.; Lau, L.J. The China–United States Bilateral Trade Balance: How Big Is It Really? Pac. Econ. Rev. 1998, 3, 33–47. [Google Scholar] [CrossRef]
  12. Hamanaka, S. Whose trade statistics are correct? Multiple mirror comparison techniques: A test case of Cambodia. J. Econ Policy Reform 2012, 15, 33–56. [Google Scholar] [CrossRef]
  13. Eastin, I.; Perez-Garcia, J. Discrepancies in forest products trade statistics. For. Chron. 2003, 79, 1084–1092. [Google Scholar] [CrossRef] [Green Version]
  14. Luppold, W.G. Causes and Remedies for Errors in International Forest Products Trade Data: Examples from the Hardwood Trade Statistics. For. Sci. 1995, 41, 278–283. [Google Scholar]
  15. Carreras-Marin, A.; Badia-Miro, M. Geographical Deviations in Foreign Trade Statistics: A Study into European Trade with Latin American Countries, 1925. SSRN Electron. J. 2005. [Google Scholar] [CrossRef] [Green Version]
  16. Marquez, J.; Workman, L. Modeling the IMF’s Statistical Discrepancy in the Global Current Account. IMF Staff Pap. 2001, 48, 499–521. [Google Scholar] [CrossRef] [Green Version]
  17. Dong, G.; Colin, W.; Norihiko, Y. Towards Harmonised Bilateral Trade Data for Inter-Country Input-Output Analyses: Statistical Issues; Statistical Analysis of Science, Technology and Industry: Pairs, France, 2009. [Google Scholar]
  18. Bhagwati, J.N. Alternative theories of illegal trade: Economic consequences and statistical detection. Weltwirtschaftliches Arch. 1981, 117, 409–427. [Google Scholar] [CrossRef]
  19. Patnaik, I.; Sen Gupta, A.; Shah, A. Determinants of Trade Misinvoicing. Open Econ. Rev. 2012, 23, 891–910. [Google Scholar] [CrossRef] [Green Version]
  20. Qureshi, T.A.; Mahmood, Z. The Size of Trade Misinvoicing in Pakistan. MPRA Paper No. 65801; University Library of Munich: Munich, Germany, 2015. [Google Scholar]
  21. Fung, H.-G.; Yau, J.; Zhang, G. Reported trade figure discrepancy, regulatory arbitrage, and round-tripping: Evidence from the China—Hong Kong trade data. J. Int. Bus. Stud. 2011, 42, 152–176. [Google Scholar] [CrossRef]
  22. Report on the Statistical Discrepancy of Merchandise Trade between the United States and China (October 2009); Ministry of Commerce PRC and US Department of Commerce: Beijing, China, 2009; p. 20.
  23. Report (Phase II) on the Statistical Discrepancy in China-US Merchandise Trade; Ministry of Commerce PRC and US Department of Commerce: Beijing, China, 2012.
  24. Feenstra, R.C.; Hai, W.; Woo, W.T.; Yao, S.L. Discrepancies in international data: An application to China-Hong Kong entrepot trade. Am. Econ. Rev. 1999, 89, 338–343. [Google Scholar] [CrossRef]
  25. Hammer, A.; Lin, J.; Wang, Z. Methodology of U.S.-China-Hong Kong Triangular Merchandise Trade Statistic Reconciliation; U.S. International Trade Commission: Washington, DC, USA, 2013. [Google Scholar]
  26. Jiang, X.; Kong, Y.; Li, X.; Yang, C.; Chen, X. Re-estimation of China-EU trade balance. China Econ. Rev. 2019, 54, 350–366. [Google Scholar] [CrossRef]
  27. Day, I. Assessing China’s Merchandise Trade Data Using Mirror Statistics; Reserved Bank of Australia-Bulletin: Sydney, Australia, 2015. [Google Scholar]
  28. Benita, F.; Urzúa, C.M. Mirror trade statistics between China and Latin America. J. Chin. Econ. Foreign Trade Stud. 2016, 9, 177–189. [Google Scholar] [CrossRef]
  29. Phan, T.T.H. Mirror Study of Vietnam’s International Merchandise Trade: Findings and Implications on Cross-Border Trade Administration; SECO/WTI Academic Cooperation Project Working Paper Series No. 26; World Trade Institute University of Bern: Bern, Switzerland, 2017. [Google Scholar]
  30. Ferrantino, M.J.; Wang, Z. Accounting for discrepancies in bilateral trade: The case of China, Hong Kong, and the United States. China Econ. Rev. 2008, 19, 502–520. [Google Scholar] [CrossRef]
  31. Ferrantino, M.J.; Liu, X.P.; Wang, Z. Evasion behaviors of exporters and importers: Evidence from the U.S.-China trade data discrepancy. J. Int. Econ. 2012, 86, 141–157. [Google Scholar] [CrossRef]
  32. Kostecki, M.; Tymowski, M. Inaccuracy in foreign trade statistics of LDCs: The case of the ASEAN area. Intereconomics 1984, 19, 197–201. [Google Scholar] [CrossRef] [Green Version]
  33. Fung, K.C.; Lau, L.J. New estimates of the United States-China bilateral trade balances. J. Jpn. Int. Econ. 2001, 15, 102–130. [Google Scholar] [CrossRef]
  34. Guan, Z.J.; Gong, P.C. The impacts of international efforts to reduce illegal logging on China’s forest products trade flow. China Agric. Econ. Rev. 2015, 7, 467–483. [Google Scholar] [CrossRef]
  35. Dieter, M. Analysis of trade in illegally harvested timber: Accounting for trade via third party countries. For. Policy Econ. 2009, 11, 600–607. [Google Scholar] [CrossRef]
  36. Laurance, W.F.; Wang, G.; Innes, J.L.; Wu, S.W.; Dai, S.; Lei, J. The Need to Cut China’s Illegal Timber Imports. Science 2008, 319, 1184b–1185b. [Google Scholar] [CrossRef]
  37. Ministry of Commerce of People’s Republic of China. 2020. Available online: http://www.mofcom.gov.cn/ (accessed on 4 February 2020).
  38. SFA State Forestry Administration. 2020. Available online: http://www.forestry.gov.cn/ (accessed on 4 February 2020).
  39. Prestemon, J.P. The impacts of the Lacey Act Amendment of 2008 on US hardwood lumber and hardwood plywood imports. For. Policy Econ. 2015, 50, 31–44. [Google Scholar] [CrossRef]
  40. Simeone, J. Timber export taxes and trade between Russia and China: Development of the forestry sector in the Russian Far East. For. Chron. 2012, 88, 585–592. [Google Scholar] [CrossRef] [Green Version]
  41. Lesniewska, F.; McDermott, C.L. FLEGT VPAs: Laying a pathway to sustainability via legality lessons from Ghana and Indonesia. For. Policy Econ. 2014, 48, 16–23. [Google Scholar] [CrossRef]
  42. Janzen, N.; Weimar, H. Market Coverage of the EUTR—What Share of Wood Imports into the EU is Covered by the EUTR? Drewno 2016, 59, 25–39. [Google Scholar]
  43. WRI Forest Legality. 2020. Available online: https://forestlegality.org/content/logging-and-export-bans (accessed on 4 February 2020).
  44. Wellesley, L. Trade in Illegal Timber: The Response in China; Chatham House: London, UK, 2014; p. 31. [Google Scholar]
  45. WCO World Customs Organization. 2019. Available online: http://www.wcoomd.org/en/ (accessed on 30 August 2019).
  46. Rozanski, J.; Yeats, A. On the (in) accuracy of economic observations: An assessment of trends in the reliability of international trade statistics. J. Dev. Econ. 1994, 44, 103–130. [Google Scholar] [CrossRef]
  47. Shen, G. Trade Statistical Discrepancies and U.S.-China Trade Balance Issues. Econ. Res. 2015, 6, 82–93. [Google Scholar]
  48. Peres-Cajías, J.A.; Carreras-Marín, A. Official Bolivian Trade Statistics (1910–1949): Landlockness and the limits of a standard accuracy approach. Rev. Hist. Económica-J. Iber. Lat. Am. Econ. Hist. 2018, 36, 53–86. [Google Scholar] [CrossRef] [Green Version]
  49. Vézina, P.-L. Illegal trade in natural resources: Evidence from missing exports. Int. Econ. 2015, 142, 152–160. [Google Scholar] [CrossRef] [Green Version]
  50. Abdul Rahim, A.S.; Othman, M.S.H. Sustainable forest management and west Malaysian sawntimber supply analysis. J. Sustain. Dev. 2009, 2, 58–64. [Google Scholar]
  51. Zhang, X.; Xu, B.; Wang, L.; Yang, A.; Yang, H. Eliminating Illegal Timber Consumption or Production: Which Is the More Economical Means to Reduce Illegal Logging? Forests 2016, 7, 191. [Google Scholar] [CrossRef] [Green Version]
  52. Franck, M.; Hansen, C.P. How effective are task forces in tackling illegal logging? Empirical evidence from Ghana. Int. For. Rev. 2014, 16, 354–362. [Google Scholar] [CrossRef]
  53. Hansen, C.P.; Treue, T. Assessing illegal logging in Ghana. Int. For. Rev. 2008, 10, 573–590. [Google Scholar] [CrossRef]
  54. Hansen, C.P.; Damnyag, L.; Obiri, B.D.; Carlsen, K. Revisiting illegal logging and the size of the domestic timber market: The case of Ghana. Int. For. Rev. 2012, 14, 39–49. [Google Scholar] [CrossRef]
  55. Jairo, C. Sustainable Timber Trade: Are Discrepancies in Trade Data Reliable Indicators of Illegal Activities; Food and Agricultural Organization of the United Nations (FAO) Regional Office for Asia and the Pacific: Bangkok, Thailand, 2012. [Google Scholar]
  56. Obidzinski, K.; Andrianto, A.; Wijaya, C. Cross-border timber trade in Indonesia: Critical or overstated problem? Forest governance lessons from Kalimantan. Int. For. Rev. 2007, 9, 526–535. [Google Scholar] [CrossRef]
  57. Varangis, P.N.; Braga, C.A.P.; Takeuchi, K. Tropical Timber Trade Policies: What Impact Will Eco-Labelling Have; The World Bank: Washington, DC, USA, 1993. [Google Scholar]
  58. Lu, Z.; Ganguly, I.; Eastin, I. Changes in Chinese wood-based exports to the U.S.: Post Lacey Act amendment. For. Chron. 2014, 90, 660–665. [Google Scholar] [CrossRef] [Green Version]
  59. Lu, Z.; Ganguly, I.; Eastin, I. A categorical modeling approach to analyzing the impacts of the Lacey Act 2008 amendment on Chinese companies’ export cost and the implications on their sourcing behaviors. Can. J. For. Res. 2015, 45, 1806–1815. [Google Scholar] [CrossRef] [Green Version]
Figure 1. Global wooden furniture and panels export value in 2018. (a) Export value of wood panels. (b) Export value of wood furniture. Data source: Global Trade Information Services (GTIS).
Forests 11 00205 g001
Figure 2. China’s log and lumber imports quantities from reporting countries from 2002 to 2018. Figure description: the total supply is displayed by lines, and the selected partners’ total supply is displayed by the bars. The different colors show the percentage change of these supplying countries in the figure. Data source: GTIS.
Forests 11 00205 g002
Figure 3. Timeline of China and its partners’ government policies on forest harvesting and timber trade. Source: Ministry Commerce of China [37] and World Resource Institute [43].
Forests 11 00205 g003
Figure 4. Trade-discrepancy ratios for logs and lumber. Figure description: This figure shows the trade-discrepancy ratios for logs and lumber, calculated using 16 partner countries’ quarterly data. Three-time periods were divided to display the variations of trade discrepancies. The “zero” tick line on the Y-axis is considered the non-discrepancy line, which is the so-called “baseline” and means that imports equal exports. The data over the baseline represent under-reported exports, and the data below the baseline represent under-reported imports.
Forests 11 00205 g004
Figure 5. Trade discrepancy ratios for logs and lumber import. Figure description: The red line is the “zero” line or baseline, and the area between the two grey lines is the “normal” range of discrepancies, which was estimated by approximately one standard deviation of the mean discrepancy.
Forests 11 00205 g005
Figure 6. Trade discrepancy ratios for logs import.
Forests 11 00205 g006
Figure 7. Trade discrepancy ratios for hardwood logs import.
Forests 11 00205 g007
Figure 8. Trade discrepancy ratios for softwood logs import.
Forests 11 00205 g008
Figure 9. Trade discrepancy ratios for lumber import.
Forests 11 00205 g009
Figure 10. Trade discrepancy ratios for hardwood lumber import.
Forests 11 00205 g010
Figure 11. Trade discrepancy ratios for softwood lumber import.
Forests 11 00205 g011
Figure 12. China’s imports compared with Ghana’s reported hardwood logs and lumber exports.
Forests 11 00205 g012
Table 1. Summary of factors contributing to discrepancies in timber products trade.
Type of Activity or BehaviorDescription and Explanation of Factors Contributing to Discrepancies
Unintentional Factors
Shipment issuesTime-lag between export and import
  • Products exported during one reporting time period do not arrive at the importing country, until the following time period [11,12].
  • Time-lag often happens with sea shipping, which is the common shipping method of timber.
Combined shipment of mixed products
  • The mixed products are checked by the custom agents but are sometimes accidentally misclassified or misreported; they can be considered as processing errors [13].
Transshipment or re-export
  • Transshipment is where product exports pass through a third country before arriving at their destination, accounting for some trade discrepancies due to origin recording rules [14].
  • The location of exporters/importers (e.g., landlocked countries) and high trade costs are reasons for the so-called triangular trade between two countries and the resulting discrepancies [15].
Statistical/measurement errorsDifferences in log scaling methods
  • The log scaling methods used by the importing country and exporting country are different (e.g., constant diameter vs. significant taper) [13].
Volume or unit conversions
  • Some statistical errors exist in the processing of the conversion between different measurement units based on species, log diameters, or product shapes [12].
Unintentional data collection and processing errors
  • Unexplained anomalies within the data, that can be isolated and identified by government agencies (e.g., customs or individual ports), recognized as processing errors or recording errors.
  • Complex trade rules and the inadequate training of officials contribute to misclassification or misreporting.
Government regulations/policiesDifferent product classification systems
  • Data from different classifications cannot be compared (e.g., the STIC system vs. HS coding) [16,17].
  • Product categories are updated but are not implemented on exactly the same time schedule.
Poor management and communication systems
  • There are insufficient mechanisms in place to ensure the validity of trade data at every level of reporting (e.g., from the port and the district to the regional and national levels) [13].
Intentional Factors
MisreportingUnder-reporting or non-reporting product volume
  • The trade data are recorded at lower than the real quantities when the goods imported or exported go through the legal checkpoints [18].
  • Non-reporting is where no trade data are recorded on one or both side, bypassing legal channels [18].
  • Shippers fail to file customs declaration for products crossing borders [14].
  • Government trade restrictions are often a reason for exporters or importers misreport volumes (e.g., CITES trade restrictions, log export ban and timber legality regulations) [6].
  • Exporters/importers have economic incentives to intentionally under-report or not report the export volume (e.g., avoiding export/import tariffs or quotas) [19,20,21].
MisclassificationMisclassification of product types or characteristics; species or grade
  • The partial or whole goods quantities are recorded as other types or species when goods imported or exported bypass the legal checkpoints [12].
  • Exporters/importers have economic incentives to intentionally misclassify their products (e.g., high trade tariffs and government trade restrictions) [12].
Table 2. The average transportation time between China and its partner countries.
Countries.T (months)CountriesT (months)
Australia0.60Malaysia0.34
Brazil1.15New Zealand0.67
Canada0.67Philippines0.23
Chile1.15Russia1.20
France1.00Thailand0.34
Germany1.10Ukraine1.00
Indonesia0.30United States0.78
Japan0.10Ghana1.34
Table 3. Measured example of China–U.S. lumber trade discrepancies in 2015.
Process 1st Quarter 2nd Quarter 3rd Quarter 4th Quarter
Raw data: Export volume (m3)566,494548,681550,375577,847
Raw data: Import volume (m3)534,092640,156528,120681,503
Discrepancies (using Equation (3), not new exports)−0.0590.154−0.0410.165
Time-lag Adjusted Factor (using Equation (1))1.0480.9511.0690.963
New exports with time-lag adjusted factor (using Equation (2)) (m3)540,548576,952514,850600,049
Discrepancies with time-lag adjusted factor (using Equation (4))−0.0120.1040.0250.127
The gap between the trade discrepancies with time-lag adjusted factor and without time-lag adjusted factor0.0470.0500.0670.038
Table 4. Description statistics of trade-discrepancy ratios and results of an independent t-test for basic comparisons.
CategoriesMeanSDMinMaxVarianceSkewnessKurtosist-Value
StatisticSE
logs1.2770.0872.765−8.47411.3617.6431.3881.91714.115
lumber0.1690.0451.496−6.8588.3292.2372.58612.004
hardwood0.4770.0531.650−6.85812.2982.7232.37910.40619.772
softwood−0.1740.0371.025−7.2047.4931.051−1.63419.234
developing countries0.8930.0402.558−8.47412.2986.5411.5372.84120.475
developed countries0.0190.0150.923−8.1888.4160.853−1.43923.988
non-tropical countries0.0140.0141.058−8.4749.0961.119−0.17519.200−24.916
tropical countries1.7760.0693.136−7.19912.2989.8320.9060.170
Table 5. Results of one-way ANOVA tests for the timeline.
Time period
Categories2002–20072008–20122013–2018F-Valuep-ValueEffect size
MeanSDMeanSDMeanSD
Hardwood logs1.3552.5601.7223.3871.9372.9902.8890.0560.007
Softwood logs−0.4272.166−0.1111.8890.0831.0594.9970.0070.015
Hardwood lumber0.7612.2060.2141.4040.2640.76711.7650.0000.024
Softwood lumber0.0170.939−0.1440.723−0.3230.36513.5240.0000.038
Developing countries0.9732.7520.9052.5880.8022.3161.6190.1980.001
Developed countries0.0571.110−0.1640.9230.1330.66935.9590.0000.018
Non-tropical countries0.0571.268−0.0851.1450.0540.68211.0840.0000.004
Tropical countries1.8913.3351.7403.1341.6932.9250.7780.4590.001

