Article

Changes of Tree Species Composition and Distribution Patterns in Mts. Jiri and Baegun, Republic of Korea over 15 Years

1
Research Institute of Agriculture and Life Sciences, Seoul National University, Seoul 08826, Korea
2
Department of Forest Sciences, Seoul National University, Seoul 08826, Korea
3
National Center for AgroMeteorology, Seoul National University, Seoul 08826, Korea
4
Forest Ecology and Climate Change Division, National Institute of Forest Science, Seoul 02455, Korea
5
Korea Seoul National University Forest, Seoul National University, Seoul 08826, Korea
6
Interdisciplinary Program in Agricultural and Forest Meteorology, Seoul National University, Seoul 08826, Korea
*
Author to whom correspondence should be addressed.
Forests 2020, 11(2), 186; https://doi.org/10.3390/f11020186
Submission received: 9 December 2019 / Revised: 29 January 2020 / Accepted: 5 February 2020 / Published: 7 February 2020
(This article belongs to the Special Issue Forest Stand Dynamics and Its Applications)

Abstract

:
Long-term changes in the abundance and distribution of tree species in the temperate forests of South Korea remain poorly understood. We investigated the changes in tree species composition in temperate mountainous forests using survey data from 130 permanent plots (0.1 ha) from the past 15 years (1998–2012) distributed across Mts. Jiri and Baegun, South Korea. The tree communities showed positive net changes in terms of stand density, richness, diversity, and evenness. At the species level, the change in relative species composition has been mainly driven by species such as Quercus mongolica, Carpinus laxiflora, Quercus serrata, Quercus variabilis, Styrax japonicus, Lindera erythrocarpa, and Pinus densiflora. These changes were categorized into five groups representing gradual increase or decrease, establishment, extinction, or fluctuation in species populations. At the community level, the changes in species composition showed consistent and directional increases in the annual rate of change for the mean species traits, including stand prevalence, pole growth rate, adult growth rate, and adult stature. Based on additive models, topographic variables (elevation, latitude, longitude, slope, topographic wetness index, and curvature) were more strongly associated with the distribution of species diversity than climate variables (annual mean minimum and maximum temperatures, temperature seasonality, annual rainfall, rainfall seasonality). Elevation was the most significant driver, followed by latitude and longitude. This study reveals the dynamics of change in tree species composition and distribution along topographical and climate gradients in South Korea and contributes to a broader understanding of temperate forest ecosystems for the purpose of better forest management.

1. Introduction

Changes in species composition, abundance, and forest structure have accelerated and become unpredictable in response to the combined impacts of increased abiotic (droughts and extreme high temperatures) and biotic (pathogens and insects) pressures [1,2,3,4]. These forest changes are important ecosystem-level responses to global change. Studies of long-term changes in forest ecosystems are thus crucial for understanding the impacts of past disturbances and for comprehensive assessments of changes in forest communities to enable better forest management and decision-making [5]. To understand regional and local-level responses to long-term changes in forest ecosystems, a variety of long-term ecological studies have been conducted worldwide by means of nationwide forest inventories [6,7,8,9,10,11,12] and have revealed changes in demography, species composition, and forest structure [13,14,15]. For instance, Lima et al. examined temporal changes in the species composition, diameter growth, and persistence of non-native species in Puerto Rico’s subtropical urban forest using 9 years of census data and found a high risk of mortality of invasive tree species for urban forest management [16]. Shen et al. revealed that the geographical patterns of tree species richness across China were mainly influenced by climate (ambient temperature) and historical floristic regions (temperate arid-inland, temperate humid, and humid subtropical regions), based on the survey data of tree species from 1494 plots on 63 mountains [17]. Sproull et al. investigated shifts in species composition, diversity, and distribution patterns in four herbaceous plant communities along an elevational gradient in Boulder, Colorado, U.S., using 17 and 32 year spans of census data. They found that changes in species composition were correlated with increased warming, overstory shifts, and local disturbance [18].
However, long-term studies in mountain forests across the East Asia Pacific region are, to date, little explored. The majority of long-term mountain forest studies across Asia have mainly been conducted in the forests of Japan and China [17,19,20,21,22]. However, many of these previous studies were confined to small-scale monitoring sites, which result in a lack of understanding of changes in tree species abundance across geographic gradients [19,20]. They also primarily focused on overall patterns of forest dynamics based on an analysis of snapshots of community change, providing little information to understand the underlying processes behind the compositional change at both species and community-levels [23,24]. Furthermore, these studies fail to provide a comprehensive assessment of environmental drivers of tree community dynamics, such as the effects of topography, climate, and biomass on species distribution.
To broaden our understanding of changes in temperate forest ecosystems in East Asia, we investigated changes in the distribution and abundance of tree species in the temperate forests of South Korea, using long-term (1998–2012) tree census data from 130 permanent plots. We examined changes in the abundance and distribution of tree species composition, richness, and diversity over a 15 year span with the goal of addressing the following questions: (1) how have species density, richness, diversity, and evenness changed over 15 years? (2) What are the drivers of shifts in tree species composition at the species and community levels? (3) What are the patterns of species diversity along topographical and climatic environment gradients?
To address these main questions, it is necessary to comprehensively assess the variation in structure in individual species, as well as in the whole community. For a general understanding of compositional change over the years, the overall net change in tree communities was examined with regard to stand density, richness, diversity, and evenness [25,26,27]. Species-level composition shifts were investigated by analyzing variation within each species, as well as the changing pattern of species distribution over the census periods under study. Changes in the underlying mechanisms at the community level were verified by estimating the annual rates of change in species life history attributes including stand prevalence, pole growth rate, adult growth rate and adult stature, and whether the species composition of the tree community has changed in a particular direction since the plot was established. We also compared differences in community change using the dissimilarity indices over the census periods. The distribution of species diversity and environmental relationships was examined through the use of generalized additive models [28] to understand the underlying processes behind compositional change.

2. Materials and Methods

2.1. Study Site and Data Collection

The study was based on 130 permanent plots across Mts. Jiri and Baegun in the southern region of the Rep. of Korea where Mt. Jiri was located 300 m above Mt. Baegun (Figure 1). The study areas (38 plots on Mt. Jiri and 92 plots on Mt. Baegun) were located in the temperate forest zone (Lat: 35.02–35.30°, Long: 127.53–127.66°) with large altitudinal variation (269~1353 m above the sea level). They have been under conservation for forest research since the 1950s’ Korean War. The forest vegetation in the study area mainly consisted of mixed coniferous, deciduous broadleaf, and woodland forests. The mean annual average temperatures of individual plots ranged from 6 to 14 °C, and the mean annual precipitation varied from 966 to 2527 mm, based on data from 15 weather stations near the study plots. Monthly temperatures varied considerably over the years across the sites, from −10.4 to 28.2 °C. Rainfall was highly seasonal, with approximately 70% of annual rainfall falling between June and September.
All plots were 20 × 50 m. In each plot, all woody stems ≥6 cm diameter at breast height (dbh) were measured for diameter and identified to species at four to six year intervals over fifteen years (1998–2012). The plots were first inventoried from 1998 to 2001 and resurveyed both between 2004–2007 and 2008–2012. Plot-level topographic features, including elevation, slope, aspect, curvature, and topographic wetness index (TWI), were obtained by analysis of a digital elevation model (DEM) with a 30 × 30 m pixel resolution using ArcGIS 10.1 [29], to verify their associations with species diversity in the generalized additive models. The slope ranged between 5 and 40 degrees and most plots were evenly distributed between 10 and 35 degrees. Aspect was described using a compass directed upslope, with eight directions: north, northeast, east, southeast, south, southwest, west, and northwest. The curvature ranged from −2 to 4 and the TWI from 7 to 15. Plot-level soil samples were collected from three depths (0–30 cm, 30–60 cm, 60–90 cm) of soil layers during the first inventory period. The texture of each soil layer was examined in the field and soil type was defined as clay, clay-loam, loam, rock, sandy, and sandy-loam soil for each plot, according to the soil texture triangle [30].
Plot-level climate variables (monthly mean of daily minimum and maximum temperatures, average temperature, and total precipitation) were estimated through multiple linear regression (MLR) models to examine the associations with species diversity in the generalized additive models. MLR models for four climate variables were developed separately for each census year and month (total 720 MLR models = 15 years × 12 months × four variables) using the ‘lm’ function of the stats library in the R version 3.3.0 environment [31]. In each MLR model, the plot-level topographical variables (elevation, latitude, longitude, slope, sin(aspect), and cos(aspect)) were used as predictor variables through a stepwise method. The accuracy of the MLR model was checked by comparing the predicted values of each climate variable for 15 weather stations with the monitoring data from 15 meteorological stations (average R2 = 0.98 ± 0.05). We then interpolated monthly climate variables for each study plot over the study periods (1998–2012) using individual MLR models with corresponding topographical variables. The indices of temperature and precipitation seasonality for each plot were calculated based on the coefficient of variation (CV) for monthly mean temperature and precipitation.

2.2. Data Analysis

Changes in the overall tree community were expressed in terms of stand density, species richness, diversity, and evenness over the three survey periods (1998–2001; 2004–2007; 2008–2012). The stand density and species richness were estimated based on individual tree species counted in the 130 plots over each survey period. Changes in species diversity were expressed by using the Shannon–Wiener diversity index [27] and the evenness index [26]. Changes in individual tree species were represented as the difference in tree numbers for each species and their relative abundances over the study periods and categorized into three groups: increasing, decreasing and fluctuating species. Community level compositional changes in each study plot were assessed by estimating the mean annual rates of change in community life history traits [15] and by calculating a Bray–Curtis (BC) dissimilarity index [32,33]. Life history traits included stand prevalence, pole and adult growth rates, and adult stature for each census period. Stand prevalence is the log number of stems. Pole and adult growth rates are defined as the mean diameter change of individual trees in the plot with a dbh of 6–20 cm and >20 cm, respectively. Both pole and adult growth rates were calculated as log(dbht + 1–dbht)/time. Adult stature is the 95% quantile of diameter measurements from each plot. Each life history trait was calculated separately for two terms (1st term: first~second periods, 2nd term: second~third periods). The mean annual rate of change for each life history trait was estimated by assessing a regression slope between life history traits and two terms. We used the mean annual rate of change as the measure of direction due to the compositional shift in community (plot). The significance of change (slope of each life history trait) was tested by bootstrapping (i.e., 5000 resamples) the rate of change and 95% confidence intervals obtained from 130 subplots. A binomial test was used to determine whether the rates of change were directional by testing whether increasing or decreasing rates of change were significantly different from 50% [34]. A Bray–Curtis (BC) dissimilarity index was used to identify patterns of overall compositional change within each 0.1 ha subplot level over the study periods. Generalized additive models (GAMs) [27] were developed to identify and understand the underlying relationships of topographical and climatic environments with the species diversity distribution over 15 years. Two separate GAMs were constructed to detect the independent effects of topographical and climatic drivers. Eight topographic variables (latitude, longitude, elevation, slope, TWI, aspect, curvature, and soil type) and six climate variables (annual mean monthly minimum, maximum, and mean temperatures, total precipitation, temperature seasonality, and precipitation seasonality) were used for Model 1 and 2, respectively. The distributional patterns of species diversity along topographic environment gradients and climate drivers were modeled by using a Gaussian distribution with an identity link function, using the ‘gam’ function of the mgcv library in the R version 3.3.0 environment [35] as follows:
  • Model 1: f(E(species diversity)) ~ (latitude) + s(longitude) + s(elevation) + s(slope) + s(TWI) + s(curvature) + factor(aspect) + factor(soil type);
  • Model 2: f(E(species diversity)) ~ s(monthly mean of daily minimum temperature) + s(monthly mean of daily maximum temperature) + s(monthly mean of daily average temperature) s(monthly mean of total precipitation) + s(monthly mean of temperature seasonality) + s(monthly mean of precipitation seasonality)
where E(species diversity) represents the mean species diversity in terms of an effective number of species for each census period. The cubic shrinkage spline smooth function and thin plate regression splines with shrinkage smooth function were selected as the best smoothing function (s) in Models 1 and 2, respectively. The smooth functions used in the model were selected based on Akaike’s information criteria (AIC).

3. Results

3.1. Overall Changes in Stand Density, Richness, Diversity, and Evenness

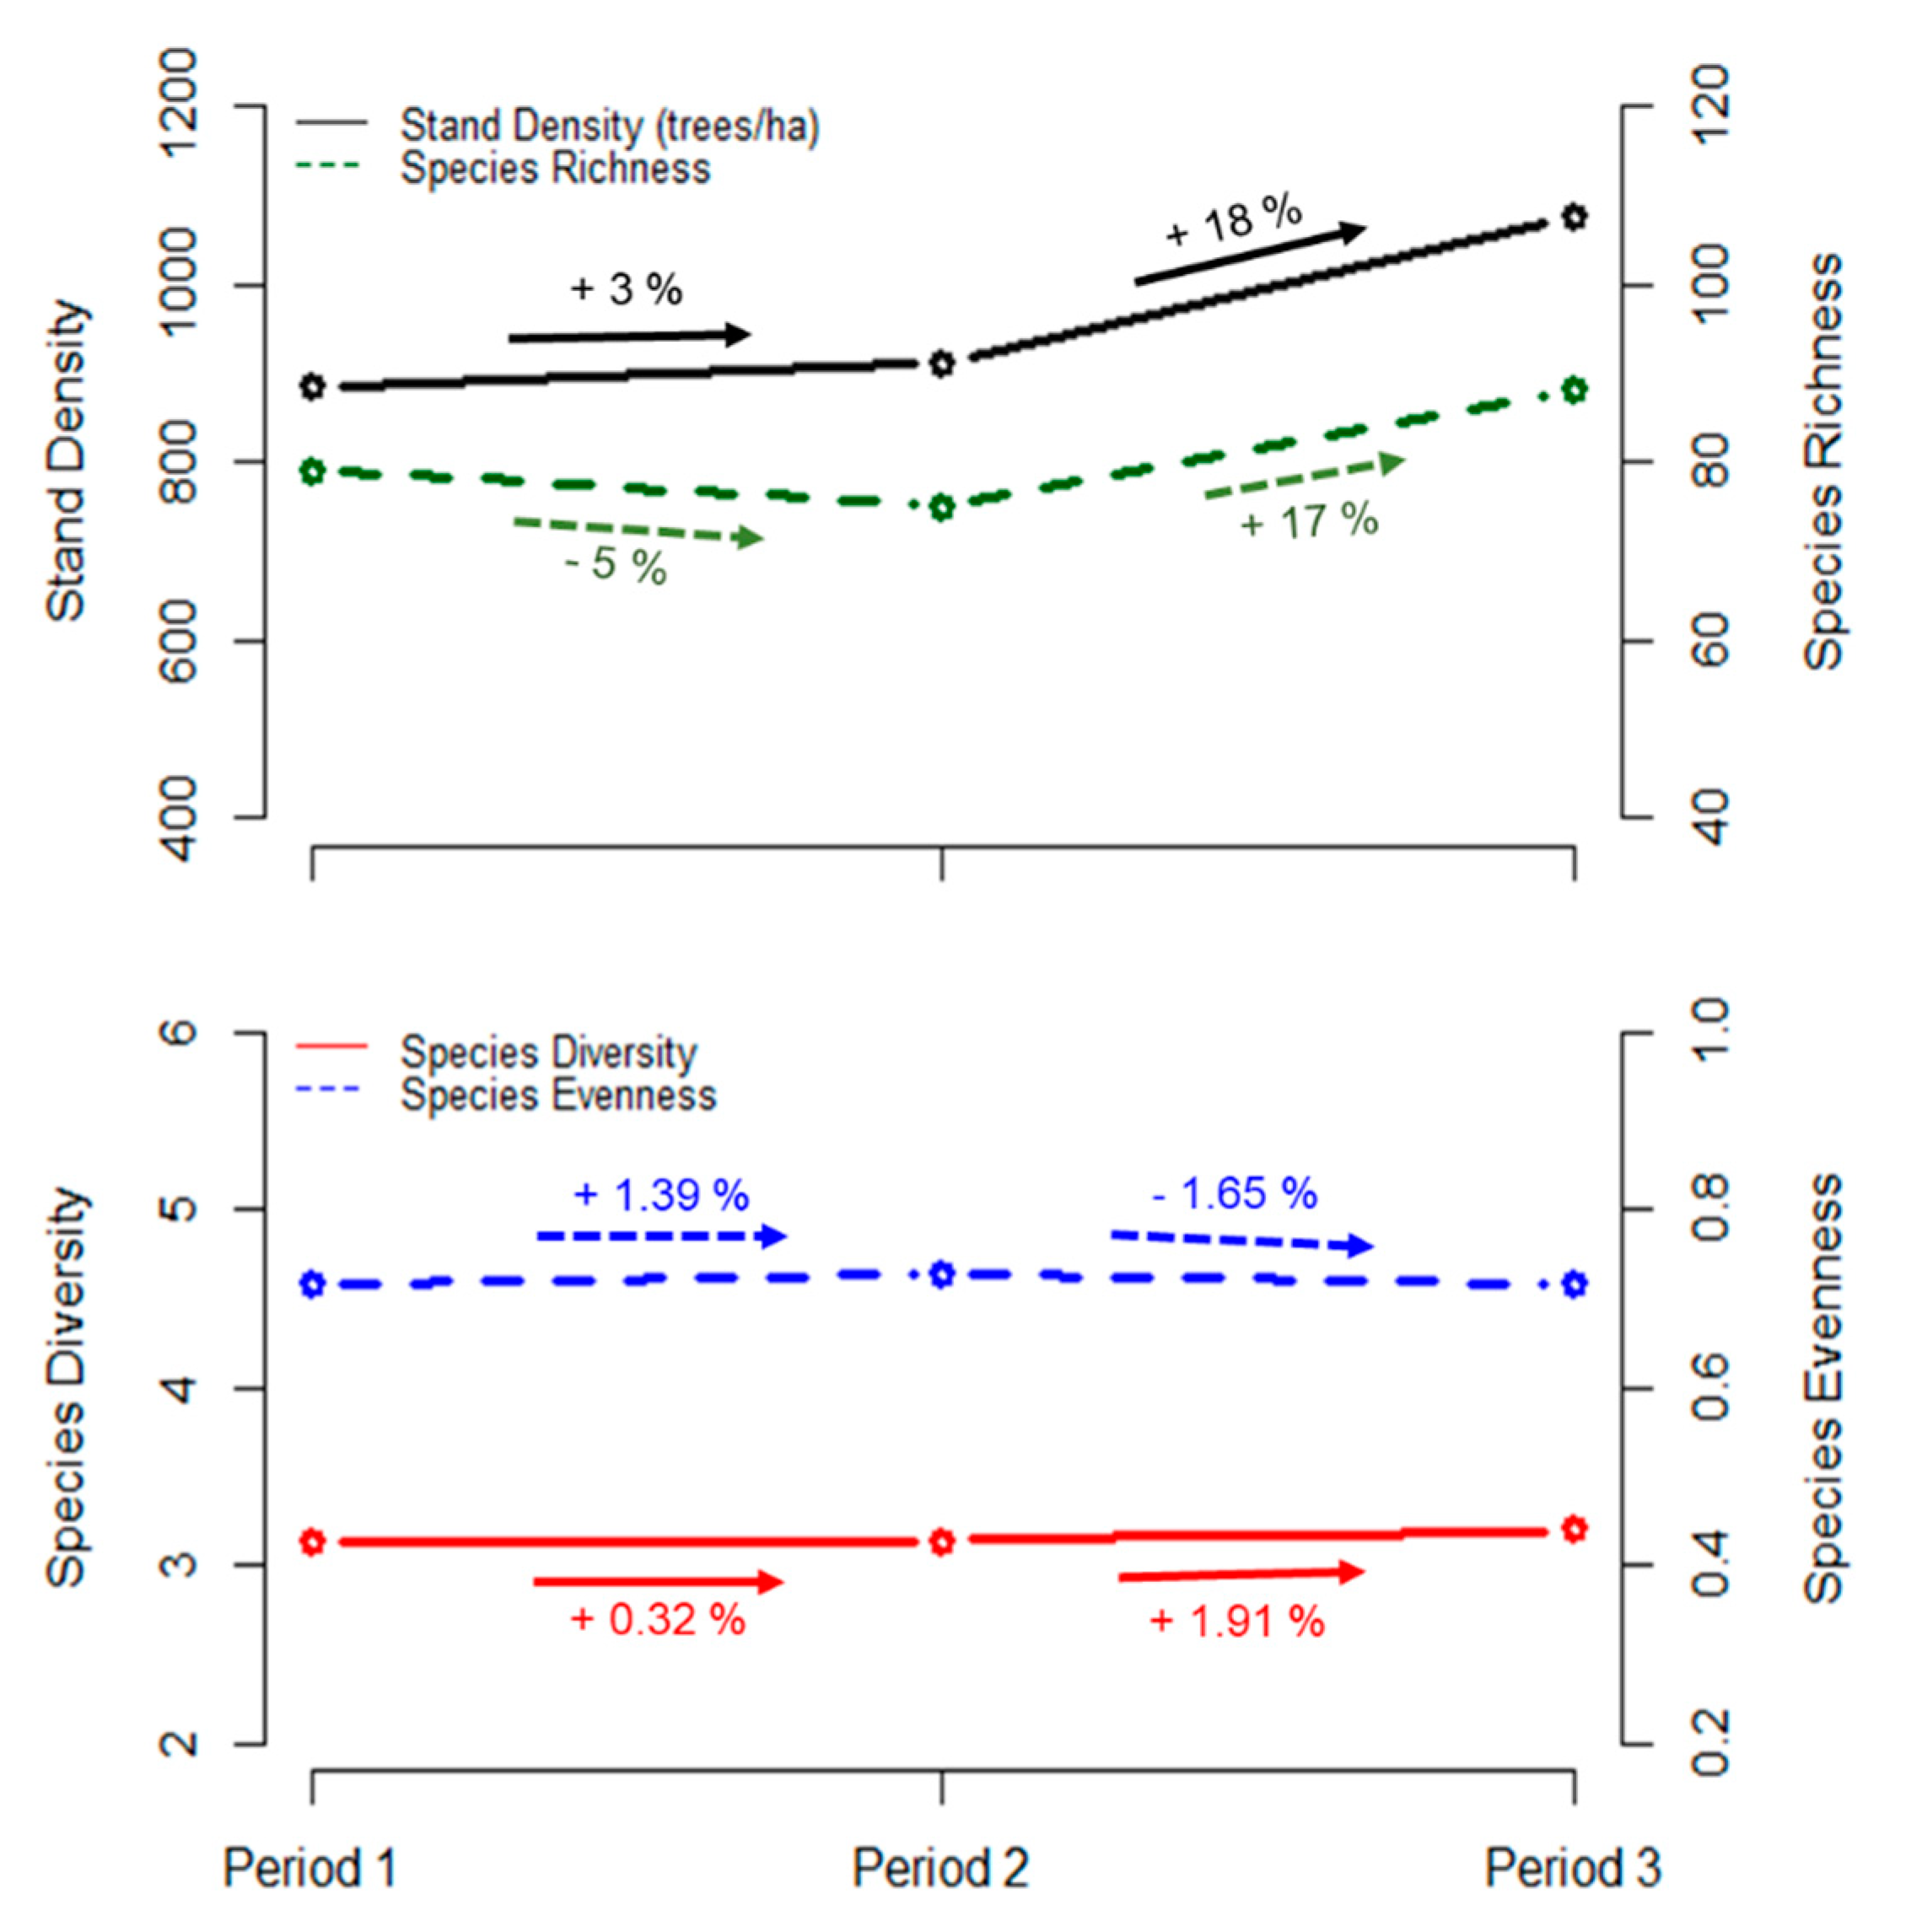
Across Mt. Jiri and Baegun during the study period (1998 to 2012), the overall net changes in tree communities were positive in terms of stand density, richness, diversity and evenness, but species richness and evenness slightly decreased in the first and second terms, respectively (Figure 2). Particularly, there was a significant increase (22%) in stand density from 885 trees/ha in period 1 to 912 trees/ha and 1076 trees/ha in periods 2 and 3, respectively. Species richness declined by 5.0% between periods 1 and 2, from 79 to 75 species, but recovered by 17.3% between periods 2 and 3, from 75 to 88 species, resulting in an overall 11.4% increase in richness over 15 years. The overall change in species richness was attributed to a tradeoff between 19 eliminated species, including Lindera glauca, Cornus macrophylla, Salix hallaisanensis, Corylus sieboldiana, Prunus serrulata, Acer triflorum, Rhus javanica, and 27 recruited species, including Betula chinensis, Cephalotaxus koreana, Catalpa ovate, Philadelphus schrenkii, Pinus thunbergii, and Juniperus rigida (Table S1). Species diversity and evenness showed relatively negligible changes, with a 2.2% increase and −0.3% decrease over the entire census period, respectively. The Shannon–Wiener diversity indices ranged from 3.13 to 3.20, and evenness indices ranged from 0.715 to 0.727. Overall, the changes in tree species composition across Mts. Jiri and Baegun over 15 years could be characterized as producing a denser and more diverse, but relatively dominant-species-occupied forest structure.

3.2. Shift in Species-Level Composition

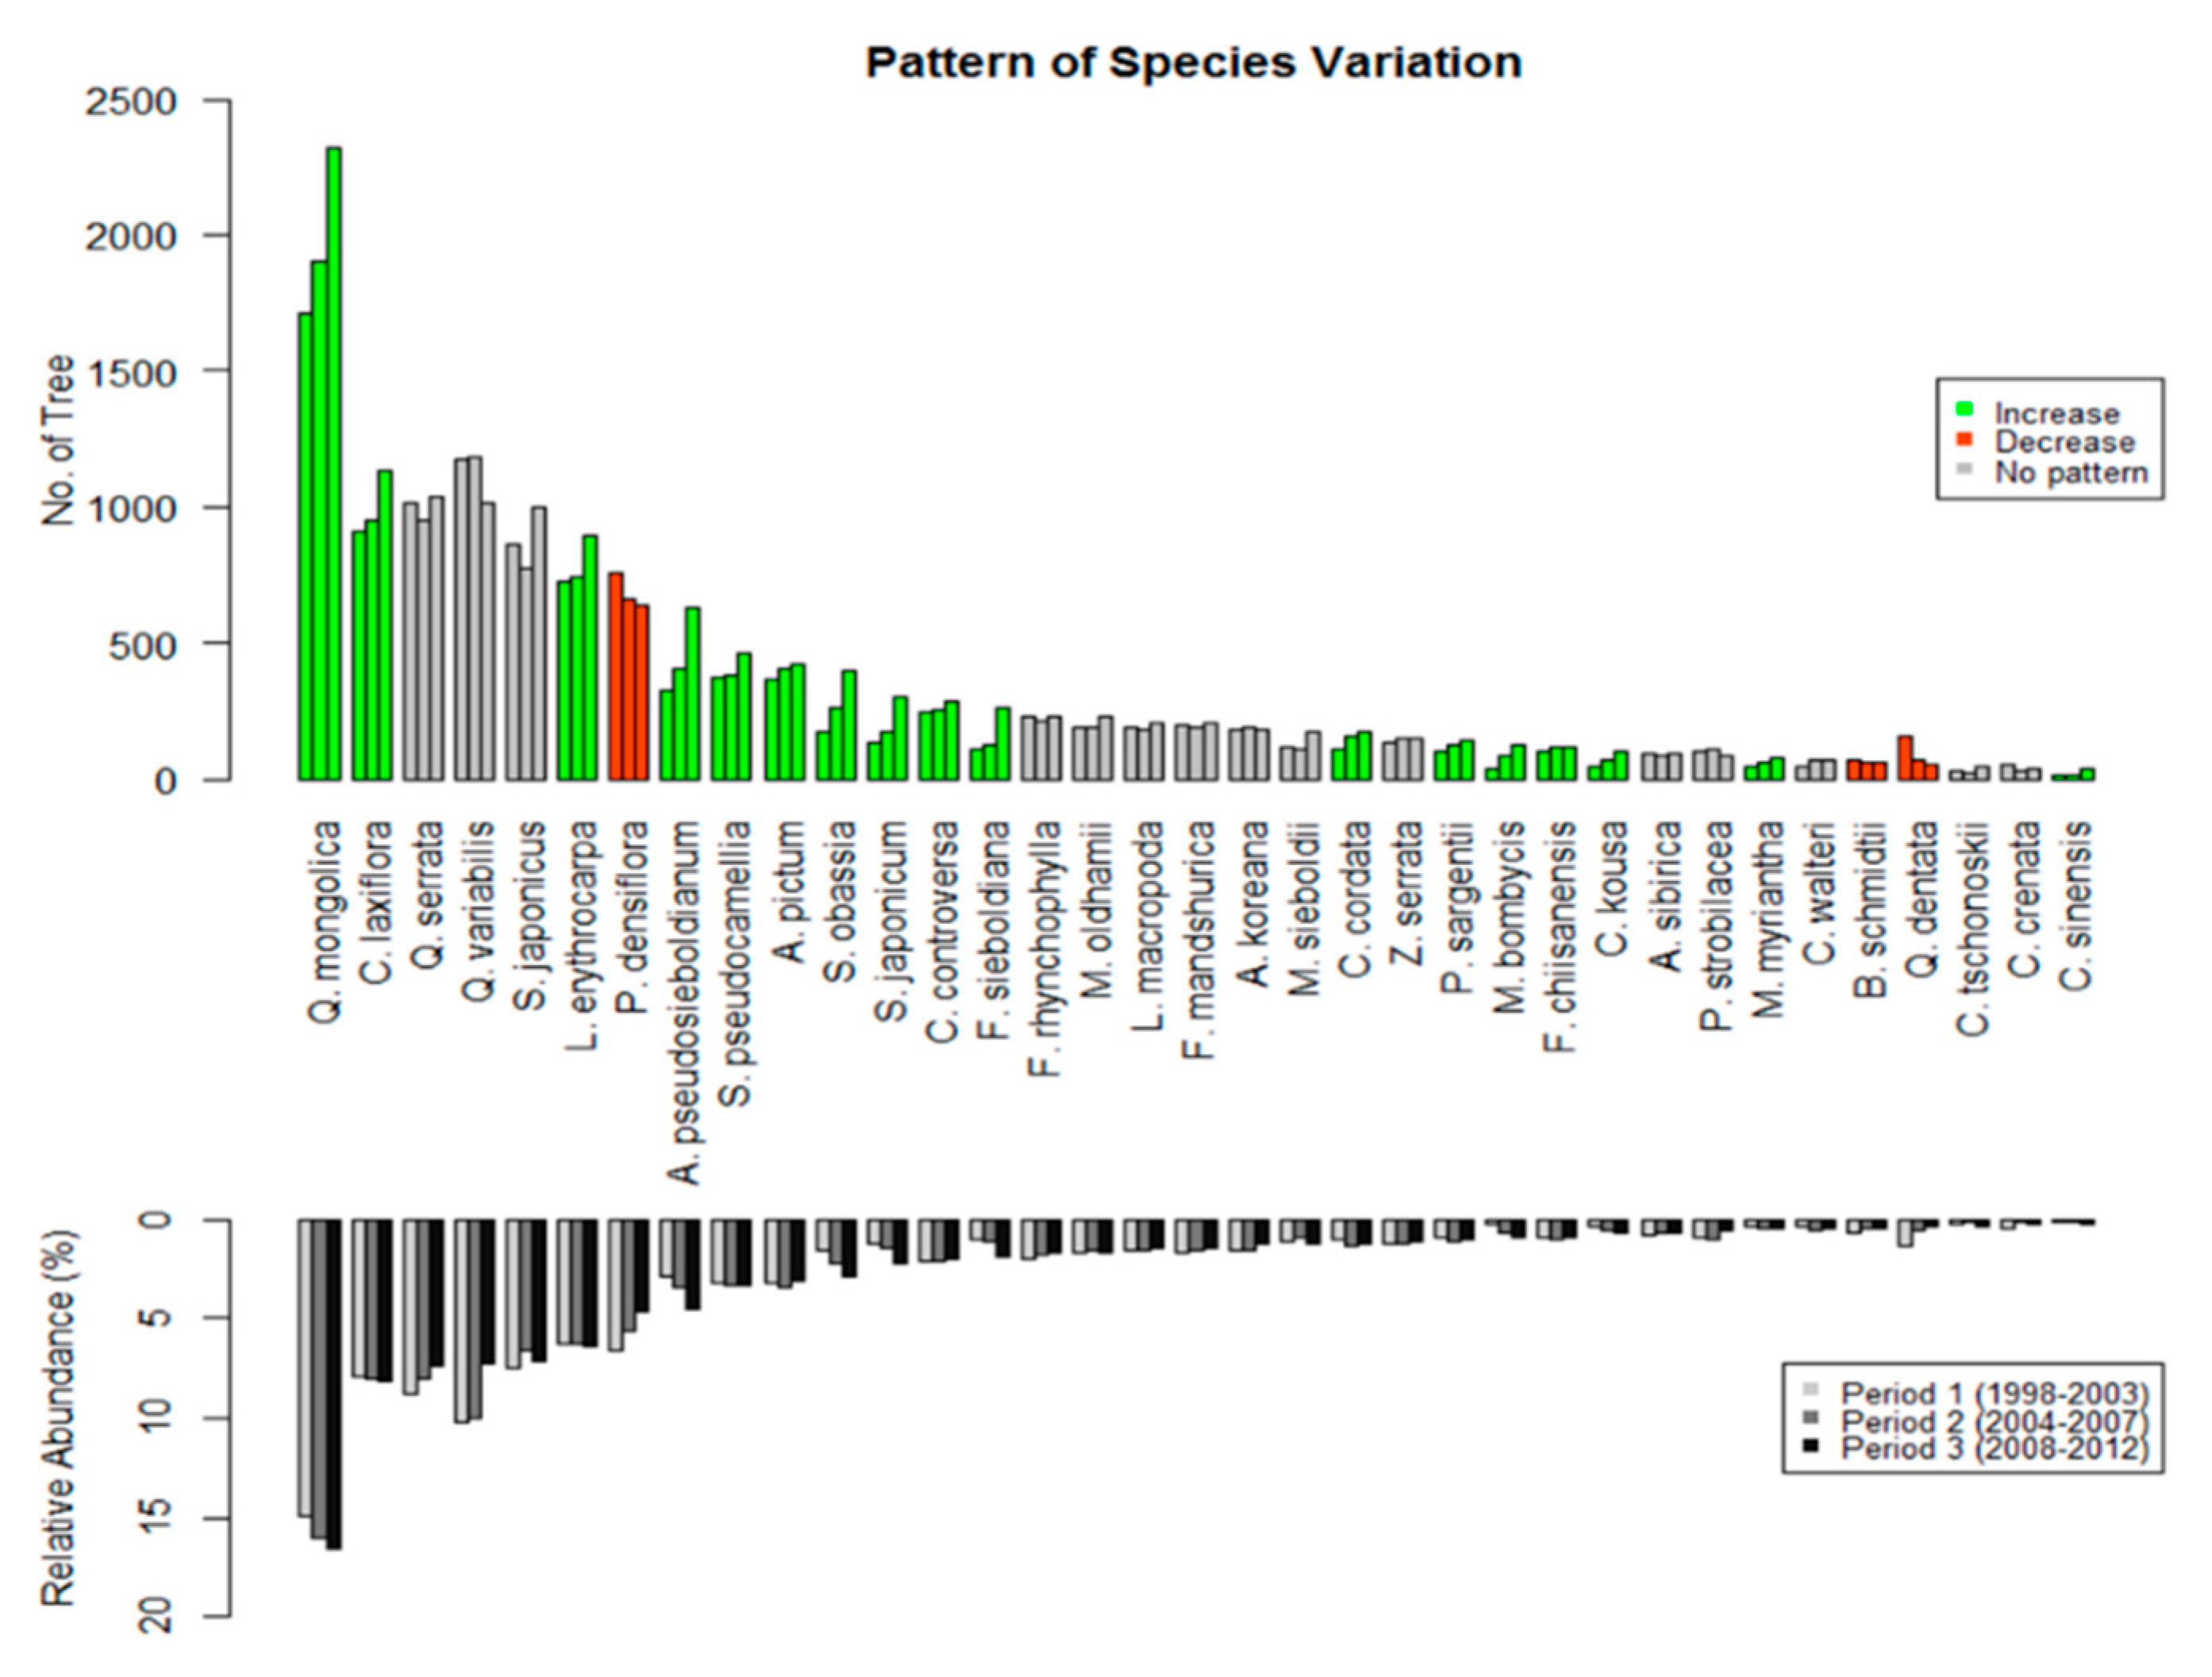
Figure 3 represents the variation in the number and relative abundance of individual species recorded over the census periods. Out of 101 recorded tree species, Quercus mongolica, Carpinus laxiflora, Quercus serrata, Quercus variabilis, Styrax japonicus, Lindera erythrocarpa, and Pinus densiflora were the most abundant species across the study sites, occupying 62%, 61%, and 58% of the total number of trees in each census period, respectively. The most abundant tree was Quercus mongolica, with 1714 (15%), 1901 (16%), and 2317 (17%) individuals (relative abundances in parenthesis). On the other hand, 57% of tree species had fewer than 30 individuals, and 36 species were represented by less than five individuals (Table S1).
Changes in tree abundance differed among species and can be categorized into three communities representing gradual increase, decrease, or no specific pattern in the species population. Thirty-nine out of 101 species (including 16 recruitment species), such as Quercus mongolica, Lindera erythrocarpa, Acer pseudosieboldianum, Stewartia pseudocamellia, Cornus controversa, and Fraxinus sieboldiana, showed gradual and persistent increases, while 20 species (including 18 eliminated species), such as Pinus densiflora and Quercus dentata, declined over the 15 years. The rest of the tree species showed no specific pattern, exhibiting fluctuations (mix of increase and decrease) in abundance between census periods; however, most of these fluctuating species ended up increasing in period 3 compared to period 1, thus contributing to the overall increase in stand density over the entire study period (Figure 3).

3.3. Shift in Community-Level Composition

The mean annual rates of change for community life history traits (stand prevalence, pole and adult growth rates, and adult stature) exhibited positive trends since the plots were initially censused in 1998–2001 (Figure 4). For stand prevalence, 69% of the sampling plots exhibited an increase in number of trees, while 31% of the plots exhibited negative changes (Figure 4a). The rate of change for pole tree growth rate was positive across 59% of the plots with an overall mean of 0.109 (Figure 4b). The rate of change for the adult growth rate was positive across 89% of the plots with an overall mean of 0.299 (Figure 4c). The rate of change for adult stature was positive across 88% of the plots (Figure 4d). Overall, the shift in tree composition across 130 subplots resulted in considerably more plots exhibiting increases in the number of trees, positive growth rates in pole and adult trees, and larger adult stature.
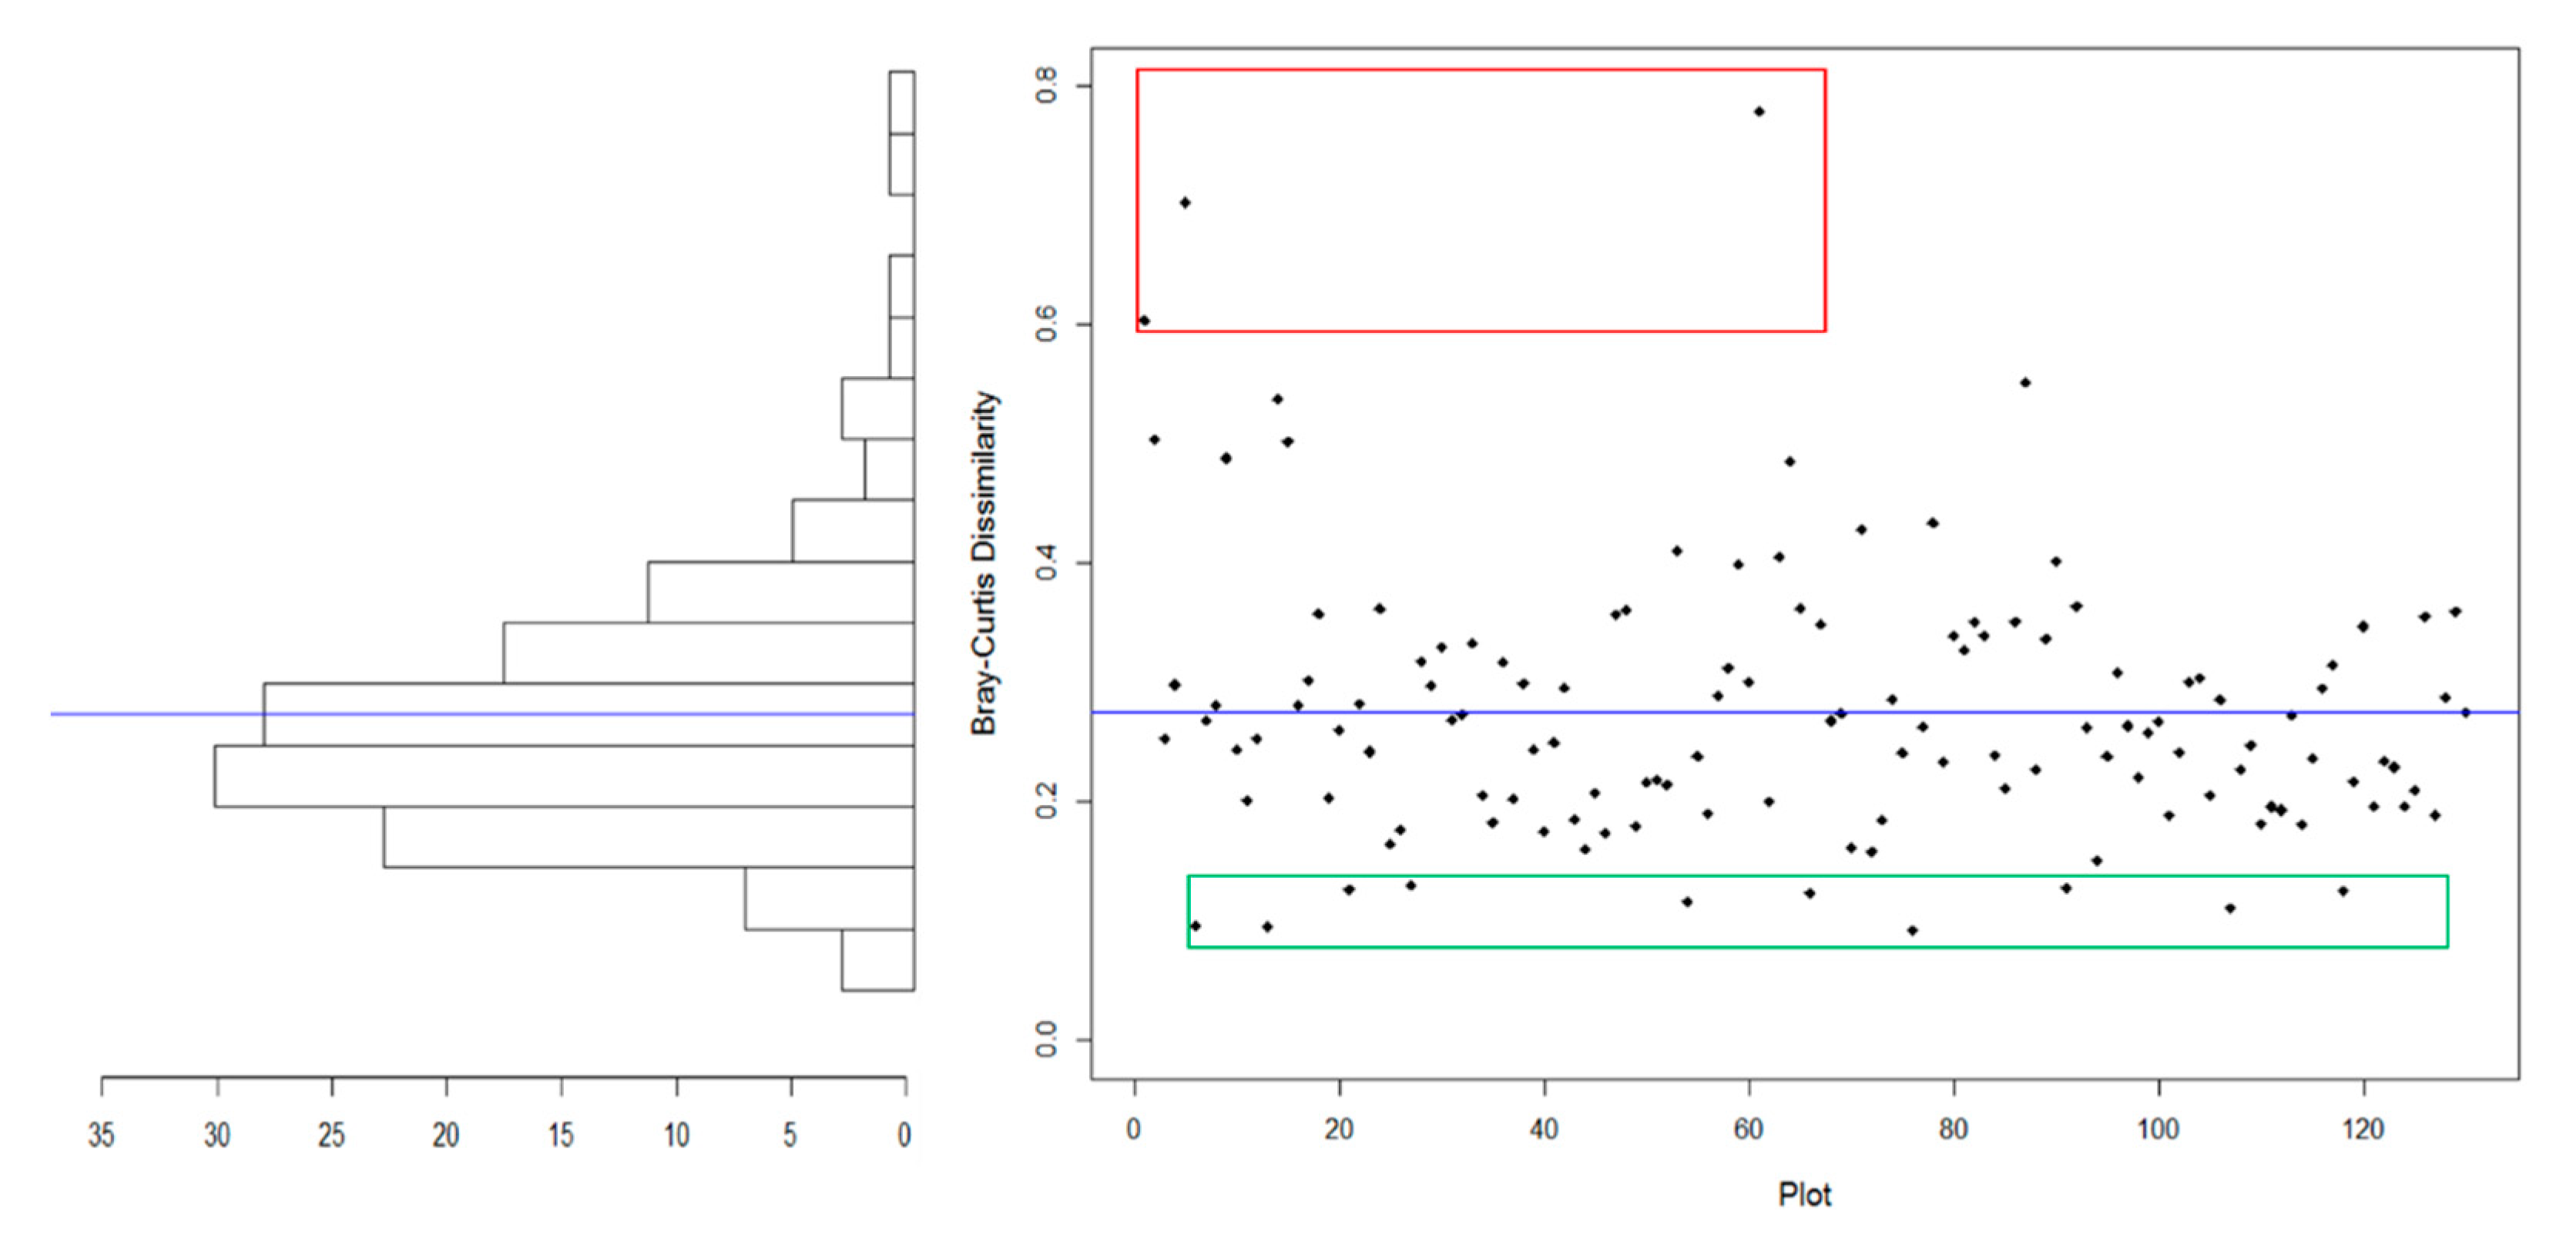
According to the BC dissimilarity index of 130 plots over the entire census period, the overall composition change ranged from 0.09 to 0.78, with a mean of 0.28 (Figure 5). Among the 130 plots, three plots appeared to have higher dissimilarity values, greater than 0.6, indicating a relatively high rate of compositional change, while 10 plots had a relatively stable species composition over time. The remainder of the plots (117 plots), exhibited intermediate dissimilarity values (0.18 < BC < 0.6). The high BC dissimilarity indices in the highest three plots can be explained by high increments (5–20 trees) of intermediate or shade-tolerant recruitment species, such as Stewartia pseudocamellia, Styrax obassia, Styrax japonicas, Quercus serrata, and Meliosma oldhamii, as well as high losses of species such as Pinus densiflora and Quercus mongolica. On the other hand, plots with low BC dissimilarity indexes can be attributed to minimal (1–3 trees) recruitment and loss (Tables S2 and S3).

3.4. Distribution of Species Diversity Gradients

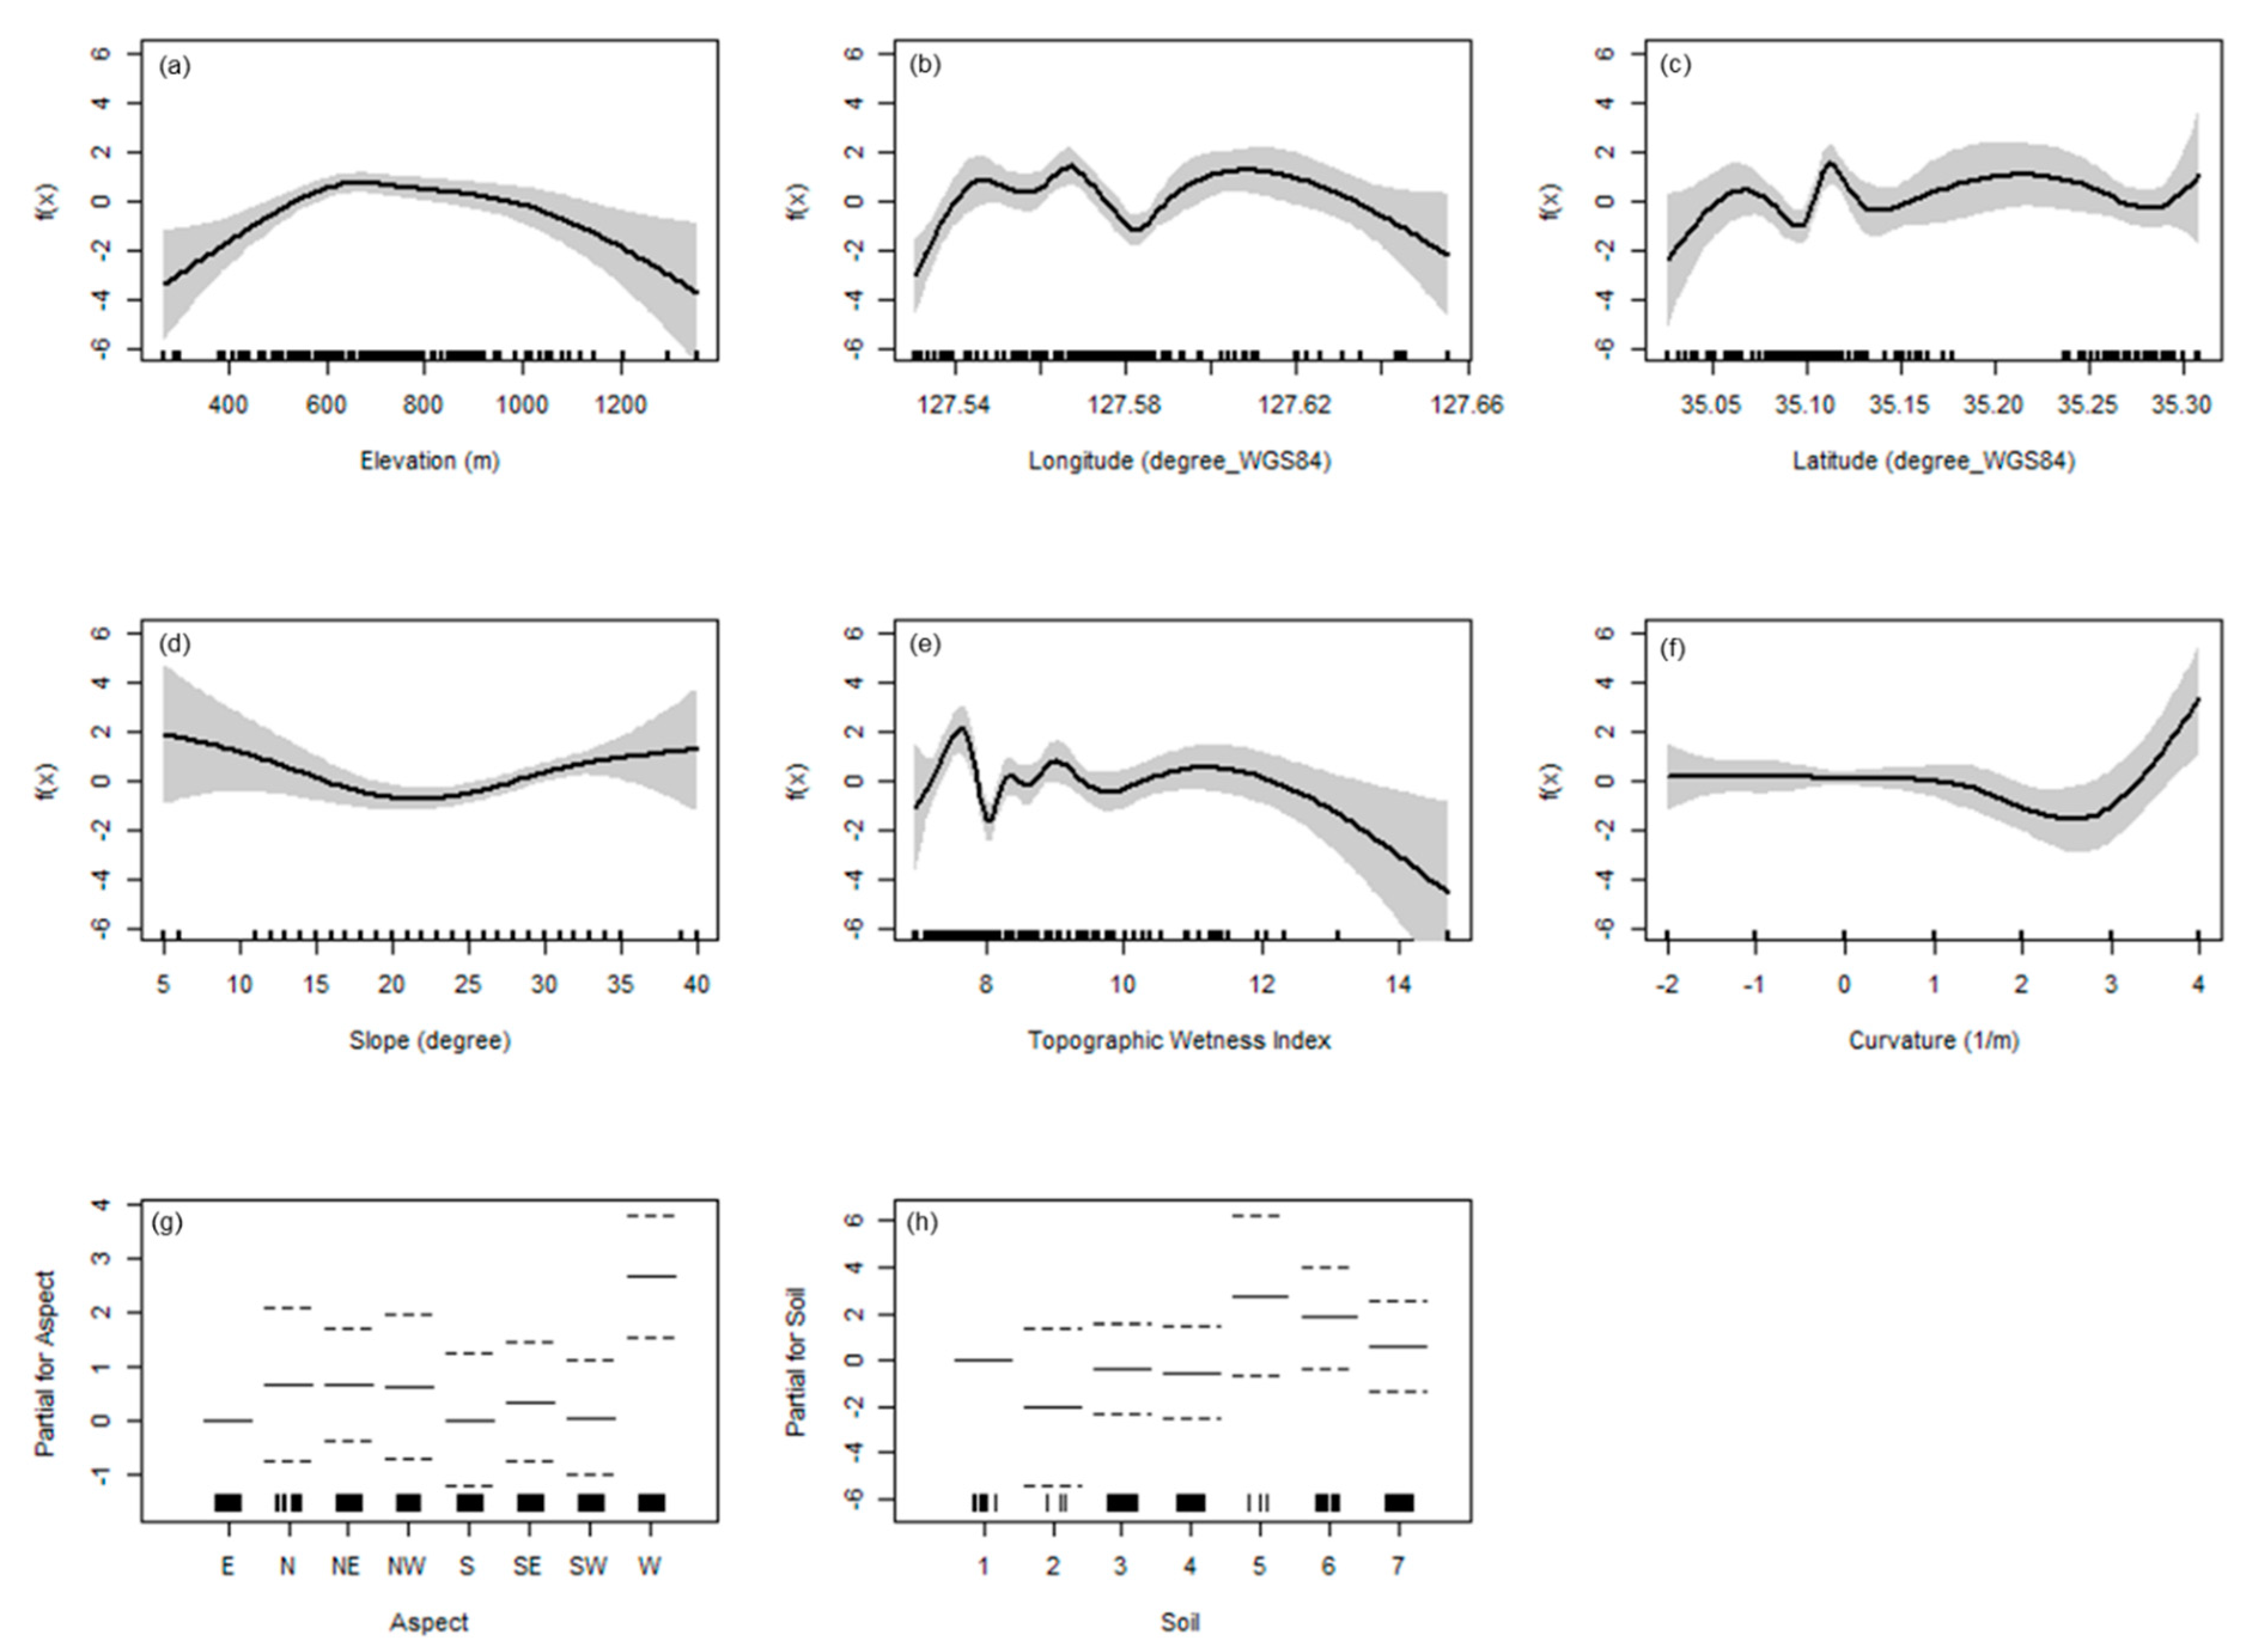
The distribution of tree species diversity among the 130 plots showed a significant relationship with topographic environmental drivers including elevation (p < 0.00000001), longitude (p < 0.0007), latitude (p < 0.00003), slope (p < 0.0009), TWI (p < 0.00001), curvature (p < 0.00203), and west aspect (p < 0.000003), based on the generalized additive model (Figure 6), explaining 50.4% of the deviance in the distribution of species diversity. Species diversity showed a humped-back distribution along with elevation, with a higher diversity at intermediate elevations (Figure 6a). While significant, species diversity showed no obvious relationship with longitude, latitude or TWI (Figure 6b,c,e). Species diversity was the highest on plots with west aspect (Figure 6g), but the lowest in plots with a 22 degree slope, 3 m−1 curvature, and clay soil (Figure 6d,f,h).
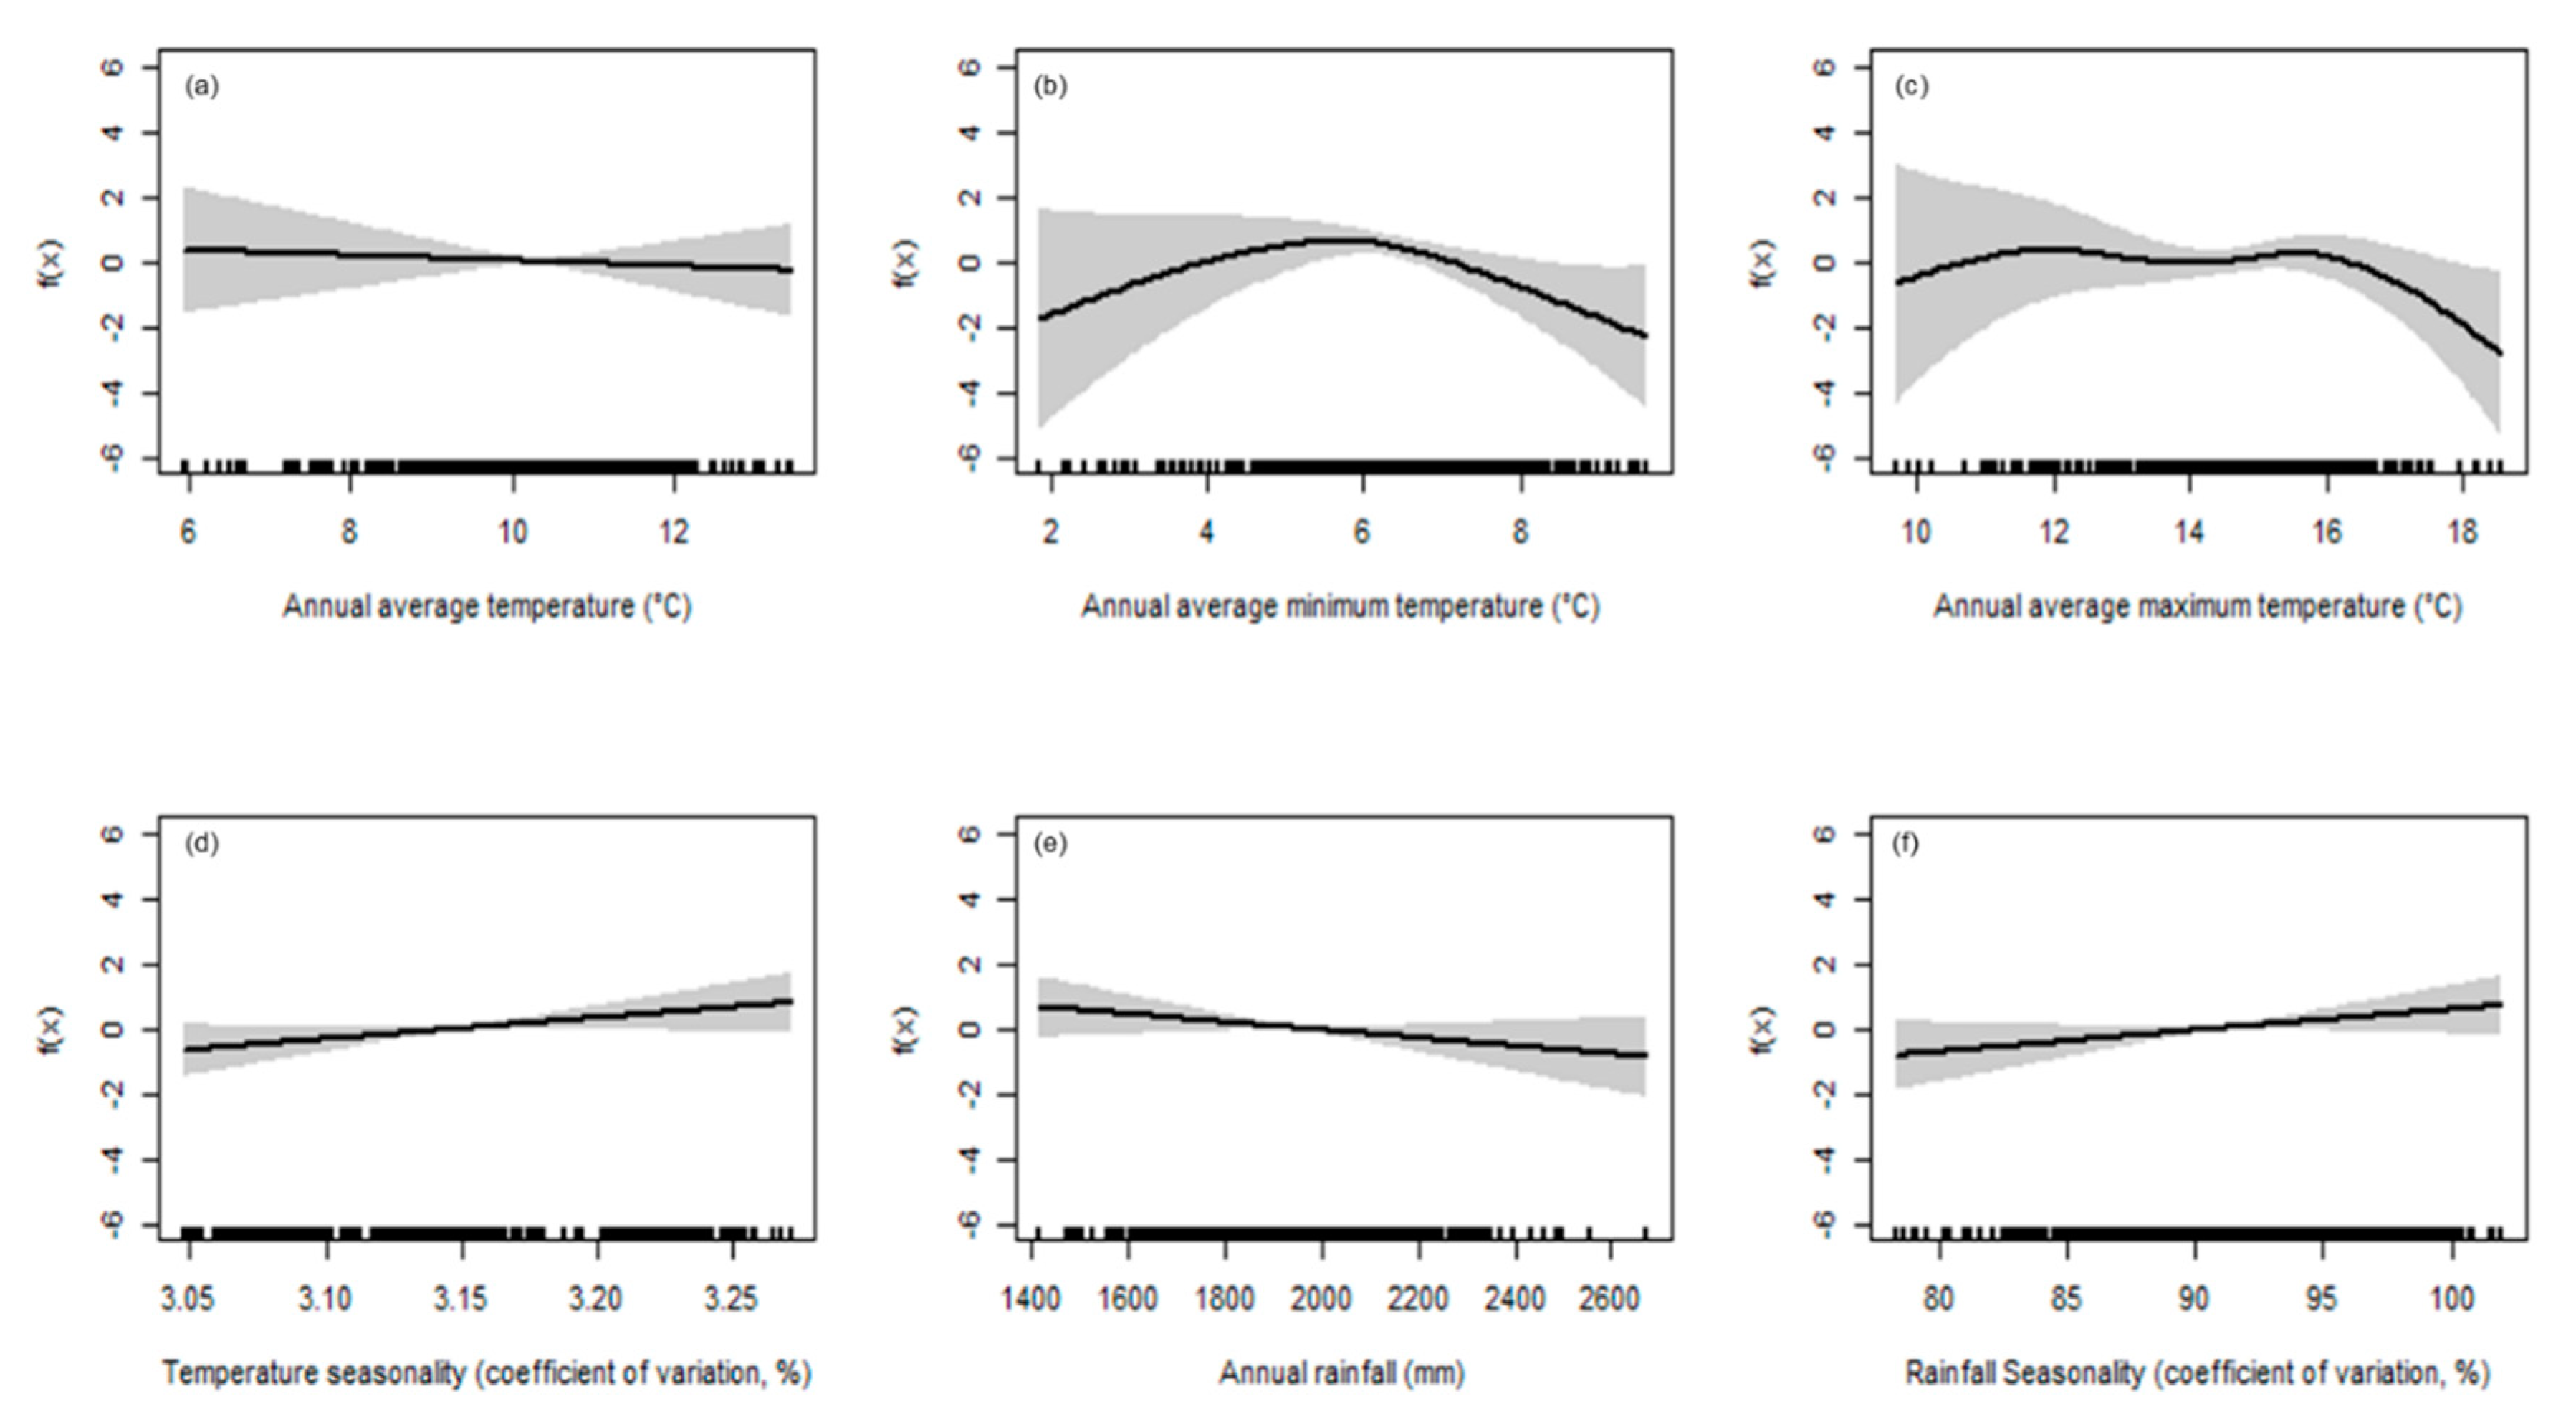
Among climate variables, annual mean minimum and maximum temperatures (p < 0.0001 and p < 0.04), temperature seasonality (p < 0.017), annual rainfall (p < 0.026), and rainfall seasonality (p < 0.03), showed significance on the distribution of species diversity (Figure 7b–f), explaining 18.3% of the deviance. The temperature and rainfall seasonality, representing seasonal variation in temperature and precipitation, showed weak positive correlations with species diversity (Figure 7d,f), while annual rainfall showed a weak negative association with species diversity (Figure 7e). Species diversity showed a humped-back distribution along with annual mean minimum temperature, exhibiting the highest diversity at approximately 6 °C (Figure 7b). While significant, annual mean maximum temperature had no obvious association with species diversity (Figure 7c).

4. Discussion

Climatic changes, droughts, and extreme high temperatures are expected to cause changes in competition among species and successional transition stages. It is thus important to understand the pattern of changes in the species composition of forests through the analysis of data collected over a long period of time. In our study, we analyzed 15 years (1998–2012) of changes in Korean forests, and our analysis may represent an indicator of how Asian forests of similar history will change over time.
During the study period, we found that the overall basal area of trees increased across the 130 study plots. The average basal area of the study plots increased from 152.5 ± 56.9 m2 ha−1 to 169.5 ± 56.1 m2 ha−1, then to 233.4 ± 74.1 m2 ha−1 from the first to the third survey period. This increase was attributable to increases in tree diameter and stand density; however, the contribution of the density increment was greater (22.5% increment) than that of the diameter increment (11.8%). Along with the increment in the basal area, there was a decrease in species richness between the first and second period, and species evenness between the second and third period (Figure 2). A four-species decrease in species richness between the first and second period is attributable to differences between the new establishment of eight species and the loss of 12 species. The newly established species are mainly mid-to-late successional broadleaved and often small understory trees, such as Ilex integra, Aralia elata, Syringa reticulate, and Chionanthus retusus, while early successional species, such as N fixing Alnus japonica, shade-intolerant Betula platyphylla and Salix hallaisanensis, disappeared (Table S1). However, unlike the first and second periods, the 17.3% increase in species richness between the second and third periods (Period 2~3) ultimately resulted in a significant 11.4% increase in species number and a positive effect on species diversity over the entire 15 year period. The increment in species richness over the second period can be attributed to the establishment of a variety of understory species, including Juniperus rigida, Zanthoxylum piperitum, Rhamnus yoshinoi, and mid to late successional species, such as Acer pictum and Picrasma quassioides. In addition, there was an increment of small understory and shrub trees that reached 6 cm in diameter, such as Clerodendrum trichotomum and Betula chinensis. Due to the high increase in species richness compared with species diversity between periods 2 and 3, species evenness, defined as diversity divided by richness, slightly decreased (Figure 2).
Thirty-nine out of 101 species (including 16 recruitment species), such as Quercus mongolica, Lindera erythrocarpa, Acer pseudosieboldianum, Stewartia pseudocamellia, Cornus controversa, and Fraxinus sieboldiana, showed gradual and persistent increases, while 20 species (including 18 eliminated species), such as Pinus densiflora and Quercus dentata, declined over the 15 years. The change in relative abundance of the dominant species revealed that forest composition at the species level has shifted, with a shade-related dominance change over time. Our study plots were dominated by intermediate and shade-tolerant species (late successional species), such as Quercus mongolica, Carpinus laxiflora, Quercus serrate, Quercus variabilis, Styrax japonicus, and Lindera erythrocarpa, which increased over time, while shade-intolerant species (early successional species), such as Abies koreana, Zelkova serrate, Prunus sargentii, Cornus walteri, Betula schmidtii, and Castanea crenata, showed less dominance over time. This result is consistent with the findings of other studies that have tracked species replacement by intermediate and shade-tolerant species during the first few decades of succession [36,37]. In addition, increases in basal area and tree density over time may be partly attributable to this shift by interrupting light penetration, resulting in an increasingly shaded forest interior. Under these conditions, the survival of shade-tolerant species is superior to that of shade-intolerant species [38].
Our data also revealed that the compositional shift at the community level has been significantly directional, trending toward the increased relative abundances of species with positive growth rates (Figure 4). On the basis of the annual change in stand-level growth rates across 130 plots, both pole and adult trees showed positive average growth rates within a 95% confidence interval. This finding might imply that tree growth was influenced by increasing concentrations of atmospheric CO2 and carbon fertilization. This hypothesis may be supported by recent studies suggesting that growth rates of tropical rainforests have accelerated in recent decades and have shown increased productivity caused by increasing concentrations of atmospheric CO2 and carbon fertilization [12,39,40].
With additive models, the distribution of species diversity showed different associations with topography and climate variables, but were more strongly associated with topographic factors than climate factors. We found that, over time, the distribution of species diversity is significantly related to topographical gradients, including elevation, latitude, longitude, slope, TWI, and curvature. Among topographical variables, elevation was the most significant driver of species diversity distribution at our sites, followed by latitude and longitude (Figure S1). In particular, species diversity along the elevation gradient elucidated a pronounced humped-back distribution with high diversity at intermediate elevations. Our findings align with the elevation patterns of diversity in other studies [41,42,43,44,45]. On the other hand, the effect of slope on species diversity exhibited a gentle convex distribution. This finding is not consistent with the common hypothesis that species diversity potentially decreases along a slope gradient, since steeper sites generally have less water and nutrients available than flatter areas [46,47]. This result indicates that there might be other interactions affecting the distribution of species diversity on steeper slopes on our study sites. While significant, the presence of no distinctive relationships along latitude, longitude, and TWI gradients implies that the species diversity at our sites cannot be explained only by topographical drivers. It is also noteworthy that, at our site, climate explained the low percentage variation (18.3%) of species diversity compared to topography factors (50.4%). This may have resulted from the small scale of the study area. This finding is supported by recent studies suggesting that, at a large scale, climate was the main driver influencing species richness [48,49], whereas, at smaller scales, topography contributes more significantly to levels of species diversity [50,51]. However, it is suggested that, in further studies, other abiotic factors, such as habitat heterogeneity, and biotic factors, such as competition and productivity [51], should be incorporated into the model to address the rest of the unexplained variance in the patterns of species diversity distribution due to the combined effects of all of these driving factors.

5. Conclusions

This is a study of the dynamics of species composition and distribution based on the long-term monitoring of a large number of permanent plots. Our 15 year study revealed that species composition and distribution in the area of Mts. Jiri and Baegun have changed in a definite direction, as evidenced by compositional shifts at both the species and community levels, as well as by the variation in species diversity along topographical and climate environment gradients. At the species level, the taxonomic information, in terms of species density, richness and diversity, and the relative abundance of the species composition provides concrete clues to understanding the processes of compositional shift, while the plant-life-history trait approach at the community level provides other insights into a mechanistic understanding of the processes changing and shaping the temperate tree community assembly over time. We also verify that, at the local scale, topography drivers are more significantly associated with the distribution of species diversity.

Supplementary Materials

The following are available online at https://www.mdpi.com/1999-4907/11/2/186/s1, Figure S1: Classification and Regression tree (CART) model of species diversity distribution in relation to topographical environment variables, Table S1: List of species composition change over three census periods, Table S2: List of species composition change in plots with high Bray-Curtis dissimilarity (BC) index values over census periods (1998–2012), Table S3: List of species composition change in plots with low Bray-Curtis dissimilarity (BC) index values over census periods (1998–2012).

Author Contributions

Conceptualization, H.S.K. and B.L.; methodology, B.L.; software, B.L.; validation, B.L.; field survey and data acquisition, J.P., H.L., S.C. and J.Y.; writing—original draft preparation, B.L. and H.S.K.; writing—review and editing, B.L. and T.K.K.; supervision, H.S.K.; project administration, H.S.K.; funding acquisition, B.L. and H.S.K. All authors have read and agreed to the published version of the manuscript.

Funding

This research was funded by National Research Foundation of Korea, grant number NRF-2015R1C1A1A02037721 and by Korea Forestry Promotion Institute, grant number 2018113B10-1920-BB01.

Acknowledgments

We thank staff members from the Seoul National University Forest for their assistance in sample collection and for providing access to the field site.

Conflicts of Interest

The authors declare no conflict of interest.

References

  1. Parmesan, C.; Yohe, G. A globally coherent fingerprint of climate change impacts across natural systems. Nature 2003, 421, 37. [Google Scholar] [CrossRef] [PubMed]
  2. Root, T.L.; Price, J.T.; Hall, K.R.; Schneider, S.H.; Rosenzweig, C.; Pounds, J.A. Fingerprints of global warming on wild animals and plants. Nature 2003, 421, 57. [Google Scholar] [CrossRef] [PubMed]
  3. Walther, G.-R. Community and ecosystem responses to recent climate change. Philos. Trans. R. Soc. B Biol. Sci. 2010, 365, 2019–2024. [Google Scholar] [CrossRef] [PubMed]
  4. Ahn, U.S.; Kim, D.S.; Yun, Y.S.; Ko, S.H.; Kim, K.S.; Cho, I.S. The inference about the cause of death of Korean Fir in Mt. Halla through the analysis of spatial dying pattern-Proposing the possibility of excess soil moisture by climate changes. Korean J. Agric. For. Meteorol. 2019, 21, 1–28. [Google Scholar]
  5. Hernández, L.; Cañellas, I.; Alberdi, I.; Torres, I.; Montes, F. Assessing changes in species distribution from sequential large-scale forest inventories. Ann. For. Sci. 2014, 71, 161–171. [Google Scholar] [CrossRef] [Green Version]
  6. Callahan, J.T. Long-term ecological research. BioScience 1984, 34, 363–367. [Google Scholar] [CrossRef]
  7. Likens, G.E. Long-Term Studies in Ecology; Springer: Berlin/Heidelberg, Germany, 1989; Volume 500. [Google Scholar]
  8. Magnuson, J.J. Long-term ecological research and the invisible present. BioScience 1990, 40, 495–501. [Google Scholar] [CrossRef]
  9. Condit, R. Research in large, long-term tropical forest plots. Trends Ecol. Evol. 1995, 10, 18–22. [Google Scholar] [CrossRef]
  10. Condit, R. Tropical Forest Census Plots: Methods and Results from Barro Colorado Island, Panama and a Comparison with Other Plots; Springer Science & Business Media: Berlin/Heidelberg, Germany, 1998. [Google Scholar]
  11. Hobbie, J.E.; Carpenter, S.R.; Grimm, N.B.; Gosz, J.R.; Seastedt, T.R. The US long term ecological research program. BioScience 2003, 53, 21–32. [Google Scholar] [CrossRef] [Green Version]
  12. Knapp, A.K.; Smith, M.D.; Hobbie, S.E.; Collins, S.L.; Fahey, T.J.; Hansen, G.J.; Landis, D.A.; La Pierre, K.J.; Melillo, J.M.; Seastedt, T.R. Past, present, and future roles of long-term experiments in the LTER network. BioScience 2012, 62, 377–389. [Google Scholar] [CrossRef] [Green Version]
  13. Laurance, W.F.; Oliveira, A.A.; Laurance, S.G.; Condit, R.; Nascimento, H.E.; Sanchez-Thorin, A.C.; Lovejoy, T.E.; Andrade, A.; D’Angelo, S.; Ribeiro, J.E. Pervasive alteration of tree communities in undisturbed Amazonian forests. Nature 2004, 428, 171. [Google Scholar] [CrossRef] [PubMed] [Green Version]
  14. Chave, J.; Condit, R.; Muller-Landau, H.C.; Thomas, S.C.; Ashton, P.S.; Bunyavejchewin, S.; Dattaraja, H.S.; Davies, S.J.; Esufali, S.; Ewango, C.E. Assessing evidence for a pervasive alteration in tropical tree communities. PLoS Biol. 2008, 6, e45. [Google Scholar] [CrossRef] [PubMed]
  15. Feeley, K.J.; Davies, S.J.; Perez, R.; Hubbell, S.P.; Foster, R.B. Directional changes in the species composition of a tropical forest. Ecology 2011, 92, 871–882. [Google Scholar] [CrossRef] [PubMed] [Green Version]
  16. Lima, J.M.T.; Staudhammer, C.L.; Brandeis, T.J.; Escobedo, F.J.; Zipperer, W. Temporal dynamics of a subtropical urban forest in San Juan, Puerto Rico, 2001–2010. Landsc. Urban Plan. 2013, 120, 96–106. [Google Scholar] [CrossRef]
  17. Shen, Z.; Fei, S.; Feng, J.; Liu, Y.; Liu, Z.; Tang, Z.; Wang, X.; Wu, X.; Zheng, C.; Zhu, B. Geographical patterns of community-based tree species richness in Chinese mountain forests: The effects of contemporary climate and regional history. Ecography 2012, 35, 1134–1146. [Google Scholar] [CrossRef]
  18. Sproull, G.J.; Quigley, M.F.; Sher, A.; González, E. Long-term changes in composition, diversity and distribution patterns in four herbaceous plant communities along an elevational gradient. J. Veg. Sci. 2015, 26, 552–563. [Google Scholar] [CrossRef]
  19. Umeki, K.; Kikuzawa, K. Long-term growth dynamics of natural forests in Hokkaido, northern Japan. J. Veg. Sci. 1999, 10, 815–824. [Google Scholar] [CrossRef]
  20. Yamada, T.; Aiba, S.-I.; Kubota, Y.; Okubo, K.; Miyata, I.; Suzuki, E.; Maenaka, H.; Nagano, M. Dynamics of species diversity in a Japanese warm-temperate secondary forest. Ecosphere 2011, 2, 1–19. [Google Scholar] [CrossRef]
  21. Dai, L.; Qi, L.; Wang, Q.; Su, D.; Yu, D.; Wang, Y.; Ye, Y.; Jiang, S.; Zhao, W. Changes in forest structure and composition on Changbai Mountain in Northeast China. Ann. For. Sci. 2011, 68, 889. [Google Scholar] [CrossRef] [Green Version]
  22. Suzuki, S.N.; Ishihara, M.I.; Hidaka, A. Regional-scale directional changes in abundance of tree species along a temperature gradient in Japan. Glob. Chang. Biol. 2015, 21, 3436–3444. [Google Scholar] [CrossRef]
  23. Chung, J.-M.; Hwang, S.-M.; Kim, Y.-M.; Shin, J.-K.; Kim, M.-S. Stand structure and dynamics in forests around Nari Basin of Ulleung Island, Korea. Korean J. Agric. For. Meteorol. 2010, 12, 23–35. [Google Scholar] [CrossRef]
  24. Jang, J.-H.; Han, B.-H.; Lee, K.-J.; Choi, J.-W.; Noh, T.-H. A study on the characteristics and changes of vegetation structure of the plant community in Mt. Kwanak. Korean J. Environ. Ecol. 2013, 27, 344–356. [Google Scholar]
  25. Pielou, E.C. Species-diversity and pattern-diversity in the study of ecological succession. J. Theor. Biol. 1966, 10, 370–383. [Google Scholar] [CrossRef]
  26. Magurran, A.E. Ecological Diversity and Its Measurement; Princeton University Press: Princeton, NJ, USA, 1988. [Google Scholar]
  27. Lee, C.-B.; Chun, J.-H. Relative importance of climatic and habitat factors on plant richness along elevation gradients on the Mt. Baekhwa, South Korea. Korean J. Agric. For. Meteorol. 2018, 20, 233–242. [Google Scholar] [CrossRef]
  28. Hastie, T.; Tibshirani, R. Generalized Additive Models. In Chapman Hall & CRC. Monographs on Statistics & Applied Probability; Chapman and Hall/CRC: New York, FL, USA, 1990; Volume 1. [Google Scholar]
  29. Johnston, K.; Ver Hoef, J.M.; Krivoruchko, K.; Lucas, N. ArcGIS Geostatistical Analyst; ESRI (Environmental Systems Research Institute): Redlands, CA, USA, 2001. [Google Scholar]
  30. Soil Science Division Staff. Soil Survey Manual; USDA Handbook 18; Ditzler, C., Scheffe, K., Monger, H.C., Eds.; Government Printing Office: Washington, DC, USA, 2017.
  31. Package Statistical Functions (Stats) in R. Available online: https://stat.ethz.ch/R-manual/R-devel/library/stats/html/stats-package.html (accessed on 15 June 2016).
  32. Beals, E.W. Bray-Curtis ordination: An effective strategy for analysis of multivariate ecological data. In Advances in Ecological Research; Elsevier: Amsterdam, The Netherlands, 1984; Volume 14, pp. 1–55. [Google Scholar]
  33. Faith, D.P.; Minchin, P.R.; Belbin, L. Compositional dissimilarity as a robust measure of ecological distance. Vegetatio 1987, 69, 57–68. [Google Scholar] [CrossRef]
  34. Qian, S.S. Environmental and Ecological Statistics with R; Chapman and Hall/CRC: New York, FL, USA, 2016. [Google Scholar]
  35. Package Generalized Additive Models (Gam) in R. Available online: https://cran.r-project.org/web/packages/gam/gam.pdf (accessed on 27 June 2016).
  36. Crow, T.R. A rainforest chronicle: A 30-year record of change in structure and composition at El Verde, Puerto Rico. Biotropica 1980, 12, 42–55. [Google Scholar] [CrossRef]
  37. Schoonmaker, P.; McKee, A. Species composition and diversity during secondary succession of coniferous forests in the western Cascade Mountains of Oregon. For. Sci. 1988, 34, 960–979. [Google Scholar]
  38. Wittmann, F.; Junk, W.J. Sapling communities in Amazonian white-water forests. J. Biogeogr. 2003, 30, 1533–1544. [Google Scholar] [CrossRef]
  39. Lewis, S.L.; Malhi, Y.; Phillips, O.L. Fingerprinting the impacts of global change on tropical forests. Philos. Trans. R. Soc. Lond. Ser. B Biol. Sci. 2004, 359, 437–462. [Google Scholar] [CrossRef]
  40. Lewis, S.L. Tropical forests and the changing earth system. Philos. Trans. R. Soc. B Biol. Sci. 2005, 361, 195–210. [Google Scholar] [CrossRef] [Green Version]
  41. Grime, J. Control of species density in herbaceous vegetation. J Environ. Manag. 1973, 1, 151–167. [Google Scholar]
  42. Bruun, H.H.; Moen, J.; Virtanen, R.; Grytnes, J.-A.; Oksanen, L.; Angerbjörn, A. Effects of altitude and topography on species richness of vascular plants, bryophytes and lichens in alpine communities. J. Veg. Sci. 2006, 17, 37–46. [Google Scholar] [CrossRef]
  43. Kessler, M. Patterns of diversity and range size of selected plant groups along an elevational transect in the Bolivian Andes. Biodivers. Conserv. 2001, 10, 1897–1921. [Google Scholar] [CrossRef]
  44. Austrheim, G. Plant diversity patterns in semi-natural grasslands along an elevational gradient in southern Norway. Plant Ecol. 2002, 161, 193–205. [Google Scholar] [CrossRef]
  45. Legendre, P.; Dale, M.R.; Fortin, M.-J.; Casgrain, P.; Gurevitch, J. Effects of spatial structures on the results of field experiments. Ecology 2004, 85, 3202–3214. [Google Scholar] [CrossRef]
  46. Comita, L.S.; Engelbrecht, B.M. Seasonal and spatial variation in water availability drive habitat associations in a tropical forest. Ecology 2009, 90, 2755–2765. [Google Scholar] [CrossRef] [Green Version]
  47. Balvanera, P.; Quijas, S.; Pérez-Jiménez, A. Distribution patterns of tropical dry forest trees along a mesoscale water availability gradient. Biotropica 2011, 43, 414–422. [Google Scholar] [CrossRef]
  48. Ter steege, H.; Pitman, N.C.; Phillips, O.L.; Chave, J.; Sabatier, D.; Duque, A.; Molino, J.-F.; Pr´evost, M.-F.; Spichiger, R.; Castellanos, H. Continental-scale patterns of canopy tree composition and function across Amazonia. Nature 2006, 443, 444–447. [Google Scholar] [CrossRef]
  49. Engelbrecht, B.M.; Comita, L.S.; Condit, R.; Kursar, T.A.; Tyree, M.T.; Turner, B.L.; Hubbell, S.P. Drought sensitivity shapes species distribution patterns in tropical forests. Nature 2007, 447, 80–82. [Google Scholar] [CrossRef]
  50. John, R.; Dalling, J.W.; Harms, K.E.; Yavitt, J.B.; Stallard, R.F.; Mirabello, M.; Hubbell, S.P.; Valencia, R.; Navarrete, H.; Vallejo, M. Soil nutrients influence spatial distributions of tropical tree species. Proc. Natl. Acad. Sci. USA 2007, 104, 864–869. [Google Scholar] [CrossRef] [Green Version]
  51. Gentili, R.; Armiraglio, S.; Sgorbati, S.; Baroni, C. Geomorphological disturbance affects ecological driving forces and plant turnover along an altitudinal stress gradient on alpine slopes. Plant Ecol. 2013, 214, 571–586. [Google Scholar] [CrossRef]
Figure 1. Location of 130 forest permanent plots across Mt. Jiri and Baegun.
Forests 11 00186 g001
Figure 2. Change in stand density, species richness, diversity, and evenness over 15 years.
Forests 11 00186 g002
Figure 3. Variation in the number of and relative abundance of each tree species over 15 years across Mts. Jiri and Baegun: of the 101 recorded tree species, only 35 representative tree species are presented, due to a limitation of space. Species with increasing, decreasing and no patterns are represented by green, red and grey bars, respectively.
Forests 11 00186 g003
Figure 4. Histograms of the annual rates of change for each 0.1 ha subplot tree community across Mts. Jiri and Baegun: (a) stand prevalence represented as log(number of trees), (b) pole growth rate represented as log(dbht+1−dbht)/time, (c) adult growth rate represented as log(dbht+1−dbht)/time, and (d) adult stature represented as the 95% quantile of species’ diameter measurements (cm). The blue line indicates the null hypothesis of zero net change and red hatched areas indicate 95% confidence intervals around the mean rate of change for each variable.
Forests 11 00186 g004
Figure 5. Change in dissimilarity at the 0.1 ha subplot level between 1998–2012 across Mts. Jiri and Baegun. The blue line indicates the mean dissimilarity value. The red box represents the high dissimilarity subplots, while the green box represents the low dissimilarity subplots.
Forests 11 00186 g005
Figure 6. Generalized additive models for species diversity distributions along topographical environment variables ((a) elevation, (b) longitude, (c) latitude, (d) slope, (e) topographic wetness index, (f) curvature, (g) aspect, and (h) soil). Marks along the x-axis represent individual sample points. The function of species diversity (i.e., f(x)) is expressed in mean deviation form. Grey shading represents 95% confidence intervals. Continuous lines represent smoothing curves. The longitude and latitude are based on the world geodetic reference coordinate system (WGS84). The soil type is represented by 1 (No data), 2 (Clay), 3 (Clay loam), 4 (Loam), 5 (Rock), 6 (Sandy), and 7 (Sandy loam).
Forests 11 00186 g006
Figure 7. Generalized additive models for species diversity distributions along climatic variables ((a) annual average temperature, (b) annual average minimum temperature, (c) annual average maximum temperature, (d) temperature seasonality, (e) annual rainfall, and (f) rainfall seasonality). Marks along the x-axis represent individual sample points. The function of species diversity (i.e., f(x)) is expressed in mean deviation form. Grey shading represents 95% confidence intervals. Continuous lines represent smoothing curves.
Forests 11 00186 g007