Abstract
Seedling and sapling spatial patterns are important in community regeneration, and understanding the natural regeneration mechanisms of tree species in relation to spatial patterns will help improve forest management and community restoration efficiency. Based on data from three fixed plots established in birch forests (BF), coniferous and broadleaved mixed forests (CBMF) and coniferous mixed forests (CMF) in the central Greater Khingan Mountains in Heilongjiang Province, China, in 2017, we used the univariate and bivariate O-ring functions of the point pattern analysis method to evaluate the spatial patterns and associations of the main tree species in these three forest types at different development stages and identified the community successional stages according to the interspecific associations between dominant tree species and other tree species. The results showed that Betula platyphylla and Larix gmelinii in BF exhibited identical spatial distribution patterns and had a tendency to transition from an aggregated to a random distribution from saplings to adult trees, whereas every tree type in CBMF generally showed a random distribution. Adult trees of the main tree species in CMF, i.e., L. gmelinii and Picea koraiensis, mainly showed a random distribution, but P. koraiensis at other size classes generally showed an aggregated distribution. The intraspecific associations of the main tree species in BF and CMF at different development stages were constrained by the spatial scale within a given scope, while those in CBMF at different development stages were not significantly constrained by spatial scale. The results also show that the density of the three forest types was affected by the distance between the individuals of the various tree classes and adult trees, with different levels of influence. We analyzed the interspecific associations between dominant tree species and other tree species and then assessed community succession progress and found that the BF and CMF exhibited medium-term community succession, while the CBMF was in the primary stage. Our results further show that the spatial distribution patterns of the tree species in the small-diameter classes were jointly affected by adjacent habitats and diffusional limitations and that scale dependence existed in the intraspecific and interspecific associations. The analysis of the natural regeneration of spatial distribution and interspecific associations represents an efficient way to explore the stability of forest communities and dynamic changes in interspecific relationships during succession. The study results thus provide a theoretical basis for developing rational forest management measures.
1. Introduction
A natural secondary forest is forest that has regenerated as a result of natural processes after the original forest vegetation has been significantly disturbed at some point in time or, over a longer period of time. As a result, a secondary community forms through secondary succession, and degradation of the ecological system of the original forest occurs [1,2]. Having the characteristics of multiple tree species and a wide distribution scope [3], a natural secondary forest is not only an important production base of forest byproducts, timber and fuelwood but also plays an important role in water conservation, climate regulation and the maintenance of ecological balance [4,5]. A natural secondary forest is an integral component of forest resources. Due to fire, plant diseases, insect pests, and extreme weather in 1990–2015, the area of natural secondary forest around the world increased by 2.315 billion ha (56.08%) to 2.330 billion ha (58.27%) [6]. Simultaneously, according to the results of the Eighth National Forest Resource Inventory Survey, the area of China’s secondary forest was approximately 46.2% of the total national forest area and approximately 23.3% of the total amount of growing stock of national forest [7]. The secondary forest represents a large proportion of the total forest area, but the forest stands to experience lower dynamic succession stability due to different disturbance factors [8,9,10,11]. Therefore, a comprehensive plan is needed to improve forest quality, promote the positive succession of secondary forest and make it an important forest resource.
Natural regeneration is a natural biological process of the reproduction of forest resources of a natural secondary forest [12,13,14], which is a means of forest ecological systems for self-breeding and self-restoration and the basis of the maintenance of the dynamic stability and sustainable development of forest [15,16]. Natural regeneration has a profound influence on the continuous extension and succession of phytocoenosis over time and space and the structure of the forest community and its biodiversity in the future [17,18,19,20]. The composition and spatial patterns of seedlings and saplings will directly affect the number of plant populations in the forest community and ultimately affect the succession process of the forest community [21], the effectiveness of forest management can be improved by analyzing the pattern of seedlings or saplings and making corresponding management strategies [22].
The spatial distribution patterns and the spatial correlation of the community are two expression forms of the population’s ecological relations to the spatial patterns and are two major aspects of the study of plant spatial patterns [23]. In forest communities, plant populations have different biological characteristics and are affected by different intraspecific and interspecific relationships. The regeneration of plants in forests, especially tree species, in the successional process of forests has a decisive impact on the future growth and development of forest stands [24,25]. In the process of natural succession, the ideal spatial distribution pattern of a secondary forest is random distribution. At this time, the positive associations are the main correlations among species, and the natural succession, which have reached a relatively good state. The analysis of the distribution patterns of forest species and their correlations using spatial point patterns can help us to better evaluate the successional direction of forests [26,27,28]; additionally, it has important significance in disclosing the regeneration and maintenance mechanisms of populations [29,30,31].
There are widely distributed natural secondary forests on a large scale in the Greater Khingan Mountains, but they are simultaneously accompanied by various problems, such as a lack of target tree species, an unstable structure, poor regeneration, and low stand quality and ecological function [32]. Previous studies have frequently been carried out to describe the community distribution patterns of natural secondary forest in the Greater Khingan Mountains area in the quantitative form by using different analytical methods [33,34,35], but few have focused on the community distribution patterns and intraspecific and interspecific associations at different spatial scales, and there are also few studies on judging forest succession process by interspecific associations. For these reasons, the purpose of our research is to explore the internal mechanism of the formation of these patterns through the study of the distribution patterns and interspecies correlations of tree species under different growth stages, to clarify the stages of natural succession of different forest types, and to provide theoretical support for the formulation of reasonable forest management planning in the future.
2. Materials and Methods
2.1. Study Area
The forest region of the Greater Khingan Mountains area is the largest forest region in China; it is not only the natural cover for defense against the Hulunbuir Grassland and the Song-Nen Plain but also plays an important role in conserving and regulating water resources in the Heilongjiang River and Nenjiang River [36]. The study was conducted at Cuigang Forest Farm in the central part of the Greater Khingan Mountains in Heilongjiang Province, China (124°16′–125°10′E, 51°43′–52°15′N). The climate is classified as frigid-temperate zone continental monsoon. The annual precipitation in this area is 514 to 646 mm. The mean annual temperature is 2.6 °C, with a maximum temperature of 37.9 °C and a minimum temperature of −46.9 °C. The elevation of the study area varies from 415 to 858 m. The soils are mostly Umbri-Gelic Cambosols, according to the Chinese taxonomic system [37].
The vegetation in this area belongs to the flora of the Greater Khingan Mountains, and the representative vegetation type is the bright conifer forest of the cool temperate zone of China. As a result of large-scale logging, this region is dominated by natural secondary forests. The main natural species are Larix gmelinii and Betula platyphylla; other species include a small number of Populus davidiana, Pinus sylvestris var. mongolica, and Picea koraiensis. The major shrubs in this region are Rhododendron dauricum, Lespedeza bicolor, Ledum palustre and Vaccinium vitis-idaea. Alnus sibirica occur as small, widely distributed subordinate trees in this region.
2.2. Plot Design and Survey
In August 2017, we established three 1-ha plots (100 × 100 m) in different forest types, these sampling sites were located in birch forest (BF), coniferous and broadleaved mixed forest (CBMF), and coniferous mixed forest (CMF) in Cuigang Forest Farm and were the main forest types in this area. CMF were clear-cut in the 1960s, and a secondary forest at this stage was formed through natural recovery. BF and CBMF were severely harvested in the 1990s; the trees with larger DBH (diameter at the breast height) were harvested, and the cutting intensity was about 50%. All three types of forests were during the middle-aged forest stage. We further subdivided each plot into 100 contiguous 10 × 10 m quadrats. For all trees in the quadrats, information regarding the species, states (alive, dead and downwood, etc.), DBH, tree height, crown width (for trees with DBH ≥ 5 cm), ground diameter (GD < 5 cm above ground level) and coordinate position were recorded. DBH and GD was measured with a tape meter, the height of trees was measured with an ultrasonic altimeter (Vertex IV), the position of trees and the crown width were measured with a laser range finder (LDM-100H). All species in the three forest types were classified according to the following grades: seedlings (<30 cm in height); saplings (≥30 cm and <2 m in height); small trees (≥2 m in height and <5 cm in DBH); medium-sized trees (5 cm ≤ DBH < 15 cm); and adult trees (≥15 cm in DBH).
2.3. Spatial Pattern Analysis
Point pattern analysis regards individual plants as a point in two-dimensional space and then analyses of their quantity and spatial characteristics. This method overcomes the shortcoming of the traditional method that the spatial distribution patterns at only a single scale can be analyzed and makes the best use of the spatial information for the different points [38,39]. The Ripley K and Ripley L functions are the most commonly used methods in spatial point pattern analysis of vegetation, but they have obvious scale accumulative effects and are prone to edge effects [40,41,42]. O-ring statistics can effectively eliminate the accumulation effect of scale in the Ripley K function by separating the grades of specific distances [38,43].
In this study, the univariate O-ring function O(r) was used to analyze the spatial distribution patterns of species at different stages at multiple scales, and the bivariate O-ring function O12(r) was used to analyze the spatial associations of species at different development stages in the three forest types. We used a null model with complete spatial randomness (CSR) to assess the univariate point patterns. The appropriate null model for bivariate analysis must be selected carefully based on the biological hypothesis to be tested. Considering the time sequence of the different development stages, we adopted the antecedent condition null model, namely, the large-diameter fixed model and the small-diameter random model [23,31,44].
Programita software, was used for the abovementioned point pattern analysis of tree spatial distributions [45]. The analyses were performed up to 50 m with a 1 m lag distance, not larger than half the length of the plot side, to eliminate the edge effects. Detailed method for eliminating the edge effects can be found in the reference [38,39]. To evaluate departures from the null model, we compared the O(r) functions and O12(r) functions of the observed spatial patterns with approximately 95% simulation envelopes, which were the fifth lowest and highest values of the O(r) functions and O12(r) functions of the data created by 99 Monte Carlo simulations of the appropriate null models [30].
3. Results
3.1. Population Structure
Of all tree species in the BF, B. platyphylla represented the largest proportion, and their basal area accounted for 90.9% of the total basal area, while other species, including L. gmelinii, P. davidiana, A. sibirica and Salix triandra, occurred infrequently (Table 1). The two main tree species in the CBMF, B. platyphylla and L. gmelinii, comprised 98.2% of the basal area of all species, while other stems, including P. sylvestris var. mongolica, P. koraiensis and P. davidiana, accounted for a very small proportion (Table 1). In the CMF, L. gmelinii, P. sylvestris var. mongolica and P. koraiensis comprised 86.6% of the basal area of all species, of which L. gmelinii accounted for the largest proportion (62%) of the total, while the basal area of two other broadleaved species, B. platyphylla and P. davidiana, accounted for 13.4% of all woody stems (Table 1). Mortality across the three forest types was mainly concentrated within the smallest size class and decreased in terms of density for larger-diameter grades (Figure 1). The plot for CMF exhibited the only reversed J-shaped diameter distribution in the three forest types (Figure 1).

Table 1.
Number of species and basal area in the three forest plots.
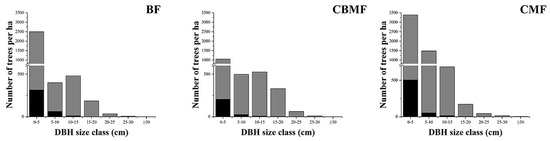
Figure 1.
DBH size-class distributions of three forest types. Black bars = dead trees; gray bars = live trees.
3.2. Spatial Distribution Patterns of Species in Three Forest Types
In the BF, seedlings of B. platyphylla showed an aggregated distribution at scales from 1 to 7 m, exhibited a dominant uniform distribution at 8 to 39 m scales and returned to an aggregated distribution at scales from 40 to 47 m (Figure 2, Bp1). Saplings and small trees of B. platyphylla presented an aggregated distribution at scales from 1 to 32 m and 1 to 29 m, respectively, while at larger scales, the proportion of small trees showing a random distribution was larger than that of saplings (Figure 2, Bp2, Bp3). Within all scales, the proportion of medium-sized trees displaying a random distribution was larger than that of the first three growth stages (Figure 2, Bp4), and adult trees of B. platyphylla showed a random distribution at other scales in addition to a uniform distribution at the 2 m scale (Figure 2, Bp5). Saplings, small trees and medium-sized trees of L. gmelinii showed a relatively obvious aggregated distribution at a small scale, while at larger scales, L. gmelinii showed a random distribution at all stages (Figure 2, Lg2–Lg4). Saplings and small trees of A. sibirica showed similar distribution patterns; with an increase in scale, the distribution characteristics of an aggregated distribution, a random distribution, and a uniform distribution were presented, in turn (Figure 2, Al2, Al3). Small trees of P. davidiana showed an aggregated distribution at scales from 1 to 26 m. At the other scales, the distribution patterns alternated between a uniform distribution and a random distribution, and the proportion of small trees showing a random distribution was slightly higher than that showing a uniform distribution (Figure 2, Po3).
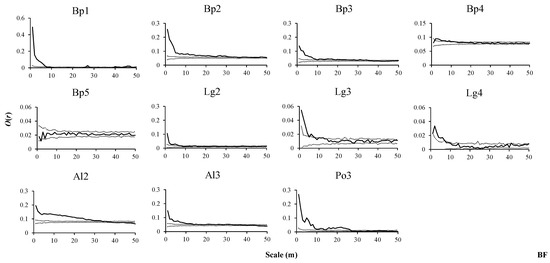
Figure 2.
Spatial distributions of tree species in BF. O(r) values indicate the spatial aggregation degree of tree species, thin dashed lines indicate the upper and lower limits of the 95% simulation envelope of the univariate toroidal shift null model. Points above the upper envelope indicate an aggregated distribution, points between the envelopes indicate a random distribution, and points below the lower envelope indicate a uniform distribution (From Figure 2 to Figure 4). Bp1, Bp2, Bp3, Bp4, and Bp5 denote seedlings, saplings, small trees, medium-sized trees and adult trees of B. platyphylla, respectively. Other tree species at different growth stages were also expressed in this way (From Figure 3 to Figure 10).
In CBMF, B. platyphylla were mainly randomly distributed at each growth stage (Figure 3, Bp2–Bp5). Saplings, small trees and medium-sized trees of L. gmelinii showed similar distribution patterns, presenting an aggregated distribution at small scales. With the increase in scale, the random distribution became dominant (Figure 3, Lg2–Lg4), and adult trees of L. gmelinii showed a completely random distribution (Figure 3, Lg5). Saplings of A. sibirica showed an aggregated distribution at scales from 1 to 17 m and generally a random distribution at scales from 18 to 39 m, with the restoration of the aggregated distribution at scales from 40 to 50 m. Small trees of A. sibirica showed an aggregated distribution at scales from 1 to 5 m and mainly a random distribution at the remaining scales (Figure 3, Al2, Al3). Saplings of P. davidiana showed an aggregated distribution at scales from 1 to 21 m and alternated between a random distribution and uniform distribution at the remaining scales (Figure 3, Po2).
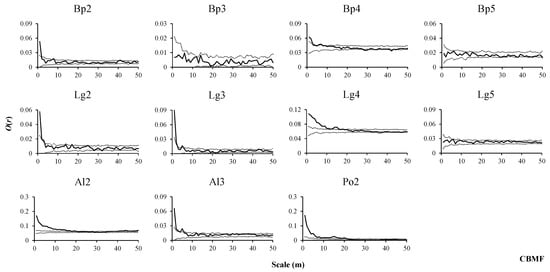
Figure 3.
Spatial distributions of tree species in CBMF.
In the CMF, seedlings, saplings, small trees, and medium-sized trees of P. koraiensis mainly presented aggregated distributions (Figure 4, Pi1–Pi4), and the distributions of adult trees were mainly clustered and random scales from 1 to 20 m and 21 to 50 m, respectively (Figure 4, Pi5). Saplings and medium-sized trees of P. sylvestris var. mongolica mainly showed aggregated distributions scales from 1 to 30 m scales (Figure 4, Ps2, Ps4), while seedlings, small trees and adult trees mainly showed a random distribution scales from 10 to 50 m scales (Figure 4, Ps1, Ps2, Ps5). B. platyphylla were mainly randomly distributed in the sapling and medium-sized tree growth stages (Figure 4, Bp2, Bp4), while the distributions of small trees of B. platyphylla were mainly clustered and random at the 1 to 18 and 19 to 50 m scales, respectively (Figure 4, Bp3). Saplings and small trees of L. gmelinii presented similar distribution trends, both showing an aggregated distribution at a wide range of scales (saplings, 1 to 31 m; small trees, 1 to 35 m), a random distribution at intermediate scales, and finally an even distribution at a large scale (Figure 4, Lg2, Lg3). Medium-sized trees of L. gmelinii were mainly aggregated at scales from 1 to 25 m, and at scales from 26 to 50 m, a random distribution was dominant (Figure 4, Lg4). Adult trees of L. gmelinii were mainly randomly distributed (Figure 4, Lg5). Small trees of S. triandra showed an aggregated distribution at scales from 1 to 20 m and a random distribution at scales from 21 to 50 m (Figure 4, Sa2). Medium-sized trees of P. davidiana predominantly showed an aggregated distribution at scales from 1 to 30 m, the random distribution was dominant at scales from 31 to 45 m, and the uniform distribution was found at the remaining scales (Figure 4, Po4).

Figure 4.
Spatial distributions of tree species in CMF.
3.3. Intraspecific Spatial Associations in Three Forest Types
In the BF, seedlings and saplings of B. platyphylla were positively associated at the scales from 1 to 12 m (Figure 5, Bp2–Bp1). In addition, seedlings and saplings of B. platyphylla presented positive associations with small trees of the same species at scales from 1 to 7 m and 1 to 32 m, respectively, and their densities significantly decreased with distance from the small trees of B. platyphylla at small scales (Figure 5, Bp3–Bp1, Bp3–Bp2). The density of seedlings decreased with increasing distance from saplings of B. platyphylla at small scales (Figure 5, Bp2–Bp1). Seedlings, saplings, and small trees of B. platyphylla showed similar associations with medium-sized trees of B. platyphylla at all scales; they all presented negative associations, no associations, and positive associations in turn. Furthermore, the densities of seedlings, saplings and small trees of B. platyphylla gradually increased with increasing distance from medium-sized trees, and there was no obvious decline (Figure 5, Bp4–Bp1, Bp4–Bp2, Bp4-Bp3). The results showed that there were no associations between seedlings and adult trees of B. platyphylla at scales from 1 to 30 m (Figure 5, Bp5–Bp1), saplings and small trees of B. platyphylla were not associated with adult trees of B. platyphylla at scales from 1 to 20 m (Figure 5, Bp5–Bp2, Bp5–Bp3), and medium-sized trees of B. platyphylla were not associated with adult trees of B. platyphylla at scales from 2 to 50 m (Figure 5, Bp5–Bp4). The results also showed that densities of saplings and small trees of B. platyphylla tended to increase at increasing distance from adult trees of B. platyphylla and that the range of increase tended to stabilize after the intermediate scales (Figure 5, Bp5–Bp2, Bp5–Bp3). In general, the density of medium-sized trees did not significantly change with increasing distance from adult trees (Figure 5, Bp5–Bp4). Saplings and small trees of L. gmelinii were mainly positively associated at the 1 to 15 m scale, and the density of saplings of L. gmelinii tended to decrease first and then increase, with increasing distance from small trees of the same species and generally changing into a V-shape (Figure 5, Lg3–Lg2). Saplings and small trees of L. gmelinii presented significantly positive associations with medium-sized trees of L. gmelinii at the 1 to 6 m and 1 to 3 m scales, respectively, but were mainly unassociated at subsequent scales. The densities of saplings and small trees of L. gmelinii showed similar patterns, both tending to decrease with increasing distance from medium-sized trees of L. gmelinii, reaching a minimum at approximately the 17 m scale, and then increasing slightly and generally stabilizing with increasing distance from medium-sized trees L. gmelinii (Figure 5, Lg4–Lg2, Lg4–Lg3). Saplings of A. sibirica were positively associated at the 1–34 m scale, and the densities of saplings of A. sibirica decreased with increasing distance from small trees of A. sibirica (Figure 5, Al3–Al2).
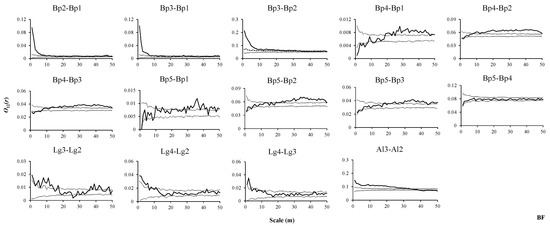
Figure 5.
Spatial associations of tree species in BF. O12(r) values indicate the spatial associations between the same tree species or different tree species at different stages, thin dashed lines indicate the upper and lower limits of the 95% simulation envelope of the bivariate toroidal shift null model. Points above the upper envelope indicate positive associations, points between the envelopes indicate no associations, and points below the lower envelope indicate negative associations (From Figure 5 to Figure 10).
In the CBMF, the results showed that there was a positive association between small trees and saplings of B. platyphylla at small scales (1–2 m), and they were not associated at the subsequent scales, while the density of saplings gradually decreased and stabilized with an increasing distance from the small trees of B. platyphylla and increased slightly at larger scales (45–50 m, Figure 6, Bp3–Bp2). Saplings and small trees of B. platyphylla were generally not associated with medium-sized trees of the same species (Figure 6, Bp4–Bp2, Bp4–Bp3), while the density of saplings decreased at small scales and tended to stabilize with increasing distance from medium-sized trees of B. platyphylla (Figure 6, Bp4–Bp2). Furthermore, the density of small trees changed in an M-shaped pattern with increasing distance from medium-sized trees of B. platyphylla at scales from 1 to 15 m, and the range of this change decreased after 16 m (Figure 6, Bp4–Bp3). Saplings, medium-sized trees and small trees of B. platyphylla presented no associations with adult trees of B. platyphylla at all scales (Figure 6, Bp5–Bp2, Bp5–Bp3, Bp5–Bp4), while the densities of saplings and small trees of B. platyphylla showed a fluctuating distribution that first decreased and then increased with an increasing distance from the adult trees of B. platyphylla (Figure 6, Bp5–Bp2, Bp5–Bp3). The density of medium-sized trees of B. platyphylla also showed a fluctuating distribution, first increasing and then decreasing with an increasing distance from the adult trees of B. platyphylla (Figure 6, Bp5–Bp4). The results also showed that there were positive associations between saplings and small trees of L. gmelinii at the scales from 1 to 2 m, but there were generally no associations at the remaining scales, while the density of saplings of L. gmelinii gradually decreased with an increasing distance from the small trees of L. gmelinii at small scales and then tended to stabilize (Figure 6, Lg3–Lg2). Saplings and small trees of L. gmelinii were not associated with medium-sized trees of L. gmelinii at any scale, and their densities also did not significantly change with an increasing distance from the medium-sized trees of L. gmelinii across the overall range (Figure 6, Lg4–Lg2, Lg4–Lg3). Saplings, small trees, medium-sized trees and adult trees of L. gmelinii were not associated at any of the scales (Figure 6, Lg5–Lg2, Lg5–Lg3, Lg5–Lg4), while the densities of saplings and small trees of L. gmelinii showed an M-shaped pattern, first increasing and then decreasing with an increasing distance from the adult trees of L. gmelinii (Figure 6, Lg5–Lg2, Lg5–Lg3). In addition, the density of medium-sized trees of L. gmelinii changed slightly overall with increasing distance from adult trees of L. gmelinii (Figure 6, Lg5–Lg4). Saplings of A. sibirica were positively associated at the scale from 1 to 20 m, and the density of saplings of A. sibirica decreased with increasing distance from small trees of A. sibirica and then tended to stabilize at intermediate scales (Figure 6, Al3–Al2).
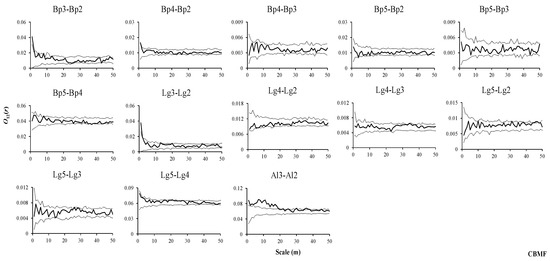
Figure 6.
Spatial associations of tree species in CBMF.
In the CMF, seedlings of P. koraiensis presented significantly positive associations with saplings of the same species at all scales, and the density of seedlings gradually decreased with increasing distance from saplings of P. koraiensis at small scales. (Figure 7, Pi2–Pi1). Seedlings and saplings of P. koraiensis were mainly positively associated with small trees of P. koraiensis (Figure 7, Pi3–Pi1, Pi3–Pi2), the density of seedlings increased first and then decreased with increasing distance from small trees of P. koraiensis (Figure 7, Pi3–Pi1), and the density of saplings decreased with increasing distance from small trees of P. koraiensis (Figure 7, Pi3–Pi2). Across all scales, seedlings, saplings and small trees of P. koraiensis were generally positively associated with increasing distance from medium-sized trees of P. koraiensis (Figure 7, Pi4–Pi1, Pi4–Pi2, Pi4–Pi3). The densities of seedlings and saplings of P. koraiensis tended to first slightly increase and then decrease with increasing distance from medium-sized trees of P. koraiensis (Figure 7, Pi4–Pi1, Pi4–Pi2). The density of small trees of P. koraiensis gradually decreased with increasing distance from medium-sized trees of P. koraiensis (Figure 7, Pi4–Pi3). Seedlings and medium-sized trees of P. koraiensis showed similar associations with adult trees of P. koraiensis; they presented positive associations, no associations, and negative associations in turn, their densities gradually decreased with increasing distance from adult trees of P. koraiensis, and the range of variation also increased (Figure 7, Pi5–Pi1, Pi5–Pi4). Saplings and small trees of P. koraiensis presented the characteristics of positive associations and no associated mutual transformation with adult trees of P. koraiensis at all scales. The densities of saplings and small trees changed slightly with increasing distance from adult trees of P. koraiensis (Figure 7, Pi5–Pi2, Pi5–Pi3).
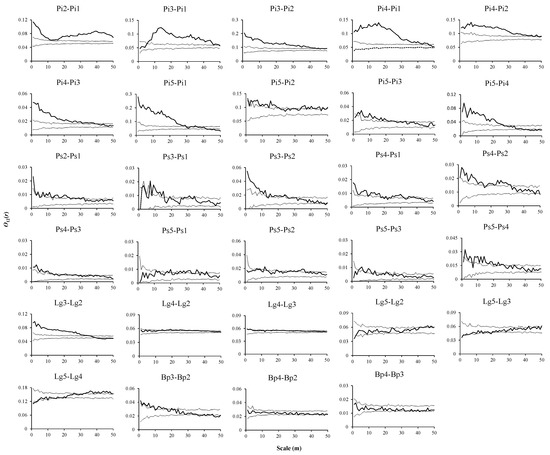
Figure 7.
Spatial associations of tree species in CMF.
Seedlings and saplings of P. sylvestris var. mongolica were mainly positively associated at 132- m scales, and the density of seedlings of P. sylvestris var. mongolica gradually decreased and then stabilized with increasing distance from saplings of P. sylvestris var. mongolica (Figure 7, Ps2–Ps1). Seedlings and small trees of P. sylvestris var. mongolica were positively associated at scales of 715- m and 28 to 34 m, respectively (Figure 7, Ps3–Ps1). Saplings and small trees of P. sylvestris var. mongolica were generally positively associated at scales from 1 to 25 m, with the density of saplings of P. sylvestris var. mongolica tending to decrease with increasing distance from small trees of P. sylvestris var. mongolica (Figure 7, Ps3–Ps2). Seedlings, saplings and small trees of P. sylvestris var. mongolica were mainly positively associated with medium-sized trees of P. sylvestris var. mongolica at the scales from 1 to 38 m, 2 to 32 m, and 1 to 31 m, respectively, and their densities gradually decreased with increasing distance from medium-sized trees of P. sylvestris var. mongolica at small scales and tended to stabilize at the remaining scales (Figure 7, Ps4–Ps1, Ps4–Ps2, Ps4–Ps3). Seedlings, saplings and small trees of P. sylvestris var. mongolica were mainly unassociated with adult trees of P. sylvestris var. mongolica at all scales, and their densities did not significantly change with increasing distance from adult trees of P. sylvestris var. mongolica (Figure 7, Ps5–Ps1, Ps5–Ps2, Ps5–Ps3). Medium-sized and adult trees of P. sylvestris var. mongolica presented positive associations at the 1 to 25 m scale, and the density of medium-sized trees gradually decreased with increasing distance from adult trees of P. sylvestris var. mongolica and tended to stabilize at the 45 to 50 m scales (Figure 7, Ps5–Ps4).
Saplings and small trees of L. gmelinii presented positive associations at the 1 to 35 m scales, and the density of saplings decreased with increasing distance from small trees of L. gmelinii and tended to stabilize at the scales from 46 to 50 m (Figure 7, Lg3–Lg2). Saplings of L. gmelinii presented positive associations with medium-sized trees at intermediate scales (14 to 36 m), small trees of L. gmelinii mainly presented negative associations with medium-sized trees, and the densities of saplings and small trees of L. gmelinii did not change significantly with increasing distance from medium-sized trees of the same species (Figure 7, Lg4–Lg2, Lg4–Lg3). Saplings and adult trees of L. gmelinii were generally not associated at the scales from 1 to 40 m (Figure 7, Lg5–Lg2), and small trees and adult trees of L. gmelinii were generally not associated at all scales (Figure 7, Lg5–Lg3). Medium-sized trees and adult trees of L. gmelinii were generally not associated at the scales from 1 to 30 m (Figure 7, Lg5–Lg4), and the densities of saplings, small trees and medium-sized trees of L. gmelinii increased with increasing distance from adult trees of L. gmelinii at all scales, while the range of the increase was small (Figure 7, Lg5–Lg2, Lg5–Lg3, Lg5–Lg4). Saplings and small trees of B. platyphylla were mainly positively associated at scales from 1 to 17 m, and the density of saplings of B. platyphylla decreased with increasing distance from small trees of B. platyphylla at all scales (Figure 7, Bp3–Bp2). Saplings and small trees of B. platyphylla were generally not associated with medium-sized trees of B. platyphylla at all scales, and their densities did not significantly change with increasing distance from medium-sized trees of the same species (Figure 7, Bp4–Bp2, Bp4–Bp3).
3.4. Interspecific Associations of Dominant Tree Species with Other Trees at Different Stages in Three Forest Types
In the BF, the dominant species of B. platyphylla showed similar associations with all individuals, saplings and small trees of L. gmelinii across the different spatial scales, i.e., positive associations were found at the scales from 1 to 15 m, and no positive associations were found at the remaining scales (Figure 8, Bp–Lg, Bp–Lg2, Bp–Lg3). B. platyphylla and P. davidiana were mainly negatively associated, but generally presented no associations with A. sibirica (Figure 8, Bp–Po, Bp–Al).
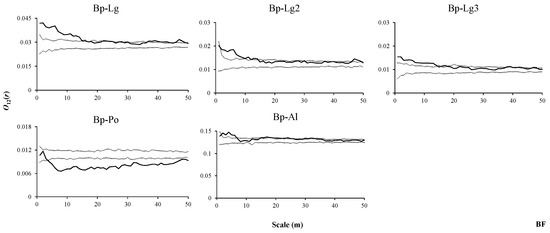
Figure 8.
Spatial associations between B. platyphylla and other tree species in BF.
In the CBMF, L. gmelinii, the dominant tree species, was not associated with all individuals, sapling trees, small trees, medium-sized trees, and adult trees of B. platyphylla (Figure 9, Lg–Bp, Lg–Bp2, Lg–Bp3, Lg–Bp4, Lg–Bp5) and was mainly positively associated with P. davidiana and A. sibirica (Figure 9, Lg–Po, Lg–Al).
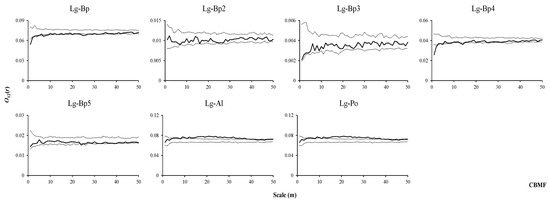
Figure 9.
Spatial associations between L. gmelinii and other tree species in CBMF.
In the CMF, L. gmelinii (the dominant species) and P. koraiensis were negatively associated at small scales, not associated at intermediate scales, and positively associated at large scales (Figure 10, Lg–Pi). L. gmelinii was mainly not associated, and negatively associated with seedlings and small trees of P. koraiensis at scales from 1 to 20 m, respectively, while these groups presented positive associations and no associations at other scales, respectively. L. gmelinii and saplings of P. koraiensis mainly presented no associations (Figure 10, Lg–Pi1, Lg–Pi2, Lg–Pi3). With increasing size, negative associations, no associations, and positive associations were found, in order, between L. gmelinii and medium-sized trees and adult trees of P. koraiensis (Figure 10, Lg–Pi4, Lg–Pi5). L. gmelinii mainly showed positive associations with seedlings and the whole trees of P. sylvestris var. mongolica at all scales (Figure 10, Lg–Ps, Lg–Ps1), L. gmelinii were mainly positively associated with saplings and adult trees of P. sylvestris var. mongolica at scales from 1 to 20 m (Figure 10, Lg–Ps2, Lg–Ps5), respectively, and were mainly positively associated with small trees and medium-sized of P. sylvestris var. mongolica at 135- m scales, respectively (Figure 10, Lg–P3, Lg–Ps4). L. gmelinii mainly showed no associations with saplings, small trees, medium-sized trees, and all individuals of B. platyphylla (Figure 10, Lg–Bp, Lg–Bp2, Lg–Bp3, Lg–Bp4). P. davidiana and S. triandra presented negative associations with L. gmelinii at scales from 1 to 25 m and 1 to 20 m, respectively, and all showed no associations at other scales (Figure 10, Lg–Po, Lg–Sa).
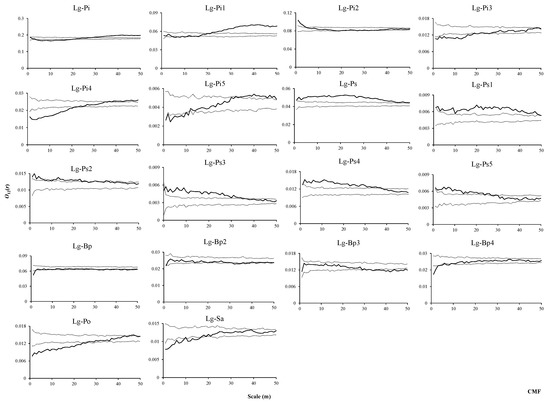
Figure 10.
Spatial associations between L. gmelinii and other tree species in CMF.
4. Discussion
In the natural secondary forest, the overall spatial distribution patterns of trees of different species experienced a gradual reduction in the degree of aggregation from young forest to old-growth forest with the size increase. In general, the transition tendency of a community’s spatial patterns is from “aggregated” to “random” or “uniform” [40,46,47], and in the development process of a community from containing individuals with a small diameter to those with a large diameter, the distribution patterns show a tendency to transition from aggregated to random [48]. The main reasons for the aggregated distribution are diffusional limitation, adjacent habitats and the combination of both [49,50,51]. In this study, the saplings, small trees, and medium-sized trees of L. gmelinii in the three types of forest showed an aggregated distribution at a small scale, which is related to the dispersal properties of its seeds; the seeds are mainly affected by the force of gravity since they have a large mass, therefore, a significantly aggregated distribution occurred at locations near the mother tree at a small scale. Interspecific competition was not substantial at early developmental stages; as intraspecific competition intensified, the population’s aggregated distribution gradually weakened and became random in adult trees in this species. P. koraiensis and P. sylvestris var. mongolica showed a distribution similar to that of L. gmelinii at every stage in the CMF, and the distribution pattern of the seeds of both of these species was identical to that of L. gmelinii seeds. This finding was consistent with research results from coniferous forest in the cold temperate zone [33,36]. The seeds of B. platyphylla are small and winged, so they are dispersed mainly by wind and have strong diffusion capacity. During the process of seeds dispersal, the seeds can quickly occupy forest gaps and bare land for regeneration and thus tend to be randomly distributed. In this study, B. platyphylla in CBMF and CMF at all levels predominantly showed a random distribution, but in BF, the saplings and small trees of B. platyphylla predominantly showed an aggregated distribution at the scales from 1 to 35 m. These patterns were observed because there is a large area (area greater than 100 ha) of pure BF near the sample site and some gaps in BF, as the seeds of this species easily assume an aggregated distribution in the local area due to their diffusion process. Furthermore, the forest surrounding the other two sample sites was mainly mixed forest, signifying that adjacent habitats had some influence on the spatial patterns of saplings and small trees of B. platyphylla. The variation in the distribution patterns of a single species in different communities provides information on the formation and maintenance mechanisms of different communities [52,53].
Our results showed that in the BF (Figure 5), B. platyphylla at large diameter classes showed a positive correlation within a certain scale range relative to trees at smaller diameter classes (Figure 5, Bp5–Bp3, Bp5–Bp2, Bp4–Bp3, Bp4–Bp2), signifying that the former could play the role of promoting the latter. Moreover, the individual density of B. platyphylla at small diameter classes increased with distance between trees at larger diameter class within a certain scale range, indicating that a distance constraint effect took place at the seedling and sapling stages [54,55]. In addition, the dominant tree species, B. platyphylla, showed positive associations with all individuals, seedlings and saplings of L. gmelinii at small scales (1–15 m, Figure 8, Bp–Lg, Bp–Lg2, Bp–Lg3), suggesting that B. platyphylla took the lead in entering the forest area as a pioneer tree species, creating a favorable and reliable environment for the regeneration and growth of L. gmelinii in the BF, which also provides support for our forest management planning, as we can plant L. gmelinii around the B. platyphylla to promote its growth. In addition, the dominant tree species did not show obvious associations with the other main tree species at different growth and development stages at a large scale, which also reflects the scale dependence of the spatial patterns of the populations. This finding indicates that associations occur between individual trees within a certain scale range, while these associations will be greatly weakened beyond this range [40,56,57]. In the CMF (Figure 10), the dominant tree species L. gmelinii showed negative associations with all P. koraiensis individuals at a small scale, signifying that L. gmelinii plays a role in suppressing the growth of P. koraiensis. However, L. gmelinii showed positive associations with all P. koraiensis individuals at a large spatial scale; in this case, appropriate cutting should be taken to improve the negative associations between L. gmelinii and P. koraiensis and promote the growth of P. koraiensis. (Figure 10, Lg–Pi).
In the CMF (Figure 7), the positive associations between the P. koraiensis in the large-diameter size class and the P. koraiensis in the small-diameter size class within a certain scale range signified that the latter was suitable to survive under the canopy of the former. The positive associations generally observed between all stages of the dominant tree species (L. gmelinii) and all P. sylvestris var. mongolica individuals and trees in the four growth stages signified that L. gmelinii promoted the growth of P. sylvestris var. mongolica (Figure 10, Lg–Ps, Lg–Ps1, Lg–Ps2, Lg–Ps3, Lg–Ps4). Based on this association, we can use L. gmelinii as the protective tree species of P. sylvestris var. mongolica to increase the tree species diversity in the future forest management decision. However, the negative associations between all individuals of L. gmelinii and the broadleaf species of P. davidiana within a certain scale range occurred because the interspecific competition intensity between these species was correlated to the community’s dynamic change, the pioneer species of P. davidiana showed the strongest competitive intensity at the initial stage of community formation, which gradually decreased over the process of succession [58], and the pioneer species promoted the establishment, growth and development of species in the latter periods of community succession [59].
We can evaluate successional stages according to the associations between the dominant tree species and other main tree species [60,61,62]. At the initial stage of community development, species tend to be stochastic. In the CBMF in this study, the dominant tree species L. gmelinii showed no associations with the main tree species B. platyphylla at every development stage at large spatial scales, signifying that there were no specific interspecific relations between the main tree species in this community. All of them occurred at the initial stage of community succession. However, in the BF and CMF, the dominant tree species and the main tree species presented stronger positive associations or negative associations with the main tree species of different diameter classes at a certain scale because the interspecific relations in the community showed complex changes as intraspecific and interspecific competition intensified as community succession moved into the middle phase [63,64]. With an increasing number of dominant tree species, the dependence of the population greatly declined, resulting in positive or negative associations. As community succession continued, the community structure and type position tended to become stable and reach a climax condition, and the interspecific relations at the time were dominated by positive associations [65,66]. The analysis of spatial patterns and interspecific correlations is an effective way to identify the existence of latent processes in forest communities [67,68].
5. Conclusions
Our study focused on the spatial distribution patterns and intraspecific associations of the main tree species during their different growth and development stages and the community characteristics of three forest types and simultaneously analyzed the interspecific associations of the main tree species across different diameter classes and the dominant tree species in every forest type. The spatial distribution patterns were influenced by adjacent habitats and diffusion limitation. On the basis of the evaluation of the community succession process through the analysis of the interspecific associations between dominant tree species and other main tree species, the CMF and the BF were considered to be in the middle stage of succession, and the CBMF was considered to be in the initial stage.
As the local government in the Greater Khingan Mountains area prohibits deforestation, the appropriate tending and intermittent cutting of forest and undergrowth cleaning work would promote the regeneration and stability of the communities in these three forest types. Many factors affect the spatial pattern of communities: early cutting disturbance, natural disasters, soil and landform [69,70]. Moreover, the different ages of the different forest storeys within a single community showed different spatial distribution patterns, but this requires further investigation and research [71,72].
Author Contributions
L.Z. participated in field work, performed data analysis, and wrote the paper. L.D. participated in field work and performed data analysis. Q.L. helped in data analysis. Z.L. supervised and coordinated the research project, designed and installed the experiment, took some measurements, and contributed to writing the paper. All authors have read and agreed to the published version of the manuscript.
Funding
This study was financially supported by the National Key R&D Program of China (2017YFC0504103), the National Natural Science Foundation of China (31700562).
Acknowledgments
The authors would like to thank the faculty and students of the Department of Forest Management, Northeast Forestry University (NEFU), China, who provided and collected the data for this study.
Conflicts of Interest
The authors declare no conflict of interest.
References
- Lu, D.; Zhang, G.; Zhu, J.; Wang, G.; Zhu, C.; Yan, Q.; Zhang, J. Early natural regeneration patterns of woody species within gaps in a temperate secondary forest. Eur. J. Forest Res. 2019, 138, 991–1003. [Google Scholar] [CrossRef]
- Zhu, J.; Lu, D.; Zhang, W. Effects of gaps on regeneration of woody plants: A meta-analysis. J. Forestry. Res. 2014, 25, 501–510. [Google Scholar] [CrossRef]
- Zhao, F.; Yang, J.; He, H.; Dai, L. Effects of natural and human-assisted regeneration on landscape dynamics in a Korean pine forest in Northeast China. PLoS ONE 2013, 8, e82414. [Google Scholar] [CrossRef] [PubMed]
- Yu, D.; Zhou, L.; Zhou, W.; Ding, H.; Wang, Q.; Wang, Y.; Wu, X.; Dai, L. Forest management in Northeast China: History, problems, and challenges. Environ. Manage. 2011, 48, 1122–1135. [Google Scholar] [CrossRef] [PubMed]
- Li, H.Z.; Li, F.R.; Jia, W.W.; Wang, S.F. Water conservation of litterfall in different mixed forest types of white birch and larch in Daxing’an Mountain. J. Northeast For. Univ. 2014, 42, 43–46+52. (In Chinese) [Google Scholar]
- Feng, Y.Q.; Chen, C.F.; Qin, L.; He, Y.T.; Wang, P.; Duan, Y.X.; Wang, Y.F.; He, Y.J. Effects of different management models on stand structure and plant diversity of natural secondary forests of Quercus Mongolica. Sci. Silv. Sin. 2018, 54, 12–21. [Google Scholar]
- State Forestry Administration of the People’s Republic of China. Eighth National Forest Resource Inventory Report (2009–2013), February 25, 2014; State Forestry Administration of the People’s Republic of China: Beijing, China, 2014. [Google Scholar]
- Nagashima, H. The processes of height-rank determination among individuals and neighbourhood effects in Chenopodium album L. Stands. Ann. Bot. 1999, 83, 501–507. [Google Scholar] [CrossRef][Green Version]
- Cranston, B.H.; Hermanutz, L. Seed-seedling conflict in conifers as a result of plant-plant interactions at the forest-tundra ecotone. Plant Ecol. Divers. 2013, 6, 319–327. [Google Scholar] [CrossRef]
- Frelich, L.E.; Sugita, S.; Reich, P.B.; Davis, M.B.; Friedman, S.K. Neighbourhood effects in forests: Implications for within stand patch structure. J. Ecol. 1998, 86, 149–161. [Google Scholar] [CrossRef]
- Xu, H.; Li, Y.; Liu, S.; Zang, R.; He, F.; Spence, J.R. Partial recovery of a tropical rain forest a half-century after clear-cut and selective logging. J. Appl. Ecol. 2015, 52, 1044–1052. [Google Scholar] [CrossRef]
- Nanami, S.; Kawaguchi, H.; Tateno, R.; Li, C.; Katagiri, S. Sprouting traits and population structure of co-occurring Castanopsis species in an evergreen broad-leaved forest in southern China. Ecol. Res. 2004, 19, 341–348. [Google Scholar] [CrossRef]
- Szwagrzyk, J.; Szewczyk, J.; Bodziarczyk, J. Dynamics of seedling banks in beech forest: Results of a 10-year study on germination, growth and survival. For. Ecol. Manag. 2001, 141, 237–250. [Google Scholar] [CrossRef]
- Gupta, B.; Gupta, T.K. Analysis of tree diversity and factors affecting natural regeneration in fragmented dry deciduous forests of lateritic West Bengal. Trop. Ecol. 2019, 60, 405–414. [Google Scholar] [CrossRef]
- Baruch, Z. Ordination and classification of vegetation along an altitudinal gradient in the Venezuelan páramos. Vegetatio 1984, 55, 115–126. [Google Scholar]
- Vergarechea, M.; del Río, M.; Gordo, J.; Martín, R.; Cubero, D.; Calama, R. Spatio-temporal variation of natural regeneration in Pinus pinea and Pinus pinaster Mediterranean forests in Spain. Eur. J. Forest Res. 2019, 138, 313–326. [Google Scholar] [CrossRef]
- Cole, R.J.; Holl, K.D.; Keene, C.L.; Zahawi, R.A. Direct seeding of late-successional trees to restore tropical montane forest. For. Ecol. Manag. 2011, 261, 1590–1597. [Google Scholar] [CrossRef]
- Wiegand, T.; Gunatilleke, S.; Gunatilleke, N. Species associations in a heterogeneous Sri Lankan dipterocarp forest. Am. Nat. 2007, 170, E77–E95. [Google Scholar] [CrossRef]
- Guariguata, M.R.; Pinard, M.A. Ecological knowledge of regeneration from seed in neotropical forest trees: Implications for natural forest management. For. Ecol. Manag. 1998, 112, 87–99. [Google Scholar] [CrossRef]
- Luo, Z.R.; Yu, M.J.; Chen, D.L.; Wu, Y.G.; Ding, B.Y. Spatial associations of tree species in a subtropical evergreen broad-leaved forest. J. Plant. Ecol. 2012, 5, 346–355. [Google Scholar] [CrossRef]
- Marimon, B.S.; Felfili, J.M.; Lima, E.S.; Duarte, W.M.G.; Marimon-Ju’nior, B.H. Environmental determinants for natural regeneration of gallery forest at the Cerrado/Amazonia boundaries in Brazil. Acta Amazon. 2010, 40, 107–118. [Google Scholar] [CrossRef]
- Devaney, J.L.; Jansen, M.A.K.; Whelan, P.M. Spatial patterns of natural regeneration in stands of English yew (Taxus baccata L.); Negative neighbourhood effects. For. Ecol. Manag. 2014, 321, 52–60. [Google Scholar] [CrossRef]
- Guo, Y.X.; Hu, Y.N.; Li, G.; Wang, D.X.; Yang, J.J.; Yang, G.H. Spatial pattern and spatial Association of Betula albosinensis at different developmental stages at Taibai Mountain. Sci. Silv. Sin. 2014, 50, 9–14. (In Chinese) [Google Scholar]
- Wright, S.J.; Muller-landau, H.C.; Calderón, O.; Hernandéz, A. Annual and spatial variation in seedfall and seedling recruitment in a neotropical forest. Ecology 2005, 86, 848–860. [Google Scholar] [CrossRef]
- Han, Y.; Wang, Z. Spatial heterogeneity and forest regeneration. Chin. J. Appl. Ecol. 2002, 13, 615–619. [Google Scholar]
- D’Amato, A.W.; Orwig, D.A.; Foster, D.R. Understory vegetation in old-growth and second-growth Tsuga canadensis forests in western Massachusetts. For. Ecol. Manag. 2009, 257, 1043–1052. [Google Scholar] [CrossRef]
- Muller-Landau, H.C.; Wright, S.J.; Calderón, O.; Condit, R.; Hubbell, S.P. Interspecific variation in primary seed dispersal in a tropical forest. J. Ecol. 2008, 96, 653–667. [Google Scholar] [CrossRef]
- Christie, D.A.; Armesto, J.J. Regeneration microsites and tree species coexistence in temperate rain forests of Chiloé Island, Chile. J. Ecol. 2003, 91, 776–784. [Google Scholar] [CrossRef]
- Yao, J.; Zhang, X.; Zhang, C.; Zhao, X.; Gadow, K.V. Effects of density dependence in a temperate forest in northeastern China. Sci. Rep. 2016, 6, 32844. [Google Scholar] [CrossRef]
- Miao, N.; Liu, S.; Yu, H.; Shi, Z.; Moermond, T.; Liu, Y. Spatial analysis of remnant tree effects in a secondary Abies-Betula forest on the eastern edge of the Qinghai–Tibetan Plateau, China. For. Ecol. Manag. 2014, 313, 104–111. [Google Scholar] [CrossRef]
- Nathan, R. Long-Distance Dispersal of Plants. Science 2006, 313, 786–788. [Google Scholar] [CrossRef]
- Fang, J.; Wang, X.; Liu, Y.; Tang, Z.; White, P.S.; Sanders, N.J. Multi-scale patterns of forest structure and species composition in relation to climate in northeast China. Ecography 2012, 35, 1072–1082. [Google Scholar] [CrossRef]
- Xing, H.; Li, F.; Jia, W.; Zhuang, C. Spatial structure of natural mixed forests in Daxing’an Mountain. J. Northeast. For. Univ. 2014, 42, 6–10. [Google Scholar]
- Lei, N.; Liu, Y.; Sa, R.; Tie, N. Structure characteristics of Larix gmelinii natural forest in Daxing’an Mountains. J. Northeast. For. Univ. 2017, 45, 8–12. (In Chinese) [Google Scholar]
- Bao, Y.; Zhang, Q.L.; Wang, L.M. Comparative study on characteristics of stand structures in Larix gmelinii forests of different origin. J. Northeast. For. Univ. 2013, 41, 18–21. (In Chinese) [Google Scholar]
- Jia, W.; Xie, X.; Jiang, W.; Li, F. Spatial distribution pattern of seedlings and saplings of three forest types by natural regeneration in Daxin’an Mountains Xinlin Forestry Bureau, China. Chin. J. Appl. Ecol. 2017, 28, 2813–2822. (In Chinese) [Google Scholar]
- Gong, Z.T. Chinese Soil Taxonomy; Science Press: Beijing, China, 1999; p. 615. (In Chinese) [Google Scholar]
- Wiegand, T.; Moloney, K.A. Rings, circles, and null-models for point pattern analysis in ecology. Oikos. 2004, 104, 209–229. [Google Scholar] [CrossRef]
- Wiegand, T.; Kissling, W.D.; Cipriotti, P.A.; Aguiar, M.R. Extending point pattern analysis for objects of finite size and irregular shape. J. Ecol. 2006, 94, 825–837. [Google Scholar] [CrossRef]
- Condit, R.; Ashton, P.S.; Baker, P.; Bunyavejchewin, S.; Gunatilleke, S.; Gunatilleke, N.; Hubbell, S.P.; Foster, R.B.; Itoh, A.; LaFrankie, J.V.; et al. Spatial patterns in the distribution of tropical tree species. Science 2000, 288, 1414–1418. [Google Scholar] [CrossRef]
- Erfanifard, Y.; Stereńczak, K. Intra- and interspecific interactions of Scots pine and European beech in mixed secondary forests. Acta Oecol. 2017, 78, 15–25. [Google Scholar] [CrossRef]
- Stoyan, D.; Penttinen, A. Recent applications of point process methods in forestry statistics. Stat. Sci. 2000, 15, 61–78. [Google Scholar]
- Law, R.; Illian, J.; Burslem, D.F.R.P.; Gratzer, G.; Gunatilleke, C.V.S.; Gunatilleke, I.A.U.N. Ecological information from spatial patterns of plants: Insights from point process theory. J. Ecol. 2009, 97, 616–628. [Google Scholar] [CrossRef]
- Wang, X.; Wiegand, T.; Hao, Z.; Li, B.; Ye, J.; Lin, F. Species associations in an old-growth temperate forest in north-eastern China. J. Ecol. 2010, 98, 674–686. [Google Scholar] [CrossRef]
- Wiegand, T.; Moloney, K.A. Handbook of Spatial Point-Pattern Analysis in Ecology; CRC Press: New York, NY, USA, 2014. [Google Scholar]
- Perry, G.L.W.; Miller, B.P.; Enright, N.J. A comparison of methods for the statistical analysis of spatial point patterns in plant ecology. Plant. Ecol. 2006, 187, 59–82. [Google Scholar] [CrossRef]
- Schiffers, K.; Schurr, F.M.; Tielbörger, K.; Urbach, C.; Moloney, K.; Jeltsch, F. Dealing with virtual aggregation–a new index for analysing heterogeneous point patterns. Ecography 2008, 31, 545–555. [Google Scholar] [CrossRef]
- Gavrikov, V.; Stoyan, D. The use of marked point processes in ecological and environmental forest studies. Environ. Ecol. Stat. 1995, 2, 331–344. [Google Scholar] [CrossRef]
- Clark, J.S.; Silman, M.; Kern, R.; Macklin, E.; Hillerislambers, J. Seed dispersal near and far: Patterns across temperate and tropical forests. Ecology 1999, 80, 1475–1494. [Google Scholar] [CrossRef]
- Cain, M.L.; Milligan, B.G.; Strand, A.E. Long-distance seed dispersal in plant populations. Am. J. Bot. 2000, 87, 1217–1227. [Google Scholar] [CrossRef]
- Das, A.; Battles, J.; Stephenson, N.L.; Van Mantgem, P.J. The contribution of competition to tree mortality in old-growth coniferous forests. For. Ecol. Manag. 2011, 261, 1203–1213. [Google Scholar] [CrossRef]
- Wiegand, T.; Gunatilleke, C.V.S.; Gunatilleke, I.A.U.N.; Huth, A. How individual species structure diversity in tropical forests. Proc. Natl. Acad. Sci. USA 2007, 104, 19029–19033. [Google Scholar] [CrossRef]
- Wiegand, T.; Gunatilleke, S.; Gunatilleke, N.; Okuda, T. Analyzing the spatial structure of a Sri Lankan tree species with multiple scales of clustering. Ecology. 2007, 88, 3088–3102. [Google Scholar] [CrossRef]
- Janzen, D.H. Herbivores and the number of tree species in tropical forests. Am. Nat. 1970, 104, 501–528. [Google Scholar] [CrossRef]
- Connell, J.H. On the role of natural enemies in preventing competitive exclusion in some marine animals and in rain forest trees. In Dynamics of Populations; Center for Agricultural Publishing and Documentation: Wageningen, The Netherlands, 1971. [Google Scholar]
- Law, R.; Purves, D.W.; Murrell, D.J.; Dieckmann, U. Causes and effects of small-scale spatial structure in plant populations. In Integrating Ecology and Evolution in a Spatial Context; Silvertown, J., Antonovics, J., Eds.; Blackwell Science: Oxford, UK, 2001; pp. 21–44. [Google Scholar]
- Liu, Z.; Li, Z. Perspectives on small-scale spatial structure of plant species in plant communities. Acta Phytoecol. Sin. 2005, 29, 1020–1028. (In Chinese) [Google Scholar]
- Laungani, R.; Knops, J.M.H. Species-driven changes in nitrogen cycling can provide a mechanism for plant invasions. Proc. Natl. Acad. Sci. USA 2009, 106, 12400–12405. [Google Scholar] [CrossRef] [PubMed]
- Fibich, P.; Leps, J.; Novotny, V.; Klimes, P.; Tesitel, J.; Molem, K.; Damas, K.; Weiblen, G.D. Spatial patterns of tree species distribution in New Guinea primary and secondary lowland rain forest. J. Veg. Sci. 2016, 27, 328–339. [Google Scholar] [CrossRef]
- Deng, X.; Liu, Y.; Wu, Y. Interconnection among dominant plant populations of Castanopsis community in Jinggang Mountain Nature Reserve. Acta Phytoecol. Sin. 2003, 27, 531–536. (In Chinese) [Google Scholar]
- Read, Q.D.; Henning, J.A.; Sanders, N.J. Intraspecific variation in traits reduces ability of trait-based models to predict community structure. J. Veg. Sci. 2017, 28, 1070–1081. [Google Scholar] [CrossRef]
- García-Cervigón, A.I.; Gazol, A.; Sanz, V.; Camarero, J.J.; Olano, J.M. Intraspecific competition replaces interspecific facilitation as abiotic stress decreases: The shifting nature of plant–plant interactions. Perspect. Plant. Ecol. Evol. Syst. 2013, 15, 226–236. [Google Scholar] [CrossRef]
- Funk, J.L.; Larson, J.E.; Ames, G.M.; Butterfield, B.J.; Cavender-Bares, J.; Firn, J.; Laughlin, D.C.; Sutton-Grier, A.E.; Williams, L.; Wright, J. Revisiting the Holy Grail: Using plant functional traits to understand ecological processes. Biol. Rev. 2017, 92, 1156–1173. [Google Scholar] [CrossRef]
- Hendriks, M.; Ravenek, J.M.; Smit-Tiekstra, A.E.; Van Der Paauw, J.W.; De Caluwe, H.; Van Der Putten, W.H.; De Kroon, H.; Mommer, L.; Smit-Tiekstra, A.E. Spatial heterogeneity of plant-soil feedback affects root interactions and interspecific competition. New Phytol. 2015, 207, 830–840. [Google Scholar] [CrossRef]
- Zhang, M.; Wang, D.; Kang, B.; Zhang, G.; Liu, P.; Du, Y.; Yu, F. Interspecific associations of dominant plant populations in secondary forest of Pinus armandii in Qinling Mountains. Sci. Silv. Sin. 2015, 51, 12–21. (In Chinese) [Google Scholar]
- Haugaasen, T.; Peres, C.A. Interspecific primate associations in Amazonian flooded and unflooded forests. Primates 2009, 50, 239–251. [Google Scholar] [CrossRef]
- Roxburgh, S.H.; Chesson, P. A new method for detecting species associations with spatially autocorrelated data. Ecology 1998, 79, 2180–2192. [Google Scholar] [CrossRef]
- Virágh, K.; Bartha, S. Interspecific associations in different successional stages of Brachypodium pinnatum grassland after deforestation in Hungary. Tiscia 1998, 31, 3–12. [Google Scholar]
- Hou, J.H.; Mi, X.C.; Liu, C.R.; Ma, K.P. Spatial patterns and associations in a Quercus-Betula forest in northern China. J. Veg. Sci. 2004, 15, 407–414. [Google Scholar]
- Leathwick, J.R.; Mitchell, N.D. Forest pattern, climate and vulcanism in central North Island, New Zealand. J. Veg. Sci. 1992, 3, 603–616. [Google Scholar] [CrossRef]
- Barot, S.; Gignoux, J.; Menaut, J.-C. Demography of a savanna palm tree: Predictions from comprehensive spatial pattern analysis. Ecology 1999, 80, 1987–2005. [Google Scholar] [CrossRef]
- Getzin, S.; Dean, C.; He, F.; Trofymow, J.A.; Wiegand, K.; Wiegand, T. Spatial patterns and competition of tree species in a Douglas-fir chronosequence on Vancouver Island. Ecography 2006, 29, 671–682. [Google Scholar] [CrossRef]


© 2020 by the authors. Licensee MDPI, Basel, Switzerland. This article is an open access article distributed under the terms and conditions of the Creative Commons Attribution (CC BY) license (http://creativecommons.org/licenses/by/4.0/).