Article

DBH Distributions in America’s Urban Forests—An Overview of Structural Diversity

1
New Zealand School of Forestry, University of Canterbury, Christchurch 8041, New Zealand
2
USDA Forest Service, Northern Research Station, Syracuse, NY 13210, USA
3
Department of Environmental Horticulture, CLCE, IFAS, University of Florida-Gulf Coast Research and Education Center, Wimauma, FL 33598, USA
*
Author to whom correspondence should be addressed.
Forests 2020, 11(2), 135; https://doi.org/10.3390/f11020135
Submission received: 28 November 2019 / Revised: 16 January 2020 / Accepted: 21 January 2020 / Published: 23 January 2020
(This article belongs to the Section Forest Ecology and Management)

Abstract

:
Background and Objectives: The structural diversity of an urban forest affects ecosystem service provision, and can inform management, planning, as well as policy. Trunk diameter at breast height (DBH) is amongst the most common measures of tree structure due to its ease of measurement and strong relationships with other structural and non-structural urban forest characteristics. Materials and Methods: In this study, the DBH distributions of urban forests are summarised for 38 American cities with a combined population of over 30 million people and a range of geographic, climatic, and demographic conditions. The Anderson–Darling (AD) test was used to test the hypothesis that all DBH distributions came from a common population. Moreover, structural diversity was compared using the Shannon–Wiener index. Results: The AD test results failed to identify any statistically significant differences in DBH distributions. However, qualitatively, the DBH distributions have two primary forms, which have important functional, management, and planning implications. The vast majority of cities have an exponentially inverse-proportional distribution, such that the proportion of trees in each successively larger DBH class decreases exponentially. The Shannon–Wiener index indicates an uneven DBH distribution in the cities with an exponentially inverse-proportional diameter distribution; these cities are dominated by trees in the smallest diameter class. Potential explanations for a large proportion of trees in the smallest diameter classes include a large number of small, naturally regenerating trees; a preference for smaller trees in urban areas; or a recent increase in tree planting efforts. Conclusions: Despite no statistical differences in DBH distributions for the 38 study cities, the functional, management, and planning implications will differ considerably.

Graphical Abstract

1. Introduction

Urban forest managers and policymakers can benefit from urban forest monitoring, including descriptions of structural diversity [1]. Structural diversity can be assessed by looking at the diameter distribution of a population of trees [2]. An urban forest’s diameter distribution can inform policy (e.g., tree removal bylaws), planning (e.g., budget, staffing), or management (e.g., planting, maintenance) needs and help project how they will change in the future [3], given population stability. Structural diversity also has functional repercussions. Large trees are greater functional contributors than small trees with respect to ecosystem services [3,4,5], so cities dominated by small trees may be missing out on valuable ecosystem services. As such, diameter distributions can be used to characterise various differing levels of ecosystem service provision.
Despite its importance, urban forest structural diversity has not been widely studied. While past studies have reported diameter distributions, these efforts have often been limited to a single city e.g., [6,7,8], state e.g., [9,10], or subset of the tree population (e.g., park trees) [11]. One of the more extensive investigations of structural diversity was a study of street trees in 22 Californian (United States) cities [9]. In that work, three prominent stem diameter distribution types were identified (Figure 1). A Type I, or youthful, distribution is characterised by a high proportion of young, small trees; its form has widely been described as a ‘reverse J’ distribution and is common for a variety of forest types including natural forests and uneven-aged plantation forests [12,13]. This is not to say that all natural or uneven-aged plantation forests have a reverse J distribution; in fact, depending on the scale of observation (e.g., plot, stand, forest) and silvicultural system (e.g., selection, selective, shelterwood), forests can contain numerous differing diameter distributions. Nevertheless, Type I distributions can be described by an inversely proportional exponential function, such that an exponential decrease in the proportion of trees occurs with each increase in tree diameter class.
In contrast, Type II, or maturing, distributions are characterised by trees growing into larger diameter classes as they mature. Thus, the largest proportion of trees in the population is no longer in the smallest diameter class. In the maturing distribution, there are relatively few trees in the largest diameter classes with the proportion of trees in each subsequently larger diameter at breast height (DBH) class decreasing linearly. The maturing distribution can be described as having a roughly inversely proportional linear form.
A Type III, or mature, distribution has a relatively even number of trees in all DBH classes. An important caveat is that while the age/diameter relationship generally holds within a species, the same cannot be said across species. Some small-statured species can reach maturity, but remain small in stature, relative to youthful or maturing large-statured species. While McPherson and Rowntree’s work is rather extensive with regard to the number of cities investigated, its use of street tree inventory data precludes knowledge of the diameter class distribution for all trees in the urban forest. Park trees, and notably trees on private land, are excluded.
While McPherson and Rowntree’s work [9] offered a snapshot of the diameter distributions of multiple cities, Koeser et al. [6], surveyed a smaller population of street trees (n = 895) in Milwaukee, Wisconsin (United States) multiple times over a quarter-century. By measuring the same trees in 1979, 1989, and 2005, the authors captured a shift in the diameter distribution from a Type I to a Type II to a Type III distribution. The temporal dynamics of this study were important in explaining the natural progression of diameter distribution from youthful, to maturing, to mature.
A comprehensive, sample-based study of 198 randomly distributed 0.04 ha plots across Syracuse, New York showed a shift from a Type II to a Type I distribution between 1999 and 2009 [14]. That study highlighted that diameter distributions do not have to progress from youthful through to mature. In this case, Syracuse lost a number of large trees in a major storm and subsequent natural regeneration resulted in a large proportion of small trees. Though this study assessed the diameters of all tree types (e.g., street trees, park trees, private trees), it is geographically limited.
Previous efforts have also been made to describe an ideal structural distribution for urban forests. Richards’ ideal diameter distribution for Syracuse, NY is frequently cited and suggests 40% of trees below 20 cm DBH, 30% between 20 and 40 cm, 20% between 40 and 60 cm, and 10% larger than 60 cm DBH [15]. The linear decrease in the proportion of trees in each subsequently larger diameter class is reminiscent of a Type II distribution in McPherson and Rowntree’s study [9]. Millward and Sabir [11] suggest an alternative ideal distribution with 40% of trees below 15 cm DBH, 30% between 15 and 60 cm, 25% between 60 and 90 cm, and 5% larger than 90 cm DBH. The extent to which these ideal distributions are correct or more widely applicable is debatable. Furthermore, an objective must be defined, before an ideal distribution can be decided upon. For example, the ideal distribution to optimise wildlife habitat likely differs from the ideal distribution to optimise carbon sequestration and storage.
Together, previous studies provided valuable insights into structural diversity for the specific regions and tree types (e.g., street trees) they assessed; these studies have great value to practical management. However, they fail to provide a comprehensive assessment of the diameter distribution of all trees in urban forests for a diverse group of cities, thus precluding comparisons. In the absence of such data, we have an unclear understanding of the diameter distributions that exist in a wide range of urban forest conditions. Therefore, we risk an incomplete understanding of the policy, planning, and management implications of different diameter distributions, as well as how ecosystem services may be affected.
This study aims to address these gaps by exploring structural diversity in urban forests with a range of geographic, climatic, and demographic conditions in the United States of America (United States). Diameter distributions are summarised, compared, and discussed in the context of previously suggested ideal tree size distributions for urban forests. Planning, management, and functional implications of differing distributions are also discussed.

2. Materials and Methods
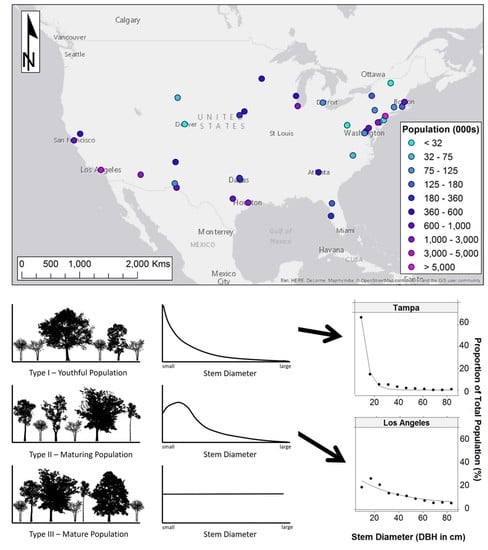
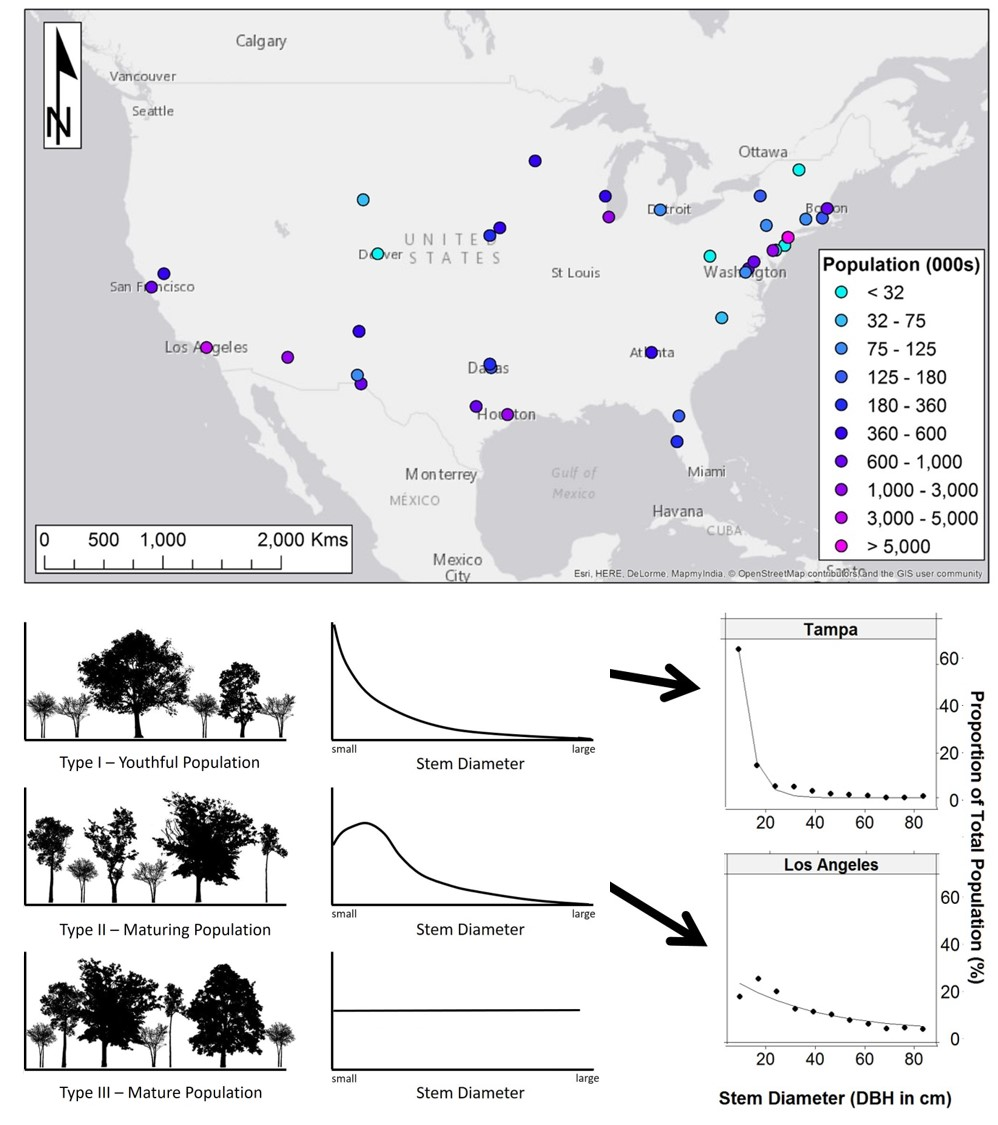
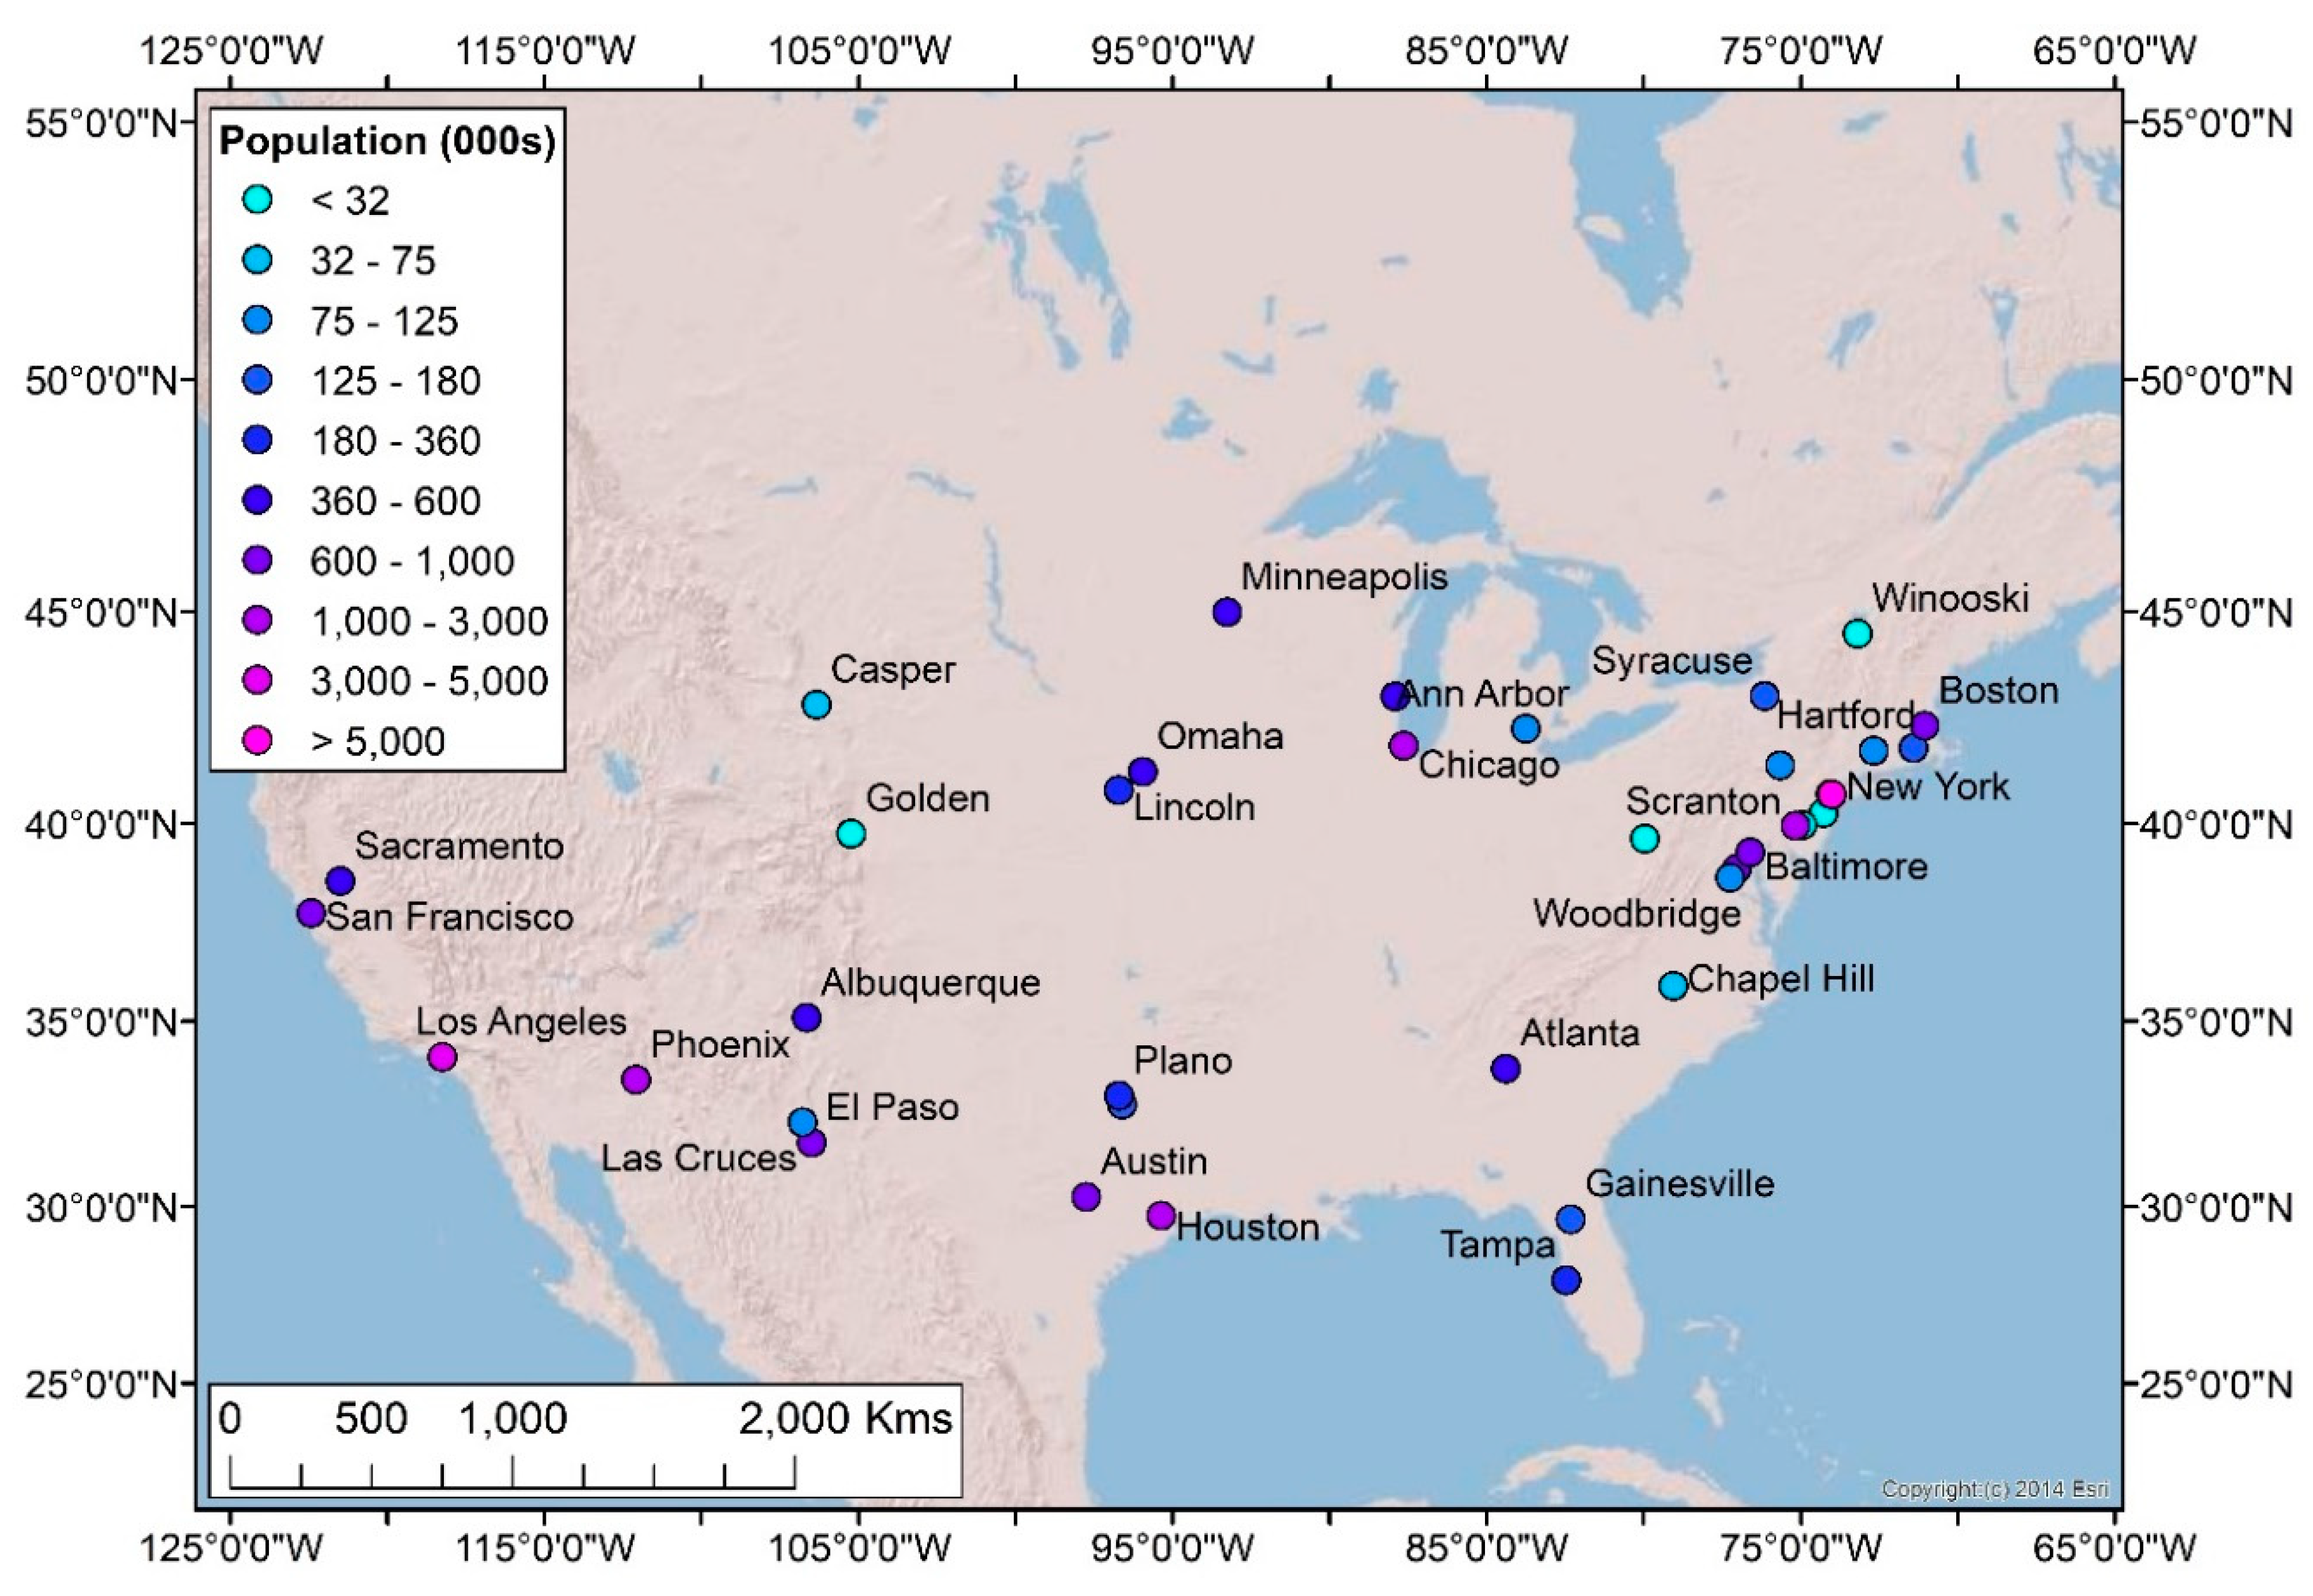
2.1. Study Sites

This study summarised forest inventory data from 38 cities spanning a range of geographic, climatic, and demographic conditions (Figure 2, Table 1). The study sites are represented by a range of climatic conditions from boreal to warm temperate to arid [16,17]. Nearly all regions in the United States are included in the study, except the Pacific Northwest. Despite this, the climatic conditions found in the Pacific Northwest are represented by other cities who share a common Köppen-Geiger Climate Classification or USDA Plant Hardiness Zone (Table 1). The study sites were located in USDA plant hardiness zones 4a–10b (excluding only 4b and 9a), which correspond to average annual minimum temperatures of −34.44–1.67 °C. From a population perspective, large and small cities were included, ranging from 8,491,079 people in New York, NY to 7228 people in Winooski, VT [18]. Cities were not selected at random, nor were data collected expressly for this study. Instead, we selected cities that had chosen to undertake, and complete, an i-Tree Eco inventory of their urban forests. We acquired data, collected by these cities after they had provided it to the United States Forest Service.

2.2. Data

Urban forest inventories were acquired from the United States Forest Service for the 38 cities described above. The i-Tree data collection, used as a basis for this study, occurred in different years in different cities (Table 1). The diameter distributions reported in the results section are only correct as of the date shown in Table 1, as tree population and size are dynamic. Plot establishment and data collection are briefly described below. Inventory data were standardised; all plot sampling and data collection used the i-Tree Eco protocols [19]. This approach avoided potential inconsistencies resulting from data with varied provenance [20].
Circular plots (0.1 acre, 0.04 hectare) were randomly distributed within cities, stratified by land use. Plots comprised trees on public land (including street, parks, and woodlands) and private land (including, but not limited to residential, commercial, industrial land uses). Where plot centres were inaccessible (i.e., on a highway, in a building), the i-Tree Eco protocol specifies methods for replacing those plots with an additional randomly located plot within the same land use. The number of plots within each city is variable and dependent upon the area of the city and its land uses. Trees within plots were described in detail, but for the purposes of this study, only diameter at breast height (DBH) measurements were used; DBH is commonly used to describe and compare tree structure and is strongly associated with numerous ecosystem services. DBH was measured at 1.37 m (4.5 ft) above the ground; further details on DBH measurement can be found in the i-Tree Eco Field Manual [19]. DBH data were aggregated into diameter classes, each spanning 7.6 cm (3 inches). In the 38 cities, data were collected by combinations of professional foresters, researchers, and volunteers. There is potential for inaccuracy in DBH measurements, particularly when made by volunteers [21], but a quality assurance plan, including training, and hot and cold checks, is part of the i-Tree Eco data collection protocol [19]. The extent to which individual cities followed all protocols within the i-Tree Eco Field Manual is unknown and is a study limitation.

2.3. Analysis—Diameter Distributions and Shannon–Wiener Diversity Index

To gain an understanding of the variation of diameter distributions amongst the studied urban forests, data were used to plot diameter distributions for each city in R [22]. For the purposes of visualisation, a non-linear least squares exponential function was fitted to each distribution, using the nls function in R package stats [22]:
y = e a + b x ,
where y is the proportion of trees in a given DBH class x, e is Euler’s number, and a and b are coefficients.
We used the Anderson–Darling (AD) k-Sample test (alpha = 0.05) adKSampleTest in R package PMCMRPlus [23] to test the null hypothesis that all data distributions came from a common population. The AD test is more powerful than the Kolmogorov–Smirnov test, which is often used to test for differences amongst distributions [24]. Between-city pairwise comparisons were undertaken using adAllPairsTest function from package PMCMRPlus, using Bonferroni correction to adjust p values for multiplicity. This approach allowed us to compare the different DBH distributions quantitatively to determine whether they differed significantly from one another, from a statistical perspective.
To gain further insight into the relative diversity amongst different American cities, the Shannon–Wiener index was computed. The index has previously been used primarily for quantifying species diversity e.g., [25], but also in many instances to quantify structural diversity e.g., [2,26].
The Shannon–Wiener index (H) is a widely used measure of diversity [27]. Here, we used the Vegan package in R [28] to calculate a structural diversity index from the proportional abundance of trees in different diameter (DBH) classes:
H =   i = 1 n p i ln ( p i ) ,
where pi is the proportion of trees in the ith diameter class and n is the number of diameter classes (n = 11 for all cities). H increases with structural diversity and when the proportion of trees is equal in all classes, H reaches its maximum value, H m a x =   ln ( n ) .

3. Results

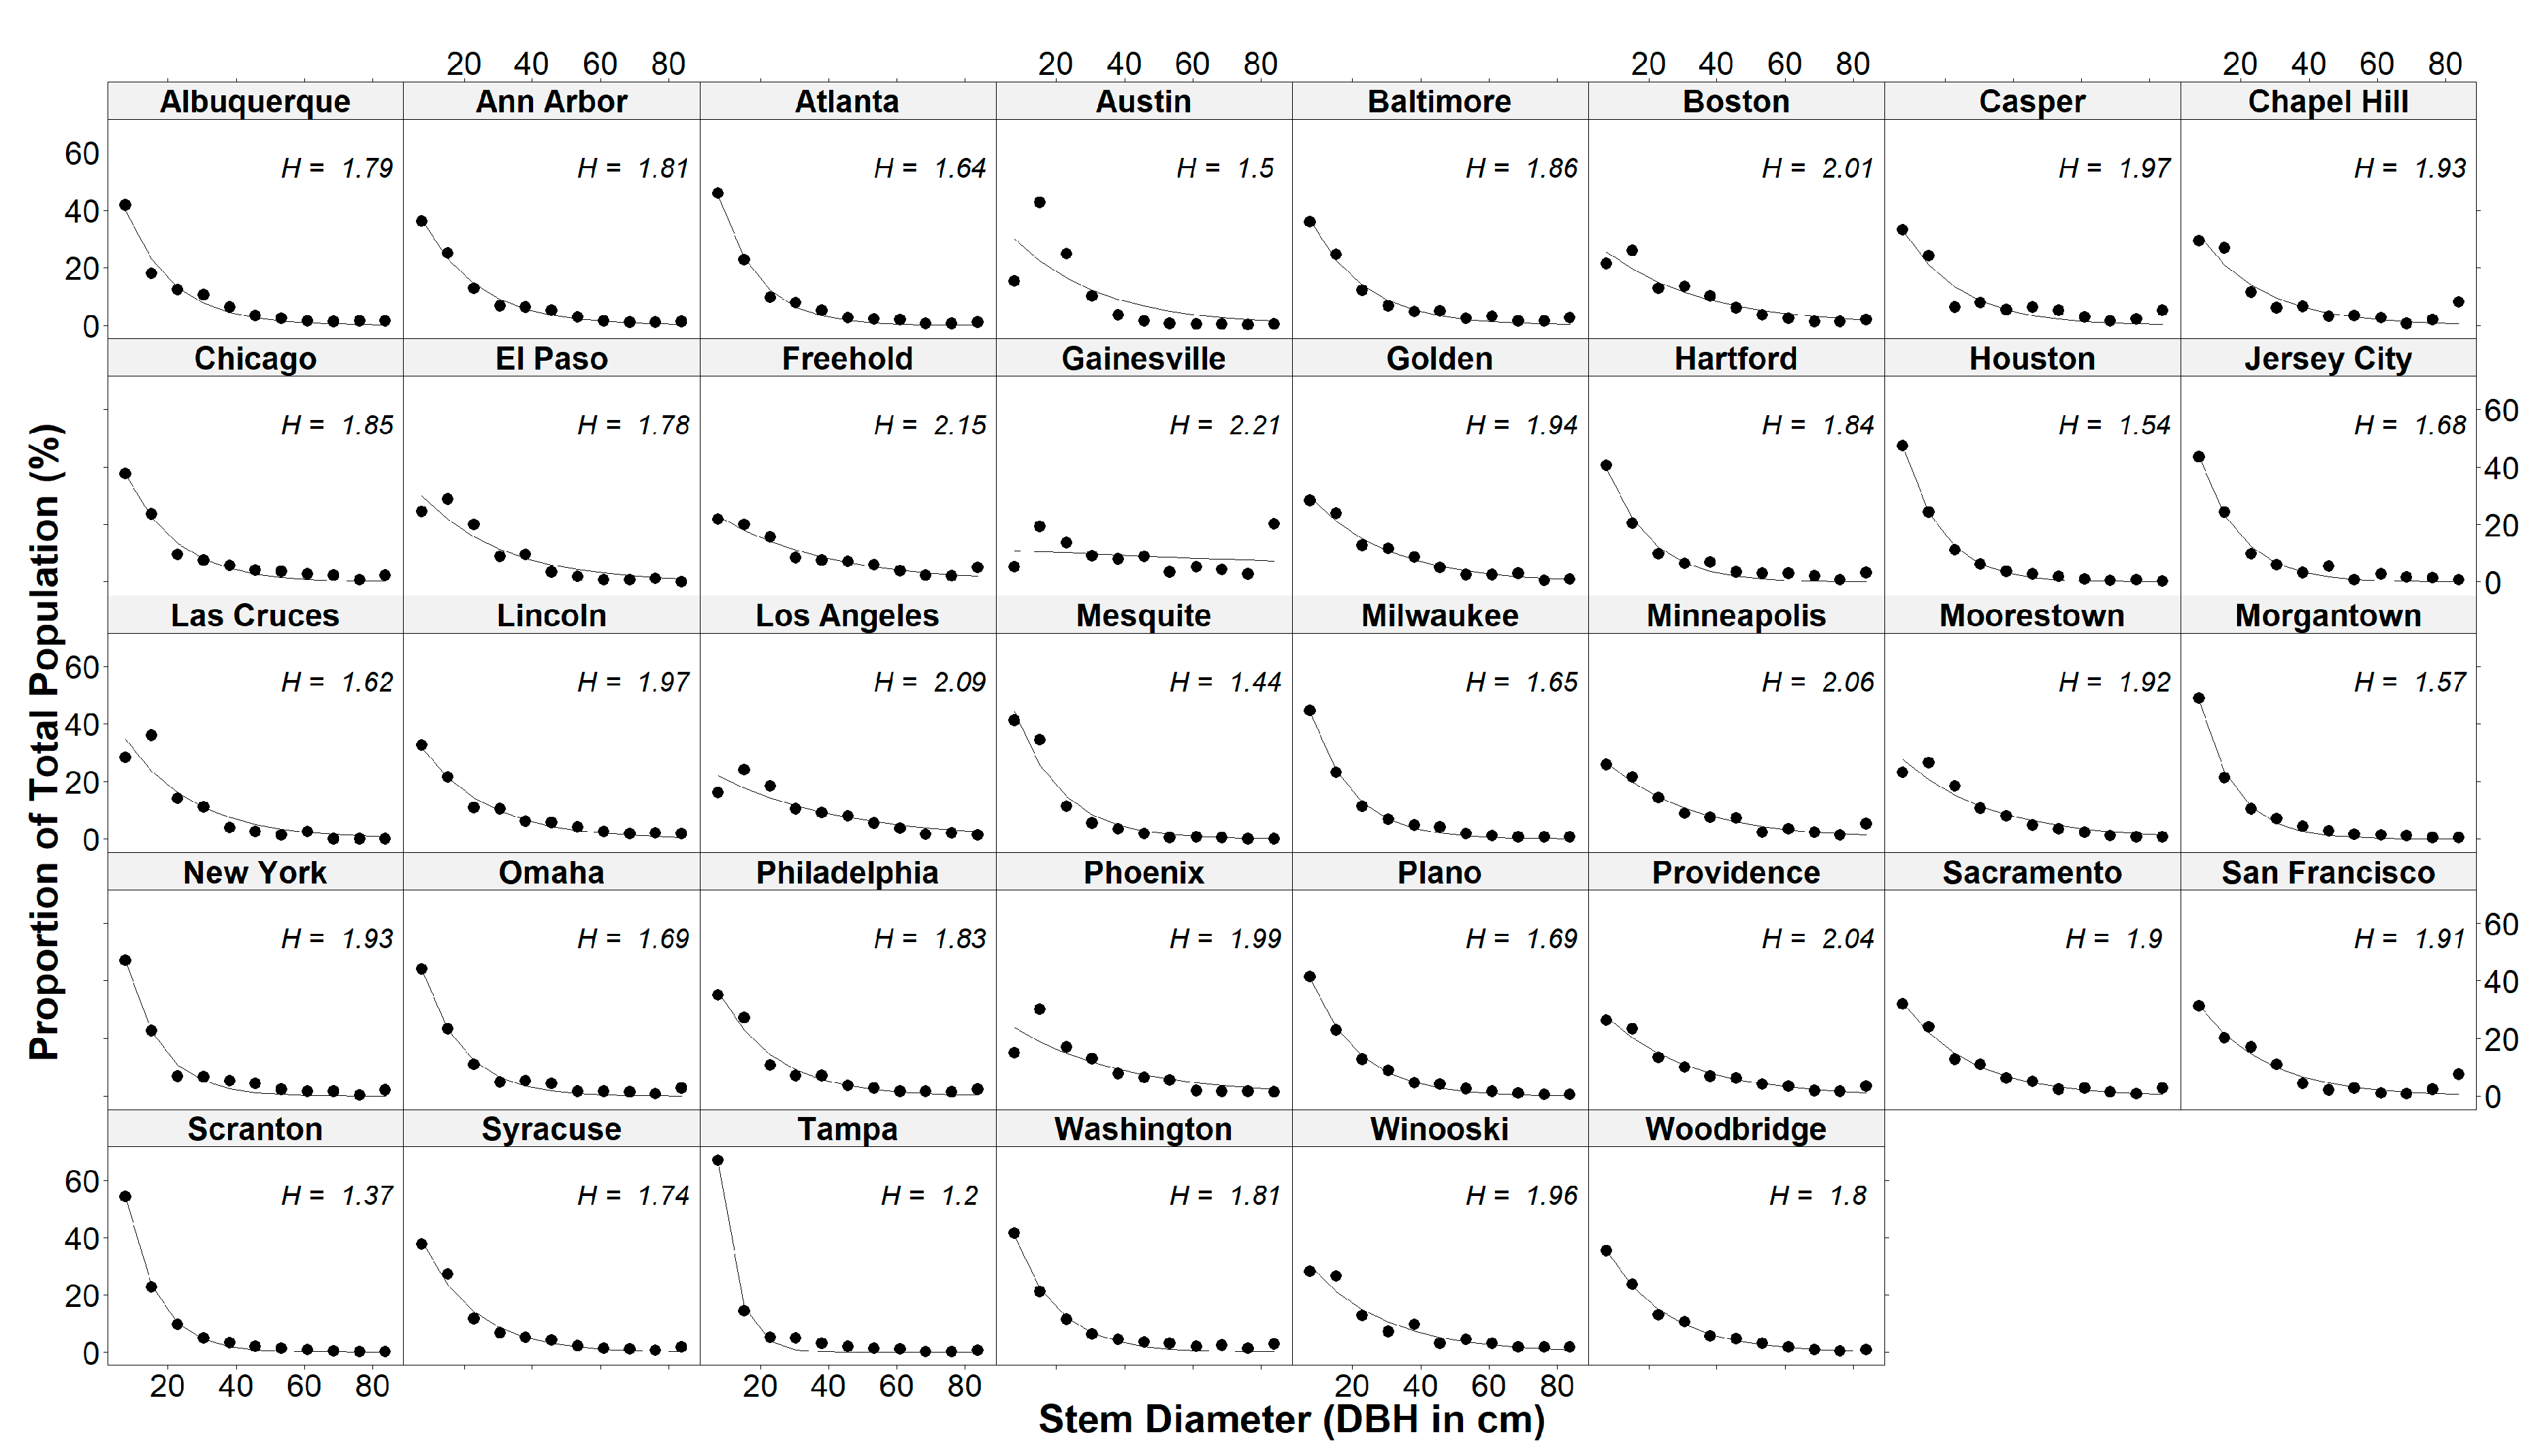
3.1. Urban Forest Diameter Class Distributions

The distributions of measured DBH values for trees across the 38 cities for which inventories were conducted are presented in Figure 3. From a quantitative perspective, the null hypothesis, i.e., the diameter distributions of all 38 cities come from the same population, was not rejected by the Anderson–Darling k-Sample test (p = 0.959). The Anderson–Darling test with Bonferroni correction confirmed no differences in the DBH distributions amongst pairs of cities. This is not surprising considering that 703 pairwise comparisons were undertaken; the power of all-pairs comparison tests decrease rapidly with high numbers of pairwise tests [23].
Despite the lack of statistical difference in DBH distributions, qualitatively, the DBH distribution for trees in most cities is generally characterised by a decrease in the proportion of trees in each DBH class as the diameter class size increases. In some cities, there is an exponential reduction in the proportion of trees in each subsequently larger diameter class. This reduction is most obvious in cities with a large proportion of trees in the smallest diameter class (≤7.6 cm), including Tampa, FL (66.9%), Scranton, PA (54.2%), Morgantown, WV (48.8%), Houston, TX (47.4%), New York, NY (47.1%), and Atlanta, GA (45.8%). Other cities have a linear decrease in the proportion of trees in each subsequently larger diameter class (e.g., Chicago, IL and Baltimore, MD). Gainesville, FL has an unusual diameter distribution, whereby the largest DBH class (>76 cm) has the largest proportion of trees (20.3%). The only other cities with more than 5% of trees in the largest DBH class were Casper, WY (5.2%), Minneapolis, MN (5.3%), San Francisco, CA (7.5%), and Chapel Hill, NC (8.1%). Despite no statistically significant difference in the DBH distributions, this qualitative description suggests two primary forms for diameter distributions: (1) ‘reverse J’ or exponentially inverse-proportional; and (2) linearly inverse-proportional.

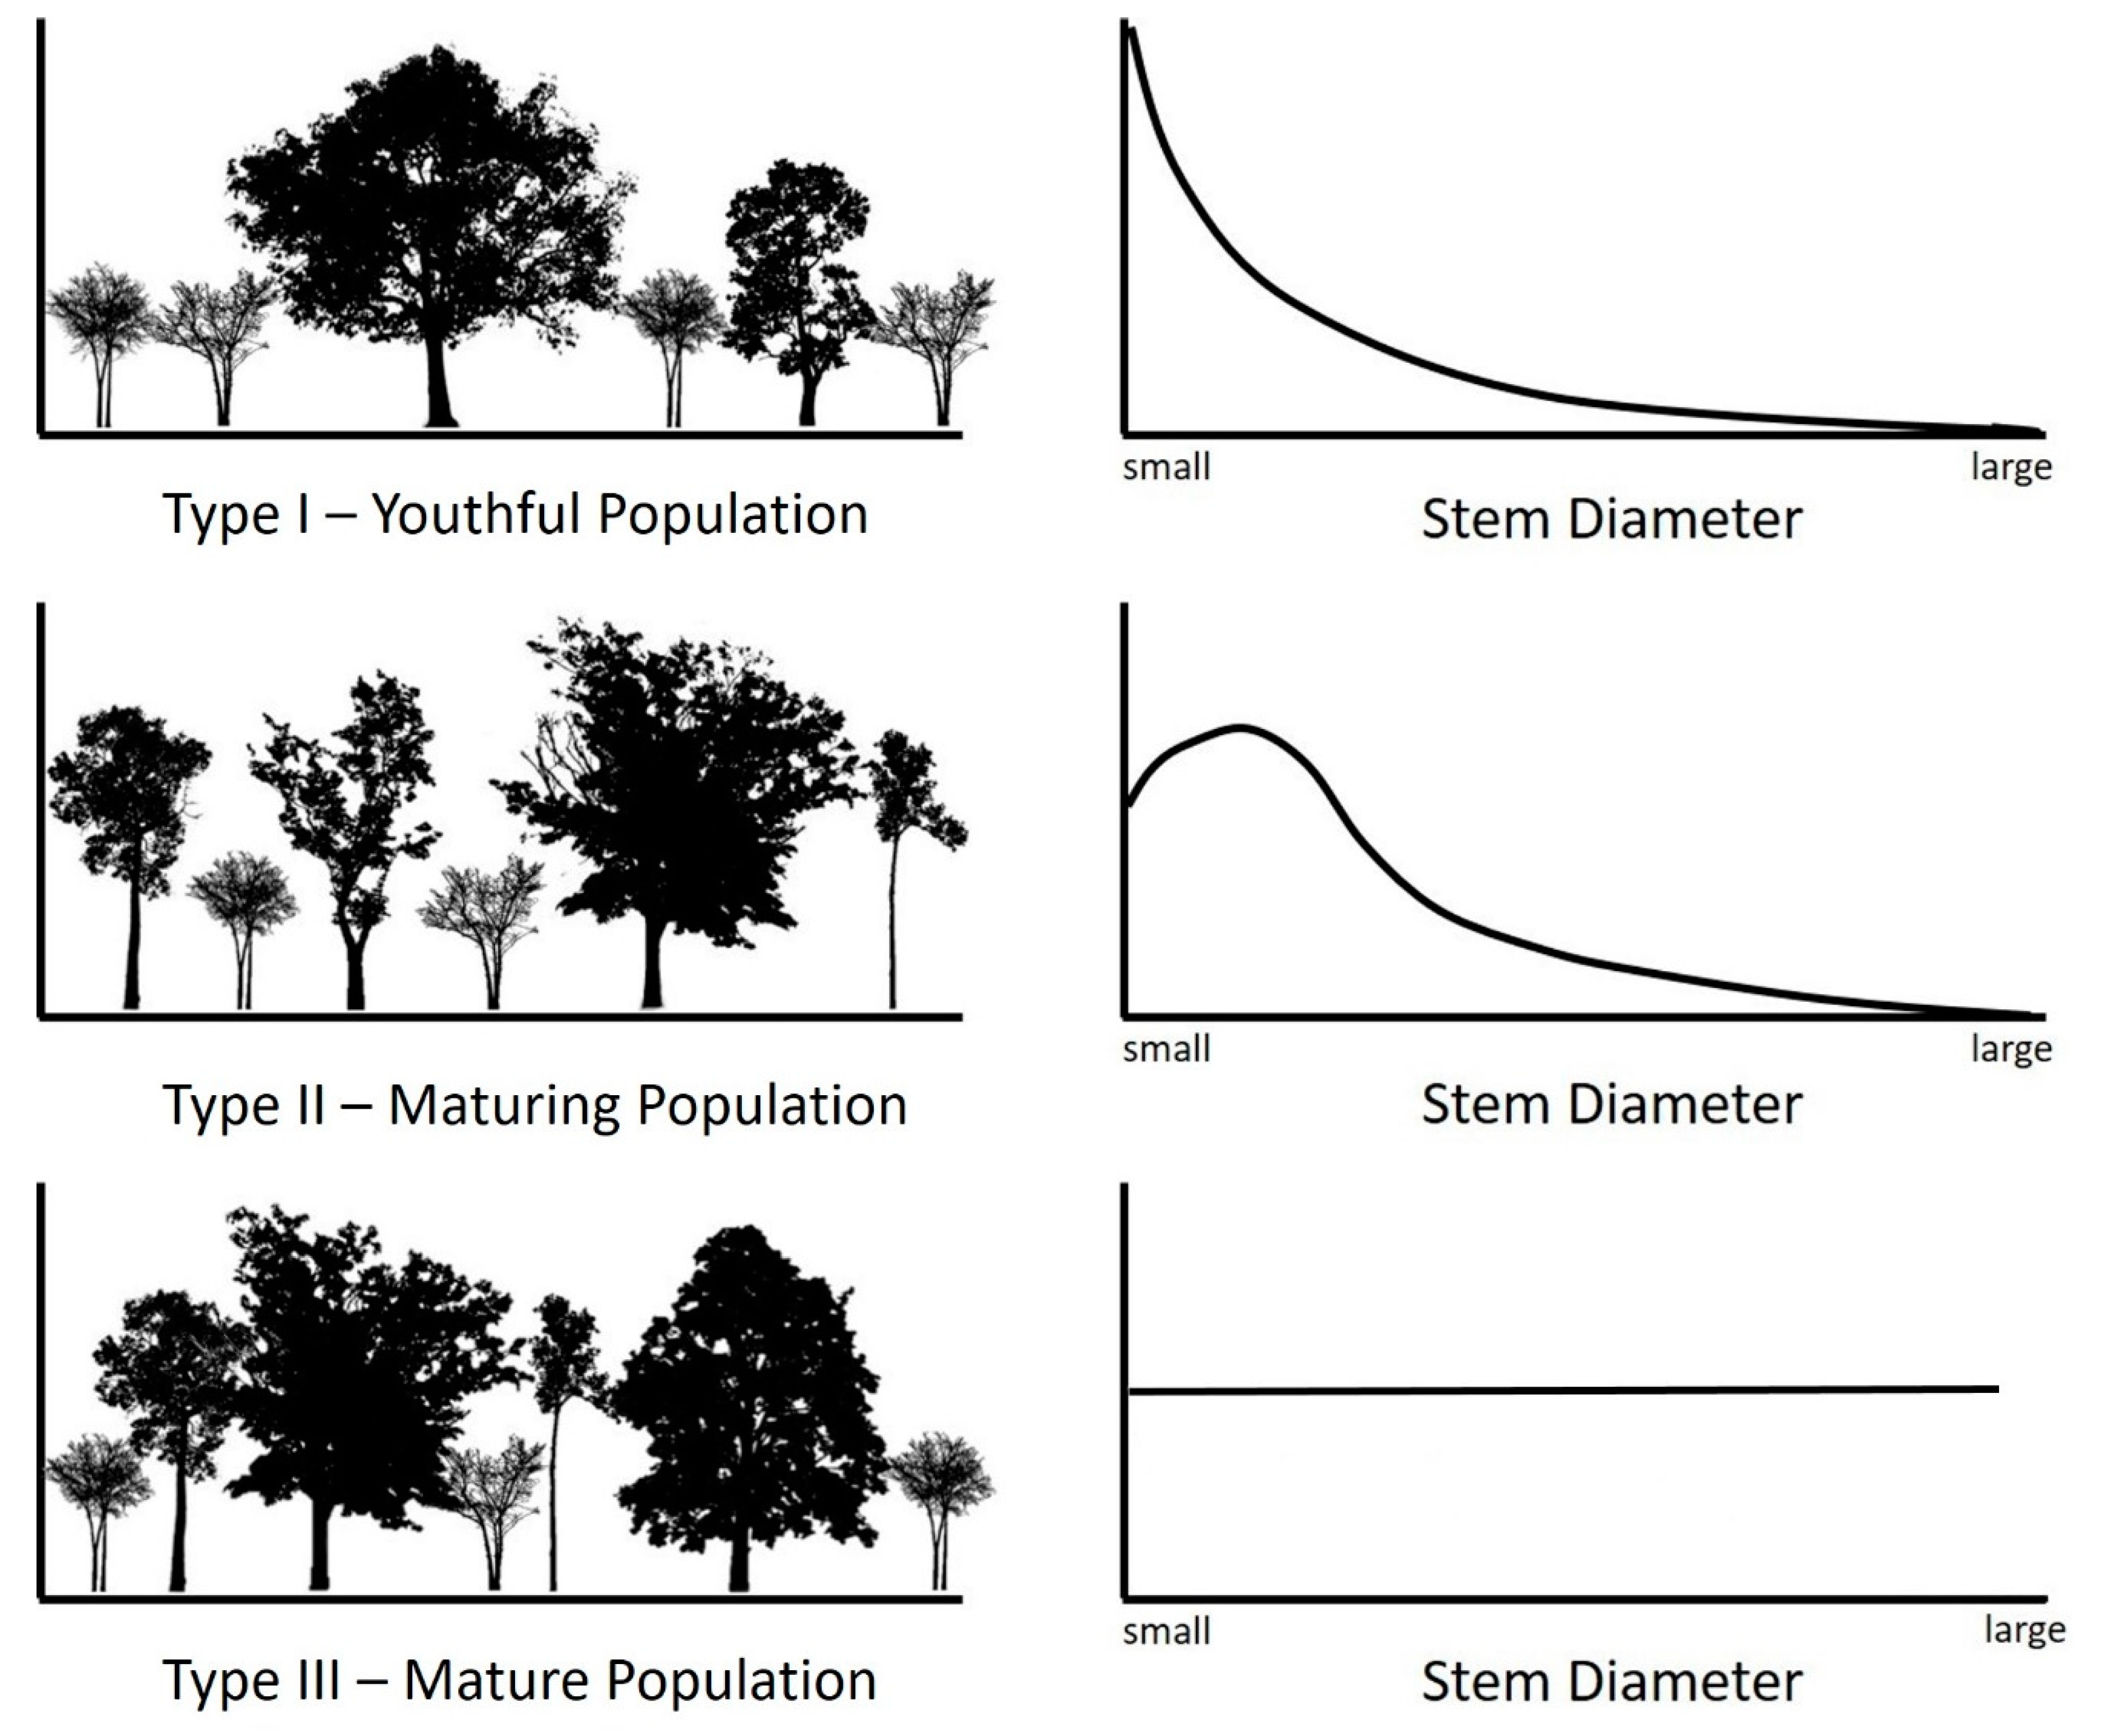
3.2. A Comparison of Diameter Class Distributions Against Ideal Distributions

The aggregated diameter distributions for all 38 cities included in this study are presented in Figure 4. The line of best fit for these diameter distributions has an exponentially inverse-proportional form. The acute reduction in the proportion of trees in each subsequently larger diameter class is contrasted against the diameter class distributions that were proposed as ideal in previous literature [11,15].

3.3. Structural Diversity Index

The Shannon–Wiener diversity index (Equation (2)) was used to quantify and compare structural diversity across cities. The Shannon–Weiner index values ranged from 1.2 (Tampa, FL) to 2.21 (Gainesville, FL) with greater values representing a more even DBH distribution. In contrast, lesser values indicated a relatively uneven distribution, whereby one or more DBH classes had appreciably higher or lower proportions of trees than other DBH classes.

4. Discussion

4.1. Diameter Class Distributions in Context

While there have been previous studies on urban tree structural diversity, most have been geographically limited [3,14] or were undertaken for constrained urban forest samples (e.g., park trees only) [11]. In contrast, the summary of diameter distributions observed in this study helps us to gain insights into all urban tree types (e.g., street trees, park trees, private trees) in a sample of 38 American cities with a combined population of over 30 million people and a range of geographic, climatic, and demographic conditions.
Despite being confined to street trees, the study by McPherson and Rowntree [9] is an important benchmark for the present results. McPherson and Rowntree [9] classified the street tree diameter distributions of 22 Californian cities as Type I (youthful), Type II (maturing), or Type III (mature) [9], which bear a resemblance to the diameter distribution forms identified in the present study (i.e., exponentially inverse-proportional, linearly inverse-proportional).
The exponentially inverse-proportional distribution here is consistent with a youthful distribution, which describes populations where >40% of trees are in the smallest DBH class (<15 cm). In the California study, only eight of the 22 (36.4%) populations exhibited this characteristic [9]; in contrast, 36 of the 38 (94.7%) cities in this study had more than 40% of their trees in the 0–15 cm DBH class, the exceptions being Gainesville, FL and Los Angeles, CA.
The linearly inverse-proportional distribution in the present study is consistent with a maturing distribution; this is a population with a greater proportion of trees in the 16–45 cm DBH class than in the 0–15 cm DBH class. Seven of the 22 cities (31.8%) in the Californian study were defined as maturing [9], but only two (Gainesville, FL and Los Angeles, CA) of the 38 cities (5.3%) in the present study meet that description.
A third distribution identified by McPherson and Rowntree, the mature distribution, was described as having a relatively even distribution of trees across all DBH classes, with a large proportion of mature or senescent trees [9]. Seven of the 22 cities in the Californian study were defined as mature. Though Gainesville, FL technically fits into the McPherson and Rowntree’s maturing distribution by definition, it is reasonable to suggest that it may be better described as mature given 20.3% of trees were in the largest DBH class (>83.8 cm).
The differences between McPherson and Rowntree’s 1989 study [9] and the present study warrant further discussion. Only 36.4% of the cities in McPherson and Rowntree’s study had a youthful distribution compared with 94.7% of cities in this study. In contrast, while 31.8% of Californian cities in 1989 had a maturing distribution, only 5.3% of the 38 cities in the present study had maturing DBH distributions. This disparity could simply be a result of comparing two different groups of cities, one group comprising only Californian cities, the other group comprising cities from around the US, with only three cities in California. Alternatively, it could be that only street trees were included in the Californian study, whereas the data presented here includes a sample of all trees in the urban forest. This may include a large number of small, naturally regenerating trees [29].
A number of other potential explanations also exist. Knowing that youthful distributions are characterised by a large proportion of small trees, it could be suggestive of a preference for smaller trees in urban areas [30]. Alternatively, it may suggest a recent increase in tree planting efforts. Cities like New York, NY and Los Angeles, CA have implemented high profile tree planting campaigns in the last decade [31,32], so it is possible that other cities have also undertaken large tree planting efforts, resulting in a large proportion of cities with a youthful distribution.
Interestingly, a follow up study of street tree size class distributions in California showed a shift from a maturing population towards a youthful population structure, a result attributed to high rates of street tree planting and the use of small-statured species [10]. This 2016 follow up study shows that the youthful DBH population structure in Californian street trees are much more comparable to the DBH structure of the urban forests of the 38 cities included in the present study.

4.2. Stable or Expanding Urban Tree Populations?

Many municipalities attempt to expand their urban forests by setting canopy cover goals e.g., [33,34,35], tree planting goals e.g., [31,32], and/or more nuanced performance indicators [36]. Many good reasons exist for expanding urban forests, namely the correlation with increased ecosystem services [37]. However, once urban forest expansion has attained specified performance indicators, stability is desirable to streamline management.
McPherson and Rowntree [9] suggest that the youthful distribution “coincides with Richards’ [15] recommendation of a good age distribution for population stability”. Indeed, in a natural forest, the youthful and maturing distributions may help to ensure stability. The high proportion of seedlings and saplings are recruited into larger diameter classes over time [13], counteracting the high rates of mortality resulting from competition as well as abiotic and biotic factors. However, is the same true for urban forests? Are youthful and maturing distributions characteristic of a stable urban forest population? These questions require further consideration and study, because the difference between a stable population or an expanding population of trees has significant policy, planning, and management implications.

4.3. Policy, Planning, and Management Implications of Structural Diversity

In the context of characterising the diversity of terrestrial ecosystems, dozens of structural indicators have been proposed [38]. DBH is amongst the most commonly collected urban forest data [20,39], perhaps because it is relatively simple to measure, and is frequently used in allometric relationships to estimate other structural attributes [40]. In urban contexts, DBH can be highly correlated with age and other structural characteristics within a species, though this is not always the case [41]. Together with condition rating, mortality status, and species, DBH is useful in making management and planning decisions [1]. Where tree age is not available, using DBH as a proxy for age [10] allows managers to determine current needs and assess how they will change in the future [3].
In general terms, cities have limited financial resources to dedicate to urban forest policy, planning, and management. Resources may be allocated to planting, establishment, maintenance, risk assessment, removals, amongst other operations. Operational focus, and thus financial resource allocation, may differ depending on age and structural distributions.
For cities with a youthful or exponentially inverse-proportional diameter distribution, the short-term (<5 years) management focus will be on the successful establishment of planted trees in the smallest diameter class. Maintenance activities including irrigation [42] and mulching [43] will help to ensure newly planted trees survive and are recruited into larger size classes. In the medium term (5–50 years), regular maintenance, including pruning for a large number of maturing trees will require budgetary considerations. In the long-term (>50 years), urban forest managers will require strategies to deal with an aging urban forest, including increased maintenance and risk assessment, as well as consideration for removals.
For those cities with a linearly inverse-proportional diameter distribution approximating McPherson and Rowntree’s maturing distribution [9], maintenance of trees will maximise their health and thus optimise the ecosystem services they provide. A focus on planting new trees and ensuring their successful establishment should also be a short-term objective to ensure the maturing distribution does not shift towards a mature distribution. McPherson and Kotow [44] made a similar tree planting recommendation for Californian municipalities with a small proportion of juvenile trees. In the medium term, budgeting will be required to cope with a maturing urban forest requiring increased maintenance, risk assessment, and removal of senescent, hazardous, or dead trees.
It is important to frame the policy, planning, and management implications appropriately. City-wide diameter distributions, as presented in the results, have limited utility for day-to-day urban forest management, because of the coarse nature of the data. Many urban forest managers require fine-scale, detailed descriptions of individual or small groups of trees (e.g., within a park or along a street). In contrast, urban forest policymakers are reliant on high-level data, such as canopy cover, species diversity, or DBH distributions. These comparatively simple descriptors are often included in urban forest strategy, policy, or planning documents, which ultimately guide management.

4.4. Functional Implications of Structural Diversity

Urban forest function is often described with respect to ecosystem services, subdivided into supporting, provisioning, regulating, and cultural services [45]. The distribution of tree diameters has functional implications, as tree size and leaf area influence supporting, provisioning, and regulating ecosystem services. With respect to these ecosystem services, a youthful distribution may have relatively limited functional benefit in comparison with a maturing distribution because small trees are relatively minor contributors to ecosystem services [3,4,5]. Nevertheless, as small trees in cities with a youthful distribution grow into larger size classes, cities will benefit from increased ecosystem services.

4.5. Study Limitations

Despite the wide range of geographic, climatic, and demographic conditions represented by the 38 cities in this study, caution should be exercised before generalising the results. All diameter distributions summarised herein were provided to the USDA Forest Service by cities that chose to undertake an urban forest inventory. These cities may be those that invest more in urban forest management, and thus may not be representative of other cities in the United States, or globally.
It is also important to note that the results presented herein assume that inventory data collected by individual communities are correct. While data collection protocols and standards were provided to all cities, data were collected by combinations of professional foresters, researchers, and volunteers. As such, there is potential for inaccuracy in DBH measurements. While individual tree DBH measurements may be subject to inaccuracy, it is not likely that this would affect overall distributions since DBH ranges (e.g., 7.7–15.2 cm) were used to aggregate the data.
Another consideration is the number of inventory plots and trees sampled in different cities. The number of sample plots ranged from 63 (Winooski, VT) to 745 (Chicago, IL), while the number of sampled trees ranged from 194 (Golden, CO) to 2950 (Chapel Hill, NC). The sample size may have had an effect on the standard error of DBH distributions, with the error decreasing as the number of plots increases [46].

5. Conclusions

This study summarised diameter class distributions for 38 cities in the USA with a range of geographic, climatic, and demographic conditions. No statistically significant differences in the DBH distributions across cities existed, though qualitative differences were apparent. Two primary distribution forms were encountered, which aligned with distributions proposed in previous research [9]. In the present study, many cities had an inversely proportional exponential diameter distribution, whereby an exponential decrease in the proportion of trees occurs with each increase in tree diameter class. These cities had large proportions of trees in the smallest diameter classes and a small proportion of trees in the largest diameter classes. Other cities were characterised by an inversely proportional linear distribution, where the proportion of trees in each subsequently larger DBH class decreased roughly linearly. In previous literature, these are referred to as Type I (youthful) and Type II (maturing) distributions, respectively [9].
Youthful, but to a greater extent, maturing distributions approximate the ideal DBH distribution proposed by Richards [15] for its supposed stability, which is desirable from a management perspective. However, neither distribution type is ideal for maximising ecosystem services, as maturing trees comprise a low proportion of the total population. Millward and Sabir’s ideal distribution (2010, Figure 4) seems better suited to maximising ecosystem service, while also providing population stability. Low mortality rates see only small decreases in the proportion of trees in subsequently larger size classes until trees reach a mature state, at which point mortality rates increase, resulting in a very low proportion of trees in the largest diameter class. Implicit in this diameter distribution is a focus shifting from prioritising new tree plantings to improving establishment practices and tree maintenance, thus resulting in reduced mortality and population stability. The additional benefit of this distribution is the low proportion of over-mature trees, which no longer contribute maximally to ecosystem services and have increased associated risk.
To conclude, the common data collection framework and reporting standards used by cities in this study allowed for the synthesis and comparison of urban forest diameter distributions in 38 cities across America. Such data may help guide national, regional, or state-level urban forest policies or strategies. Further studies may also take advantage of these data to investigate explanatory reasons for differing diameter distributions in different cities.

Author Contributions

Research conceptualization, J.M., D.J.N. and A.K.K.; methodology, J.M., D.J.N. and A.K.K.; formal analysis, J.M. and A.K.K.; investigation, J.M., D.J.N. and A.K.K.; data curation, J.M. and D.J.N.; writing—original draft preparation, J.M.; writing—review and editing, D.J.N. and A.K.K. All authors have read and agreed to the published version of the manuscript.

Funding

This research received no external funding.

Acknowledgments

The authors wish to thank two anonymous reviewers for their constructive reviews.

Conflicts of Interest

The authors declare no conflict of interest.

References

  1. Roman, L.A.; McPherson, E.G.; Scharenbroch, B.C.; Bartens, J. Identifying common practices and challenges for local urban tree monitoring programs across the United States. Arboric. Urban For. 2013, 39, 292–299. [Google Scholar]
  2. Buongiorno, J.; Dahir, S.; Lu, H.-C.; Lin, C.-R. Tree size diversity and economic returns in uneven-aged forest stands. For. Sci. 1994, 40, 83–103. [Google Scholar]
  3. Maco, S.E.; McPherson, E.G. A practical approach to assessing structure, function, and value of street tree populations in small communities. J. Arboric. 2003, 29, 84–98. [Google Scholar]
  4. Kowarik, I. Novel urban ecosystems, biodiversity, and conservation. Environ. Pollut. 2011, 159, 1974–1983. [Google Scholar] [CrossRef]
  5. Nowak, D.J.; Aevermann, T. Tree compensation rates: Compensating for the loss of future tree values. Urban For. Urban Green. 2019, 41, 93–103. [Google Scholar] [CrossRef]
  6. Koeser, A.; Hauer, R.; Norris, K.; Krouse, R. Factors influencing long-term street tree survival in Milwaukee, WI, USA. Urban For. Urban Green. 2013, 12, 562–568. [Google Scholar] [CrossRef]
  7. Nowak, D.J.; Hoehn, R.E., III; Crane, D.E.; Stevens, J.C.; Leblanc Fisher, C. Assessing Urban Forest Effects and Values, Chicago’s Urban Forest; Resource Bulletin NRS-37; U.S. Department of Agriculture, Forest Service, Northern Research Station: Newtown Square, PA, USA, 2010; 27p.
  8. Welch, J.M. Street and park trees of Boston: A comparison of urban forest structure. Landsc. Urban Plan. 1994, 29, 131–143. [Google Scholar] [CrossRef]
  9. McPherson, E.G.; Rowntree, R.A. Using Structural Measures to Compare Twenty-Two U.S. Street Tree Populations. Landsc. J. 1989, 8, 13–23. [Google Scholar] [CrossRef]
  10. McPherson, E.G.; van Doorn, N.; de Goede, J. Structure, function and value of street trees in California, USA. Urban For. Urban Green. 2016, 17, 104–115. [Google Scholar] [CrossRef] [Green Version]
  11. Millward, A.A.; Sabir, S. Structure of a forested urban park: Implications for strategic management. J. Environ. Manag. 2010, 91, 2215–2224. [Google Scholar] [CrossRef]
  12. De Liocourt, F. De l’amenagement des Sapinières. Bulletin Trimestriel-Société Forestière de Franche-Comté et Belfort 1898, 4, 396–409. [Google Scholar]
  13. McCarthy, J.W.; Weetman, G. Age and size structure of gap-dynamic, old-growth boreal forest stands in Newfoundland. Silva Fenn. 2006, 40, 209–230. [Google Scholar] [CrossRef] [Green Version]
  14. Nowak, D.; Hoehn, R.; Bodine, A.; Greenfield, E.; O’Neil-Dunne, J. Urban forest structure, ecosystem services and change in Syracuse, NY. Urban Ecosyst. 2016, 19, 1455–1477. [Google Scholar] [CrossRef]
  15. Richards, N.A. Diversity and stability in a street tree population. Urban Ecol. 1983, 7, 159–171. [Google Scholar] [CrossRef]
  16. Kottek, M.; Grieser, J.; Beck, C.; Rudolf, B.; Rubel, F. World map of the Köppen-Geiger climate classification updated. Meteorol. Z. 2006, 15, 259–263. [Google Scholar] [CrossRef]
  17. Rubel, F.; Brugger, K.; Haslinger, K.; Auer, I. The climate of the European Alps: Shift of very high resolution Köppen-Geiger climate zones 1800–2100. Meteorol. Z. 2017, 26, 115–125. [Google Scholar] [CrossRef]
  18. U.S. Census Bureau. SUB-EST2014: Subcounty Resident Population Estimates: April 1, 2010 to July 1, 2014; U.S. Census Bureau: Suitland, MD, USA, 2015.
  19. USDA Forest Service. i-Tree Eco Field Guide v6.0. 2019. Available online: https://www.itreetools.org/tools/i-tree-eco (accessed on 22 January 2020).
  20. Morgenroth, J.; Östberg, J. Measuring and Monitoring Urban Trees and Urban Forests. In Routledge Handbook of Urban Forestry; Ferrini, F., van den Konijnendijk Bosch, C., Fini, A., Eds.; Routledge: New York, NY, USA, 2017; pp. 33–48. [Google Scholar]
  21. Roman, L.A.; Scharenbroch, B.C.; Östberg, J.P.; Mueller, L.S.; Henning, J.G.; Koeser, A.K.; Sanders, J.R.; Betz, D.R.; Jordan, R.C. Data quality in citizen science urban tree inventories. Urban For. Urban Green. 2017, 22, 124–135. [Google Scholar] [CrossRef]
  22. R Core Team. R: A Language and Environment for Statistical Computing; R Foundation for Statistical Computing: Vienna, Austria, 2019. [Google Scholar]
  23. Pohlert, T. The Pairwise Multiple Comparison of Mean Ranks Package. 2014. Available online: https://cran.r-project.org/ (accessed on 22 January 2020).
  24. Engmann, S.; Cousineau, D. Comparing distributions: The two-sample Anderson-Darling test as an alternative to the Kolmogorov-Smirnoff test. J. Appl. Quant. Methods 2011, 6, 1–17. [Google Scholar]
  25. Kendal, D.; Dobbs, C.; Lohr, V.I. Global patterns of diversity in the urban forest: Is there evidence to support the 10/20/30 rule? Urban For. Urban Green. 2014, 13, 411–417. [Google Scholar] [CrossRef]
  26. McElhinny, C.; Gibbons, P.; Brack, C.; Bauhus, J. Forest and woodland stand structural complexity: Its definition and measurement. For. Ecol. Manag. 2005, 218, 1–24. [Google Scholar] [CrossRef]
  27. Spellerberg, I.F.; Fedor, P.J. A tribute to Claude Shannon (1916–2001) and a plea for more rigorous use of species richness, species diversity and the ‘Shannon–Wiener’Index. Glob. Ecol. Biogeogr. 2003, 12, 177–179. [Google Scholar] [CrossRef] [Green Version]
  28. Oksanen, J.; Blanchet, F.G.; Kindt, R.; Legendre, P.; Minchin, P.R.; O’Hara, R.B.; Simpson, G.L.; Solymos, P.; Stevens, M.H.H.; Wagner, H. Vegan: Community Ecology Package. R Package Version 2.3-0. 2015. Available online: https://cran.r-project.org/ (accessed on 22 January 2020).
  29. Nowak, D.J. Contrasting natural regeneration and tree planting in fourteen North American cities. Urban For. Urban Green. 2012, 11, 374–382. [Google Scholar] [CrossRef]
  30. Pearce, L.M.; Kirkpatrick, J.B.; Davison, A. Using size class distributions of species to deduce the dynamics of the private urban forest. Urban For. Urban Green. 2013, 39, 74–84. [Google Scholar]
  31. Pincetl, S. Implementing municipal tree planting: Los Angeles million-tree initiative. Environ. Manag. 2010, 45, 227–238. [Google Scholar] [CrossRef] [PubMed] [Green Version]
  32. Campbell, L.K. Constructing New York City’s urban forest. The politics and governance of the MillionTreesNYC campaign. In Sandbergl. Anders; Bardekjianadrina; Buttsadiaeds. Urban For. Trees Greenspace. A Policy Perspective; Routledge: New York, NY, USA, 2014; Chapter 16; pp. 242–260. [Google Scholar]
  33. Danford, R.S.; Cheng, C.; Strohbach, M.W.; Ryan, R.; Nicolson, C.; Warren, P.S. What Does It Take to Achieve Equitable Urban Tree Canopy Distribution? A Boston Case Study. Cities Environ. (Cate) 2014, 7, 2. [Google Scholar]
  34. Locke, D.H.; Grove, J.M.; Galvin, M.; O’Neil-Dunne, J.P.; Murphy, C. Applications of urban tree canopy assessment and prioritization tools: Supporting collaborative decision making to achieve urban sustainability goals. Cities Environ. (Cate) 2013, 6, 7. [Google Scholar]
  35. Ordóñez, C.; Duinker, P.N. An analysis of urban forest management plans in Canada: Implications for urban forest management. Landsc. Urban Plan. 2013, 116, 36–47. [Google Scholar] [CrossRef] [Green Version]
  36. Kenney, W.A.; van Wassenaer, P.J.E.; Satel, A.L. Criteria and indicators for strategic urban forest planning and management. Arboric. Urban For. 2011, 37, 108–117. [Google Scholar]
  37. Roy, S.; Byrne, J.; Pickering, C. A systematic quantitative review of urban tree benefits, costs, and assessment methods across cities in different climatic zones. Urban For. Urban Green. 2012, 11, 351–363. [Google Scholar] [CrossRef] [Green Version]
  38. Noss, R.F. Indicators for Monitoring Biodiversity: A Hierarchical Approach. Conserv. Biol. 1990, 4, 355–364. [Google Scholar] [CrossRef]
  39. Miller, R.W.; Hauer, R.J.; Werner, L.P. Urban Forestry: Planning and Managing Urban Greenspaces, 3rd ed.; Waveland Press: Long Grove, IL, USA, 2015. [Google Scholar]
  40. McHale, M.; Burke, I.; Lefsky, M.; Peper, P.; McPherson, E. Urban forest biomass estimates: Is it important to use allometric relationships developed specifically for urban trees? Urban Ecosyst. 2009, 12, 95–113. [Google Scholar] [CrossRef]
  41. Troxel, B.; Piana, M.; Ashton, M.S.; Murphy-Dunning, C. Relationships between bole and crown size for young urban trees in the northeastern USA. Urban For. Urban Green. 2013, 12, 144–153. [Google Scholar] [CrossRef]
  42. Gilman, E.F. Effect of nursery production method, irrigation, and inoculation with mycorrhizae-forming fungi on establishment of Quercus virginiana. J. Arboric. 2001, 27, 30–39. [Google Scholar]
  43. Morgenroth, J.; Santos, B.; Cadwallader, B. Conflicts between landscape trees and lawn maintenance equipment—The first look at an urban epidemic. Urban For. Urban Green. 2015, 14, 1054–1058. [Google Scholar] [CrossRef]
  44. McPherson, E.G.; Kotow, L. A municipal forest report card: Results for California, USA. Urban For. Urban Green. 2013, 12, 134–143. [Google Scholar] [CrossRef]
  45. Millenium Ecosystem Assessment. Ecosystems and Human Well-Being: Synthesis; Island Press: Washington, DC, USA, 2005. [Google Scholar]
  46. USDA Forest Service. i-Tree Eco User’s Manual v6.0. 2019. Available online: https://www.itreetools.org/tools/i-tree-eco (accessed on 22 January 2020).
Figure 1. Type I, Type II, and Type III structural distributions.
Forests 11 00135 g001
Figure 2. Locations of 38 cities in which i-Tree surveys were conducted. Tree diameter distributions from these cities were analysed in this study.
Forests 11 00135 g002
Figure 3. Tree diameter at breast height (DBH) distributions for sampled cities. Data points represent the percentage of trees in each city within the following 11 DBH classes: ≤7.6, 7.7–15.2, 15.3–22.8, 22.9–30.4, 30.5–38, 38.1–45.6, 45.7–53.2, 53.3–60.8, 60.9–68.4, 68.5–76, and >76 cm. A non-linear least squares exponential model (Equation (1)) is fitted to each distribution. Shannon–Wiener Index (H) values are included for each distribution. Panels are ordered alphabetically from top left to bottom right.
Forests 11 00135 g003
Figure 4. DBH distribution and line of best fit for trees from the 38 cities for which i-Tree inventories were conducted are shown. Ideal diameter class distributions for urban trees from previous studies are also presented. Mid-points for stem diameter class distributions for street trees, as suggested by Richards [15], and for an urban park, as suggested by Millward and Sabir [11] are included for context.
Forests 11 00135 g004
Table 1. Climatic and demographic descriptions of the 38 cities included in this study.
CityStateUSDA Plant Hardiness ZoneKöppen-Geiger Climate ClassificationUS Census Population Estimate (2014)Year of i-Tree Eco Assessment# Sample Plots# Sampled Trees
AlbuquerqueNew Mexico7bBSk557,1692013199421
Ann ArborMichigan6aDfa117,77020132011596
AtlantaGeorgia7bCfa456,00219972052402
AustinTexas8bCfa912,79120142062027
BaltimoreMaryland7aCfa622,79320091951030
BostonMassachusetts5bCfa655,8841996217930
CasperWyoming4aBSk60,0862006234235
Chapel HillN. Carolina7bCfa59,3762012802950
ChicagoIllinois5bDfa2,722,38920077451697
El PasoTexas8aBWh679,0362014201279
FreeholdNew Jersey6bCfa11,9731998144626
GainesvilleFlorida8bCfa128,4602007931335
GoldenColorado5aDfb20,2012007115194
HartfordConnecticut6aCfa124,7052007200791
HoustonTexas8bCfa2,239,5582015200731
Jersey CityNew Jersey6bCfa262,1461998220341
Las CrucesNew Mexico8aBWk101,4082014205224
LincolnNebraska5bDfa272,9962008/09178573
Los AngelesCalifornia10bCsb3,928,8642007/08348681
MesquiteTexas8aCfa144,41620122251591
MilwaukeeWisconsin5bDfa599,64220082161084
MinneapolisMinnesota4aDfa407,2072004110278
MoorestownNew Jersey6bCfa20,59420002061690
MorgantownWest Virginia6aCfa31,07320041361295
New YorkNew York6bCfa8,491,0791996206643
OmahaNebraska5aDfa446,5992008/091891005
PhiladelphiaPennsylvania7bCfa1,560,29719962101433
PhoenixArizona9bBWh1,537,0582017204263
PlanoTexas8aCfa278,4802014225828
ProvidenceRhode Island6aCfa179,1542013250860
SacramentoCalifornia9bCsa485,1992007300637
San FranciscoCalifornia10aCsb852,4692004194478
ScrantonPennsylvania6aDfb75,28120061821798
SyracuseNew York5aDfb144,26320091981499
TampaFlorida9bCfa358,69920112011642
WashingtonD.C.7aCfa658,8932004201976
WinooskiVermont5aDfb7228201463529
WoodbridgeNew Jersey7aCfa100,82420002151284

