Groundwater Level Fluctuations Affect the Mortality of Black Alder (Alnus glutinosa Gaertn.)


Abstract
1. Introduction
2. Material and Methods
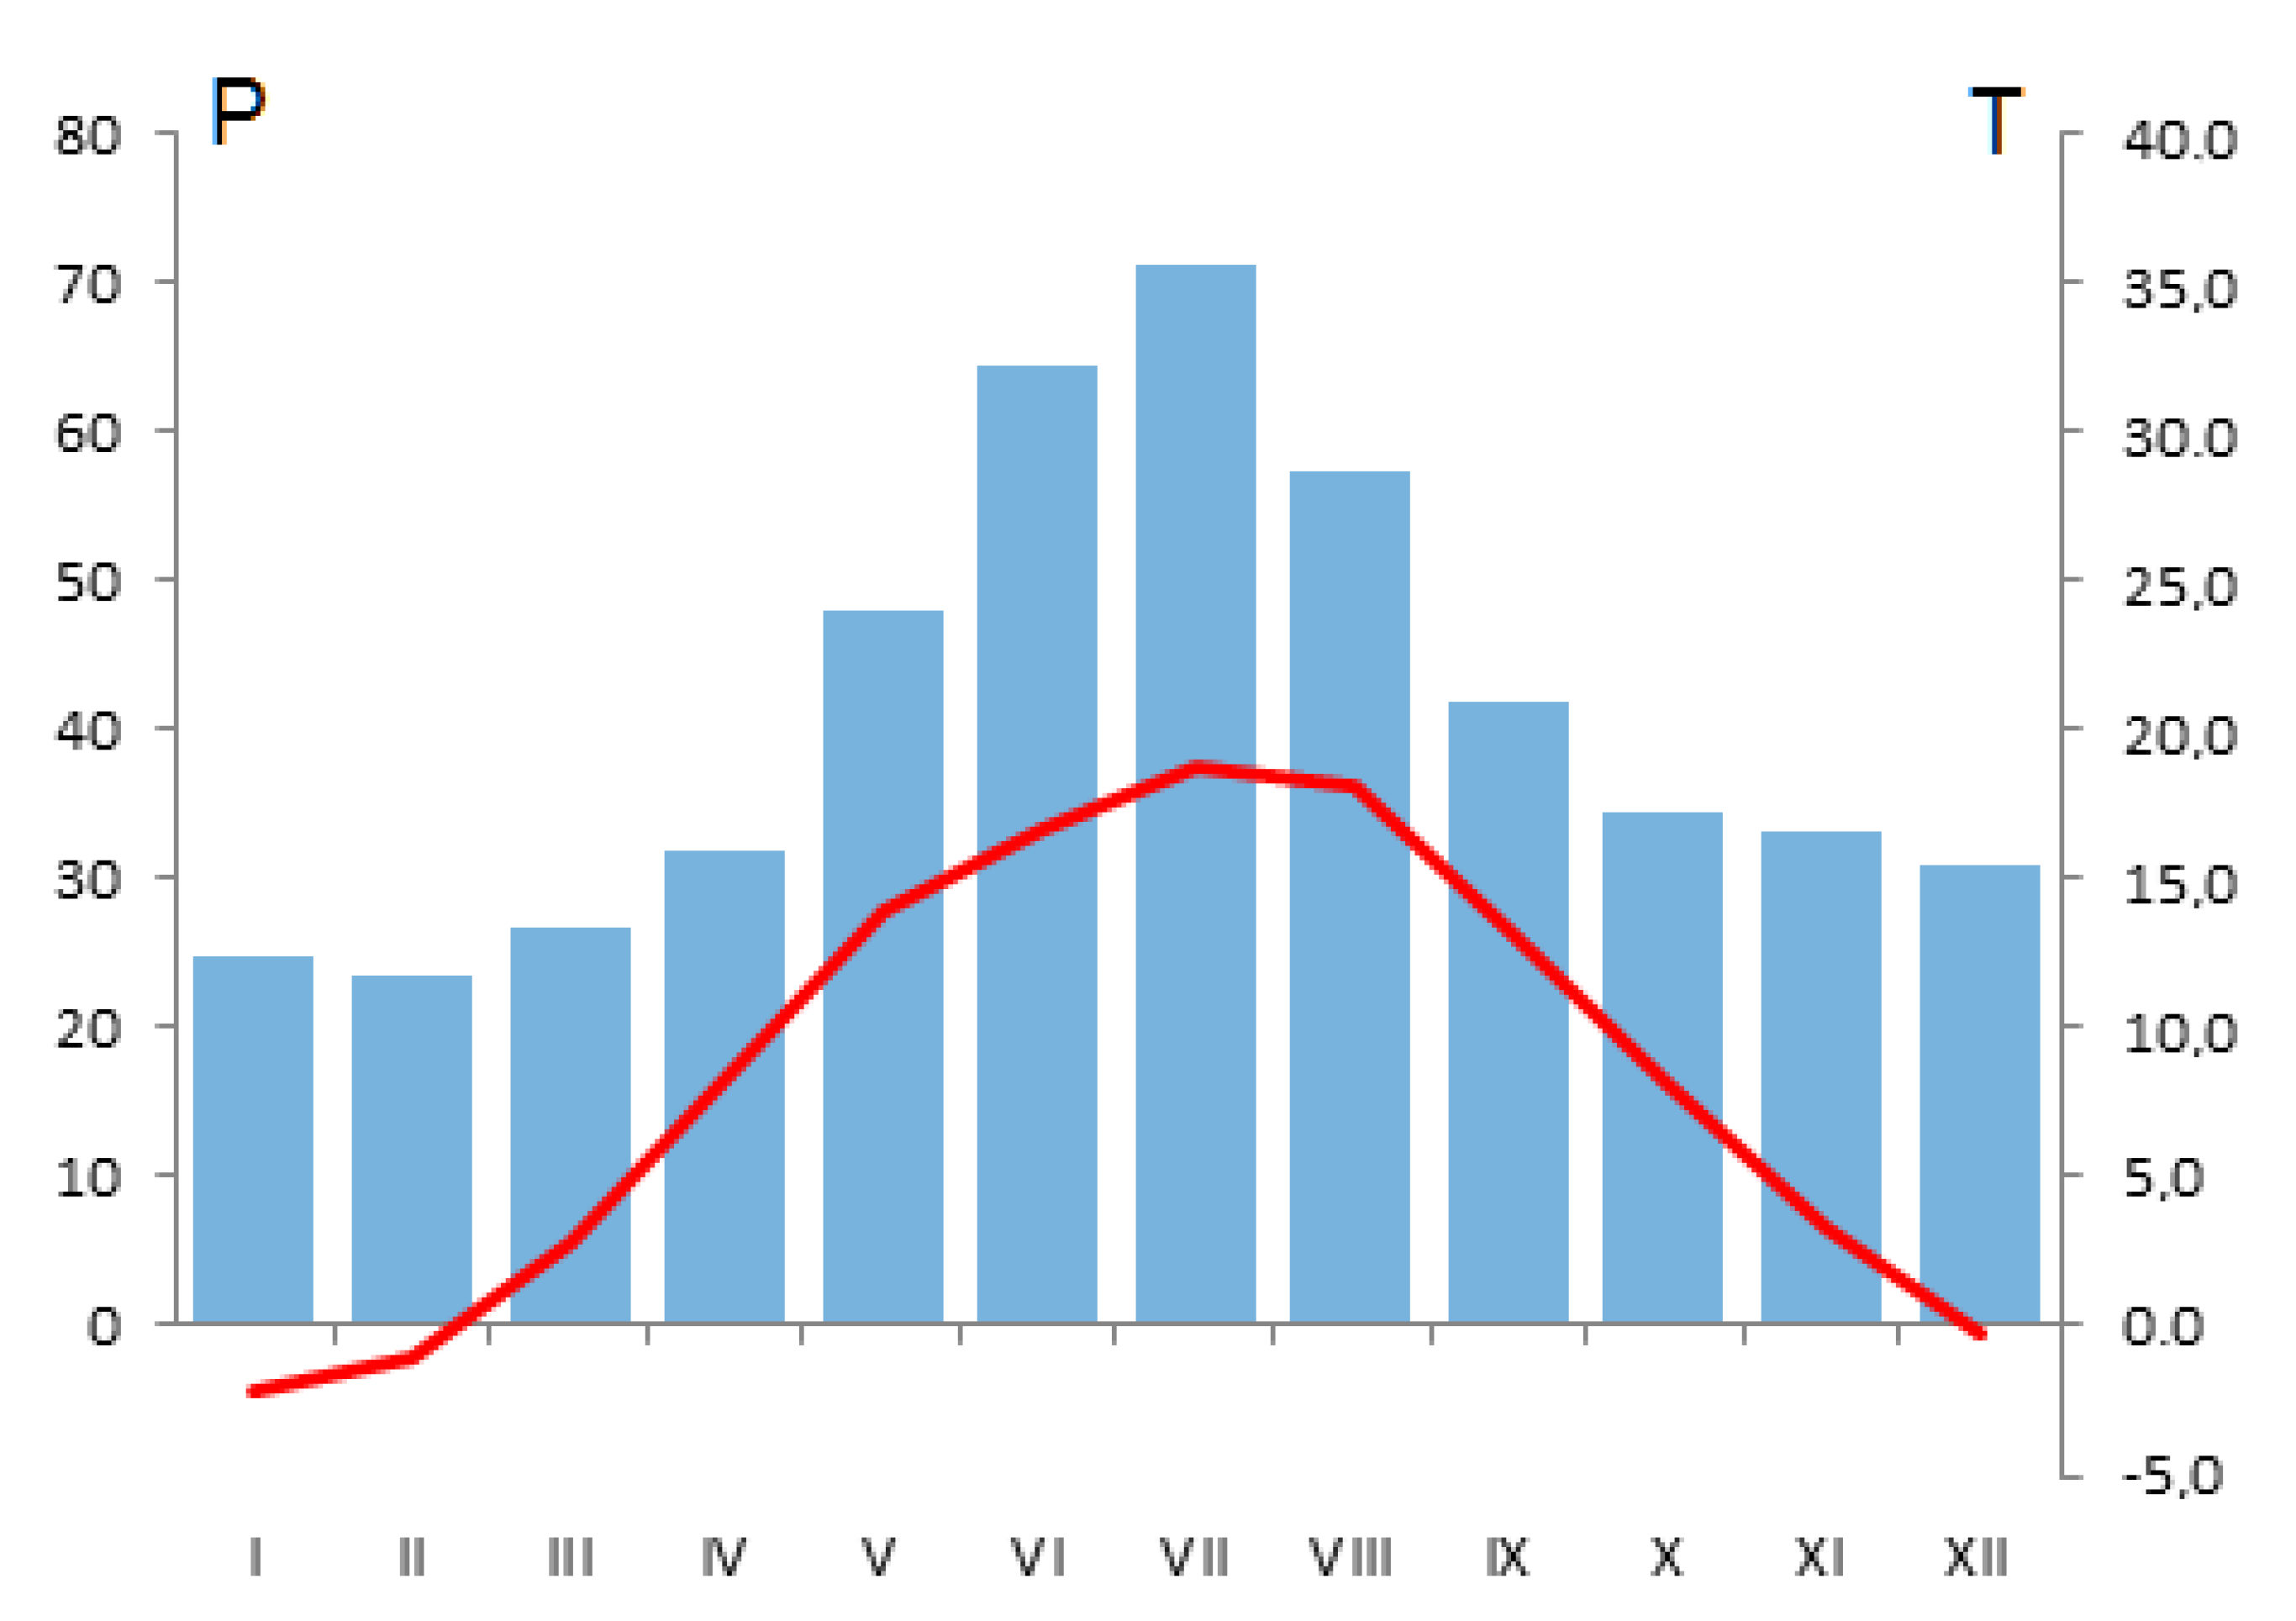
2.1. Study Site
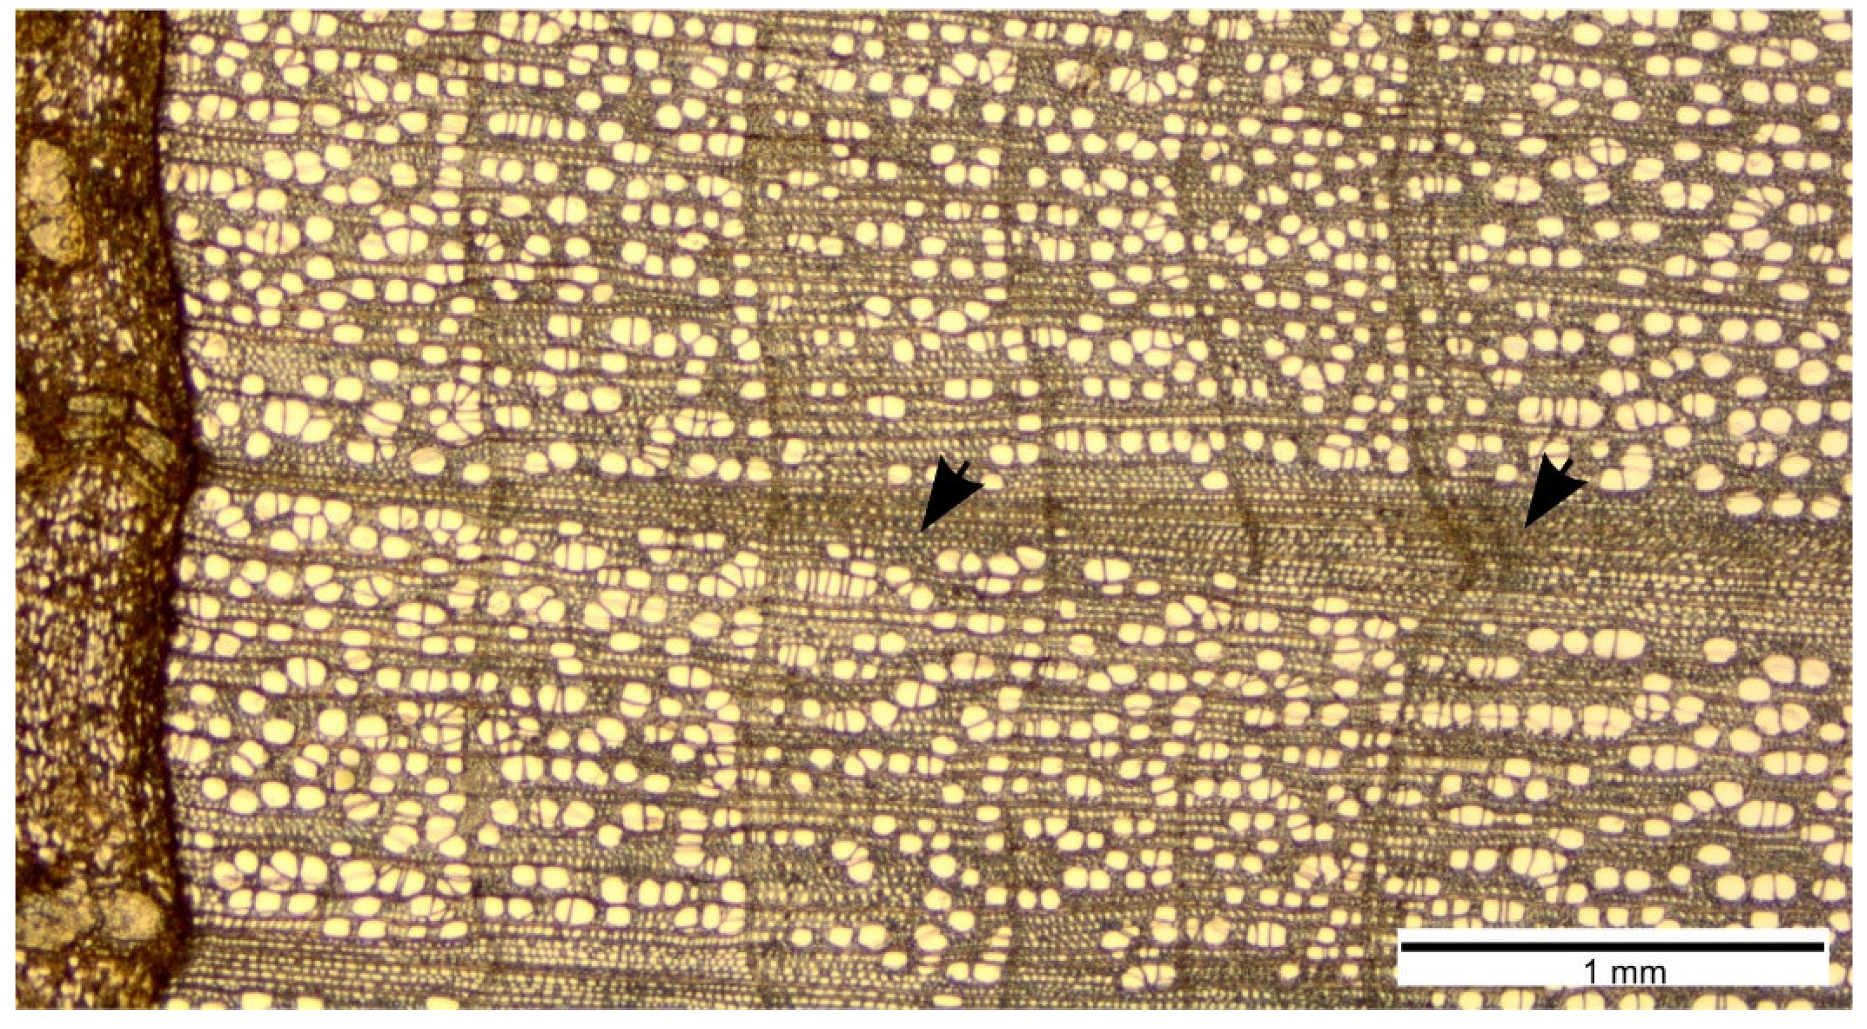
2.2. Sampling and Data Acquisition
2.3. Data Transformation and Analyses
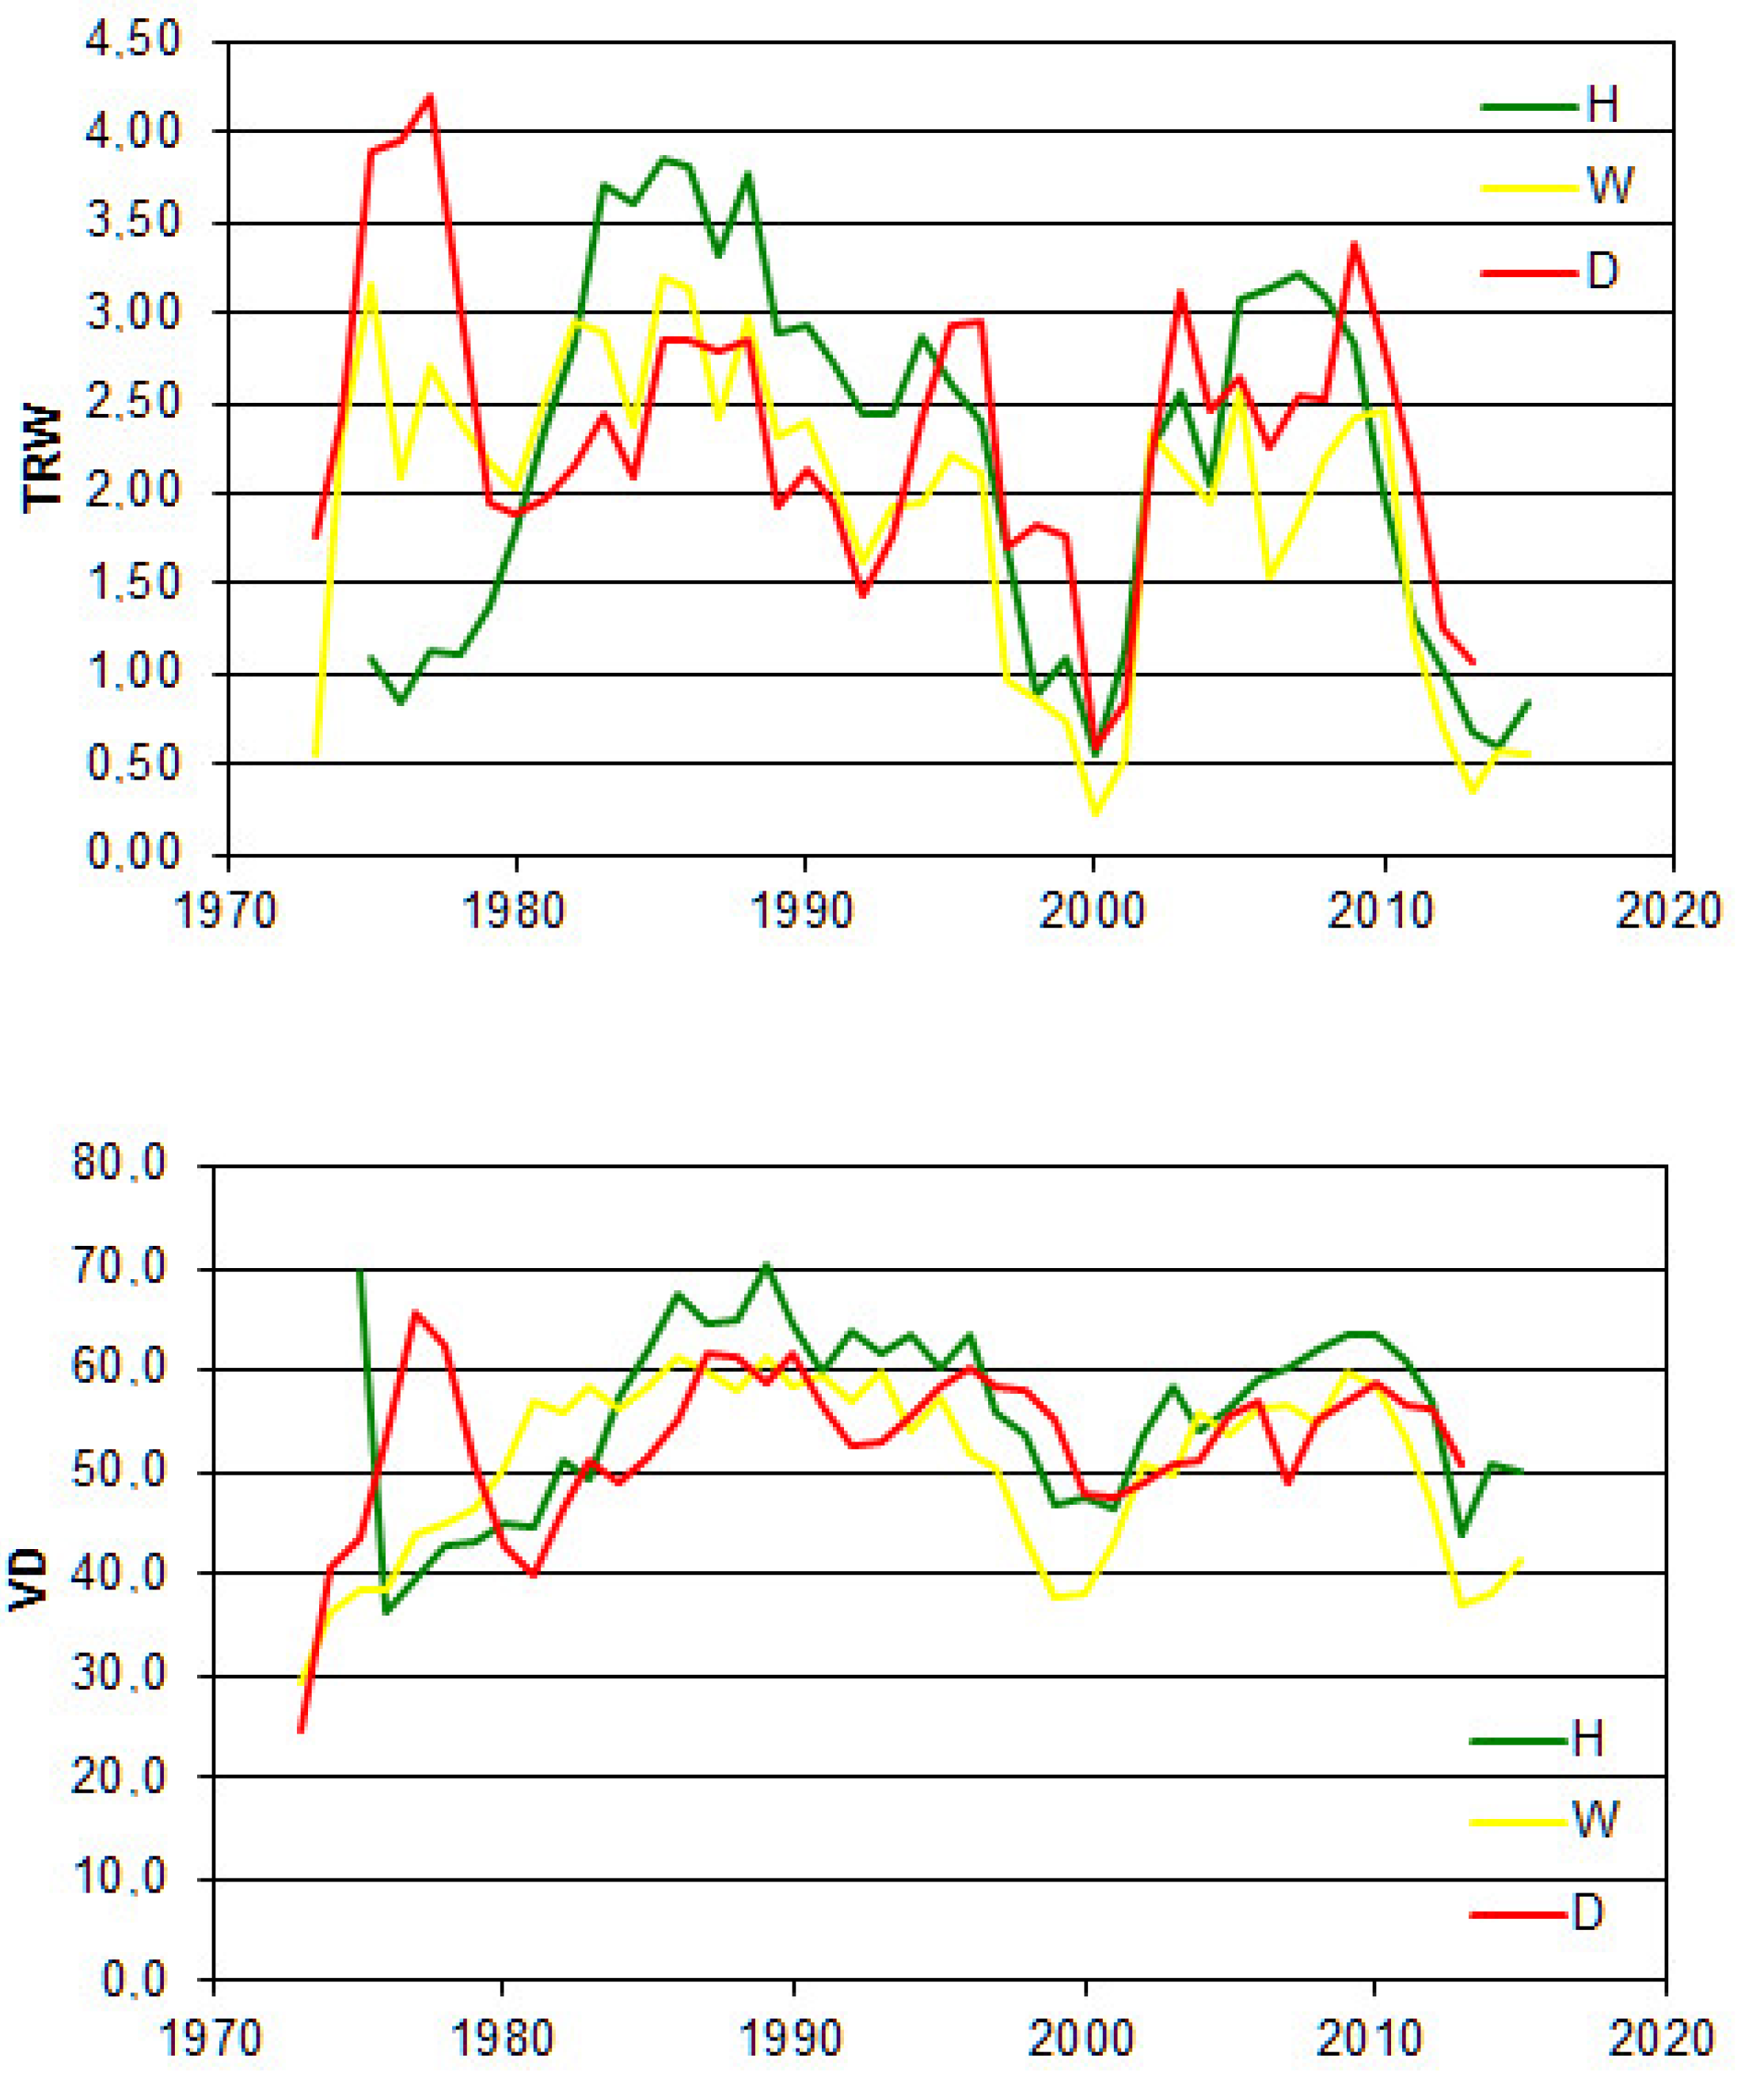
3. Results
4. Discussion
5. Conclusions
Author Contributions
Funding
Acknowledgments
Conflicts of Interest
References
- Claessens, H.; OOsterbaan, A.; Savill, P.; Rondeux, J. A review of the characteristics of black alder (Alnus glutinosa (L.) Gaertn.) and their implications for silvicultural practices. Forestry 2010, 83, 163–175. [Google Scholar] [CrossRef]
- Bjelke, U.; Boberg, J.; Oliva, J.; Tattersdill, K.; Mckie, B.G. Dieback of riparian alder caused by the Phytophthora alni complex: Projected consequences for stream ecosystems. Freshw. Biol. 2016, 61, 565–579. [Google Scholar] [CrossRef]
- Kaelke, C.M.; Dawson, J.O. Seasonal flooding regimes influence survival, nitrogen fixation, and the partitioning of nitrogen and biomass in Alnus incana ssp. Rugosa. Plant Soil 2003, 254, 167–177. [Google Scholar] [CrossRef]
- Gibbs, J.N.; Van Dijk, C.; Webber, J. Phytophthora disease of alder in Europe. Bulletin 2003, 126, 82. [Google Scholar]
- Oszako, T. Zamieranie olszy w Europie. Lesn. Pr. Badaw. 2005, 1, 53–63. [Google Scholar]
- Belbahri, L.; Moralejo, E.; Calmin, G.; Oszako, T.; Garcia, J.A.; Descals, E.; Lefort, F. Phytophthora polonica, a new species isolated from declining Alnus glutinosa stands in Poland. FEMS Microbiol. Lett. 2006, 261, 165–174. [Google Scholar] [CrossRef] [PubMed]
- Brasier, C.M.; Kirk, S.A.; Delcan, J.; Cooke, D.E.L.; Jung, T.; Manin’t Veld, W.A. Phytophthora alni sp. Nov. and its variants: Designation of emerging heteroploid hybrid pathogens spreading on Alnus trees. Mycol. Res. 2004, 108, 1172–1184. [Google Scholar] [CrossRef]
- Thoirain, B.; Husson, C.; Marcais, B. Risk factors for the Phytophthora-induced decline of alder in northeastern France. Phytopathology 2007, 97, 99–105. [Google Scholar] [CrossRef]
- Černy, K.; Gregorová, B.; Strnadová, V.; Holub, V.; Tomsovsky, M.; Cervenka, M. Phytophthora alni causing decline of black alders in Czech Republic. Plant Pathol. 2008, 57, 370. [Google Scholar] [CrossRef]
- Husson, C.; Aguayo, J.; Revellin, C.; Frey, P.; Ioos, R.; Marçais, B. Evidence for homoploid speciation in Phytophthora alni supports taxonomic reclassification in this species complex. Fungal Genet. Biol. 2015, 77, 12–21. [Google Scholar] [CrossRef]
- Černy, K.; Strnadová, V. Phytophthora alni decline: Disease symptoms, causal agent and its distribution in Czech Republic. Plant Protect. Sci. 2010, 46, 12–18. [Google Scholar] [CrossRef]
- Leuven, R.E.W.; Van Der Velde, G.; Baijens, I.; Snijders, J.; Van der Zwart, C.; Lenders, H.J.R.; de Vaate, A. The river Rhine: A global highway for dispersal of aquatic invasive species. Biol. Invasions 2009, 11, 1989–2008. [Google Scholar] [CrossRef]
- Aguayo, J.; Elegbede, F.; Husson, C.; Saintonge, F.X.; Marcais, B. Modelling climate impact on an emerging disease, the Phytophthora alni—Induced alder decline. Glob. Chang. Biol. 2014, 20, 3209–3221. [Google Scholar] [CrossRef] [PubMed]
- Jobbagy, E.G.; Jackson, R.B. Groundwater use and salinization with grassland afforestation. Glob. Chang. Biol. 2004, 10, 1299–1312. [Google Scholar] [CrossRef]
- Nosetto, M.D.; Jobbagy, E.G.; Jackson, R.B.; Sznaider, G.A. Reciprocal influence of crops and shallow ground water in sandy landscapes of the Inland Pampas. Field Crop Res. 2009, 113, 138–148. [Google Scholar] [CrossRef]
- Oliviera-Filho, A.T.; Vilela, E.A.; Gavilanes, M.L.; Carvalho, D.A. Effect of flooding regime and understorey bamboos on the physiognomy and tree species composition of a tropical semideciduous forest in southeastern Brazil. Vegetatio 1994, 113, 99–124. [Google Scholar]
- Kozlowski, T.T.; Pallardy, S.G. Physiology of Woody Plants; Academic Press: New York, NY, USA, 1997. [Google Scholar]
- Kozlowski, T.T. Responses of woody plants to flooding and salinity. Tree Physiol. 1997, 1, 1–29. [Google Scholar] [CrossRef]
- Rose, M.; Ghulam, M.; Waseem, T. A Review: Effects of climate change on agriculture, food resources and forestry. Int. J. Environ. Eco. Res. 2019, 1, 33–37. [Google Scholar]
- Parent, C.; Capelli, N.; Berger, A.; Crévecoeur, M.; Dat, J.F. An overiew of plant responses to soil waterlogging. Plant Stress 2008, 2, 20–27. [Google Scholar]
- Kozlowski, T.T. Plant responses to flooding of soil. BioScience 1984, 34, 162–167. [Google Scholar] [CrossRef]
- Vyhlidková, D.; Palovčiková, M.; Rybniček, P.; Čermak, P.; Janovský, L. Some aspects of alder decline along the Lužnice River. J. For. Sci. 2005, 51, 381–391. [Google Scholar] [CrossRef]
- Glenz, C.; Schlaepfer, R.; Iorgulescu, I.; Kienast, F. Flooding tolerance of Central European tree and shrub species. For. Ecol. Manag. 2006, 235, 1–13. [Google Scholar] [CrossRef]
- Wang, G.B.; Cao, F.L. Formation and function of aerenchyma in baldcypress (Taxodium distichym (L.) Rich.) and Chinese tallow tree (Sapium sebiferum (L.) Rocb.) under flooding. S. Afr. J. Bot. 2012, 81, 71–78. [Google Scholar] [CrossRef][Green Version]
- Tulik, M.; Rusin, A. Microfibril angle in wood of Scots pine trees (Pinus sylvestris) after Chernobyl accident. Environ. Pollut. 2005, 134, 195–199. [Google Scholar] [CrossRef] [PubMed]
- Tulik, M. The anatomical traits of trunk wood and their relevance to oak (Quercus robur L.) vitality. Eur. J. For. Res. 2014, 133, 845–855. [Google Scholar] [CrossRef]
- Tulik, M.; Bijak, S. Are climatic factors responsible for the process of oak decline in Poland? Dendrochronologia 2016, 38, 18–25. [Google Scholar] [CrossRef]
- Kottek, M.; Grieser, J.; Beck, C.; Rudolf, B.; Rubel, F. World Map of the Köppen-Geiger climate classification updated. Meteorol. Z. 2006, 15, 259–263. [Google Scholar] [CrossRef]
- Gärtner, H.; Schweingruber, F.H. Microscopic Preparation Techniques for Plant Stem Analysis; Kessel Publishing House: Remagen-Oberwinter, Germany, 2013; p. 78. [Google Scholar]
- Haylock, M.R.; Hofstra, N.; Klein Tank, A.M.G.; Klok, E.J.; Jones, P.D.; New, M.A. European daily high-resolution gridded data set of surface temperature and precipitation for 1950–2006. J. Geophys. Res. 2008, 113, D20119. [Google Scholar] [CrossRef]
- Bunn, A.G. A dendrochronology program library in R (dplR). Dendrochronologia 2008, 26, 115–124. [Google Scholar] [CrossRef]
- Bunn, A.G. Statistical and visual crossdating in R using the dplR library. Dendrochronologia 2010, 28, 251–258. [Google Scholar] [CrossRef]
- Cook, E.R.; Kairiūkštis, L.A. Methods of Dendrochronology. Applications in the Environmental Sciences; Kluwer Academic Publishers: Dordrecht, The Netherlands, 1990. [Google Scholar]
- Hammar, Ø.; Harper, D.A.T.; Ryan, P.D. PAST: Paleontological statistics software package for education and data analysis. Palaeontol. Electron. 2001, 4, 1–9. [Google Scholar]
- Bréda, N.; Huc, R.; Granier, A.; Dreyer, E. Temperate forest trees and stands under severe drought: A review of ecophysiological responses, adaptation processes and long-term consequences. Ann. For. Sci. 2006, 63, 625–644. [Google Scholar] [CrossRef]
- Rodríguez-González, P.M.; Campelo, F.; Albuquerque, A.; Rivaes, R.; Ferreira, T.; Pereira, J.S. Sensitivity of black alder (Alnus glutinosa [L.] Gaerth.) growth to hydrological changes in wetland forests at the rear edge of the species distribution. Plant Ecol. 2014, 215, 233–245. [Google Scholar] [CrossRef]
- Worral, J.J.; Adams, G.C.; Tharp, S.C. Summer heat and an epidemic of Cytospora canker of Alnus. Can. J. Plant Pathol. 2010, 32, 376–386. [Google Scholar] [CrossRef]
- Tulik, M.; Marciszewska, K.; Adamczyk, J. Diminished vessel diameter as apossible factor in the decline of European ash (Fraxinus excelsior L.). Ann. For. Sci. 2010, 67, 103–110. [Google Scholar] [CrossRef]
- Sperry, J.S.; Nicholas, K.L.; Sullivan, J.E.M.; Eastlack, S.E. Xylem embolism in ring-porous, diffuse-porous, and coniferous trees of northern Utah and interior Alaska. Ecology 1994, 75, 1736–1752. [Google Scholar] [CrossRef]
- Sperry, J.S.; Meinzer, F.C.; McCulloh, K.A. Safety and efficiency conflicts in hydraulic architecture: Scaling from tissues to trees. Plant Cell Environ. 2008, 31, 632–645. [Google Scholar] [CrossRef]
- Laganis, J.; Peckov, A.; Debeljak, M. Modelling radial growth increment of black alder (Alnus glutinosa [L.] Gaerth.) tree. Ecol. Model. 2008, 215, 180–189. [Google Scholar] [CrossRef]
- Elferts, D.; Dauškane, I.; Ūsele, G.; Treimane, A. Effect of water level and climatic factors on the radial growth of black alder. Proc. Latv. Acad. Sci. Sect. B 2011, 65, 164–169. [Google Scholar]
- Zimmermann, M.H. Xylem Structure and the Ascent of Sap; Springer: New York, NY, USA, 1983. [Google Scholar]
- Copini, P.; Ouden, J.; Robert, E.M.R.; Tardif, J.C.; Loesberg, W.A.; Goudzwaard, L.; Sass-Klaassen, U. Flood-ring formation and root development in response to experimental flooding of young Quercus robur trees. Front. Plant Sci. 2016, 7, 775–788. [Google Scholar] [CrossRef]
- Batzli, J.M.; Dawson, J.O. Physiological and morphological responses of red alder and sitka alder to flooding. Physiol. Plant. 1999, 99, 653–663. [Google Scholar] [CrossRef]
- Ballesteros, J.A.; Stoffel, M.; Bollschweiler, M.; Bodoque, J.M.; Dıez-Herrero, A. Flash-flood impacts cause changes in wood anatomy of Alnus glutinosa, Fraxinus angustifolia and Quercus pyrenaica. Tree Physiol. 2010, 30, 773–778. [Google Scholar] [CrossRef] [PubMed]
- Astrade, L.; Bégin, Y. Tree-ring response of Populus tremula L. and Quercus robur L. to recent spring floods of the Saône River, France. Écoscience 1997, 4, 232–239. [Google Scholar] [CrossRef]
- Strnadova, V.; Černy, K.; Holub, V.; Gregorová, B. The effects of flooding and Phytophthora alni infection on black alder. J. For. Sci. 2010, 56, 41–46. [Google Scholar] [CrossRef]
- Douda, J.; Čejková, A.; Douda, K.; Kochánková, J. Development of alder carr after the abandonment of wet grasslands during the last 70 years. Ann. For. Sci. 2009, 66, 712–725. [Google Scholar] [CrossRef]
- Gholami, V.; Fadaie, F.; Torkaman, J.; Ghaffari, A. Modeling of groundwater level fluctuations using dendrochronology in alluvial aquifers. J. Hydrol. 2015, 529, 1060–1069. [Google Scholar] [CrossRef]
- Vacek, Z.; Vacek, S.; Podrázský, V.; Král, J.; Bulušek, D.; Putalová, T.; Baláš, M.; Kalousková, I.; Schwarz, O. Structural diversity and production of alder stands on former agricultural land at high altitudes. Dendrobiology 2016, 75, 31–44. [Google Scholar] [CrossRef]
- Schmitz, N.; Verheyden, A.; Beckman, H.; Kairo, J.G.; Koedam, N. Influence of a salinity gradient on the vessel characters of the mangrove species Rhizophora mucronata. Ann. Bot. 2006, 98, 1321–1330. [Google Scholar] [CrossRef]
- Redondo, M.; Boberg, J.; Olsson, C.; Oliva, J. Winter Conditions Correlate with Phytophthora alni Subspecies Distribution in Southern Sweden. Phytopathology 2015. [Google Scholar] [CrossRef]


| TRW | VD | |||||
|---|---|---|---|---|---|---|
| H | W | D | H | W | D | |
| H | 68% | 71% | 53% | 58% | ||
| W | 0.680 * | 80% | 0.628 * | 55% | ||
| D | 0.220 | 0.713 * | 0.250 | 0.441 * | ||
| CP | 10 | 5 | 3 | ||
|---|---|---|---|---|---|
| TRW | H | 2.27 (1.0) | 2.43 (0.8) | 2.05 (0.9) | 1.44 (0.5) |
| W | 2.02 (0.8) | 1.90 (0.6) | 1.79 (0.8) | 1.45 (0.9) | |
| D | 2.35 (0.8) | 2.51 (0.6) | 2.42 (0.8) | 2.06 (0.8) | |
| F (p) | 3.08 (0.214) | 3.35 (0.101) | 3.88 (0.512) | 5.14 (0.544) | |
| VD | H | 56.1 (8.8) | 59.5 (3.1) | 61.4 (2.7) | 60.5 (3.3) |
| W | 52.1 (7.5) | 54.5 (4.0) | 54.6 (5.2) | 52.8 (6.0) | |
| D | 54.0 (5.8) | 54.7 (3.2) | 56.8 (1.3) | 57.3 (1.4) | |
| F (p) | 3.08 (0.069) | 3.35 (0.005) * | 3.88 (0.027) * | 5.14 (0.141) |
| I | II | III | IV | V | VI | VII | VIII | IX | X | XI | XII | I-XII | VP | hCA | |
|---|---|---|---|---|---|---|---|---|---|---|---|---|---|---|---|
| highest monthly groundwater level | |||||||||||||||
| H | 0.039 | 0.272 | −0.256 | −0.387 | −0.368 | −0.030 | 0.281 | −0.380 | −0.329 | −0.467 | −0.424 | −0.295 | −0.443 | −0.294 | −0.308 |
| W | 0.118 | 0.335 | −0.176 | −0.445 | −0.420 | 0.041 | 0.222 | −0.415 | −0.281 | −0.399 | −0.355 | −0.286 | −0.579 * | −0.441 | −0.457 |
| D | 0.056 | 0.273 | −0.399 | −0.604 * | −0.635 * | −0.056 | 0.111 | −0.619 * | −0.439 | −0.593 * | −0.606 * | −0.452 | −0.739 * | −0.655 * | −0.625 * |
| lowest monthly groundwater level | |||||||||||||||
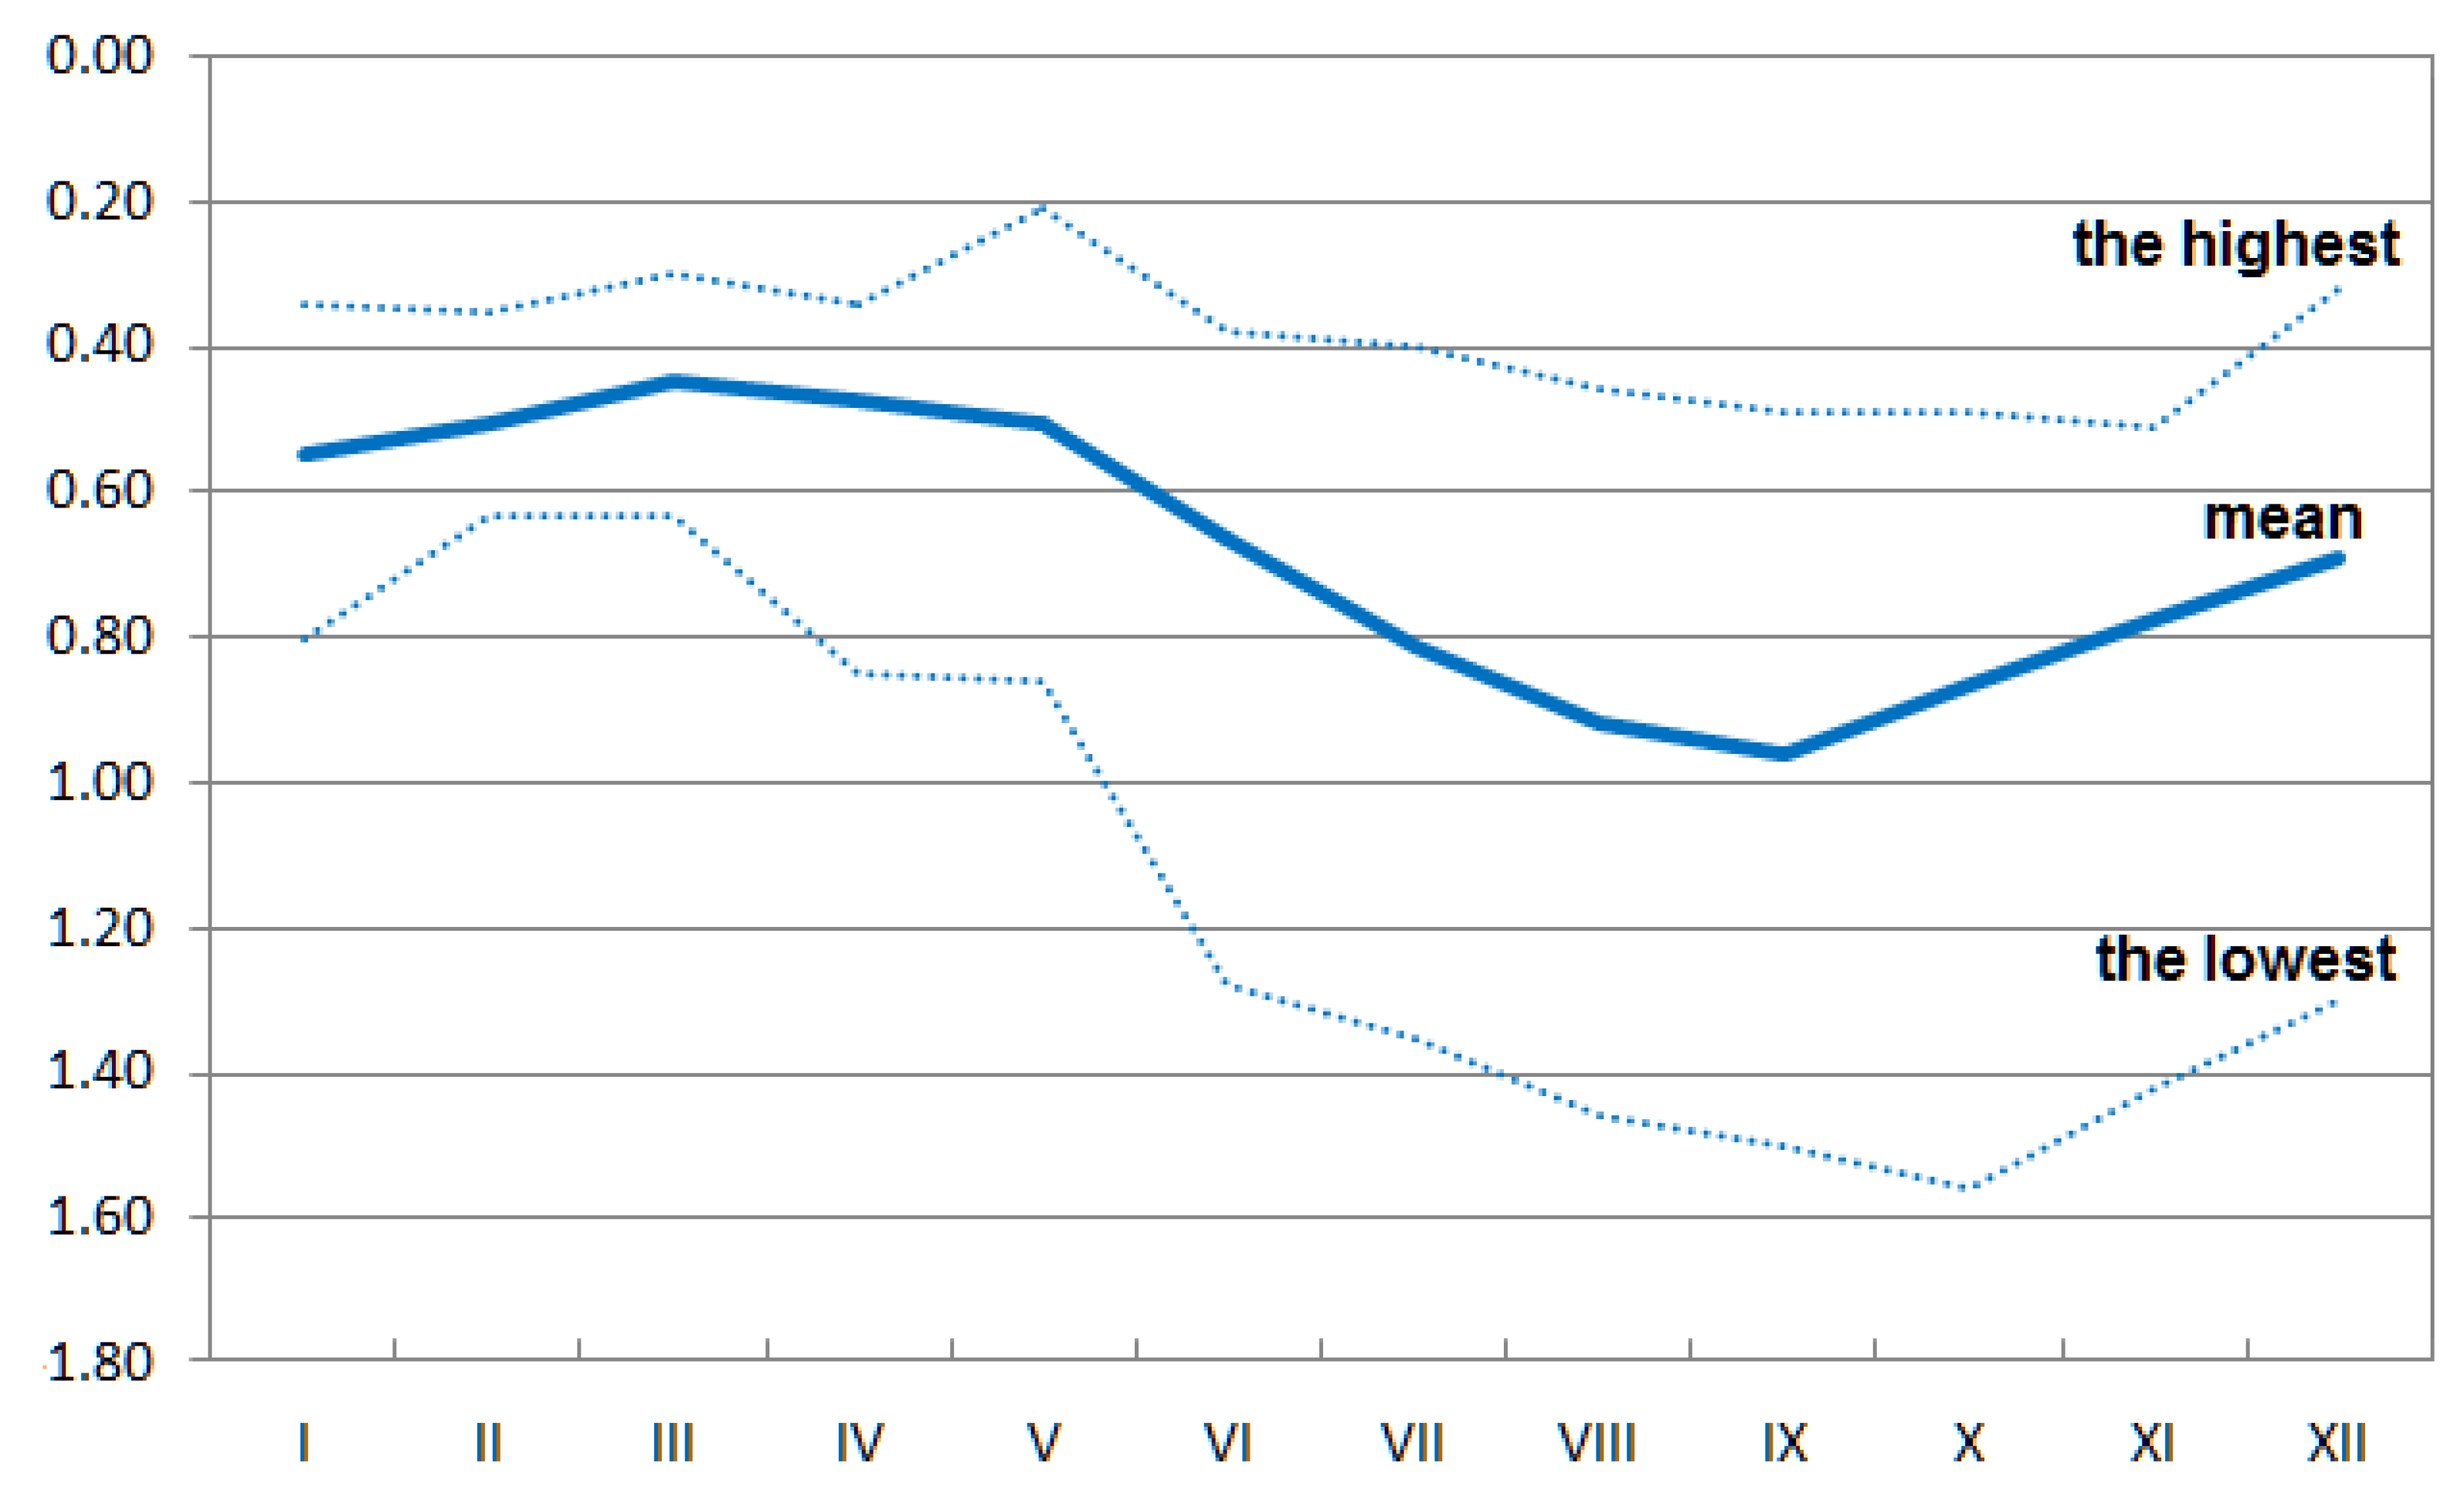
| H | −0.204 | 0.259 | −0.271 | −0.453 | −0.305 | −0.313 | 0.171 | −0.352 | −0.357 | −0.367 | −0.408 | −0.260 | 0.054 | 0.201 | 0.214 |
| W | −0.081 | 0.344 | −0.294 | −0.486 * | −0.442 | −0.299 | 0.075 | −0.414 | −0.288 | −0.285 | −0.376 | −0.475 | −0.012 | 0.087 | 0.168 |
| D | −0.014 | 0.252 | −0.435 | −0.682 * | −0.615 * | −0.394 | −0.089 | −0.650 * | −0.465 | −0.457 | −0.602 * | −0.471 | −0.112 | 0.060 | 0.135 |
| mean monthly groundwater level | |||||||||||||||
| H | −0.082 | 0.288 | −0.270 | −0.422 | −0.369 | −0.156 | 0.243 | −0.368 | −0.345 | −0.428 | −0.425 | −0.301 | −0.018 | 0.097 | 0.004 |
| W | 0.023 | 0.368 | −0.238 | −0.468 | −0.464 | −0.106 | 0.163 | −0.418 | −0.286 | −0.352 | −0.372 | −0.409 | −0.061 | 0.023 | −0.034 |
| D | 0.024 | 0.277 | −0.428 | −0.645 * | −0.638 * | −0.207 | 0.021 | −0.640 * | −0.455 | −0.539 * | −0.610 * | −0.498 | −0.155 | −0.088 | −0.181 |
| amplitude | |||||||||||||||
| H | 0.404 | 0.000 | −0.032 | 0.101 | −0.162 | 0.313 | 0.232 | 0.004 | 0.052 | −0.361 | −0.226 | −0.064 | 0.159 | 0.291 | 0.363 |
| W | 0.342 | −0.032 | 0.189 | −0.010 | −0.073 | 0.411 | 0.266 | 0.123 | −0.024 | −0.374 | −0.114 | 0.221 | 0.125 | 0.221 | 0.381 |
| D | 0.117 | 0.018 | −0.009 | 0.053 | 0.007 | 0.240 | 0.303 | 0.342 | 0.031 | −0.478 | −0.270 | −0.003 | 0.063 | 0.260 | 0.402 |
| I | II | III | IV | V | VI | VII | VIII | IX | X | XI | XII | I-XII | VP | hCA | |
|---|---|---|---|---|---|---|---|---|---|---|---|---|---|---|---|
| highest monthly groundwater level | |||||||||||||||
| H | −0.047 | 0.154 | −0.187 | −0.482 * | −0.364 | 0.181 | 0.359 | −0.430 | 0.070 | −0.062 | −0.082 | −0.063 | −0.495 * | −0.372 | −0.270 |
| W | −0.033 | 0.215 | 0.076 | −0.284 | −0.435 | −0.053 | 0.213 | −0.303 | −0.208 | −0.225 | −0.184 | −0.162 | −0.563 * | −0.407 | −0.446 |
| D | 0.112 | 0.002 | −0.381 | −0.468 | −0.154 | 0.650 * | 0.660 * | −0.491 | 0.390 | 0.218 | 0.026 | −0.243 | −0.333 | −0.256 | −0.004 |
| lowest monthly groundwater level | |||||||||||||||
| H | −0.227 | 0.223 | −0.319 | −0.560 * | −0.363 | −0.032 | 0.223 | −0.471 | 0.029 | 0.008 | −0.216 | −0.291 | 0.199 | 0.284 | 0.304 |
| W | −0.163 | 0.337 | −0.054 | −0.361 | −0.394 | −0.284 | 0.082 | −0.324 | −0.195 | −0.146 | −0.279 | −0.339 | −0.011 | 0.064 | 0.104 |
| D | −0.180 | −0.184 | −0.483 | −0.513 * | −0.318 | 0.290 | 0.442 | −0.474 | 0.325 | 0.220 | −0.233 | −0.553 * | 0.638 * | 0.682 * | 0.648 * |
| mean monthly groundwater level | |||||||||||||||
| H | −0.140 | 0.206 | −0.256 | −0.524 * | −0.382 | 0.098 | 0.313 | −0.455 | 0.051 | −0.029 | −0.144 | −0.188 | 0.074 | 0.222 | 0.169 |
| W | −0.099 | 0.301 | 0.015 | −0.323 | −0.447 | −0.158 | 0.161 | −0.316 | −0.203 | −0.191 | −0.225 | −0.269 | −0.063 | 0.035 | −0.064 |
| D | −0.029 | −0.098 | −0.441 | −0.493 | −0.240 | 0.567 * | 0.592 * | −0.486 | 0.360 | 0.223 | −0.090 | −0.426 | 0.608 * | 0.595 * | 0.573 * |
| amplitude | |||||||||||||||
| H | 0.291 | −0.100 | 0.212 | 0.112 | −0.088 | 0.329 | 0.290 | 0.296 | 0.172 | −0.180 | 0.253 | 0.287 | 0.320 | 0.399 | 0.441 |
| W | 0.209 | −0.174 | 0.274 | 0.180 | −0.152 | 0.242 | 0.243 | 0.177 | −0.089 | −0.244 | 0.122 | 0.215 | 0.122 | 0.188 | 0.309 |
| D | 0.466 | 0.291 | 0.130 | −0.017 | 0.332 | 0.585 * | 0.481 | 0.104 | 0.356 | 0.053 | 0.586 * | 0.384 | 0.730 * | 0.764 * | 0.646 * |
© 2020 by the authors. Licensee MDPI, Basel, Switzerland. This article is an open access article distributed under the terms and conditions of the Creative Commons Attribution (CC BY) license (http://creativecommons.org/licenses/by/4.0/).
Share and Cite
Tulik, M.; Grochowina, A.; Jura-Morawiec, J.; Bijak, S. Groundwater Level Fluctuations Affect the Mortality of Black Alder (Alnus glutinosa Gaertn.). Forests 2020, 11, 134. https://doi.org/10.3390/f11020134
Tulik M, Grochowina A, Jura-Morawiec J, Bijak S. Groundwater Level Fluctuations Affect the Mortality of Black Alder (Alnus glutinosa Gaertn.). Forests. 2020; 11(2):134. https://doi.org/10.3390/f11020134
Chicago/Turabian StyleTulik, Mirela, Adam Grochowina, Joanna Jura-Morawiec, and Szymon Bijak. 2020. "Groundwater Level Fluctuations Affect the Mortality of Black Alder (Alnus glutinosa Gaertn.)" Forests 11, no. 2: 134. https://doi.org/10.3390/f11020134
APA StyleTulik, M., Grochowina, A., Jura-Morawiec, J., & Bijak, S. (2020). Groundwater Level Fluctuations Affect the Mortality of Black Alder (Alnus glutinosa Gaertn.). Forests, 11(2), 134. https://doi.org/10.3390/f11020134