Photosynthetic and Morphological Acclimation to High and Low Light Environments in Petasites japonicus subsp. giganteus


Abstract
1. Introduction
2. Materials and Methods
2.1. Study Species
2.2. Study Site and Sampling
2.3. Measurement of PPFD
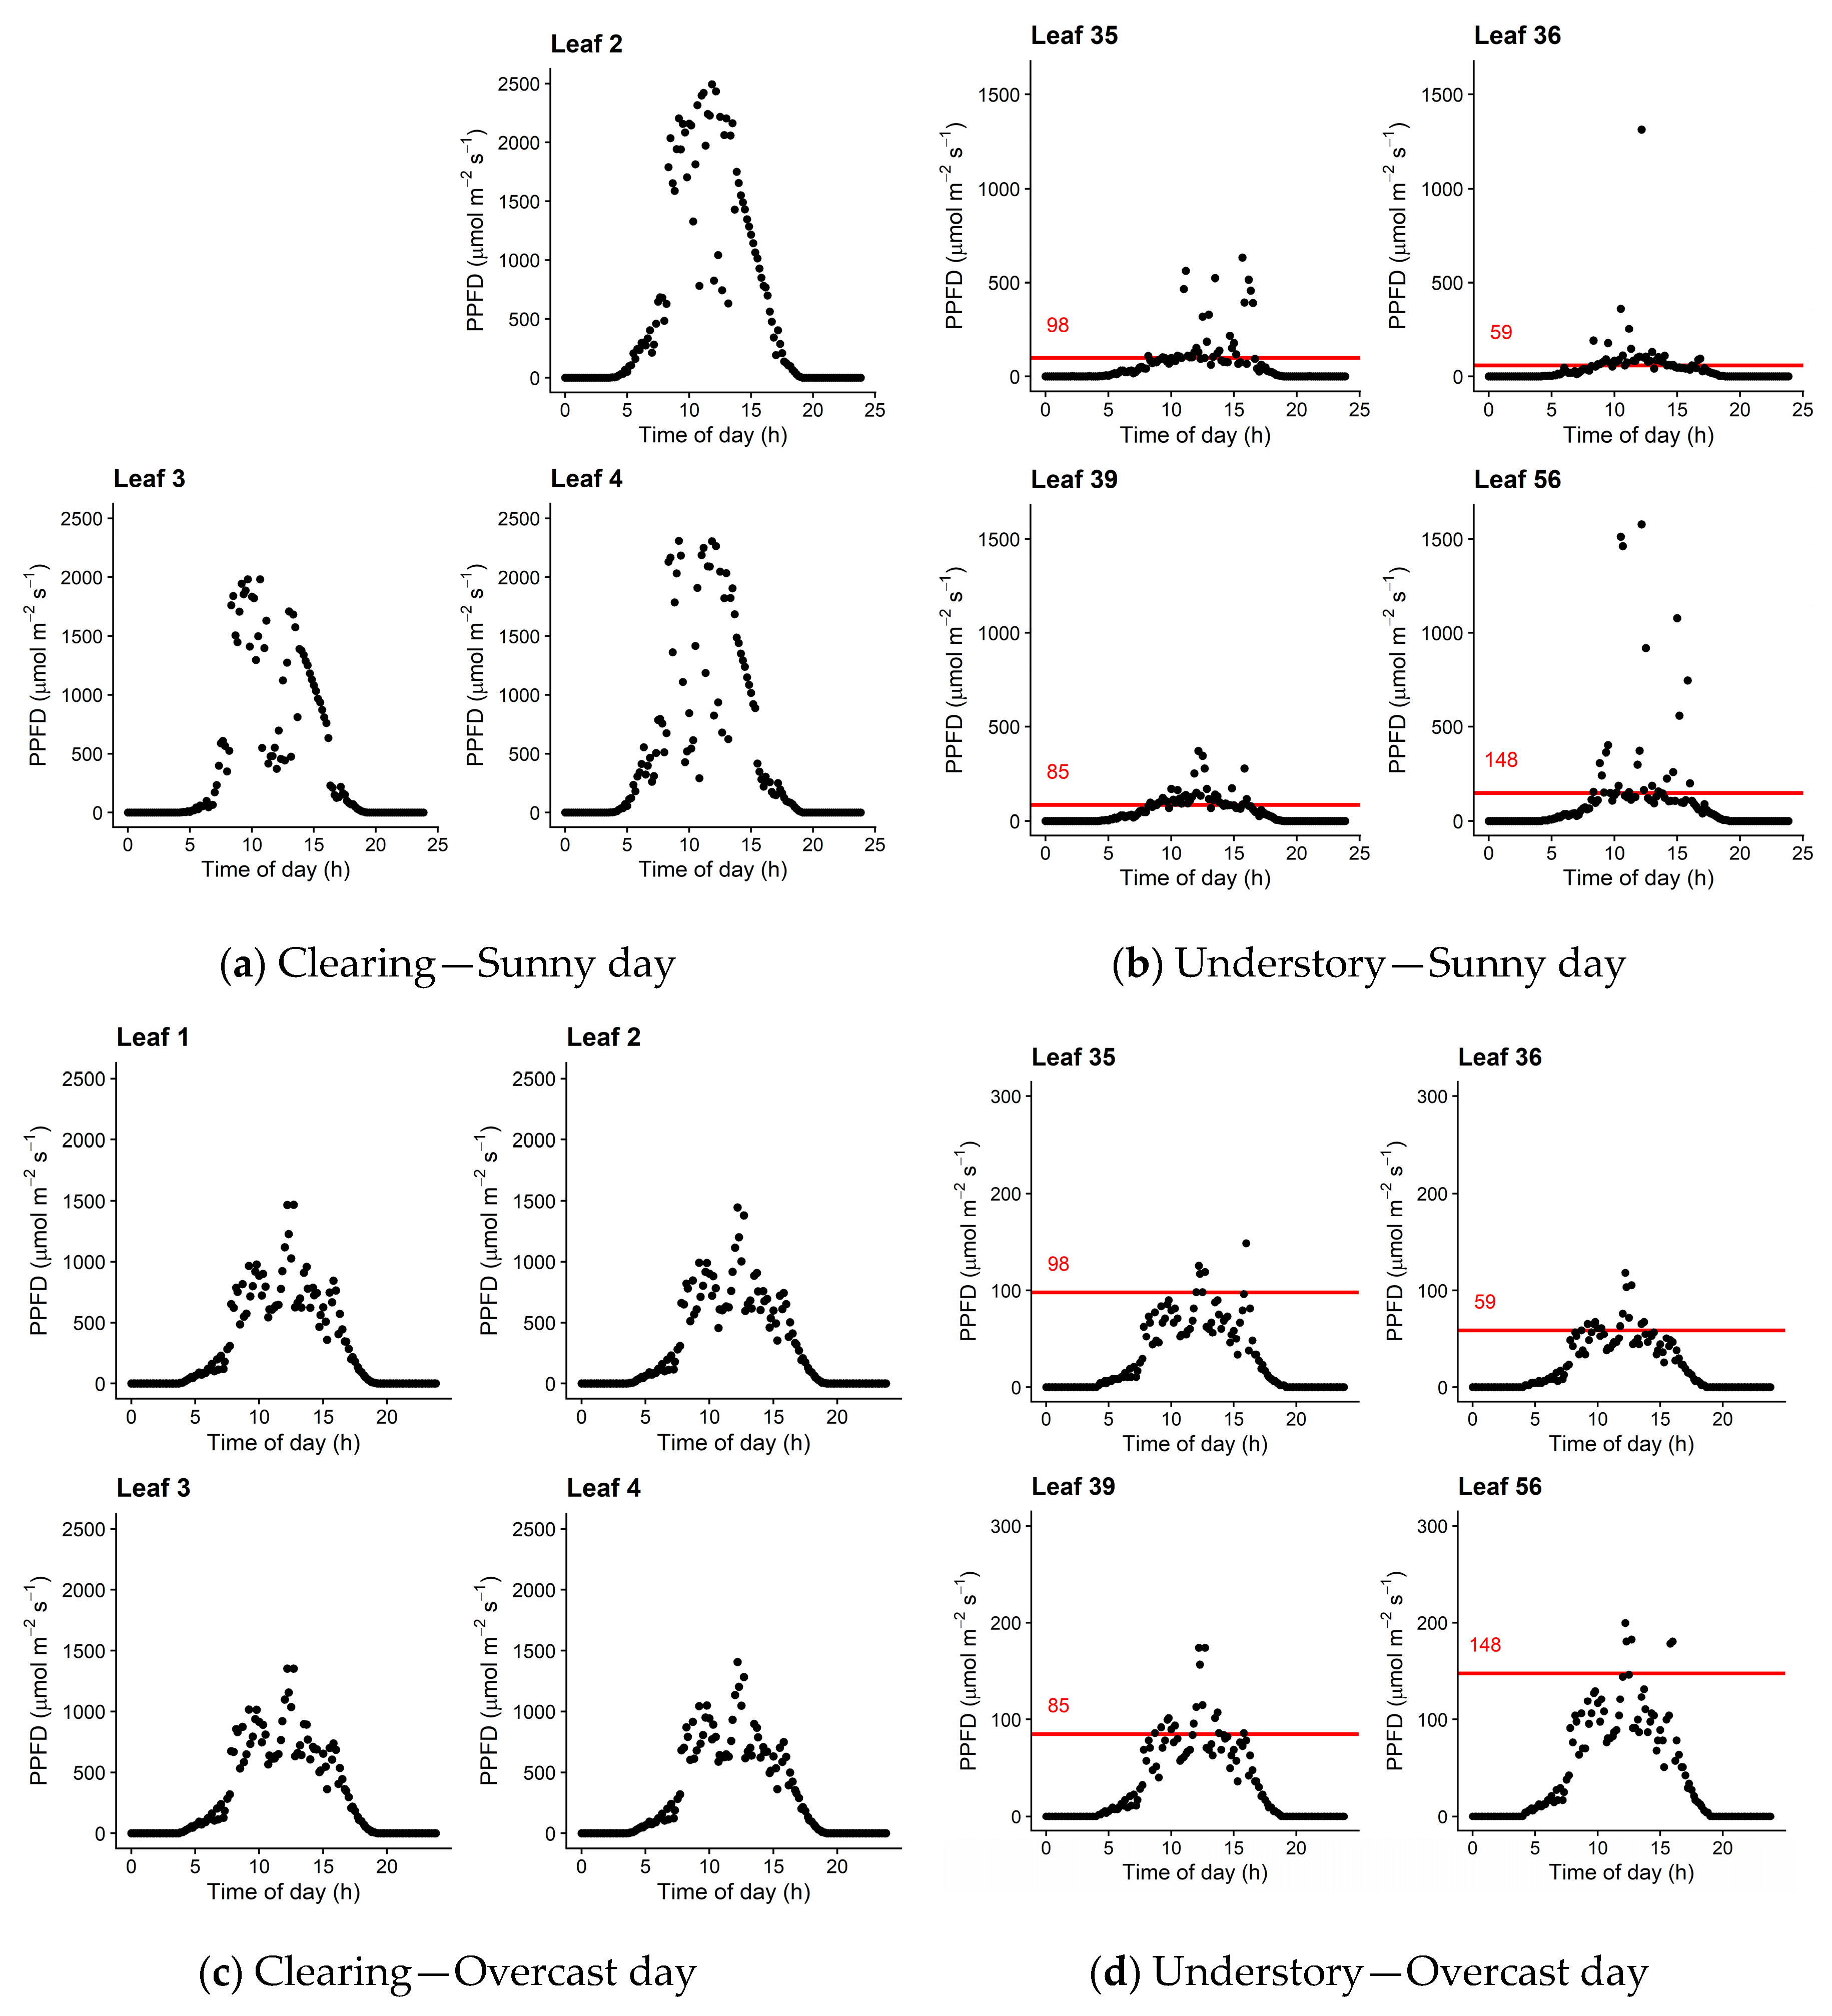
2.3.1. Diurnal Course of Incident PPFD on the Leaves
2.3.2. Instantaneous Measurement of rPPFD
2.4. Leaf Thickness and LMA
2.5. Calculation of Daily Photosynthesis
2.6. Simulation 1: Exchanged Leaves
2.7. Simulation 2: Understory without Sunflecks
2.8. Statistical Analysis
3. Results
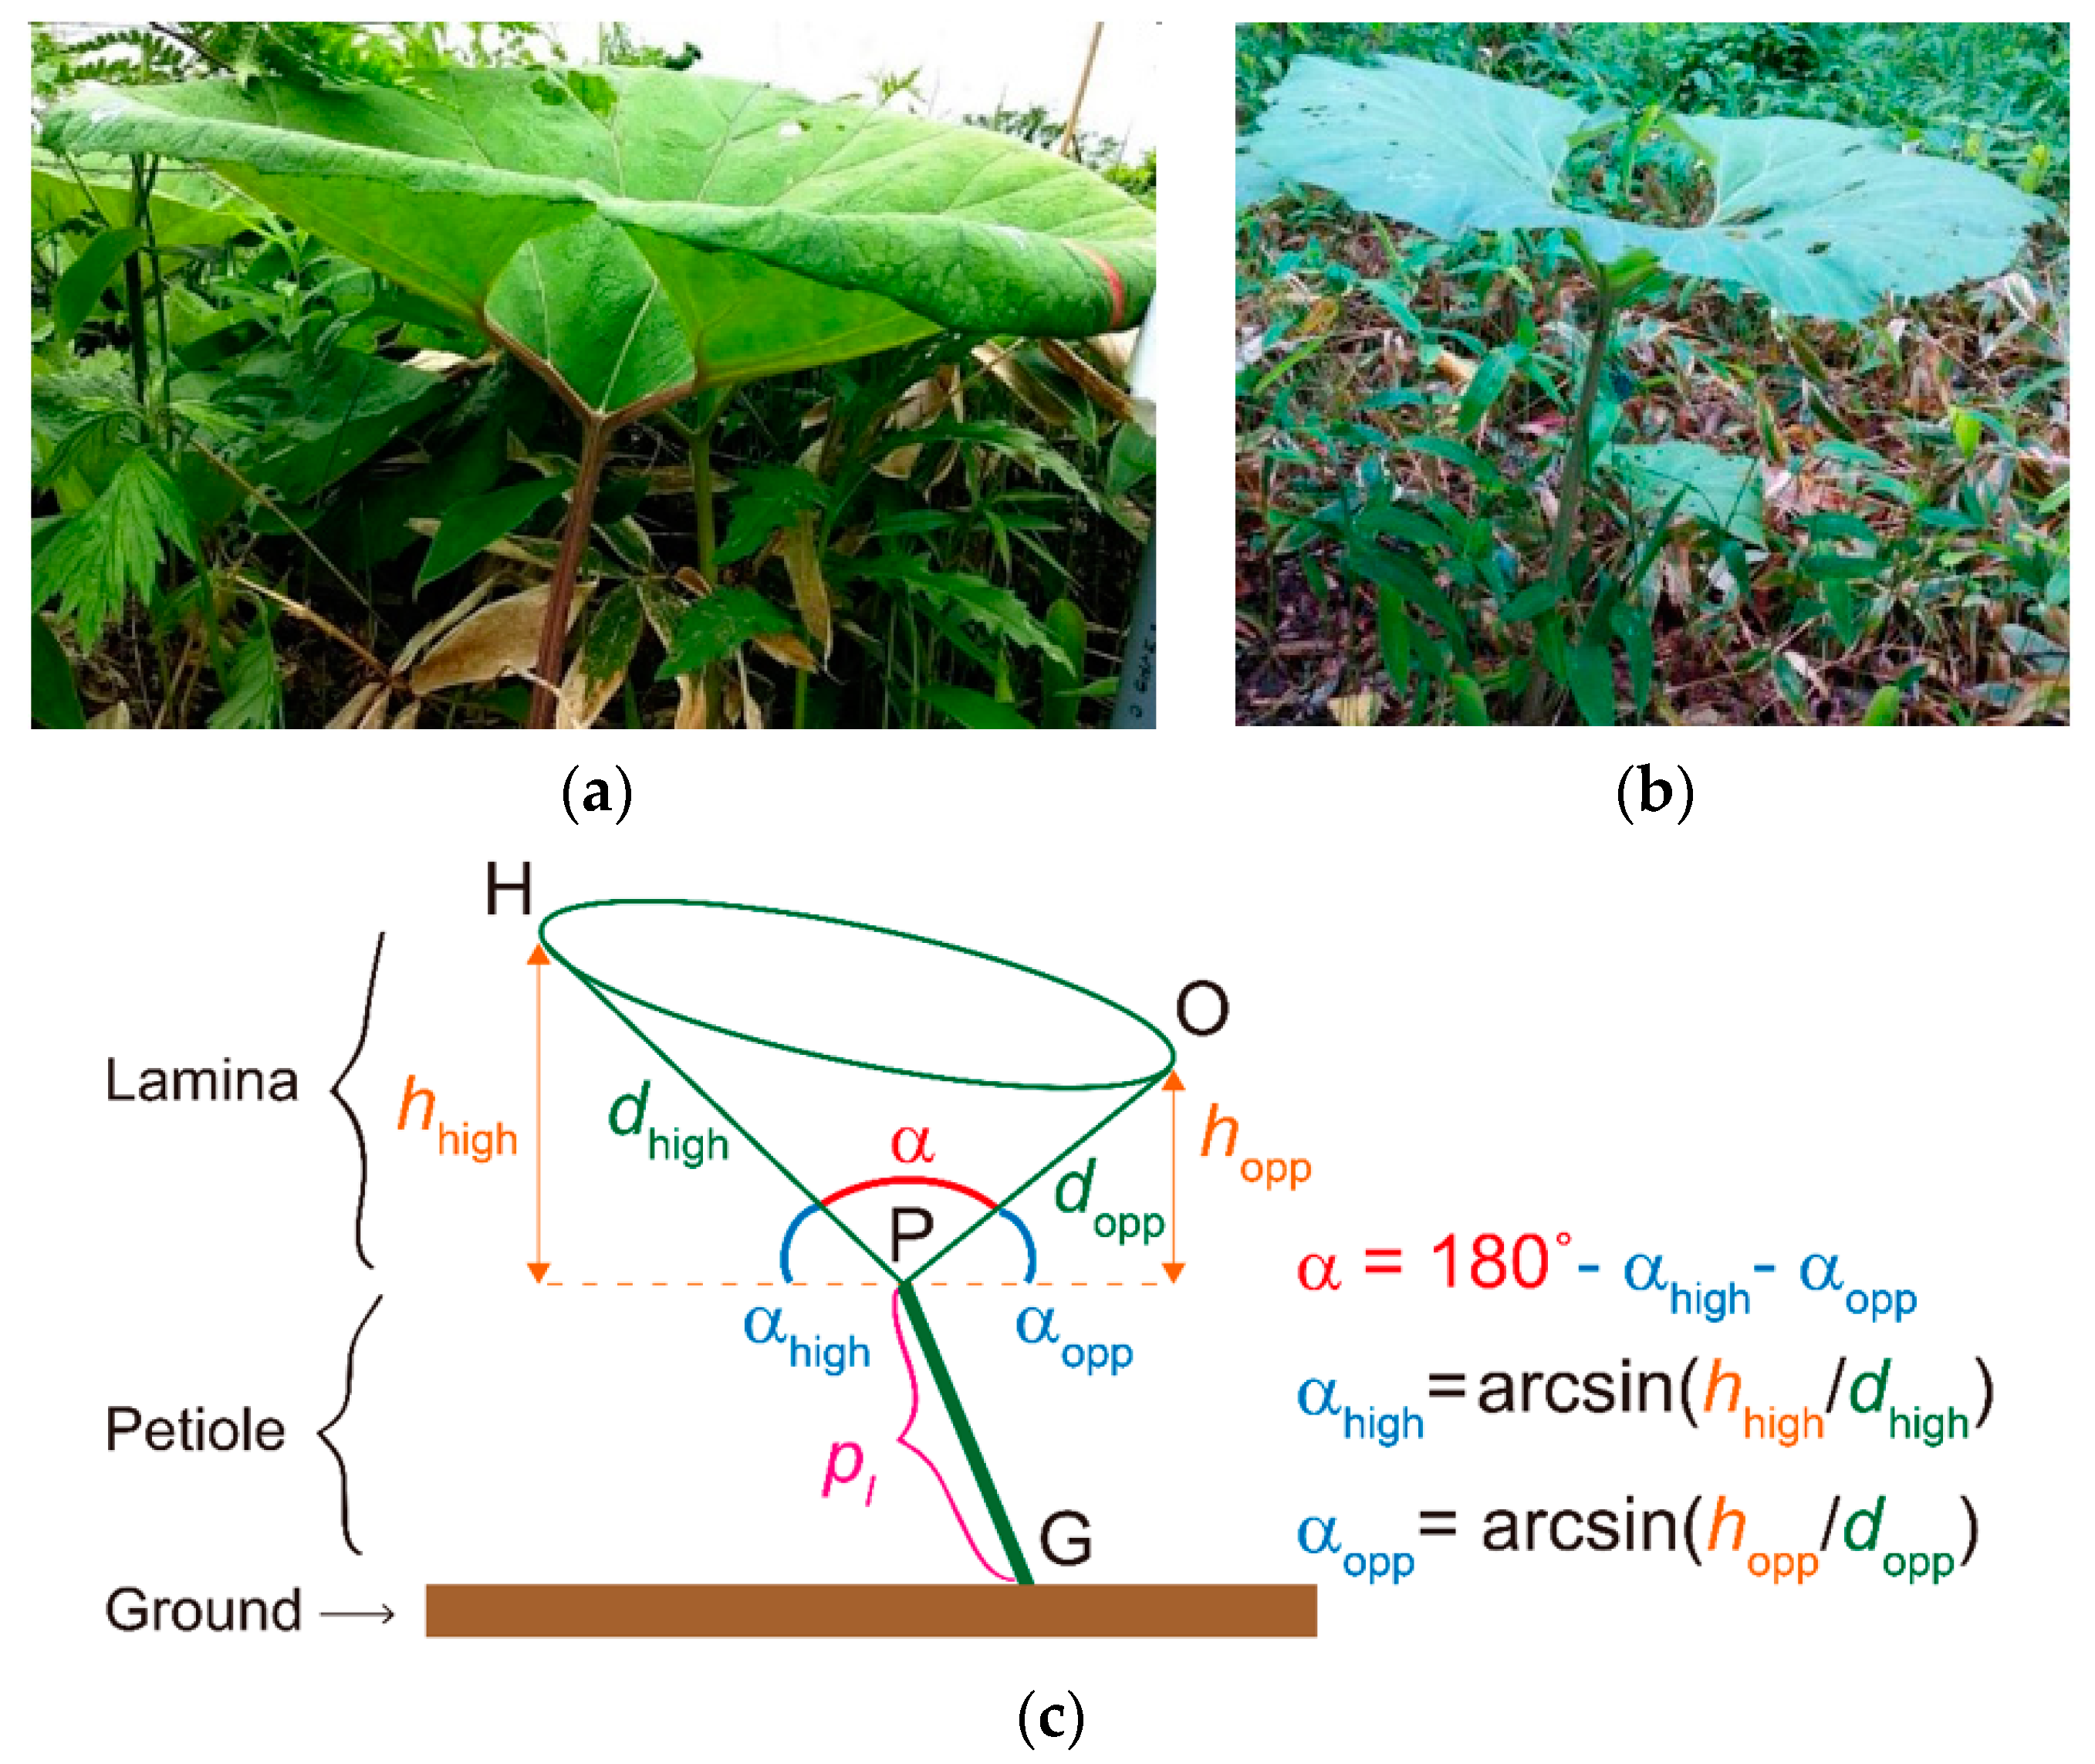
3.1. Leaf Shape
3.2. Area-Based Photosynthetic Traits
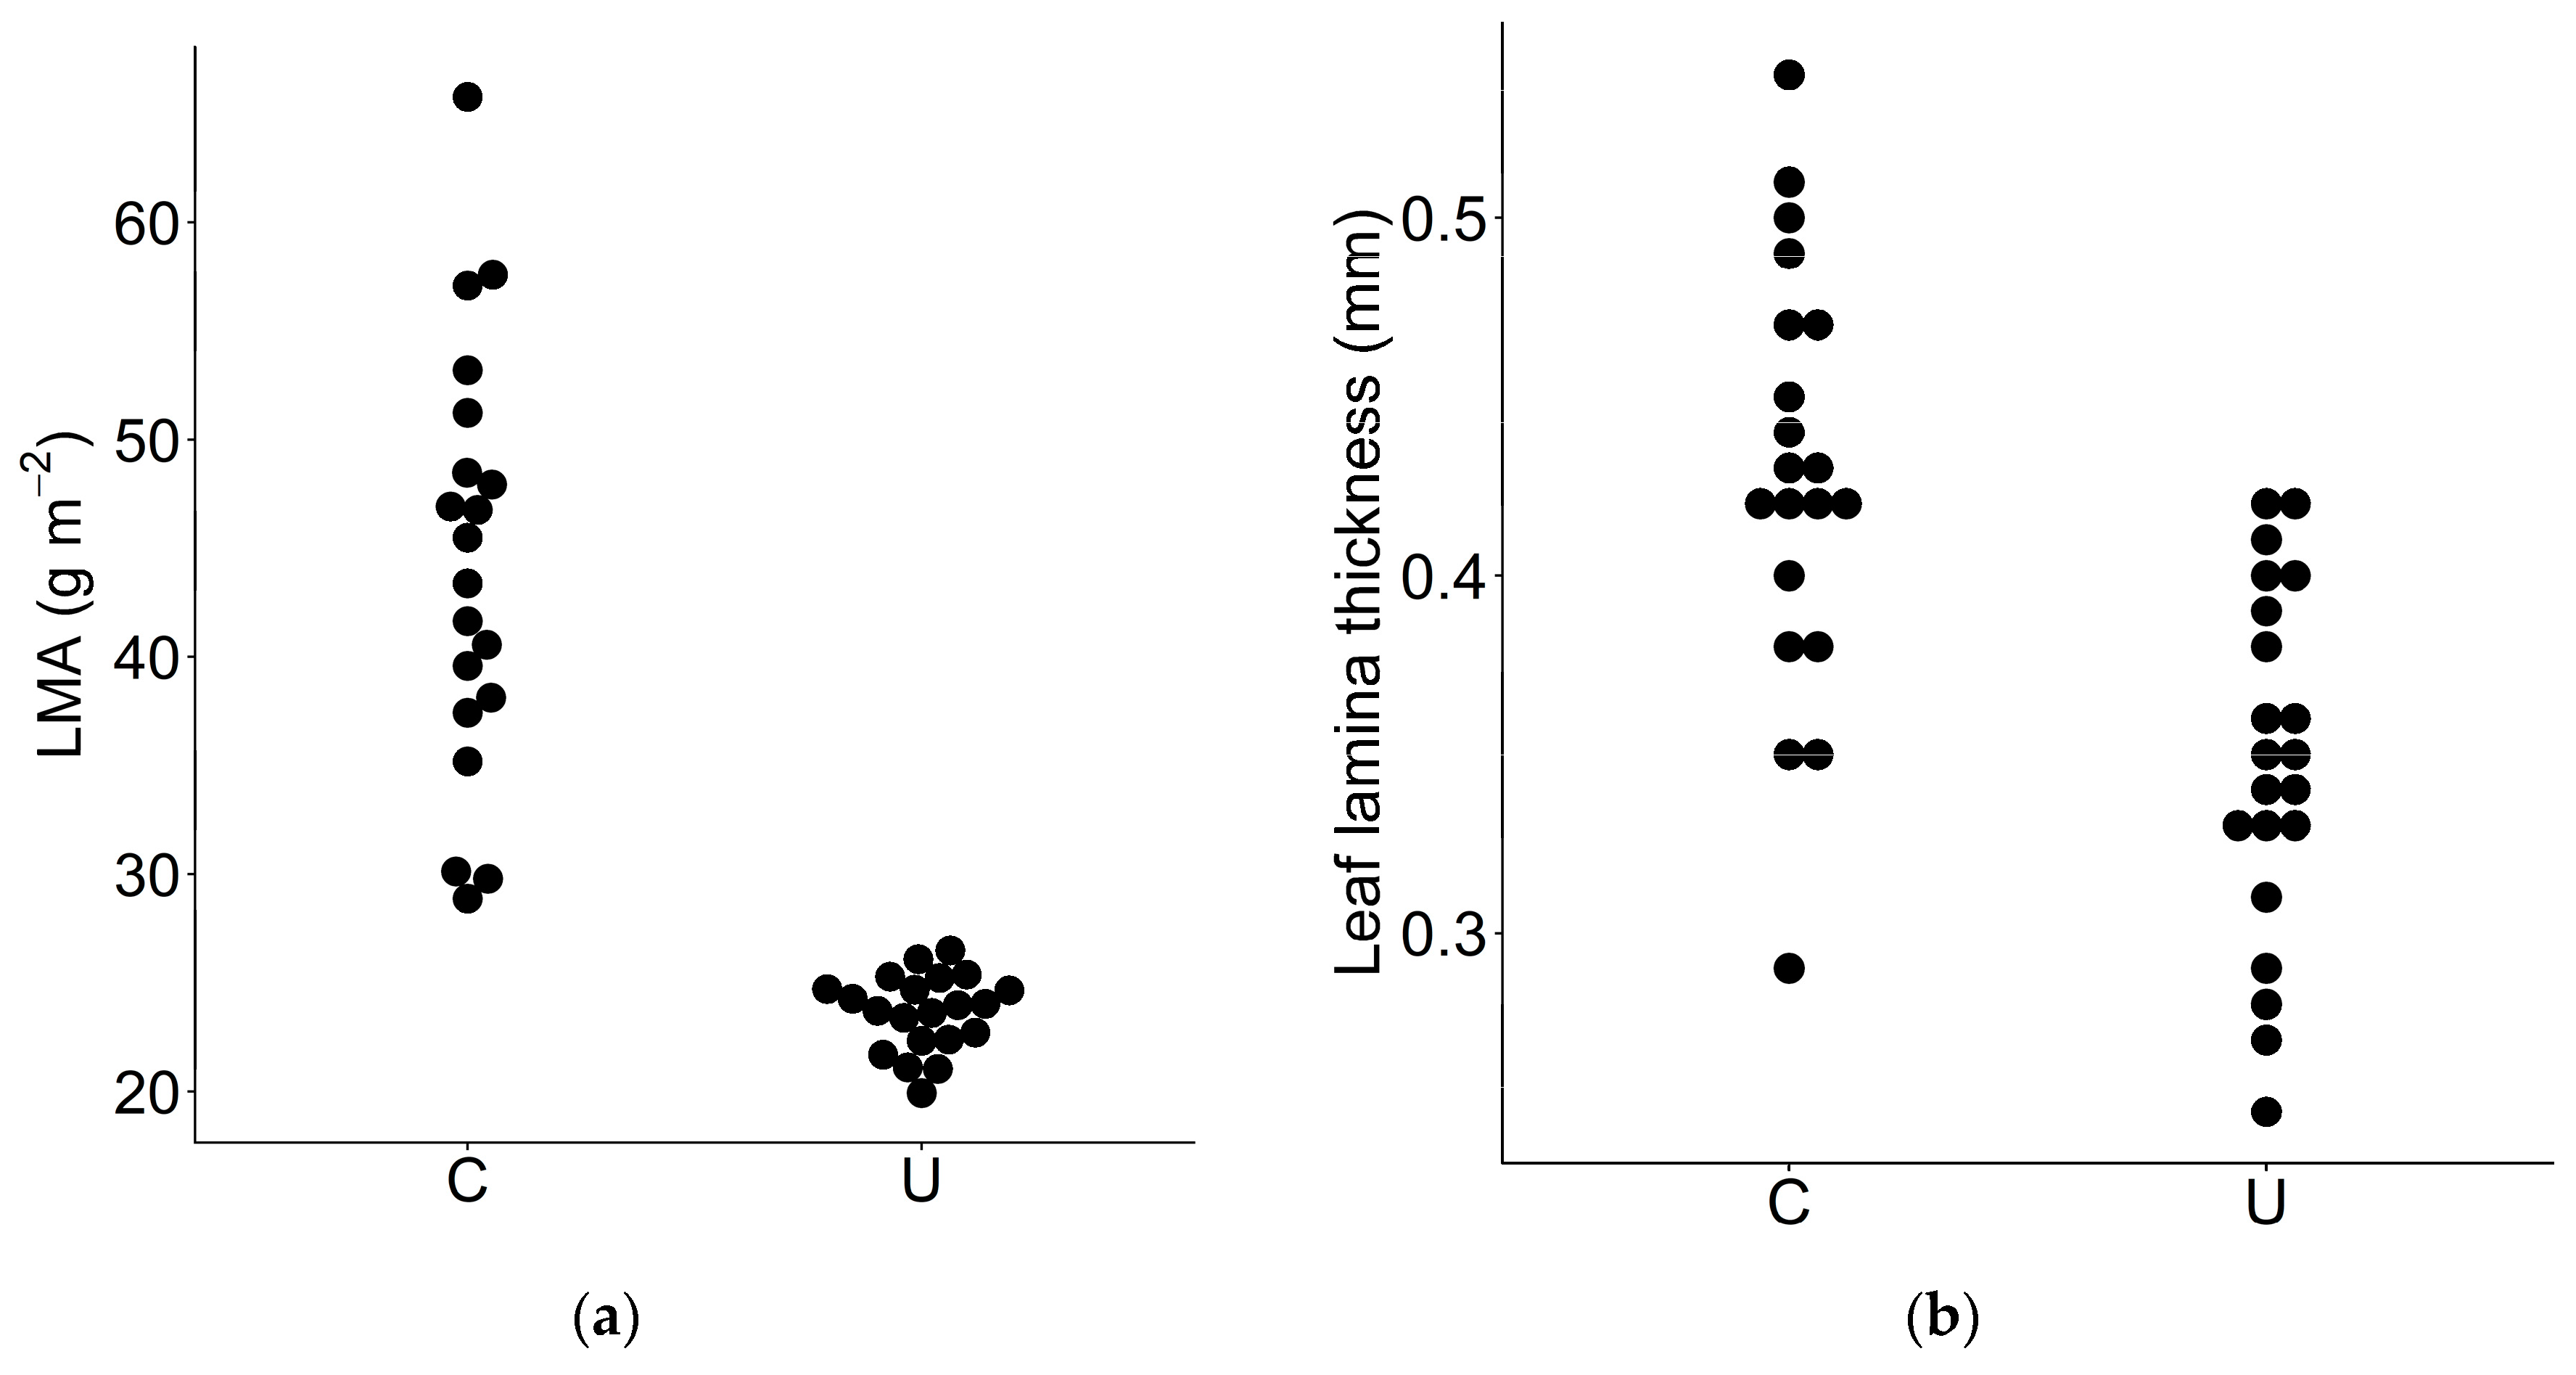
3.3. LMA and Leaf Thickness
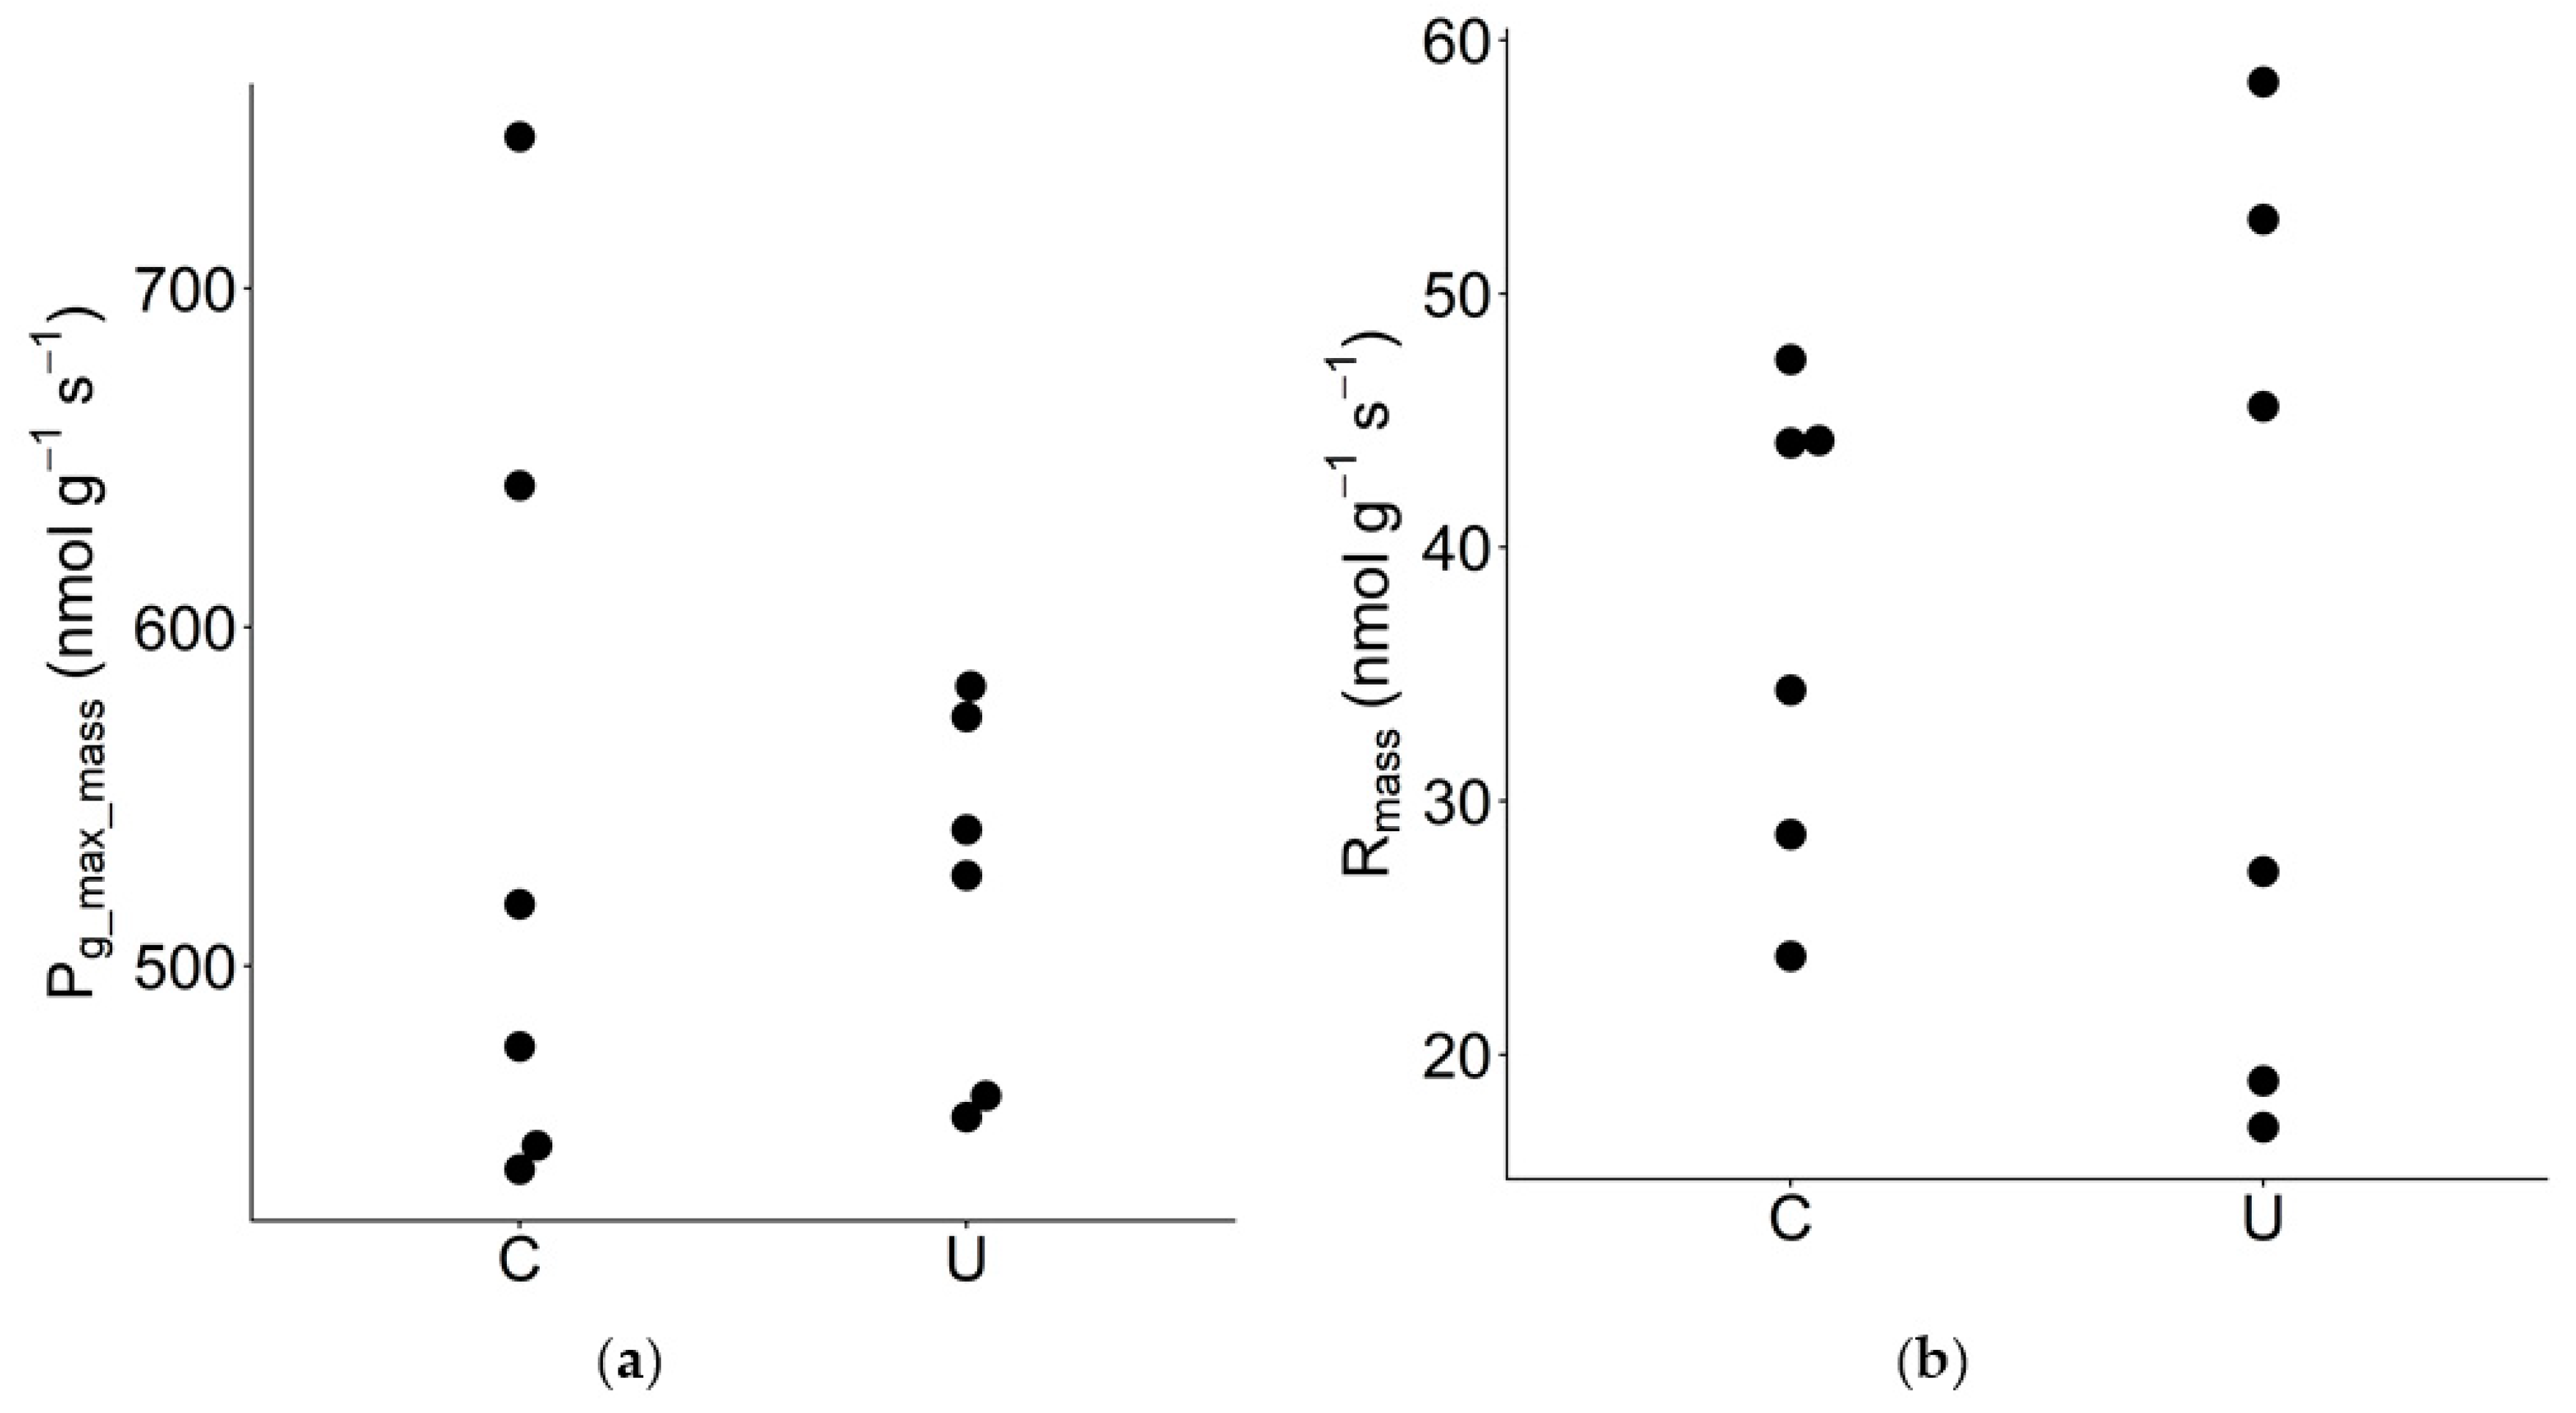
3.4. Mass-Based Photosynthetic Traits
3.5. Diurnal Courses of PPFD
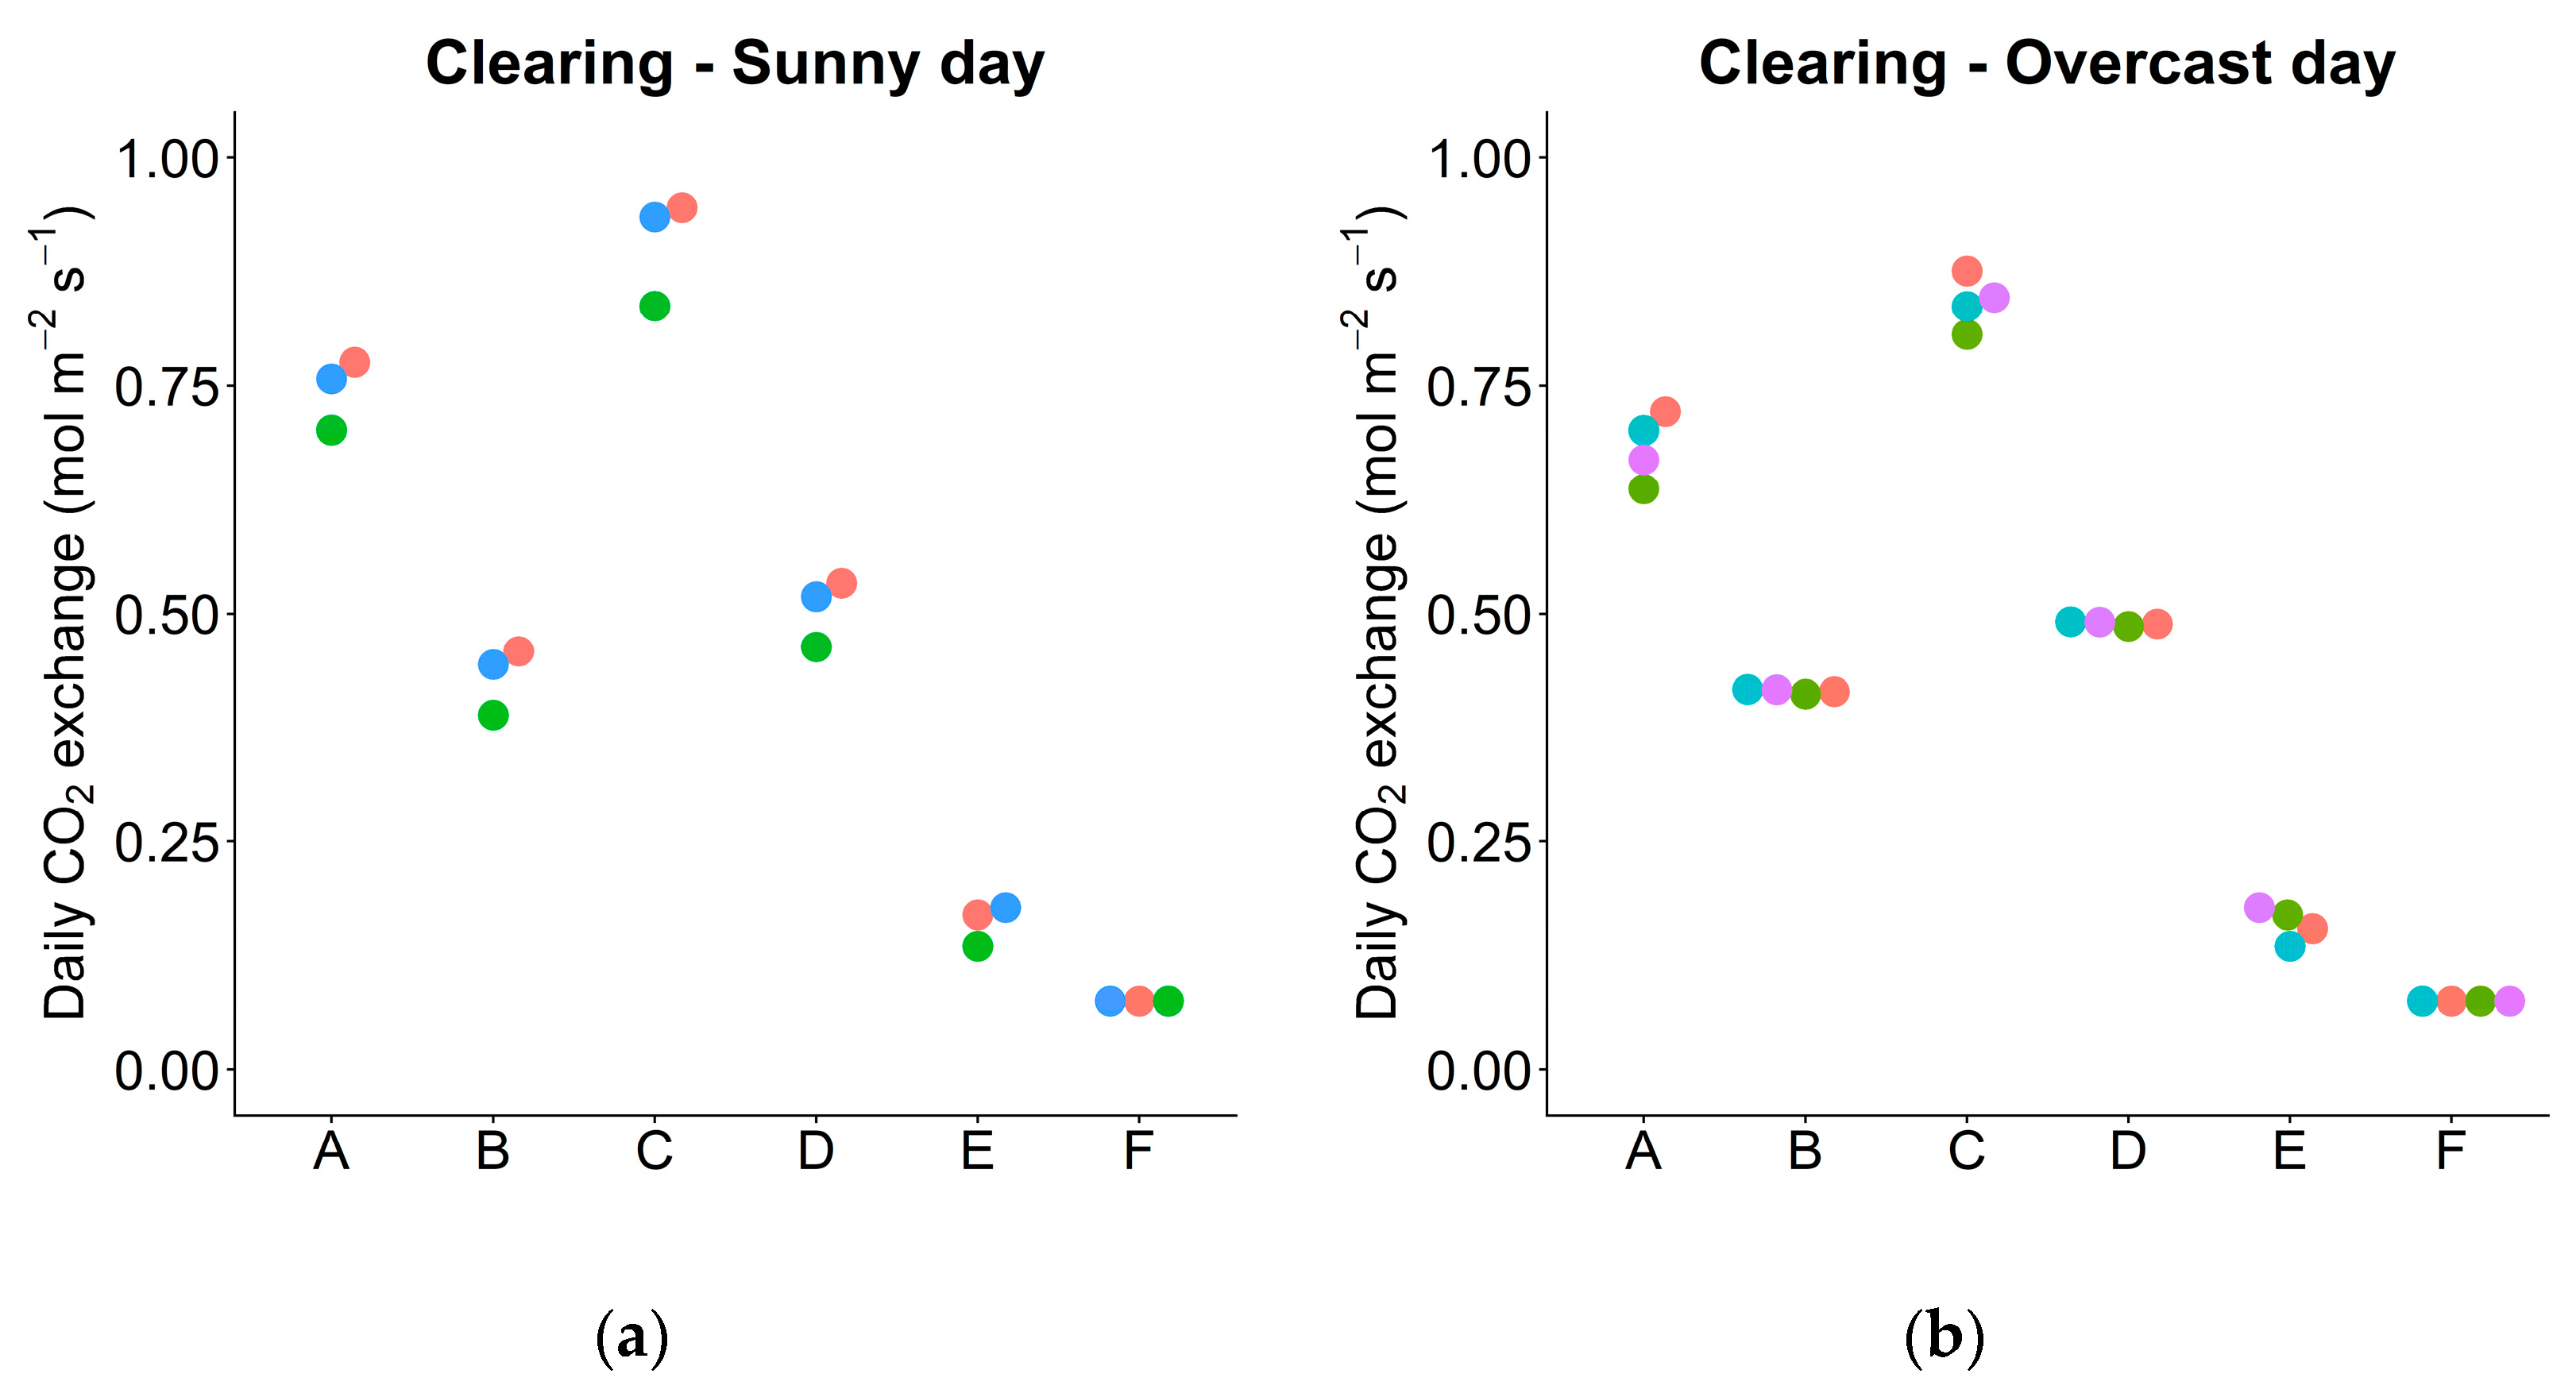
3.6. Daily Carbon Gain under Actual and Simulated Conditions
3.7. Simulation: Understory without Sunflecks
4. Discussion
4.1. Carbon Gain or Saving via Acclimation
4.2. Morphological Acclimation
5. Conclusions
Supplementary Materials
Author Contributions
Funding
Acknowledgments
Conflicts of Interest
Data Availability Statement
References
- Walters, M.B.; Field, C.B. Photosynthetic light acclimation in two rainforest Piper species with different ecological amplitudes. Oecologia 1987, 72, 449–456. [Google Scholar] [CrossRef]
- Ellsworth, D.S.; Reich, P.B. Leaf mass per area, nitrogen content and photosynthetic carbon gain in Acer saccharum seedlings in contrasting forest light environments. Funct. Ecol. 1992, 6, 423–435. [Google Scholar] [CrossRef]
- Noda, H.; Muraoka, H.; Washitani, I. Morphological and physiological acclimation responses to contrasting light and water regimes in Primula sieboldii. Ecol. Res. 2004, 19, 331–340. [Google Scholar] [CrossRef]
- Muraoka, H.; Tang, Y.; Koizumi, H.; Washitani, I. Combined effects of light and water availability on photosynthesis and growth of Arisaema heterophyllum in the forest understory and an open site. Oecologia 1997, 112, 26–34. [Google Scholar] [CrossRef]
- Gruntman, M.; Segev, U.; Tielbörger, K.; Gange, A. Shade-induced plasticity in invasive Impatiens glandulifera populations. Weed Res. 2019, 60, 16–25. [Google Scholar] [CrossRef]
- Muraoka, H.; Tang, Y.H.; Koizumi, H.; Washitani, I. Effects of light and soil water availability on leaf photosynthesis and growth of Arisaema heterophyllum, a riparian forest understorey plant. J. Plant Res. 2002, 115, 419–427. [Google Scholar] [CrossRef] [PubMed]
- Wang, A.-Y.; Hao, G.-Y.; Guo, J.-J.; Liu, Z.-H.; Zhang, J.-L.; Cao, K.-F. Differentiation in leaf physiological traits related to shade and drought tolerance underlies contrasting adaptations of two Cyclobalanopsis (Fagaceae) species at the seedling stage. Forests 2020, 11, 844. [Google Scholar] [CrossRef]
- Valladares, F.; Wright, S.J.; Lasso, E.; Kitajima, K.; Pearcy, R.W. Plastic phenotypic response to light of 16 congeneric shrubs from a panamanian rainforest. Ecology 2000, 81, 1925–1936. [Google Scholar] [CrossRef]
- Niu, K.; Zhang, S.; Lechowicz, M.J.; Perez Carmona, C. Harsh environmental regimes increase the functional significance of intraspecific variation in plant communities. Funct. Ecol. 2020, 34, 1666–1677. [Google Scholar] [CrossRef]
- Niu, K.; He, J.-S.; Lechowicz, M.J.; Souza, L. Grazing-induced shifts in community functional composition and soil nutrient availability in Tibetan alpine meadows. J. Appl. Ecol. 2016, 53, 1554–1564. [Google Scholar] [CrossRef]
- Volf, M.; Redmond, C.; Albert, A.J.; Le Bagousse-Pinguet, Y.; Biella, P.; Gotzenberger, L.; Hrazsky, Z.; Janecek, S.; Klimesova, J.; Leps, J.; et al. Effects of long- and short-term management on the functional structure of meadows through species turnover and intraspecific trait variability. Oecologia 2016, 180, 941–950. [Google Scholar] [CrossRef] [PubMed]
- Jung, V.; Violle, C.; Mondy, C.; Hoffmann, L.; Muller, S. Intraspecific variability and trait-based community assembly. J. Ecol. 2010, 98, 1134–1140. [Google Scholar] [CrossRef]
- Enquist, B.J.; Norberg, J.; Bonser, S.P.; Violle, C.; Webb, C.T.; Henderson, A.; Sloat, L.L.; Savage, V.M. Scaling from traits to ecosystems. Adv. Ecol. Res. 2015, 52, 249–318. [Google Scholar] [CrossRef]
- Violle, C.; Enquist, B.J.; McGill, B.J.; Jiang, L.; Albert, C.H.; Hulshof, C.; Jung, V.; Messier, J. The return of the variance: Intraspecific variability in community ecology. Trends Ecol. Evol. 2012, 27, 244–252. [Google Scholar] [CrossRef]
- dos Santos, V.A.H.F.; Ferreira, M.J. Are photosynthetic leaf traits related to the first-year growth of tropical tree seedlings? A light-induced plasticity test in a secondary forest enrichment planting. For. Ecol. Manag. 2020, 460, 117900. [Google Scholar] [CrossRef]
- Baltzer, J.L.; Thomas, S.C. Determinants of whole-plant light requirements in Bornean rain forest tree saplings. J. Ecol. 2007, 95, 1208–1221. [Google Scholar] [CrossRef]
- Craine, J.M.; Reich, P.B. Leaf-level light compensation points in shade-tolerant woody seedlings. New Phytol. 2005, 166, 710–713. [Google Scholar] [CrossRef]
- Ntawuhiganayo, E.B.; Uwizeye, F.K.; Zibera, E.; Dusenge, M.E.; Ziegler, C.; Ntirugulirwa, B.; Nsabimana, D.; Wallin, G.; Uddling, J. Traits controlling shade tolerance in tropical montane trees. Tree Physiol. 2020, 40, 183–197. [Google Scholar] [CrossRef]
- Kitajima, K. Relative importance of photosynthetic traits and allocation patterns as correlates of seedling shade tolerance of 13 tropical trees. Oecologia 1994, 98, 419–428. [Google Scholar] [CrossRef]
- Pons, T.L.; Poorter, H. The effect of irradiance on the carbon balance and tissue characteristics of five herbaceous species differing in shade-tolerance. Front. Plant Sci. 2014, 5, 12. [Google Scholar] [CrossRef]
- Kupers, S.J.; Wirth, C.; Engelbrecht, B.M.J.; Hernández, A.; Condit, R.; Wright, S.J.; Rüger, N. Performance of tropical forest seedlings under shade and drought: An interspecific trade-off in demographic responses. Sci. Rep. 2019, 9, 18784. [Google Scholar] [CrossRef] [PubMed]
- Bartholomew, D.C.; Bittencourt, P.R.L.; da Costa, A.C.L.; Banin, L.F.; de Britto Costa, P.; Coughlin, S.I.; Domingues, T.F.; Ferreira, L.V.; Giles, A.; Mencuccini, M.; et al. Small tropical forest trees have a greater capacity to adjust carbon metabolism to long-term drought than large canopy trees. Plant Cell Environ. 2020, 43, 2380–2393. [Google Scholar] [CrossRef] [PubMed]
- Valladares, F.; Niinemets, Ü. Shade tolerance, a key plant feature of complex nature and consequences. Annu. Rev. Ecol. Evol. S. 2008, 39, 237–257. [Google Scholar] [CrossRef]
- Björkman, O. Responses to different quantum flux densities. In Physiological Plant Ecology I: Responses to the Physical Environment; Lange, O.L., Nobel, P.S., Osmond, C.B., Ziegler, H., Eds.; Springer: Berlin/Heidelberg, Germany, 1981; pp. 57–107. [Google Scholar] [CrossRef]
- Givnish, T.J. Adaptation to sun and shade: A whole-plant perspective. Funct. Plant Biol. 1988, 15, 63–92. [Google Scholar] [CrossRef]
- Yoshimura, K. Irradiance heterogeneity within crown affects photosynthetic capacity and nitrogen distribution of leaves in Cedrela sinensis. Plant Cell Environ. 2010, 33, 750–758. [Google Scholar] [CrossRef]
- Rozendaal, D.M.A.; Hurtado, V.H.; Poorter, L. Plasticity in leaf traits of 38 tropical tree species in response to light; relationships with light demand and adult stature. Funct. Ecol. 2006, 20, 207–216. [Google Scholar] [CrossRef]
- Poorter, H.; Niinemets, U.; Ntagkas, N.; Siebenkas, A.; Maenpaa, M.; Matsubara, S.; Pons, T. A meta-analysis of plant responses to light intensity for 70 traits ranging from molecules to whole plant performance. New Phytol. 2019, 223, 1073–1105. [Google Scholar] [CrossRef]
- Poorter, H.; Pepin, S.; Rijkers, T.; de Jong, Y.; Evans, J.R.; Körner, C. Construction costs, chemical composition and payback time of high- and low-irradiance leaves. J. Exp. Bot. 2006, 57, 355–371. [Google Scholar] [CrossRef]
- Wan, Y.; Zhang, Y.; Zhang, M.; Hong, A.; Yang, H.; Liu, Y. Shade effects on growth, photosynthesis and chlorophyll fluorescence parameters of three Paeonia species. PeerJ 2020, 8, e9316. [Google Scholar] [CrossRef]
- Vincent, G. Leaf photosynthetic capacity and nitrogen content adjustment to canopy openness in tropical forest tree seedlings. J. Trop. Ecol. 2001, 17, 495–509. [Google Scholar] [CrossRef]
- Lei, T.T.; Tabuchi, R.; Kitao, M.; Koike, T. Functional relationship between chlorophyll content and leaf reflectance, and light-capturing efficiency of Japanese forest species. Physiol. Plant. 1996, 96, 411–418. [Google Scholar] [CrossRef]
- Onoda, Y.; Schieving, F.; Anten, N.P. Effects of light and nutrient availability on leaf mechanical properties of Plantago major: A conceptual approach. Ann. Bot. 2008, 101, 727–736. [Google Scholar] [CrossRef] [PubMed]
- Poorter, H.; Niinemets, U.; Poorter, L.; Wright, I.J.; Villar, R. Causes and consequences of variation in leaf mass per area (LMA): A meta-analysis. New Phytol. 2009, 182, 565–588. [Google Scholar] [CrossRef] [PubMed]
- Ellsworth, D.S.; Reich, P.B. Canopy structure and vertical patterns of photosynthesis and related leaf traits in a deciduous forest. Oecologia 1993, 96, 169–178. [Google Scholar] [CrossRef] [PubMed]
- Niinemets, Ü. Within-canopy variations in functional leaf traits: Structural, chemical and ecological controls and diversity of responses. In Canopy Photosynthesis: From Basics to Applications; Hikosaka, K., Niinemets, Ü., Anten, N.P.R., Eds.; Springer: Dordrecht, The Netherlands, 2016; pp. 101–141. [Google Scholar]
- Anten, N.P.R.; During, H.J. Is analysing the nitrogen use at the plant canopy level a matter of choosing the right optimization criterion? Oecologia 2011, 167, 293–303. [Google Scholar] [CrossRef] [PubMed]
- Koyama, K.; Kikuzawa, K. Geometrical similarity analysis of photosynthetic light response curves, light saturation and light use efficiency. Oecologia 2010, 164, 53–63. [Google Scholar] [CrossRef] [PubMed][Green Version]
- Koyama, K.; Kikuzawa, K. Is whole-plant photosynthetic rate proportional to leaf area? A test of scalings and a logistic equation by leaf demography census. Am. Nat. 2009, 173, 640–649. [Google Scholar] [CrossRef]
- Koyama, K.; Kikuzawa, K. Reduction of photosynthesis before midday depression occurred: Leaf photosynthesis of Fagus crenata in a temperate forest in relation to canopy position and a number of days after rainfall. Ecol. Res. 2011, 26, 999–1006. [Google Scholar] [CrossRef]
- Muryono, M.; Chen, C.P.; Sakai, H.; Tokida, T.; Hasegawa, T.; Usui, Y.; Nakamura, H.; Hikosaka, K. Nitrogen distribution in leaf canopies of high-yielding rice cultivar takanari. Crop. Sci. 2017, 57, 2080–2088. [Google Scholar] [CrossRef]
- Campany, C.E.; Tjoelker, M.G.; Von Caemmerer, S.; Duursma, R.A. Coupled response of stomatal and mesophyll conductance to light enhances photosynthesis of shade leaves under sunflecks. Plant Cell Environ. 2016, 39, 2762–2773. [Google Scholar] [CrossRef]
- Bhusal, N.; Han, S.-G.; Yoon, T.-M. Summer pruning and reflective film enhance fruit quality in excessively tall spindle apple trees. Hortic. Environ. Biotechnol. 2017, 58, 560–567. [Google Scholar] [CrossRef]
- Kusi, J.; Karsai, I. Plastic leaf morphology in three species of Quercus: The more exposed leaves are smaller, more lobated and denser. Plant Spec. Biol. 2020, 35, 24–37. [Google Scholar] [CrossRef]
- Hollinger, D.Y. Optimality and nitrogen allocation in a tree canopy. Tree Physiol. 1996, 16, 627–634. [Google Scholar] [CrossRef] [PubMed]
- Posada, J.M.; Lechowicz, M.J.; Kitajima, K. Optimal photosynthetic use of light by tropical tree crowns achieved by adjustment of individual leaf angles and nitrogen content. Ann. Bot. 2009, 103, 795–805. [Google Scholar] [CrossRef] [PubMed]
- Hagemeier, M.; Leuschner, C. Functional crown architecture of five temperate broadleaf tree species: Vertical gradients in leaf morphology, leaf angle, and leaf area density. Forests 2019, 10, 265. [Google Scholar] [CrossRef]
- Walters, M.B.; Reich, P.B. Trade-offs in low-light CO2 exchange: A component of variation in shade tolerance among cold temperate tree seedlings. Funct. Ecol. 2000, 14, 155–165. [Google Scholar] [CrossRef]
- Chazdon, R.L.; Pearcy, R.W. Photosynthetic responses to light variation in rainforest species. i. induction under constant and fluctuating light conditions. Oecologia 1986, 69, 517–523. [Google Scholar] [CrossRef]
- Chazdon, R.L. Sunflecks and their importance to forest understorey plants. In Advances in Ecological Research; Begon, M., Fitter, A.H., Ford, E.D., Macfadyen, A., Eds.; Academic Press: Cambridge, MA, USA, 1988; Volume 18, pp. 1–63. [Google Scholar]
- Morales, A.; Kaiser, E. Photosynthetic acclimation to fluctuating irradiance in plants. Front. Plant Sci. 2020, 11, 268. [Google Scholar] [CrossRef]
- Parker, G.G.; Fitzjarrald, D.R.; Gonçalves Sampaio, I.C. Consequences of environmental heterogeneity for the photosynthetic light environment of a tropical forest. Agr. For. Meteorol. 2019, 278, 107661. [Google Scholar] [CrossRef]
- Hartikainen, S.M.; Pieristè, M.; Lassila, J.; Robson, T.M. Seasonal patterns in spectral irradiance and leaf UV-A absorbance under forest canopies. Front. Plant Sci. 2020, 10. [Google Scholar] [CrossRef]
- Muraoka, H.; Koizumi, H.; Pearcy, R.W. Leaf display and photosynthesis of tree seedlings in a cool-temperate deciduous broadleaf forest understorey. Oecologia 2003, 135, 500–509. [Google Scholar] [CrossRef] [PubMed]
- Muraoka, H.; Takenaka, A.; Tang, Y.; Koizumi, H.; Washitani, I. Flexible leaf orientations of Arisaema heterophyllum maximize light capture in a forest understorey and avoid excess irradiance at a deforested site. Ann. Bot. 1998, 82, 297–307. [Google Scholar] [CrossRef]
- Kaiser, E.; Morales, A.; Harbinson, J. Fluctuating light takes crop photosynthesis on a rollercoaster ride. Plant Physiol. 2018, 176, 977–989. [Google Scholar] [CrossRef] [PubMed]
- Slattery, R.A.; Walker, B.J.; Weber, A.P.M.; Ort, D.R. The impacts of fluctuating light on crop performance. Plant Physiol. 2018, 176, 990. [Google Scholar] [CrossRef]
- Way, D.A.; Pearcy, R.W. Sunflecks in trees and forests: From photosynthetic physiology to global change biology. Tree Physiol. 2012, 32, 1066–1081. [Google Scholar] [CrossRef]
- Miyashita, A.; Sugiura, D.; Sawakami, K.; Ichihashi, R.; Tani, T.; Tateno, M. Long-term, short-interval measurements of the frequency distributions of the photosynthetically active photon flux density and net assimilation rate of leaves in a cool-temperate forest. Agric. For. Meteorol. 2012, 152, 1–10. [Google Scholar] [CrossRef]
- Valladares, F.; Pearcy, R.W. Drought can be more critical in the shade than in the sun: A field study of carbon gain and photo-inhibition in a Californian shrub during a dry El Nino year. Plant Cell Environ. 2002, 25, 749–759. [Google Scholar] [CrossRef]
- Poorter, H.; Fiorani, F.; Pieruschka, R.; Wojciechowski, T.; van der Putten, W.H.; Kleyer, M.; Schurr, U.; Postma, J. Pampered inside, pestered outside? Differences and similarities between plants growing in controlled conditions and in the field. New Phytol. 2016, 212, 838–855. [Google Scholar] [CrossRef]
- Valladares, F.; Zaragoza-Castells, J.; Sanchez-Gomez, D.; Matesanz, S.; Alonso, B.; Portsmuth, A.; Delgado, A.; Atkin, O.K. Is shade beneficial for Mediterranean shrubs experiencing periods of extreme drought and late-winter frosts? Ann. Bot. 2008, 102, 923–933. [Google Scholar] [CrossRef]
- Ohashi, H.; Kadota, Y.; Murata, J.; Yonekura, K.; Kihara, H. Wild Flowers of Japan; Heibonsha: Tokyo, Japan, 2015. [Google Scholar]
- Sok, D.E.; Oh, S.H.; Kim, Y.B.; Kang, H.G.; Kim, M.R. Neuroprotection by extract of Petasites japonicus leaves, a traditional vegetable, against oxidative stress in brain of mice challenged with kainic acid. Eur. J. Nutr. 2006, 45, 61–69. [Google Scholar] [CrossRef]
- Xu, J.; Ji, F.; Cao, X.; Ma, J.; Ohizumi, Y.; Lee, D.; Guo, Y. Sesquiterpenoids from an edible plant Petasites japonicus and their promoting effects on neurite outgrowth. J. Funct. Food. 2016, 22, 291–299. [Google Scholar] [CrossRef]
- Japan Meteorological Agency. Available online: http://www.jma.go.jp (accessed on 14 September 2020).
- Fleck, S.; Niinemets, U.; Cescatti, A.; Tenhunen, J.D. Three-dimensional lamina architecture alters light-harvesting efficiency in Fagus: A leaf-scale analysis. Tree Physiol. 2003, 23, 577–589. [Google Scholar] [CrossRef] [PubMed]
- Chambelland, J.-C.; Dassot, M.; Adam, B.; Donès, N.; Balandier, P.; Marquier, A.; Saudreau, M.; Sonohat, G.; Sinoquet, H. A double-digitising method for building 3D virtual trees with non-planar leaves: Application to the morphology and light-capture properties of young beech trees (Fagus sylvatica). Funct. Plant Biol. 2008, 35, 1059–1069. [Google Scholar] [CrossRef] [PubMed]
- Johnson, I.R.; Thornley, J.H.M. A model of instantaneous and daily canopy photosynthesis. J. Theor. Biol. 1984, 107, 531–545. [Google Scholar] [CrossRef]
- Liu, Y.Y.; Li, J.; Liu, S.C.; Yu, Q.; Tong, X.J.; Zhu, T.T.; Gao, X.X.; Yu, L.X. Sugarcane leaf photosynthetic light responses and their difference between varieties under high temperature stress. Photosynthetica 2020, 58, 1009–1018. [Google Scholar] [CrossRef]
- Maxima.sourceforge.net. Maxima, a Computer Algebra System. Version 5.43.0 (2020). Available online: http://maxima.sourceforge.net/ (accessed on 14 September 2020).
- Koyama, K.; Shirakawa, H.; Kikuzawa, K. Redeployment of shoots into better-lit positions within the crowns of saplings of five species with different growth patterns. Forests 2020, 11, 1301. [Google Scholar] [CrossRef]
- Schneider, C.A.; Rasband, W.S.; Eliceiri, K.W. NIH Image to ImageJ: 25 years of image analysis. Nat. Methods 2012, 9, 671. [Google Scholar] [CrossRef]
- John, G.P.; Scoffoni, C.; Buckley, T.N.; Villar, R.; Poorter, H.; Sack, L. The anatomical and compositional basis of leaf mass per area. Ecol. Lett. 2017, 20, 412–425. [Google Scholar] [CrossRef]
- R Core Team. R: A Language and Environment for Statistical Computing. R Foundation for Statistical Computing; R Core Team: Vienna, Austria, 2020. [Google Scholar]
- Wilke, C.O. cowplot: Streamlined Plot Theme and Plot Annotations for ’ggplot2’. CRAN Repos. 2016, 2, R2. [Google Scholar]
- Clarke, E.; Sherrill-Mix, S. ggbeeswarm: Categorical Scatter (Violin Point) Plots. 2017. Available online: https://cran.R-project.org (accessed on 14 September 2020).
- Wickham, H. ggplot2: Elegant Graphics for Data Analysis; Springer: New York, NY, USA, 2016. [Google Scholar]
- Bates, D.; Mächler, M.; Bolker, B.; Walker, S. Fitting linear mixed-effects models using lme4. J. Stat. Softw. 2015, 67, 48. [Google Scholar] [CrossRef]
- Pattison, P.M.; Tsao, J.Y.; Brainard, G.C.; Bugbee, B. LEDs for photons, physiology and food. Nature 2018, 563, 493–500. [Google Scholar] [CrossRef] [PubMed]
- Tateno, M.; Taneda, H. Photosynthetically versatile thin shade leaves: A paradox of irradiance-response curves. Photosynthetica 2007, 45, 299–302. [Google Scholar] [CrossRef]
- Oguchi, R.; Hikosaka, K.; Hiura, T.; Hirose, T. Costs and benefits of photosynthetic light acclimation by tree seedlings in response to gap formation. Oecologia 2008, 155, 665–675. [Google Scholar] [CrossRef] [PubMed]
- Oguchi, R.; Onoda, Y.; Terashima, I.; Tholen, D. Leaf Anatomy and Function. In The Leaf: A Platform for Performing Photosynthesis; Adams Iii, W.W., Terashima, I., Eds.; Springer International Publishing: Cham, Switzerland, 2018; pp. 97–139. [Google Scholar] [CrossRef]
- Terashima, I.; Miyazawa, S.-I.; Hanba, Y.T. Why are sun leaves thicker than shade leaves?—Consideration based on analyses of CO2 diffusion in the leaf. J. Plant Res. 2001, 114, 93–105. [Google Scholar] [CrossRef]
- Bhusal, N.; Bhusal, S.J.; Yoon, T.-M. Comparisons of physiological and anatomical characteristics between two cultivars in bi-leader apple trees (Malus × domestica Borkh.). Sci. Hortic. 2018, 231, 73–81. [Google Scholar] [CrossRef]
- Wyka, T.P.; Oleksyn, J.; Żytkowiak, R.; Karolewski, P.; Jagodziński, A.M.; Reich, P.B. Responses of leaf structure and photosynthetic properties to intra-canopy light gradients: A common garden test with four broadleaf deciduous angiosperm and seven evergreen conifer tree species. Oecologia 2012, 170, 11–24. [Google Scholar] [CrossRef]
- Mooney, H.A.; Gulmon, S.L. Environmental and evolutionary constraints on the photosynthetic characteristics of higher plants. In Topics in Plant Population Biology; Solbrig, O.T., Jain, S., Johnson, G.B., Raven, P.H., Eds.; Macmillan Education: London, UK, 1979; pp. 316–337. [Google Scholar]
- Tanaka, T.; Oikawa, S.; Kurokawa, C. Leaf shedding increases the photosynthetic rate of the canopy in N2-fixing and non-N2-fixing woody species. Tree Physiol. 2018, 38, 1903–1911. [Google Scholar] [CrossRef]
- Oikawa, S.; Hikosaka, K.; Hirose, T. Does leaf shedding increase the whole-plant carbon gain despite some nitrogen being lost with shedding? New Phytol. 2008, 178, 617–624. [Google Scholar] [CrossRef]
- Kubínová, Z.; Janáček, J.; Lhotáková, Z.; Šprtová, M.; Kubínová, L.; Albrechtová, J. Norway spruce needle size and cross section shape variability induced by irradiance on a macro- and microscale and CO2 concentration. Trees 2017, 32, 231–244. [Google Scholar] [CrossRef]
- Dörken, V.M.; Lepetit, B. Morpho-anatomical and physiological differences between sun and shade leaves in Abies alba Mill. (Pinaceae, Coniferales): A combined approach. Plant Cell Environ. 2018, 41, 1683–1697. [Google Scholar] [CrossRef]
- Niinemets, Ü.; Tobias, M.; Cescatti, A.; Sparrow, A. Size-dependent variation in shoot light-harvesting efficiency in shade-intolerant conifers. Int. J. Plant Sci. 2006, 167, 19–32. [Google Scholar] [CrossRef]
- Anten, N.P.R. Optimization and game theory in canopy models. In Canopy Photosynthesis: From Basics to Applications; Hikosaka, K., Niinemets, Ü, Anten, N.P.R., Eds.; Springer: Dordrecht, The Netherlands, 2016; pp. 355–377. [Google Scholar]
- De Wit, M.; Kegge, W.; Evers, J.B.; Vergeer-van Eijk, M.H.; Gankema, P.; Voesenek, L.A.; Pierik, R. Plant neighbor detection through touching leaf tips precedes phytochrome signals. Proc. Natl. Acad. Sci. USA 2012, 109, 14705–14710. [Google Scholar] [CrossRef] [PubMed]
- Saudreau, M.; Ezanic, A.; Adam, B.; Caillon, R.; Walser, P.; Pincebourde, S. Temperature heterogeneity over leaf surfaces: The contribution of the lamina microtopography. Plant Cell Environ. 2017, 40, 2174–2188. [Google Scholar] [CrossRef] [PubMed]
- Reich, P.B.; Walters, M.B.; Tjoelker, M.G.; Vanderklein, D.; Buschena, C. Photosynthesis and respiration rates depend on leaf and root morphology and nitrogen concentration in nine boreal tree species differing in relative growth rate. Funct. Ecol. 1998, 12, 395–405. [Google Scholar] [CrossRef]
- Walters, M.B.; Reich, P.B. Low-light carbon balance and shade tolerance in the seedlings of woody plants: Do winter deciduous and broad-leaved evergreen species differ? New Phytol. 1999, 143, 143–154. [Google Scholar] [CrossRef]
- Kurosawa, Y.; Mori, S.; Wang, M.; Ferrio, J.P.; Yamaji, K.; Koyama, K.; Haruma, T.; Doyama, K. Initial burst of root development with decreasing respiratory carbon cost in Fagus crenata Blume seedlings. Plant Spec. Biol. 2020. [Google Scholar] [CrossRef]
- Miyashita, A.; Tateno, M. A novel index of leaf RGR predicts tree shade tolerance. Funct. Ecol. 2014, 28, 1321–1329. [Google Scholar] [CrossRef]
- Tatsumi, K.; Kuwabara, Y.; Motobayashi, T. Photosynthetic light-use efficiency of rice leaves under fluctuating incident light. Agrosyst. Geosci. Environ. 2020, 3, e20030. [Google Scholar] [CrossRef]
- Matthews, J.S.A.; Vialet-Chabrand, S.; Lawson, T. Role of blue and red light in stomatal dynamic behaviour. J. Exp. Bot. 2020, 71, 2253–2269. [Google Scholar] [CrossRef]
- Zhang, S.B.; Hao, Y.J.; Deng, Q.L. Photosynthetic induction is slower in young leaves than in mature leaves in a tropical invader, Chromolaena Odorata. Photosynth. 2019, 57, 1044–1052. [Google Scholar] [CrossRef]
- Kimura, H.; Hashimoto-Sugimoto, M.; Iba, K.; Terashima, I.; Yamori, W. Improved stomatal opening enhances photosynthetic rate and biomass production in fluctuating light. J. Exp. Bot. 2020, 71, 2339–2350. [Google Scholar] [CrossRef] [PubMed]
- Sakoda, K.; Yamori, W.; Groszmann, M.; Evans, J.R. Stomatal, mesophyll conductance, and biochemical limitations to photosynthesis during induction. Plant Physiol. 2020. [Google Scholar] [CrossRef]
- Shimadzu, S.; Seo, M.; Terashima, I.; Yamori, W. Whole irradiated plant leaves showed faster photosynthetic induction than individually irradiated leaves via improved stomatal opening. Front. Plant Sci. 2019, 10. [Google Scholar] [CrossRef] [PubMed]
- Yamori, W.; Kusumi, K.; Iba, K.; Terashima, I. Increased stomatal conductance induces rapid changes to photosynthetic rate in response to naturally fluctuating light conditions in rice. Plant Cell Environ. 2020, 43, 1230–1240. [Google Scholar] [CrossRef] [PubMed]
- Alter, P.; Dreissen, A.; Luo, F.L.; Matsubara, S. Acclimatory responses of Arabidopsis to fluctuating light environment: Comparison of different sunfleck regimes and accessions. Photosynth. Res. 2012, 113, 221–237. [Google Scholar] [CrossRef]
- Naumburg, E.; Ellsworth, D.S. Photosynthetic sunfleck utilization potential of understory saplings growing under elevated CO2 in FACE. Oecologia 2000, 122, 163–174. [Google Scholar] [CrossRef]
- Duursma, R.A.; Payton, P.; Bange, M.P.; Broughton, K.J.; Smith, R.A.; Medlyn, B.E.; Tissue, D.T. Near-optimal response of instantaneous transpiration efficiency to vapour pressure deficit, temperature and CO2 in cotton (Gossypium hirsutum L.). Agric. For. Meteorol. 2013, 168, 168–176. [Google Scholar] [CrossRef]
- Koyama, K.; Takemoto, S. Morning reduction of photosynthetic capacity before midday depression. Sci. Rep. 2014, 4, 4389. [Google Scholar] [CrossRef]
- Scoffoni, C.; Sack, L.; Ort, D. The causes and consequences of leaf hydraulic decline with dehydration. J. Exp. Bot. 2017, 68, 4479–4496. [Google Scholar] [CrossRef]
- Muraoka, H.; Tang, Y.H.; Terashima, I.; Koizumi, H.; Washitani, I. Contributions of diffusional limitation, photoinhibition and photorespiration to midday depression of photosynthesis in Arisaema heterophyllum in natural high light. Plant Cell Environ. 2000, 23, 235–250. [Google Scholar] [CrossRef]
- Espadafor, M.; Orgaz, F.; Testi, L.; Lorite, I.J.; González-Dugo, V.; Fereres, E. Responses of transpiration and transpiration efficiency of almond trees to moderate water deficits. Sci. Hortic. 2017, 225, 6–14. [Google Scholar] [CrossRef]
- Paillassa, J.; Wright, I.J.; Prentice, I.C.; Pepin, S.; Smith, N.G.; Ethier, G.; Westerband, A.C.; Lamarque, L.J.; Wang, H.; Cornwell, W.K.; et al. When and where soil is important to modify the carbon and water economy of leaves. New Phytol. 2020, 228, 121–135. [Google Scholar] [CrossRef] [PubMed]
- Bhusal, N.; Lee, M.; Reum Han, A.; Han, A.; Kim, H.S. Responses to drought stress in Prunus sargentii and Larix kaempferi seedlings using morphological and physiological parameters. For. Ecol. Manag. 2020, 465, 118099. [Google Scholar] [CrossRef]


| Symbol | Definition | Unit | Sample Size (n) | Mean (C) | Mean (U) | Ratio C/U | C vs. U p-Value | |
|---|---|---|---|---|---|---|---|---|
| C | U | |||||||
| rPPFD | - | - | 32 | 30 | 87.7% | 10.8% | 8.10 | <0.01 |
| α | Lamina openness angle | Degree (°) | 32 | 30 | 116.3 | 136.5 | 0.85 | <0.01 |
| dhigh | Lamina length (high) | cm | 32 | 30 | 31.3 | 35.2 | 0.89 | 0.025 |
| dopp | Lamina length (opposite) | cm | 32 | 30 | 29.7 | 31.1 | 0.96 | 0.38 ns |
| pl | Petiole length | cm | 32 | 30 | 55.1 | 57.7 | 0.95 | 0.28 ns |
| LMA | Leaf mass per area | g m−2 | 20 | 21 | 44.3 | 23.7 | 1.87 | <0.01 |
| - | Leaf thickness | mm | 20 | 21 | 0.428 | 0.348 | 1.23 | <0.01 |
| Pnet_2000 | Net photosynthetic rate at PPFD = 2000 mol m−2 s−1 | μmol m−2 s−1 | 6 | 6 | 23.2 | 11.3 | 2.04 | <0.01 |
| Pg_max_area | Maximum gross photosynthetic rate per unit leaf area | μmol m−2 s−1 | 6 | 6 | 27.2 | 12.6 | 2.16 | <0.01 |
| Rarea | Dark respiration rate per unit leaf area | μmol m−2 s−1 | 6 | 6 | 1.85 | 0.87 | 2.14 | <0.01 |
| Φ | Initial slope | mol CO2 mol−1 quanta | 6 | 6 | 0.075 | 0.076 | 0.98 | 0.48 ns |
| θ | Convexity | - | 6 | 6 | 0.562 | 0.600 | 0.94 | 0.49 ns |
| LCP | Light compensation point | μmol quanta m−2 s−1 | 6 | 6 | 25.7 | 11.8 | 2.18 | <0.01 |
| Pg_max_mass | Maximum gross photosynthetic rate per unit leaf mass | nmol g−1 s−1 | 6 | 6 | 545 | 523 | 1.04 | 0.72 ns |
| Rmass | Dark respiration rate per unit leaf mass | nmol g−1 s−1 | 6 | 6 | 37.1 | 36.7 | 1.01 | 0.97 ns |
| Iday | Daily light integral—sunny day | mol quanta m−2 day−1 | 3 | 4 | 45.7 | 5.96 | 7.67 | <0.01 |
| —overcast day | 4 | 4 | 26.5 | 2.74 | 9.69 | <0.01 | ||
| Pn_day | Net daily photosynthesis per area—sunny day | mol m−2 day−1 | 3 | 4 | 0.745 | 0.145 | 5.14 | <0.01 |
| —overcast day | 4 | 4 | 0.682 | 0.075 | 9.05 | <0.01 | ||
| Rday | Daily respiration per area | mol m−2 day−1 | 6 | 6 | 0.160 | 0.075 | - 1 | - 1 |
| Pg_day | Gross daily photosynthesis per area—sunny day | mol m−2 day−1 | 3 | 4 | 0.906 | 0.237 | 3.83 | <0.01 |
| —overcast day | 4 | 4 | 0.841 | 0.167 | 5.03 | <0.01 | ||
| Daily Carbon Exchange | Simulation | Clearing (C) | Understory (U) | ||
|---|---|---|---|---|---|
| Sunny | Overcast | Sunny | Overcast | ||
| Daily net photosynthesis (mol m−2 day−1) | Sample size | n = 3 | n = 4 | n = 4 | n = 4 |
| Actual leaves | 0.745 | 0.682 | 0.145 | 0.075 | |
| Exchanged leaves (between C and U) | 0.430 | 0.415 | 0.138 | 0.024 | |
| Without sunflecks (actual leaves) | - | 0.134 | - | ||
| Without sunflecks (exchanged leaves) | - | 0.106 | - | ||
| Daily gross photosynthesis (mol m−2 day−1) | Sample size | n = 3 | n = 4 | n = 4 | n = 4 |
| Actual leaves | 0.906 | 0.803 | 0.237 | 0.167 | |
| Exchanged leaves | 0.505 | 0.471 | 0.298 | 0.184 | |
| Daily respiration (mol m−2 day−1) | Sample size 1 | n = 6 | n = 6 | ||
| Actual leaves | 0.160 | 0.075 | |||
| Exchanged leaves | 0.075 | 0.160 | |||
Publisher’s Note: MDPI stays neutral with regard to jurisdictional claims in published maps and institutional affiliations. |
© 2020 by the authors. Licensee MDPI, Basel, Switzerland. This article is an open access article distributed under the terms and conditions of the Creative Commons Attribution (CC BY) license (http://creativecommons.org/licenses/by/4.0/).
Share and Cite
Deguchi, R.; Koyama, K. Photosynthetic and Morphological Acclimation to High and Low Light Environments in Petasites japonicus subsp. giganteus. Forests 2020, 11, 1365. https://doi.org/10.3390/f11121365
Deguchi R, Koyama K. Photosynthetic and Morphological Acclimation to High and Low Light Environments in Petasites japonicus subsp. giganteus. Forests. 2020; 11(12):1365. https://doi.org/10.3390/f11121365
Chicago/Turabian StyleDeguchi, Ray, and Kohei Koyama. 2020. "Photosynthetic and Morphological Acclimation to High and Low Light Environments in Petasites japonicus subsp. giganteus" Forests 11, no. 12: 1365. https://doi.org/10.3390/f11121365
APA StyleDeguchi, R., & Koyama, K. (2020). Photosynthetic and Morphological Acclimation to High and Low Light Environments in Petasites japonicus subsp. giganteus. Forests, 11(12), 1365. https://doi.org/10.3390/f11121365