Article

Uranium Vertical and Lateral Distribution in a German Forested Catchment

1
Institute of Bio- and Geosciences, Agrosphere (IBG-3), Forschungszentrum Jülich GmbH, 52425 Jülich, Germany
2
GFZ, German Centre for Geosciences, Telegrafenberg, 14473 Potsdam, Germany
3
Institute for Biodiversity and Ecosystem Dynamics, Amsterdam University, 1012 WX Amsterdam, The Netherlands
*
Author to whom correspondence should be addressed.
Forests 2020, 11(12), 1351; https://doi.org/10.3390/f11121351
Submission received: 29 October 2020 / Revised: 10 December 2020 / Accepted: 14 December 2020 / Published: 17 December 2020
(This article belongs to the Section Forest Ecology and Management)

Abstract

:
The natural measurements of uranium (U) are important for establishing natural baseline levels of U in soil. The relations between U and other elements are important to determine the extent of geological origin of soil U. The present study was aimed at providing a three-dimensional view of soil U distribution in a forested catchment (ca. 38.5 ha) in western Germany. The evaluated data, containing 155 sampled points, each with four major soil horizons (L/Of, Oh, A, and B), were collected from two existing datasets. The vertical U distribution, the lateral pattern of U in the catchment, and the occurrence of correlations between U and three groups of elements (nutrient elements, heavy metals, and rare earth elements) were examined. The results showed the median U concentration increased sevenfold from the top horizon L/Of (0.14 mg kg−1) to the B horizon (1.01 mg kg−1), suggesting a geogenic origin of soil U. Overall, soil U concentration was found to be negatively correlated with some plant macronutrients (C, N, K, S, Ca) but positively with others (P, Mg, Cu, Zn, Fe, Mn, Mo). The negative correlations between U and some macronutrients indicated a limited accumulation of plant-derived U in soil, possibly due to low phytoavailability of U. Positive correlations were also found between U concentration and heavy metals (Cr, Co, Ni, Ga, As, Cd, Hg, Pb) or rare earth elements, which further pointed to a geogenic origin of soil U in this forested catchment.

1. Introduction

The ecological concern of heavy metals in soils has attracted great attention from governmental and regulatory bodies, leading to a widespread interest in the measurement and monitoring of heavy metals in soils [1,2]. Uranium (U) is a radioactive toxic heavy metal and is widely distributed throughout the earth’s crust, rocks, soils, and waters. At high concentrations, U can pose significant threats to the environment and public health [3,4]. The average soil U concentration ranges from 1.2 to 11 mg kg−1 [5] and is a result of natural geological and pedological processes, as well as from anthropogenic inputs [1,6]. Annually, 27 to 32 Gg of U is released from igneous, shale, sandstone, and limestone rocks by weathering and natural erosion [7]. This released U from the parent material determines the natural soil U background [6,8]. Uranium is most abundant in igneous rocks and shales with a high content of silica, especially black shales [9]. Anthropogenic soil U inputs can be due to various activities, such as mining, coal use, phosphate fertilizer application, and inappropriate waste disposal [6,10]. Studies have found that elevated U accumulation in agricultural soils, especially in arable cropping lands, was related to the extent of P fertilizer applications [11,12]. Uranium accumulation has been reported to range from 0 to 130 µg kg−1 in soils for which mineral phosphate fertilizer has been applied for durations of about 20 to over 80 years (e.g., [11,12]).
The mobility and stability of U in soils is pivotally associated with the oxidation state [13]. Tetravalent U(IV) and hexavalent U(VI) are two predominant oxidation states of U in the environment [14]. Tetravalent U(IV) forms under reducing conditions and is nearly immobile, as it precipitates as mineral uranite (UO2). Mobile U in the environment is mostly hexavalent U(VI). The varieties of U-bearing phases and compositions are influenced by soil properties (texture, organic matter, and pH), redox condition, cation exchange capacity, and anion concentrations [14,15,16]. Under reducing conditions, uranyl-fluoride complexes are stable at low pH, whereas uranyl-hydroxide complexes dominate at high pH [14,15]. In an oxidizing environment, U(VI) forms uranyl-phosphate complexes at pH 4–7.5, and uranyl-carbonate at pH > 7.5, respectively [16]. Soil parameters such as texture, organic matter, cation exchange capacity, and water supply, as well as the plant itself, can influence U transfer from soil to plant [17]. It seems that U does not appear to strongly bioaccumulate in vegetation, as the transfer factor of soil to plant is generally less than one [18]. However, U can be adsorbed on roots and enter food chains via root crop consumptions.
In order to develop and improve legislation to limit direct and indirect environmental impacts of “excess” heavy metals in soils, many studies focus on establishing global geochemical soil background and threshold values of various heavy metals [2,19]. Geostatistical techniques are increasingly used in soils to better understand the complex relationships between soil properties, anthropogenic inputs, and environmental factors [20,21]. A pan-European geochemical baseline study mapping macro- and trace element contents (including U) in stream waters, sediments, and soils was carried out by Salminen et al. (2005). Another project, GEMAS (geochemical mapping of agricultural soil), focused on soils from agricultural and grazing land to produce consistent geochemical soil maps [2,19]. These geochemical maps have the advantage of evaluating the heavy metal content in soils, sediments, and waters on the continental scale. However, there is a lack of information on the catchment scale with high-density sampling points, especially on the vertical and lateral distribution of U in soil profiles [22,23].
This study presents new data on baseline U values in a forested catchment based on high-density sampling. The aims are (i) to determine the range of U concentrations in soils and its vertical and lateral distribution at the catchment scale; (ii) to provide statistical correlations between soil U concentrations and other elements in forested ecosystems.

2. Materials and Methods
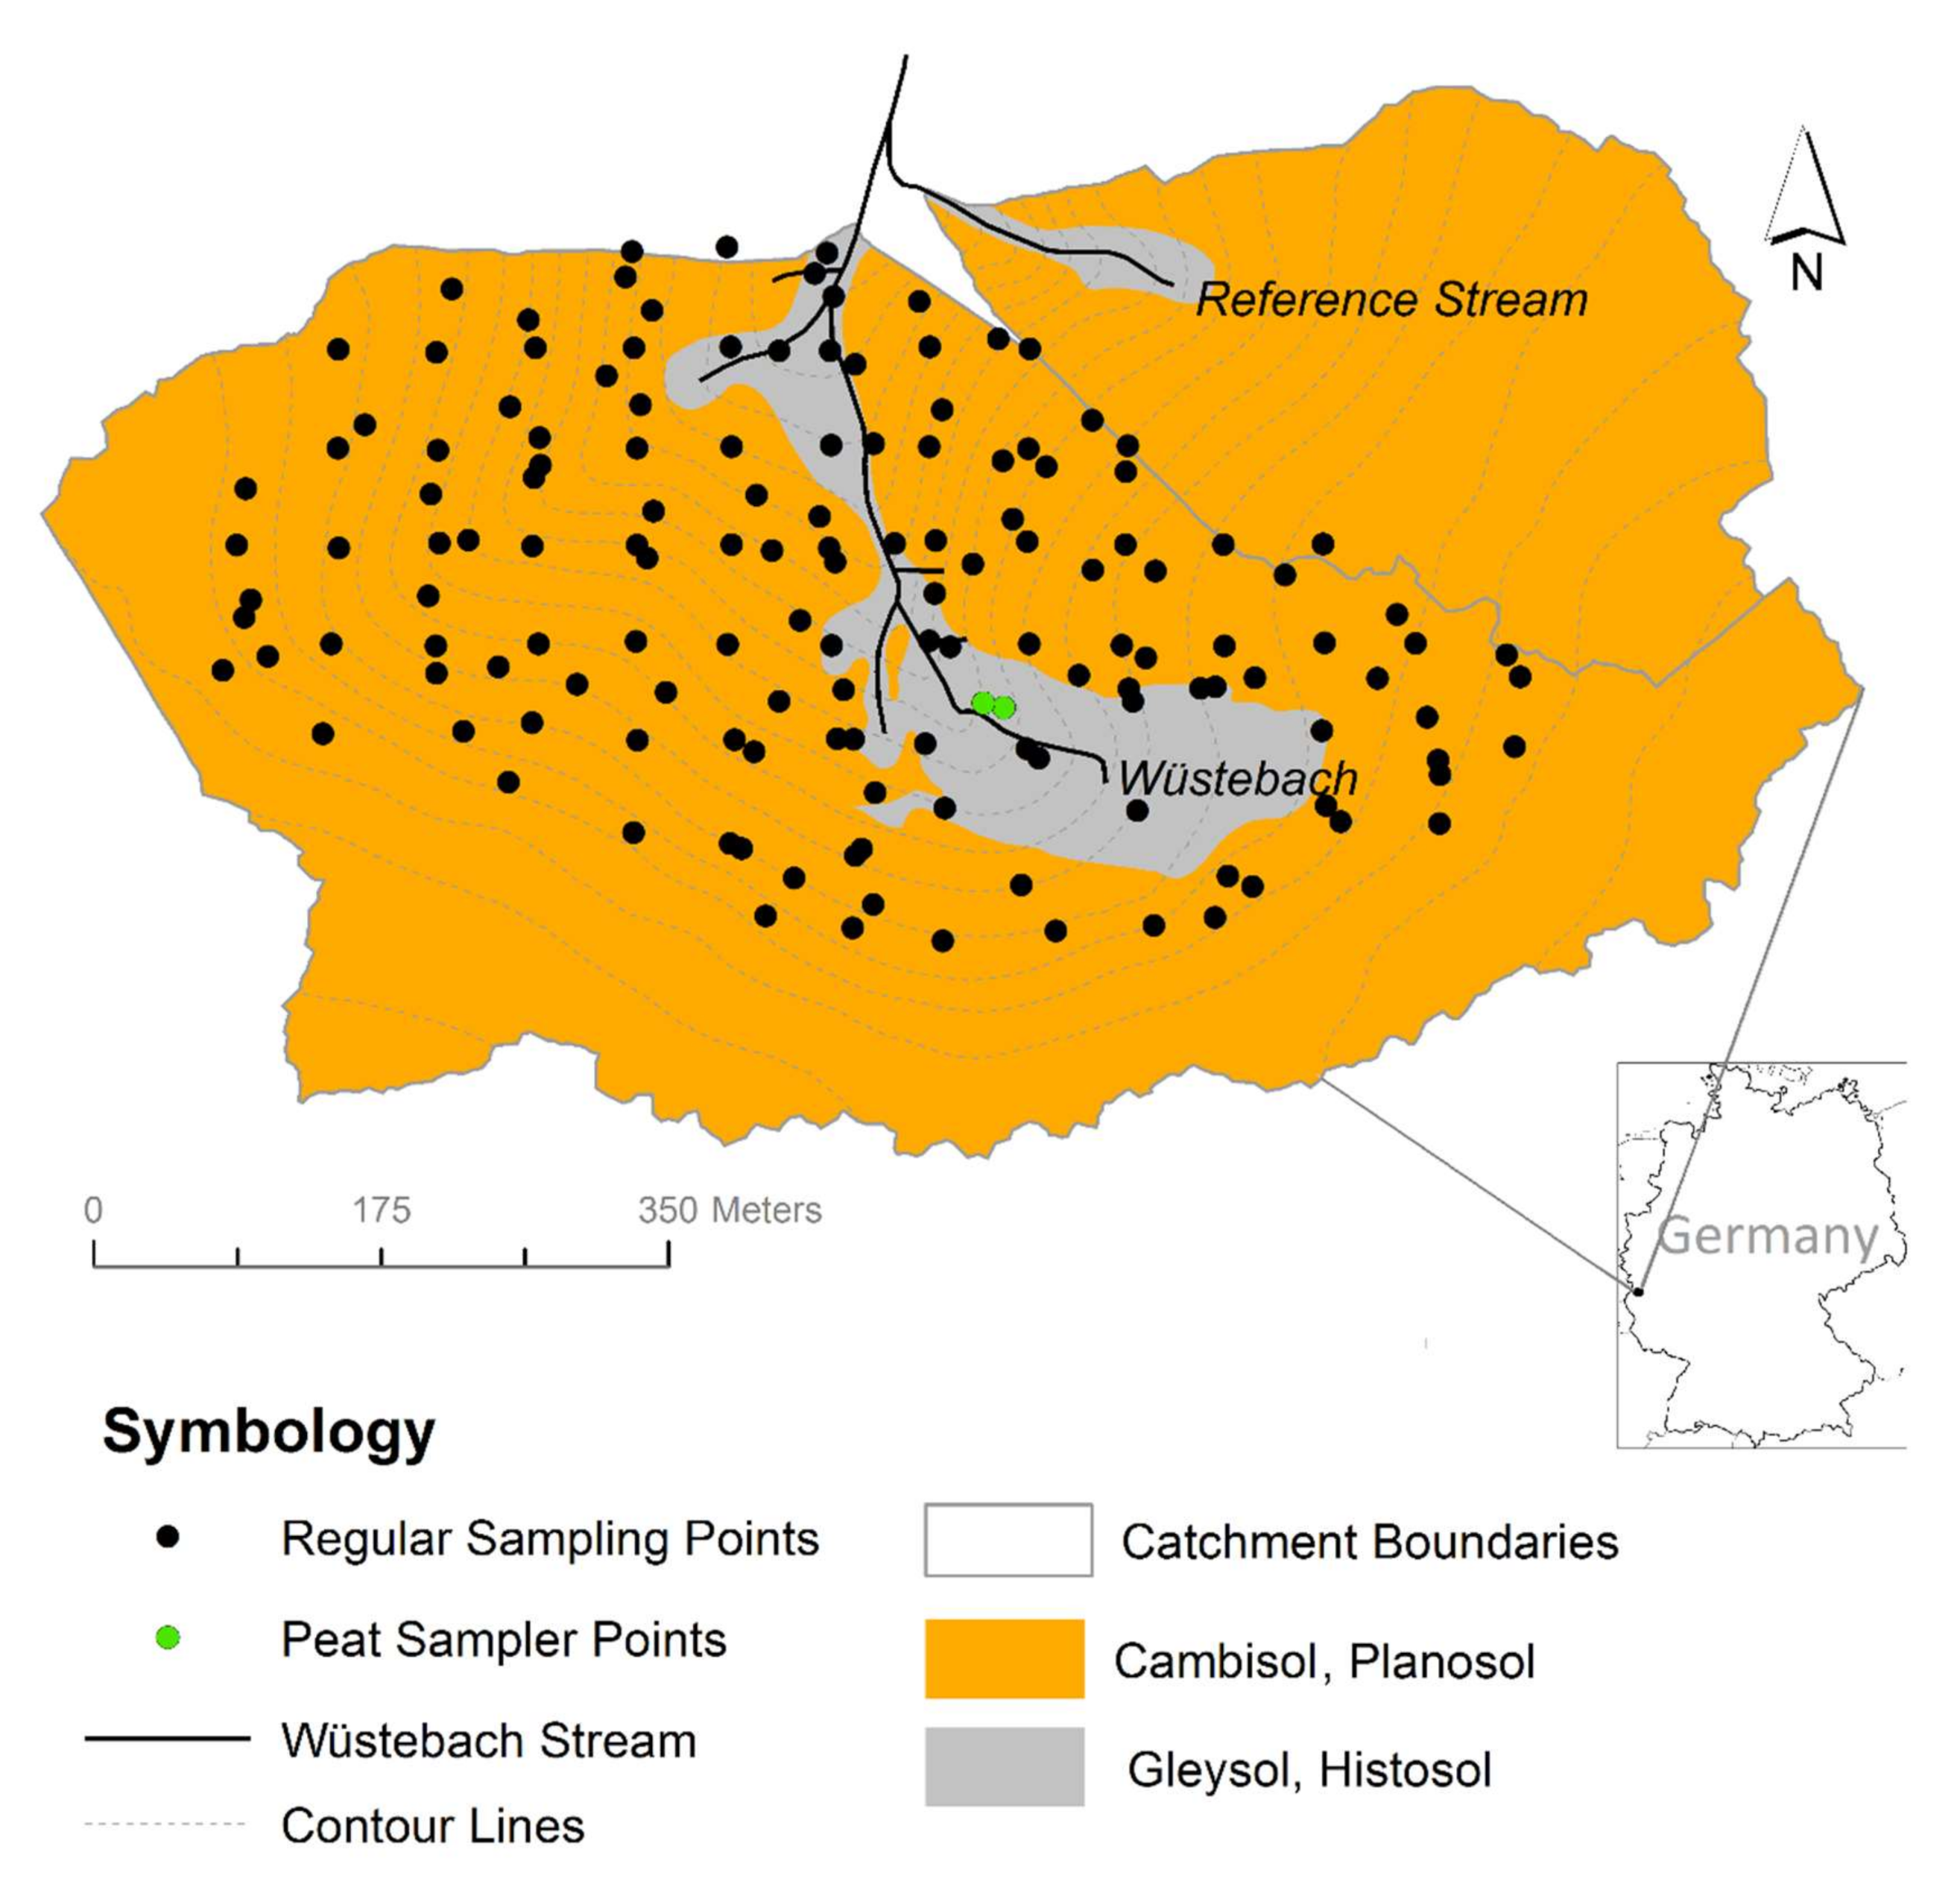
2.1. Study Area

The sampling site, Wüstebach catchment (Figure 1), is located in the southernmost part of the Eifel national park (50°30′16″ N, 6°20′00″ E, WGS84) near the German–Belgian border and covers an area of about 38.5 ha [24]. The Wüstebach catchment is one of the TERENO (Terrestrial Environmental Observatories) test sites at the Eifel/Lower Rhine Observatory [25], where the long-term impacts of environmental changes on the regional scale have been monitored since 2007. The climate is warm-temperate to humid with a mean annual temperature of 7 °C and a mean annual precipitation of 1200 mm [25]. The study area belongs to the Rhenish Massif, which is part of the Variscan orogenic belt in northwestern Europe. The predominant bedrock is fractured Devonian shales with occasional sandstone inclusions, which is overlain by a periglacial solifluction layer with a thickness of 1–2 m. Cambisols and Planosols (according to World Reference Base) [26] have mainly developed on the hills and hillslopes covering the main part of the catchment, whereas Gleysols and Histosols are located in the riparian zone [27]. The prevailing soil texture is silty clay loam, with occasionally very high amounts of coarse material. The vegetation is dominated by two types of coniferous trees: Norway spruce (Picea abies (L.) H. Karst.) and Sitka spruce (Picea sitchensis (Bong.) Carrière), which were planted in the 1940s. The litter layer generally has an L-Of-Oh sequence with a total thickness between 0.5 and 14 cm (mean: 5.8 cm).
The sampling of the soils was performed between 24 and 27 June 2013 and was described in detail by Gottselig et al. [28]. In total, 155 locations were sampled, which followed the existing geostatistical setup of the SoilNet. A number of samples were taken at each location. The organic layers, including litter layers (L/Of) and humus-rich (Oh) horizon, were collected first. Subsequently, two soil cores of 30 cm depth (mainly the A horizon) were taken after the complete removal of L/Of and Oh horizon. Finally, two more soil cores were taken from 30 to 60 cm (B or B/C horizon) below the A horizon.

2.2. Datasets

Data analysis was performed using a selection of data from two previously published datasets that were established within the framework of the TERENO project. Both datasets contain elemental information of 155 sampling points. Four soil horizon samples were collected for each site, including litter layers (L/Of), humus-rich (Oh) horizon, organic-rich mineral layer (A), and mineral layer (B). More information can be found in Gottselig et al. [28].
The first dataset contains the data of soil physical and chemical properties, together with information on concentrations of several key soil nutrients (http://teodoor.icg.kfa-juelich.de/ibg3searchportal2/dispatch?metadata.detail.view.id=e3886301-7252-4142-b1a4-333dfe7f1ca4) [28]. This dataset provided detailed information on the three-dimensional variability of biogeochemical properties in the Wüstebach catchment and links between (re)cycling, leaching, and storage of the main nutrients on the catchment scale. For this study, the soil concentration data of total carbon (TC), total nitrogen (TN), phosphorus (P), potassium (K), and calcium (Ca) were used for analyzing the relationship with U.
The second dataset comprised spatial distributions of an additional set of 39 elements including U concentration at the same sampling locations [29] (http://teodoor.icg.kfa-juelich.de/ibg3searchportal2/dispatch?searchparams=freetext-Wuestebach&metadata.detail.view.id=7d37ae00-20f6-408e-8660-33bfba07c869). The concentration data of U, as well as other elements (Mg, Fe, Cu, Mn, Mo, Zn, Cr, Co, As, Pb, Ni, Ga, Hg, Cd) and rare earth elements (REEs) (La, Ce, Pr, Nd, Sm, Eu, Gd, Tb, Dy, Ho, Er, Tm, Yb, Lu), were obtained from this dataset.

2.3. Data Analysis

Boxplots and scatter plots were generated in Sigmaplot 12.5 (Version 12.5, Systat Software Inc., San Jose, CA, USA). Kriging is a geostatistical method that uses the spatial dependence between sampled locations to predict attribute values at unsampled locations [30]. Semivariogram γ(h) was used to quantify the spatial autocorrelation of the soil variable using the following equation:
γ h   =   0.5 N h α = 1 N h z u α z u α + h 2
where N(h) denotes the number of pairs for a given distance class, and z(uα) − z(uα + h) describes the difference between a pair within a given distance class (h). After fitting the exponential variogram models, kriging was used to generate spatially interpolated maps of the four main soil horizons (L/Of, Oh, A, and B). To perform the ordinary kriging analyses, including the generation of an experimental semivariogram, a fitted variogram model, and the ultimate prediction map, we used the automap package [31] in R (Version 3.3.2, R Core Team, Vienna, Austria). The non-parametric Spearman’s rank correlation test was used to investigate the relationship between U and other elements and was performed with the help of SPSS (Version 10.0, SPSS Inc., Chicago, USA). To determine the significance of differences (** p ≤ 0.01, * p ≤ 0.05), Tukey’s Honest Significant Difference (HSD) and post-hoc tests were used.

3. Results

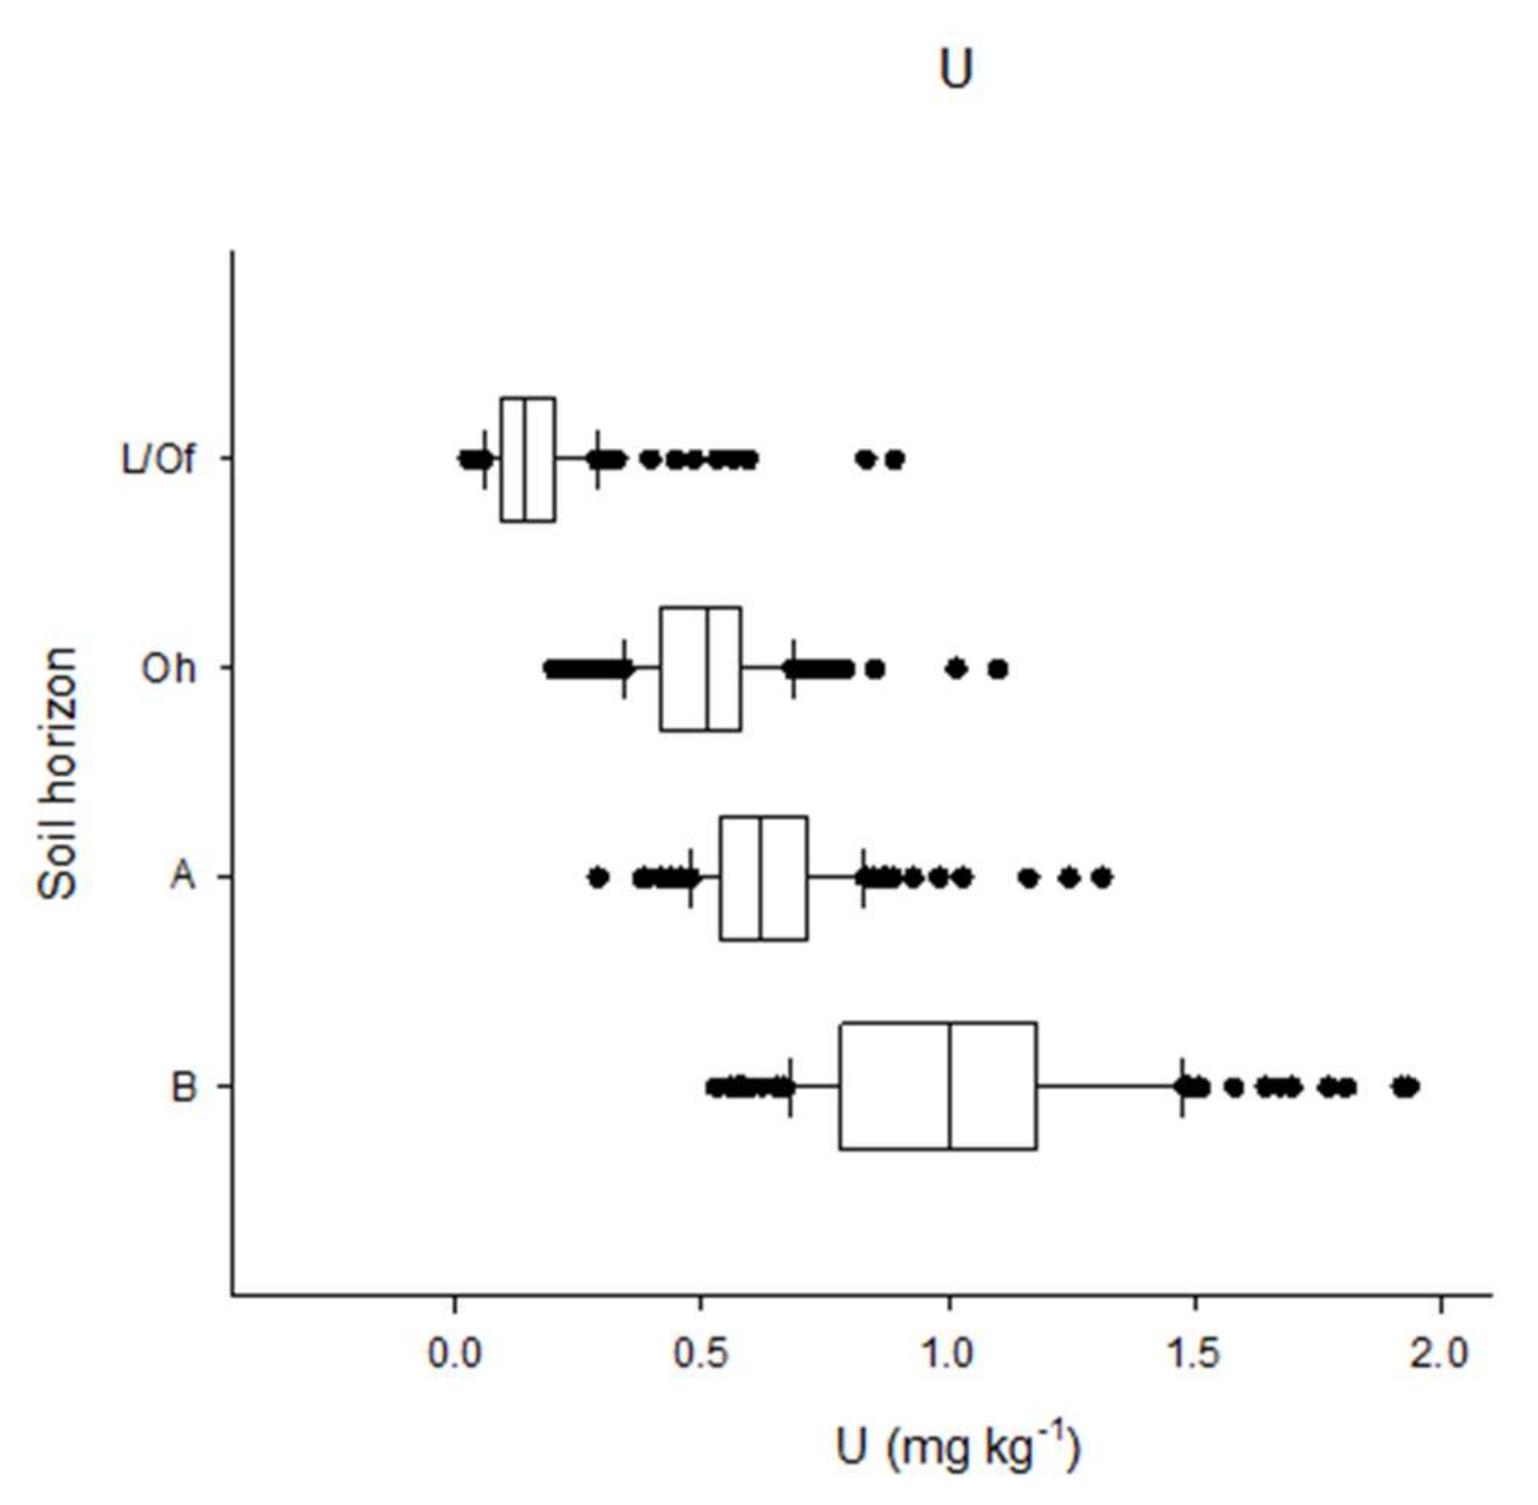
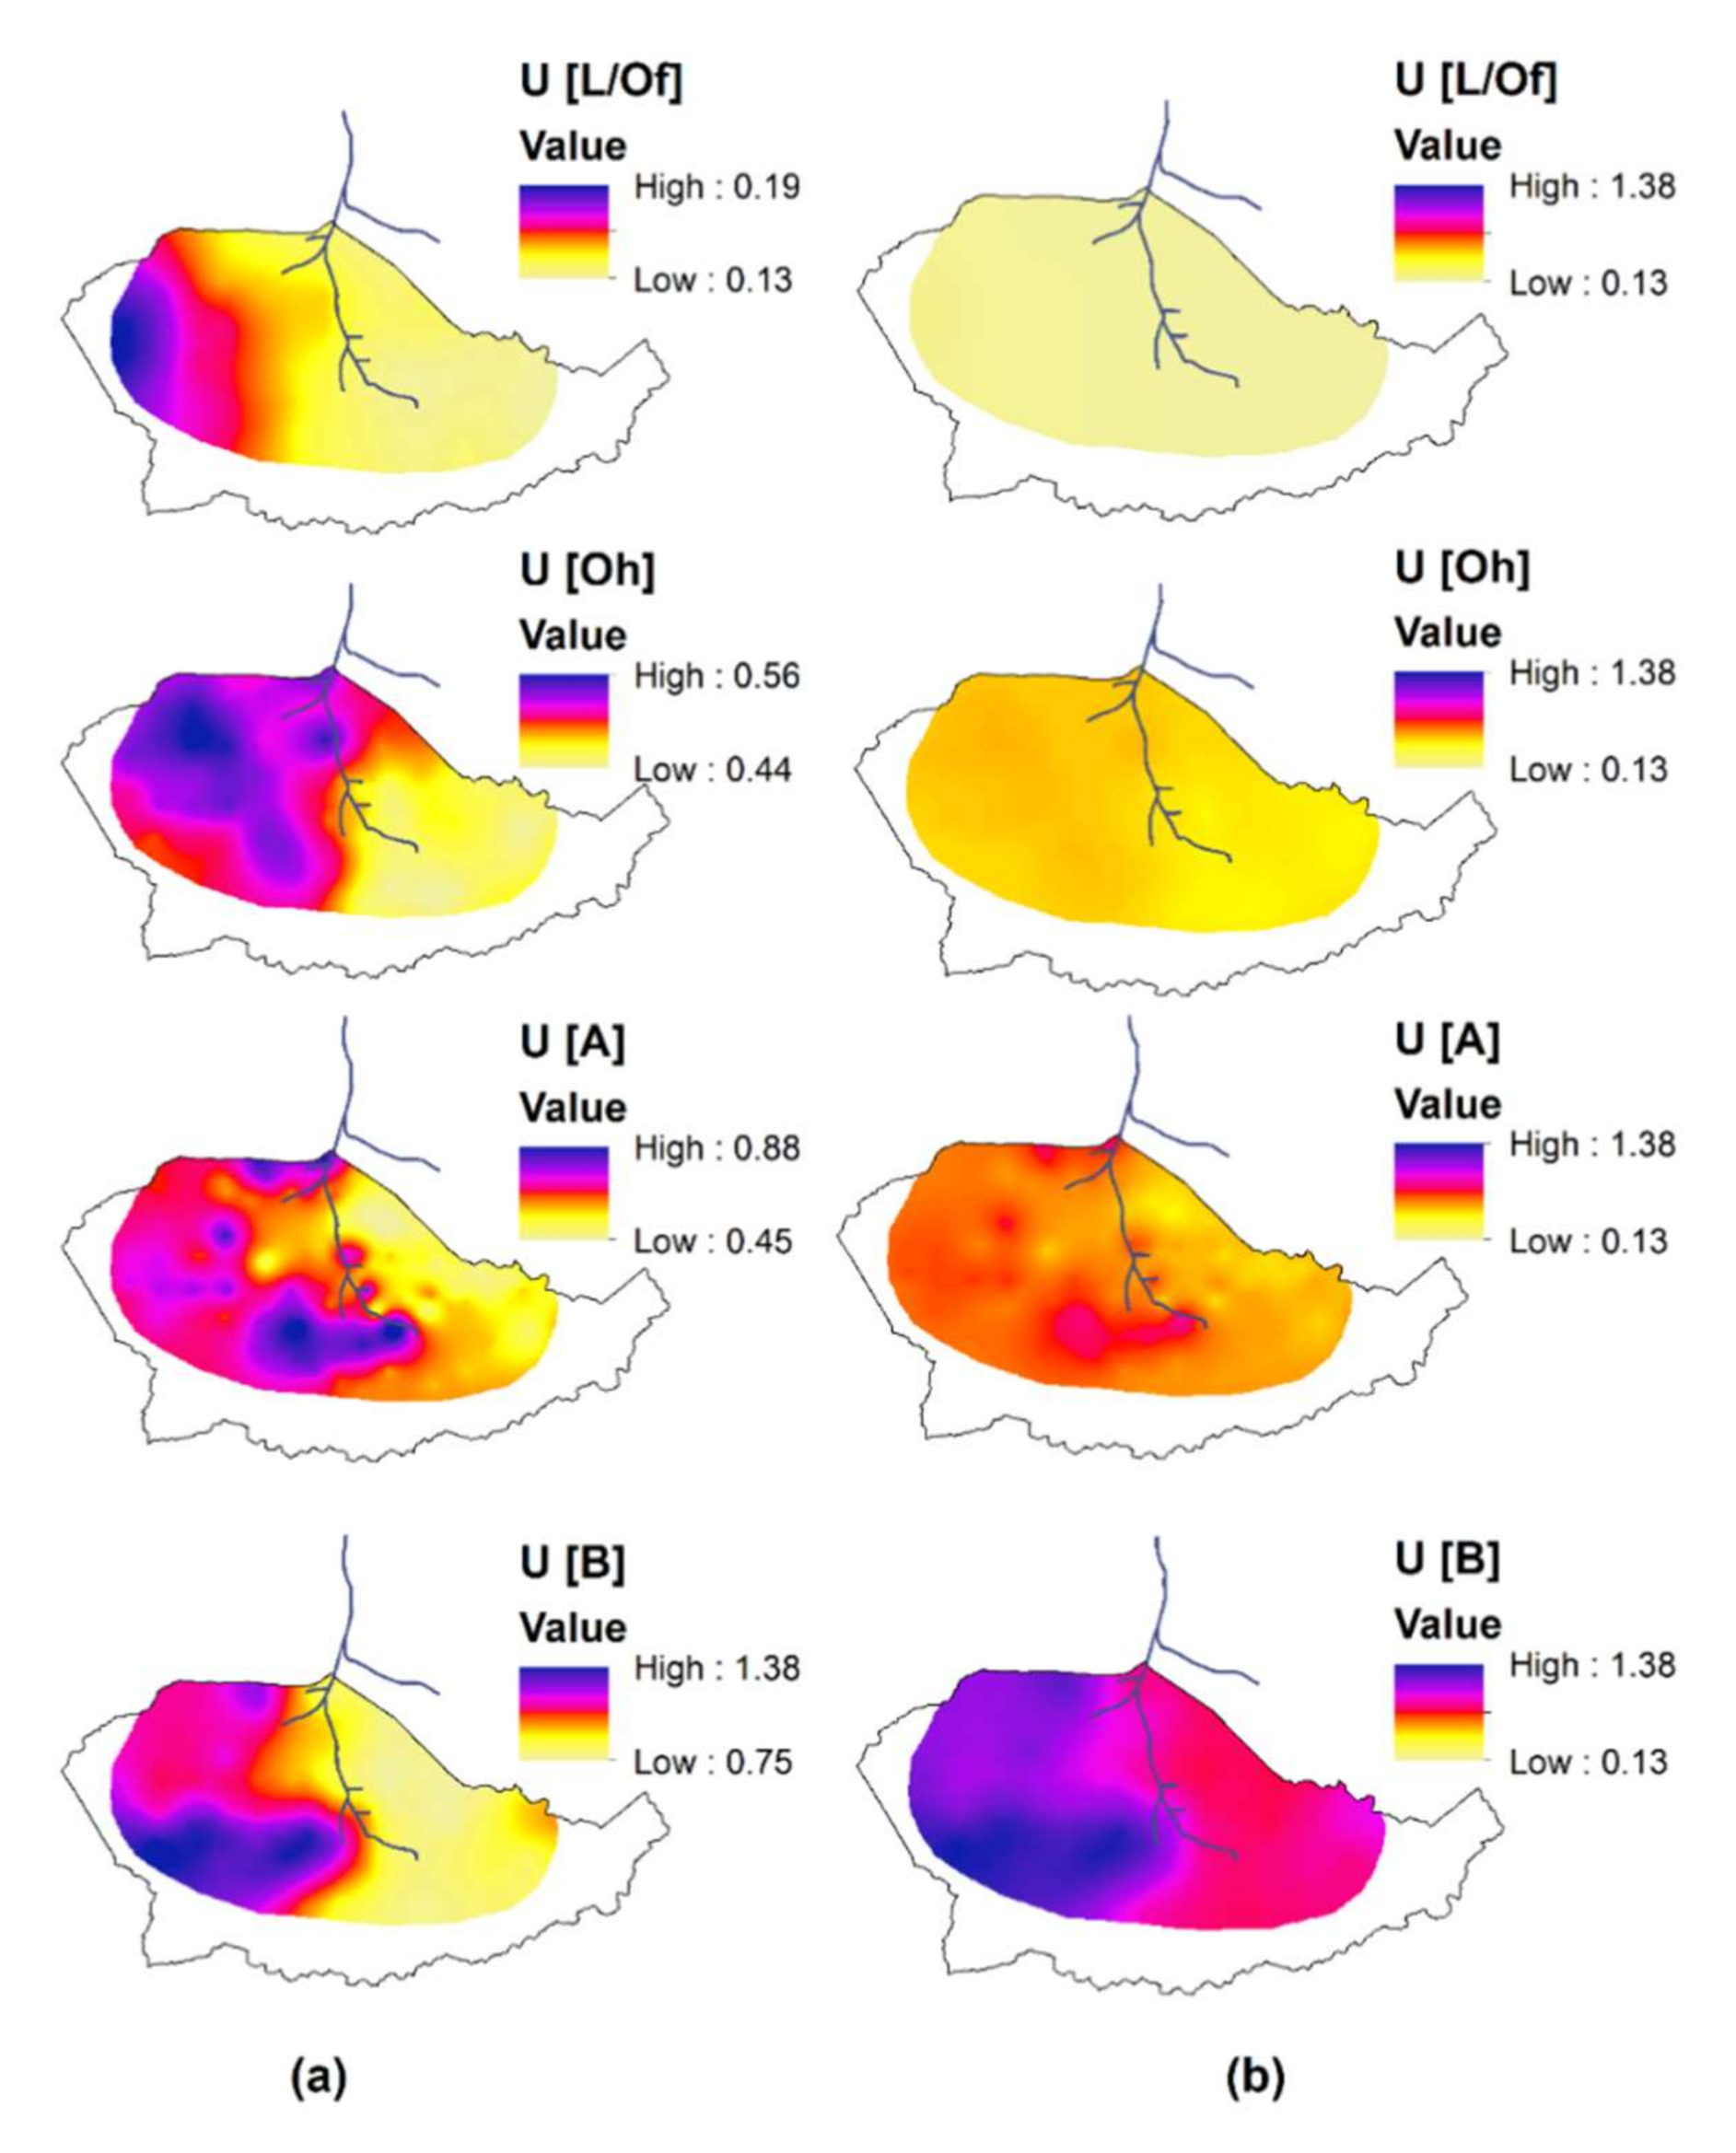
3.1. Uranium Concentration and Spatial Patterns on the Catchment Scale

Figure 2 shows ranges of U concentrations in all layers. The concentrations were generally low in L/Of horizon, with a minimum of only 0.03 mg kg−1 and a maximum of 0.9 mg kg−1. For Oh, A, and B horizons, the ranges of U concentrations were determined to be 0.2–1.1, 0.3–1.3, and 0.5–2.1 mg kg−1, respectively. The median value of U concentration increased sevenfold from the top horizon L/Of (0.14 mg kg−1) to the B horizon (1.01 mg kg−1).
Figure 3 shows spatial distribution maps of U in the four soil horizons using different color bars (a) and the same color bar (b) for all horizons; (a) provides more detailed information on the patterns found in all individual soil layers, and (b) shows the clear increase in U concentration by depth. The ranges of U concentrations in the mineral horizons (A and B) were wider than those in organic horizons L/Of and Oh. In every soil horizon, U clearly showed distinct distribution patterns on each side of the Wüstebach stream, with higher values occurring in the western areas of the catchment. Generally, no obvious differences in U concentrations were observed between the riparian zone and the surrounding area for all horizons. Only in the A horizon was U enrichment observed in the source area of the stream.

3.2. Correlations between U and Other Elements

Table 1, Table 2 and Table 3 give the overview on the correlations between U and other elements, including nutrients (TC, TN, K, P, S, Ca, Cu, Zn, Fe, Mn, Mo, Mg; Table 1), heavy metals (Cr, Co, Ni, Ga, As, Cd, Hg, Pb; Table 2), and the REEs (Y, La, Ce, Pr, Nd, Sm, Eu, Gd, Tb, Dy, Ho, Er, Tm, Yb, Lu; Table 3) in the soils of this forested ecosystem.
Significantly negative correlations with U were observed for TC, TN, and Ca in the L/Of, Oh, and A horizons (Table 1). Sulphur had a negative correlation with U in the Oh, A, and B horizons. Generally, U concentration also correlated negatively with TC, TN, K, Ca, and S, although the correlations became weak in B horizon. Potassium had a negative correlation with U in the L/Of and Oh horizons, but it was positively correlated with U in the B horizon.
Positive correlations with U were found for Fe in all four horizons, and for P and Cu in the L/Of, Oh, and B horizons. Positive correlations were also found for Mn in the Oh, A, and B horizons, and for Zn and Mg in the L/Of horizon.
Heavy elements (Cr, Co, Ni, Ga, As, Cd, Hg, Pb) generally showed positive correlations with U (Table 2). They all showed significantly positive correlations with U in the L/Of horizon. In the Oh horizon, significantly positive correlations with U were found for Cr, Co, Ni, Ga, and As, in the A horizon for Cr and Co, and in the B horizon for As, Hg, and Pb. With respect to the REEs, U always had a highly positive correlation in the L/Of, Oh, A, and B horizons (Table 3).

4. Discussion

4.1. Uranium Concentration on the Catchment Scale

Worldwide, the average soil U concentration ranges from 1.2 to 11 mg kg−1 [5]. German topsoil in uncontaminated areas was reported to have U concentrations ranging from 0.48 to 5.73 mg kg−1 with the median value of 2.58 mg kg−1 [19], which is consistent with our study in that the range of U concentration was 0.3–2.1 mg kg−1 for mineral horizons (A and B). Comparison of different horizons in our study gave the U concentration distribution in forest soil profile, also thereby providing information on enrichment or depletion processes between soil horizons. In our study, the U concentration increased consistently from the surface (L/Of) to the B horizon, which is in line with the study by Aubert et al. [32], where the U concentration increased from A1 to BC horizon in acidic soil of the Strengbach catchment in France. The study of Yoshida also found higher U concentrations in the deep horizon (0.18 mg kg−1) compared to the L horizon (0.04 mg kg−1) in Tokai forest, Japan [33]. Similar increasing tendencies of U concentrations in forest soils were also found by Taboada et al. and Utermann and Fuchs [6,22]. However, the vertical distributions of U showed a different pattern in agricultural soil compared with forest soil. Depth profiles in forest soils indicate an enrichment of U in deeper soil horizons, while in agricultural soil, topsoil usually shows higher U concentrations compared with underlying layers [34,35] due to long-term P fertilization [36].
The predominant bedrock in the study area was fractured Devonian shales. The fracture stratigraphies differ markedly in interface and mechanical properties governed by depositional, diagenetic, and structural setting. Fractures can enhance or reduce rock strength as well as burial history and diagenesis [37]. The content of U in soil was affected mainly by the nature of the bedrock and by pedological processes. Therefore, the effects of fractures are the major reason for the spatial distribution of U in the study area, in that higher U concentrations were observed in the western area compared with the eastern area.

4.2. Correlations between U and Other Elements

Negative correlations between U and macronutrient elements (TC, TN, K, S, and Ca), except P, indicate U’s low phytoavailability (the availability of heavy metal for plant uptake). The enrichment of plant nutrients in top horizons may be traced back to the element cycling within the biosphere (fast turnover and short cycle). In terrestrial systems without biomass removal (e.g., by harvesting or erosion), elements taken up by plants are ultimately returned quantitatively to near-surface soil layers via aboveground and belowground litter production [38]. Considering the low U content in the L/Of horizon, U did not appear to be bioaccumulated by spruce trees, which further indicated the low phytoavailability of U. The low bioaccumulation in vegetation was found in the CCME (2007) [18], showing that soil-plant bio-concentration factors (or concentration ratios) for U were generally less than one. The positive correlation between U and P was attributed to the formation of uranyl-phosphate complexes in the soil. Under oxidizing conditions and with pH between 4 and 7.5, uranyl-phosphate complexes are dominant [16]. For other important ligands (e.g., carbonate), uranyl-carbonate complexes are important only when pH >7.5 [13,16], and at near neutral pH and S concentrations >100 ppm, uranyl-sulfate complexes can be important [14]. The acidic soil condition could explain the positive correlation between U and P and the negative correlations between U and Ca or U and S in our study.
Trace elements, including plant nutrient elements (Fe, Cu, Mn, Mo, Zn, Mg) and others (Cr, Co, As, Pb, Ni, Ga, Hg, Cd), had positive correlations with U. The positive correlations (>0.4) between U with trace elements (Th, Rb, Be, Nb, Ta, Bi, Cs, Tl, Pr, Nd, Al) in topsoil (0–25 cm) were also found by Salminen et al. [19]. These positive correlations can be interpreted by a common source of either an anthropogenic, geogenic, or pedogenic origin [21,39]. The concentrations of trace elements in soils are largely dependent on the parent rock materials and soil formation processes without significant human interference [40]. The distribution of trace elements in soil horizons is a result of element mobility attributed to physical-chemical and biological processes. The observed positive correlations may highlight the similar transport pattern of these elements and may further suggest the same geogenic origin for U and other trace elements.
The high positive correlations between U and REEs were also found in the study of Salminen et al. [19]. Koljonen et al. found a similar distribution of uranium to that of REEs on Finland’s atlas maps [41]. The positive correlations between U and REEs may be due to the similar ionic radius [33] and the more or less same adsorption sites (e.g., organic matter, Fe oxides) [32]. The ionic radius is an important factor controlling the behavior of the element during rock formation [23]. REE concentrations in soils are primarily controlled by pedogenic parameters and the mineralogy of the REE carrier phases in the bedrock and soils. Mercadier et al. reported that REE concentration patterns in rocks were very specific to the uranium deposit type and directly reflected the conditions of their genesis [42].

5. Conclusions

The present study provided a view of U distribution in the forested Wüstebach catchment. Uranium concentration ranged from 0.03 to 2.14 mg kg−1, with medians of 0.14, 0.51, 0.62, and 1.01 mg kg−1 for the L/Of, Oh, A and B horizons, respectively, in the investigated area. Uranium concentration increased with the soil depth, showing its geogenic origin. The negative correlation between U and some macronutrients (C, N, K, S, Ca) might be due to the limited accumulation of plant-derived U in the organic-rich horizons. The consistent increase in U concentration with soil profile depth, and positive correlation with other heavy metals and REEs, clearly point to a geogenic origin of soil U in this forested catchment.

Author Contributions

Y.S. and R.B. conceived of the presented idea. Y.S. wrote the manuscript with support from B.W. and A.M.K., I.W. performed the computations with R.B. All authors have read and agreed to the published version of the manuscript.

Funding

The platform and data for this study were provided by TERENO (Terrestrial Environmental Observatories), a project that is funded by the Helmholtz-Gemeinschaft.

Acknowledgments

The authors would like to acknowledge the colleagues in IBG-3, who participated in the soil sampling campaign at the Wüstebach catchment. We acknowledge the support from Terrestrial Environment Observatories (TERENO) project funded by the Helmholtz Association.

Conflicts of Interest

The authors declare no conflict of interest.

References

  1. Nanos, N.; Martín, J.A.R. Multiscale analysis of heavy metal contents in soils: Spatial variability in the Duero river basin (Spain). Geoderma 2012, 189, 554–562. [Google Scholar] [CrossRef]
  2. Reimann, C.; Fabian, K.; Birke, M.; Filzmoser, P.; Demetriades, A.; Négrel, P.; Oorts, K.; Matschullat, J.; De Caritat, P.; Albanese, S.; et al. GEMAS: Establishing geochemical background and threshold for 53 chemical elements in European agricultural soil. Appl. Geochem. 2018, 88, 302–318. [Google Scholar] [CrossRef] [Green Version]
  3. Brugge, D.; De Lemos, J.L.; Oldmixon, B. Exposure pathways and health effects associated with chemical and radiological toxicity of natural uranium: A review. Rev. Environ. Health 2005, 20, 177–194. [Google Scholar] [CrossRef]
  4. Taylor, D.M.; Taylor, S.K. Environmental uranium and human health. Rev. Environ. Health 1997, 12, 147–158. [Google Scholar] [CrossRef]
  5. Kebata-Pendias, A.; Mukherjee, A.B. Trace Elements from Soil to Human; Springer: Berlin/Heidelberg, Germany, 2007. [Google Scholar]
  6. Utermann, J.; Fuchs, M. Uranium in German soils. In Loads and Fate of Fertilizer-Derived Uranium; Backhuys Publishers: Leiden, The Netherlands, 2008; ISBN/EAN: 978-90-5782-193-6. [Google Scholar]
  7. Environment Canada. Uranium. In Guidelines for Surface Water Quality: Inorganic Chemical Substances; Water Quality Branch, Inland Waters Directorate: Ottawa, ON, Canada, 1983. [Google Scholar]
  8. Baeza, A.; Del Rio, M.; Jimenez, A.; Miro, C.; Paniagua, J. Influence of geology and soil particle size on the surface-area/volume activity ratio for natural radionuclides. J. Radioanal. Nucl. Chem. 1995, 189, 289–299. [Google Scholar] [CrossRef]
  9. Adams, J.A.; Osmond, J.K.; Rogers, J.J. The geochemistry of thorium and uranium. Phys. Chem. Earth 1959, 3, 298–348. [Google Scholar] [CrossRef]
  10. ATSDR. Toxicological Profile for Uranium; U.S. Department of Health and Human Services: Atlanta, GA, USA, 1999.
  11. Sun, Y.; Maekawa, M.; Wu, B.; Amelung, W.; Christensen, B.T.; Pätzold, S.; Bauke, S.L.; Schweitzer, K.; Baumecker, M.; Bol, R. Non-critical uranium accumulation in soils of German and Danish long-term fertilizer experiments. Geoderma 2020, 370, 114336. [Google Scholar] [CrossRef]
  12. Bigalke, M.; Ulrich, A.; Rehmus, A.; Keller, A. Accumulation of cadmium and uranium in arable soils in Switzerland. Environ. Pollut. 2017, 221, 85–93. [Google Scholar] [CrossRef]
  13. Cumberland, S.A.; Douglas, G.; Grice, K.; Moreau, J.W. Uranium mobility in organic matter-rich sediments: A review of geological and geochemical processes. Earth Sci. Rev. 2016, 159, 160–185. [Google Scholar] [CrossRef] [Green Version]
  14. Langmuir, D. Uranium solution-mineral equilibria at low temperatures with applications to sedimentary ore deposits. Geochim. Cosmochim. Acta 1978, 42, 547–569. [Google Scholar] [CrossRef]
  15. Fayek, M.; Horita, J.; Ripley, E.M. The oxygen isotopic composition of uranium minerals: A review. Ore Geol. Rev. 2011, 41, 1–21. [Google Scholar] [CrossRef]
  16. Romberger, S.B. Transport and deposition of uranium in hydrothermal systems at temperatures up to 300 °C: Geological implications. In Uranium Geochemistry, Mineralogy, Geology, Exploration and Resources; Springer: Dordrecht, The Netherlands, 1984; pp. 12–17. [Google Scholar]
  17. Babula, P.; Adam, V.; Opatrilova, R.; Zehnalek, J.; Havel, L.; Kizek, R. Uncommon heavy metals, metalloids and their plant toxicity: A review. Environ. Chem. Lett. 2008, 6, 189–213. [Google Scholar] [CrossRef]
  18. Canadian Council of Ministers of the Environment (CCME). Canadian Soil Quality Guidelines for Uranium: Environmental and Human Health; Canadian Council of Ministers of the Environment: Hull, QC, Canada, 2007.
  19. Salminen, R.; Batista, M.J.; Bidovec, M.; Demetriades, A.; De Vivo, B.; De Vos, W.; Duris, M.; Gilucis, A.; Gregorauskiene, V.; Halamic, J.; et al. Geochemical Atlas of Europe, Part 1: Background Information, Methodology and Maps; Geological Survey of Finland: Espoo, Finland, 2005; 526p, ISBN1 951-690-921-3. ISBN2 951-690-960-4. [Google Scholar]
  20. Peukert, S.; Bol, R.; Roberts, W.; MacLeod, C.J.; Murray, P.J.; Dixon, E.R.; Brazier, R.E. Understanding spatial variability of soil properties: A key step in establishing field- to farm-scale agro-ecosystem experiments. Rapid Commun. Mass Spectrom. 2012, 26, 2413–2421. [Google Scholar] [CrossRef] [Green Version]
  21. Martín, J.A.; Nanos, N.; Grau, J.M.; Sanchez, L.G.; López-Arias, M. Multiscale analysis of heavy metal contents in Spanish agricultural topsoils. Chemosphere 2008, 70, 1085–1096. [Google Scholar] [CrossRef] [Green Version]
  22. Taboada, T.; Cortizas, A.M.; García, C.; Garcia-Rodeja, E. Uranium and thorium in weathering and pedogenetic profiles developed on granitic rocks from NW Spain. Sci. Total Environ. 2006, 356, 192–206. [Google Scholar] [CrossRef]
  23. Yoshida, S.; Muramatsu, Y.; Tagami, K.; Uchida, S. Concentrations of lanthanide elements, Th, and U in 77 Japanese surface soils. Environ. Int. 1998, 24, 275–286. [Google Scholar] [CrossRef]
  24. Bogena, H.R.; Herbst, M.; Huisman, J.A.; Rosenbaum, U.; Weuthen, A.; Vereecken, H. Potential of wireless sensor networks for measuring soil water content variability. Vadose Zone J. 2010, 9, 1002–1013. [Google Scholar] [CrossRef] [Green Version]
  25. Zacharias, S.; Bogena, H.; Samaniego, L.; Mauder, M.; Fuß, R.; Pütz, T.; Frenzel, M.; Schwank, M.; Baessler, C.; Butterbach-Bahl, K.; et al. A network of terrestrial environmental observatories in Germany. Vadose Zone J. 2011, 10, 955–973. [Google Scholar] [CrossRef] [Green Version]
  26. IUSS Working Group. World Reference Base for Soil Resources; World Soil Resources Report 103; FAO: Rome, Italy, 2006. [Google Scholar]
  27. Rosenbaum, U.; Bogena, H.R.; Herbst, M.; Huisman, J.A.; Peterson, T.J.; Weuthen, A.; Western, A.W.; Vereecken, H. Seasonal and event dynamics of spatial soil moisture patterns at the small catchment scale. Water Resour. Res. 2012, 48, 10. [Google Scholar] [CrossRef] [Green Version]
  28. Gottselig, N.; Wiekenkamp, I.; Weihermüller, L.; Brüggemann, N.; Berns, A.E.; Bogena, H.R.; Borchard, N.; Klumpp, E.; Lücke, A.; Missong, A.; et al. A three-dimensional view on soil biogeochemistry: A dataset for a forested headwater catchment. J. Environ. Qual. 2017, 46, 210–218. [Google Scholar] [CrossRef]
  29. Wu, B.; Wiekenkamp, I.; Sun, Y.; Fisher, A.; Clough, R.; Gottselig, N.; Bogena, H.; Pütz, T.; Brüggemann, N.; Vereecken, H.; et al. A dataset for three-dimensional distribution of 39 elements including plant nutrients and other metals and metalloids in the soils of a forested headwater catchment. J. Environ. Qual. 2017, 46, 1510–1518. [Google Scholar] [CrossRef]
  30. Goovaerts, P. Geostatistical tools for characterizing the spatial variability of microbiological and physico-chemical soil properties. Biol. Fertil. Soils 1998, 27, 315–334. [Google Scholar] [CrossRef] [Green Version]
  31. Hiemstra, P.H.; Pebesma, E.J.; Twenhöfel, C.J.W.; Heuvelink, G.B.M. Real-time automatic interpolation of ambient gamma dose rates from the Dutch Radioactivity Monitoring Network. Comput. Geosci. 2009, 35, 1711–1721. [Google Scholar] [CrossRef]
  32. Aubert, D.; Probst, A.; Stille, P. Distribution and origin of major and trace elements (particularly REE, U and Th) into labile and residual phases in an acid soil profile (Vosges Mountains, France). Appl. Geochem. 2004, 19, 899–916. [Google Scholar] [CrossRef] [Green Version]
  33. Yoshida, S.; Muramatsu, Y. Determination of major and trace elements in mushroom, plant and soil samples collected from Japanese forests. Int. J. Environ. Anal. Chem. 1997, 67, 49–58. [Google Scholar] [CrossRef]
  34. Ahmed, H.; Young, S.D.; Shaw, G. Factors affecting uranium and thorium fractionation and profile distribution in contrasting arable and woodland soils. J. Geochem. Explor. 2014, 145, 98–105. [Google Scholar] [CrossRef]
  35. Huhle, B.; Kummer, S.; Merkel, B. Mobility of uranium from phosphate fertilizers in sandy soils. In Loads and Fate of Fertilizer-Derived Uranium; Backhuys Publishers: Leiden, The Netherlands, 2008; pp. 47–57. [Google Scholar]
  36. Sun, Y.; Amelung, W.; Gudmundsson, T.; Wu, B.; Bol, R. Critical accumulation of fertilizer-derived uranium in Icelandic grassland Andosol. Environ. Sci. Eur. 2020, 32, 1–7. [Google Scholar] [CrossRef]
  37. Gale, J.F.; Laubach, S.E.; Olson, J.E.; Eichhubl, P.; Fall, A. Natural Fractures in shale: A review and new observations. AAPG Bull. 2014, 98, 2165–2216. [Google Scholar] [CrossRef]
  38. Jobbágy, E.G.; Jackson, R.B. The distribution of soil nutrients with depth: Global patterns and the imprint of plants. Biogeochemistry 2001, 53, 51–77. [Google Scholar] [CrossRef]
  39. Davis, H.T.; Aelion, C.M.; McDermott, S.; Lawson, A.B. Identifying natural and anthropogenic sources of metals in urban and rural soils using GIS-based data, PCA, and spatial interpolation. Environ. Pollut. 2009, 157, 2378–2385. [Google Scholar] [CrossRef] [Green Version]
  40. Adriano, D. Trace Elements in Terrestrial Environments: Biogeochemistry, Bioaccessibility and the Risk of Metals, 2nd ed.; Springer: New York, NY, USA, 2001. [Google Scholar]
  41. Koljonen, T.; Darnley, A.G. The Geochemical Atlas of Finland—Part 2: Till. Econ. Geol. Bull. Soc. Econ. Geol. 1994, 89, 211. [Google Scholar]
  42. Mercadier, J.; Cuney, M.; Lach, P.; Boiron, M.-C.; Bonhoure, J.; Richard, A.; Leisen, M.; Kister, P. Origin of uranium deposits revealed by their rare earth element signature. Terra Nova 2011, 23, 264–269. [Google Scholar] [CrossRef]
Figure 1. Distribution of soil sampling locations in the Wüstebach catchment. Adjusted from Gottselig et al. [28]. Resolution of the soil map: 1:2500.
Forests 11 01351 g001
Figure 2. Boxplot showing depth profile of U in the Wüstebach catchment.
Forests 11 01351 g002
Figure 3. Spatial distribution of U in the catchment area for the four principal soil horizons (L/Of, Oh, A, and B, top to bottom rows) using ordinary kriging, represented using (a) different color bars, and (b) one color bar for all horizons. Notice the individual legend for each horizon for U (mg kg−1) concentration distributions. Extreme outliers were identified in R (Version 3.3.2, R Core Team, Vienna, Austria) by setting the upper and lower limits as the quartile (lower or upper) plus or minus three times the inter quartile range.
Forests 11 01351 g003
Table 1. Spearman correlation coefficients on the association between nutrient elements concentration and U concentration for the four horizons (L/Of, Oh, A, and B). Significant differences were indicated by ** p ≤ 0.01, * p ≤ 0.05.
L/OfOhAB
TC−0.76 **−0.34 **−0.65 **−0.15
TN−0.17 *−0.28 **−0.65 **-0.02
K−0.31 **−0.37 **−0.230.26 **
Ca−0.32 **−0.31 **−0.60 **0.35 **
S0.07−0.38 **−0.63 **−0.18 *
P0.16 *0.20 *−0.070.40 **
Mg0.63 **0.120.15−0.32 **
Fe0.87 **0.51 **0.58 **0.23 **
Cu0.68 **0.35 **0.090.59 **
Mn−0.470.17 *0.64 **0.20 *
Mo0.63 **0.10−0.130.42 **
Zn0.31 **0.100.390.07
P0.16 *0.20 *−0.070.40 **
Mg0.63 **0.120.16−0.32 **
Table 2. Spearman correlations coefficients on the association between heavy elements concentration and U concentration for the four horizons (L/Of, Oh, A, and B). Significant differences were indicated by ** p ≤ 0.01, * p ≤ 0.05.
L/OfOhAB
Cr0.87 **0.47 **0.55 *0.12
Co0.84 **0.30 **0.55 *0.14
As0.86 **0.47 **−0.200.28 **
Pb0.74 **0.24 **−0.410.23 **
Ni0.74 **0.42 **0.23−0.03
Ga0.54 **0.36 **0.036−0.11
Hg0.33 **−0.05−0.220.40 **
Cd0.46 **−0.003−0.150.16
Table 3. Spearman correlations coefficients on the association between rare earth elements (REEs) concentration and U concentration for the four horizons (L/Of, Oh, A, and B). Significant differences were indicated by ** p ≤ 0.01, * p ≤ 0.05.
L/OfOhAB
La0.93 **0.70 **0.25 **0.35 **
Ce0.93 **0.74 **0.25 **0.52 **
Pr0.93 **0.78 **0.19 *0.45 **
Nd0.92 **0.79 **0.32 **0.47 **
Sm0.93 **0.80 **0.39 **0.54 **
Eu0.93 **0.77 **0.42 **0.52 **
Gd0.94 **0.76 **0.30 **0.61 **
Tb0.93 **0.77 **0.48 **0.74 **
Dy0.94 **0.77 **0.63 **0.78 **
Ho0.92 **0.75 **0.67 **0.78 **
Er0.93 **0.74 **0.57 **0.80 **
Tm0.93 **0.67 **0.68 **0.82 **
Yb0.93 **0.73 **0.66 **0.83 **
Lu0.92 **0.69 **0.69 **0.82 **
Publisher’s Note: MDPI stays neutral with regard to jurisdictional claims in published maps and institutional affiliations.

