Article

Tensile Properties of Natural and Synthetic Rattan Strips Used as Furniture Woven Materials

1
Jiangsu Co-Innovation Center of Efficient Processing and Utilization of Forest Resources, Nanjing Forestry University, Nanjing 210037, China
2
College of Furnishings and Industrial Design, Nanjing Forestry University, Nanjing 210037, China
3
Department of Sustainable Bioproducts, Mississippi State University, Hood Road, MS 39762, USA
*
Author to whom correspondence should be addressed.
Forests 2020, 11(12), 1299; https://doi.org/10.3390/f11121299
Submission received: 5 November 2020 / Revised: 27 November 2020 / Accepted: 1 December 2020 / Published: 3 December 2020
(This article belongs to the Section Wood Science and Forest Products)

Abstract

:
This study investigated factors on tensile properties of rattan strips commonly used as woven materials for furniture. The factors were rattan type (bast, core, synthetic), gauge length (100, 140 mm), and unit loading speed (0.1, 0.2, 0.3, 0.4, 0.5 mm/min/mm). Experimental results indicated that natural bast and core rattan strips, when subjected to tensile loading, behaved like synthetic rattan strips in terms of their stress-strain curves showing excessive plastic deformation. There was no significant difference in ultimate tensile strain between bast and synthetic rattan strips. Bast rattan strips had the highest ultimate tensile strength and modulus of elasticity among three materials evaluated in this study, followed by core rattan and synthetic strips. The major tensile properties of natural rattan bast strips can be influenced by their gauge length adapted to their evaluation test. Unit loading speeds, in general, had no significant effects on the major tensile properties of natural bast rattan strips but tended to significantly effect the ultimate strength of synthetic rattan strips, while less significantly for strengths at the proportional limit and yield point.

1. Introduction

Natural rattan strips (NRSs) are widely woven into seat and back supporting surfaces of seating furniture through traditional handicraft techniques and simple weaving machinery. NRSs can provide flexible, lightweight, breathable, comfortable, and durable support to sitters [1]. In addition, NRSs also can be used to wrap around the connections of furniture frames as external structural reinforcement and decoration as well [2].
There are two types of NRSs: bast and core. Bast rattan strips are cut from the outer stem edge of rattan plants like Calamus manan Miq. with or without rattan stems’ epidermis removed. Core rattan strips are cut from the stem pith portion of rattan plants. These rattan strips have various shapes in their cross-sections, such as flat, round, half-round, and triangular [3,4,5].
Mechanical properties of NRSs such as tensile properties can significantly affect the structural performances of woven surfaces and components’ connections in furniture construction [1,2,6,7]. Tensile properties of NRSs should be taken into account and investigated. Therefore, these tensile properties of NRSs can be incorporated into the design process of seating products using these natural rattan materials.
A large amount of literature can be found related to the investigation of the tensile, compression, bending, and other mechanical properties of a variety of NRSs and factors on these properties [8,9,10,11,12,13]. Table 1 summarizes the literature related to the tensile properties of different species of NRSs from different origins like Indonesia and China. These studies indicated that there was a wider range of tensile strength values about NRSs. Moreover, it was found that there was no unified standard for testing the mechanical properties of NRSs. In particular, there was no standardized procedure for investigating major factors on mechanical properties of NRSs such as rattan type (bast, core), cross-section size and shape of rattan materials, loading speed, etc. Specifically, there was no study found on the strength performance evaluation of NRSs.
Synthetic rattan strips (SRSs) are becoming popular for replacing NRSs because of the limited supply of NRSs. SRSs commonly seen on the market are manufactured mainly of thermoplastic materials like high-density polyethylene (HDPE), polyethylene (PE), polyvinyl chloride (PVC) through using a plastic extruder at high possessing temperature. SRSs can offer good properties such as strength, toughness, flexibility, waterproof, weather-resistant, outdoor durability and elimination of risk to insect bite as furniture weaving materials [14]. SRSs also got their name of “industrially man-made rattan” because these materials can imitate various surface features of SRSs like grain, color, etc., and also have different profiles of their cross-sections like a flat, round, triangle, etc. Till now, there is a lack of special research on the mechanical properties of SRSs in rattan woven furniture.
This research aimed to evaluate the static tensile properties of NRSs and SRSs in rattan woven furniture. Specific objectives were to: (1) evaluate rattan material type effects on their tensile properties; (2) investigate unit test loading speed and rattan gauge length effects on tensile properties of NRSs; (3) investigate unit test loading speed effects on tensile properties of SRSs. It was believed that the findings from this study could provide basic information for future rattan material property performance evaluation research. In addition, the strength design of rattan woven furniture in chair surface supporting and connection wrapping can benefit from the findings.

2. Materials and Methods
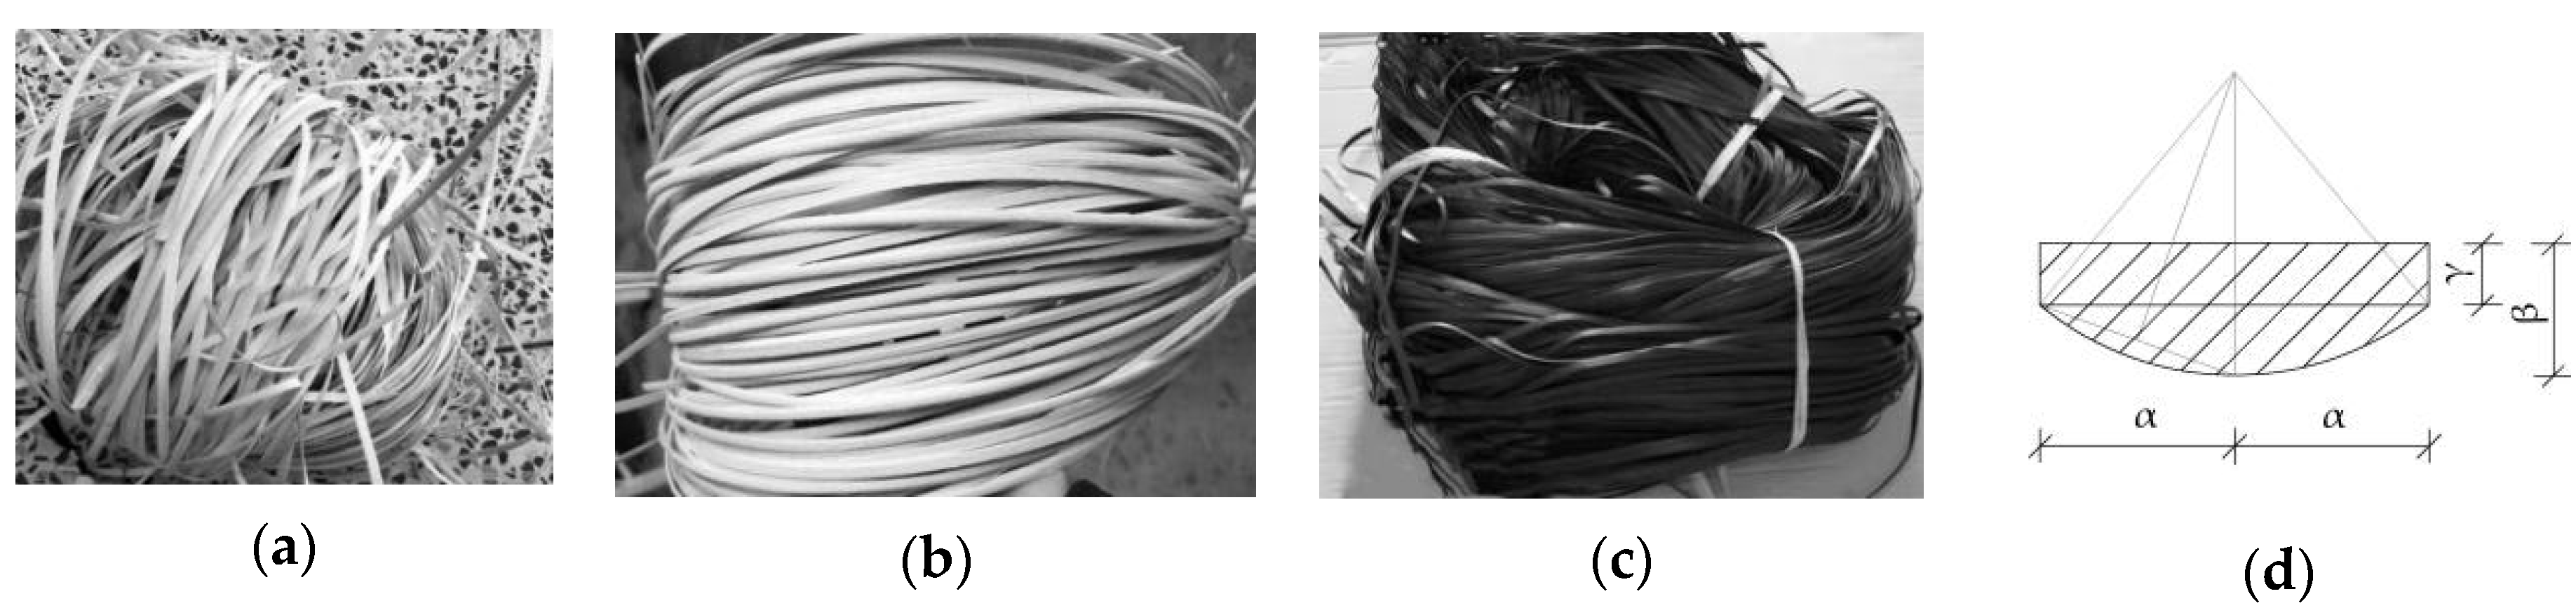
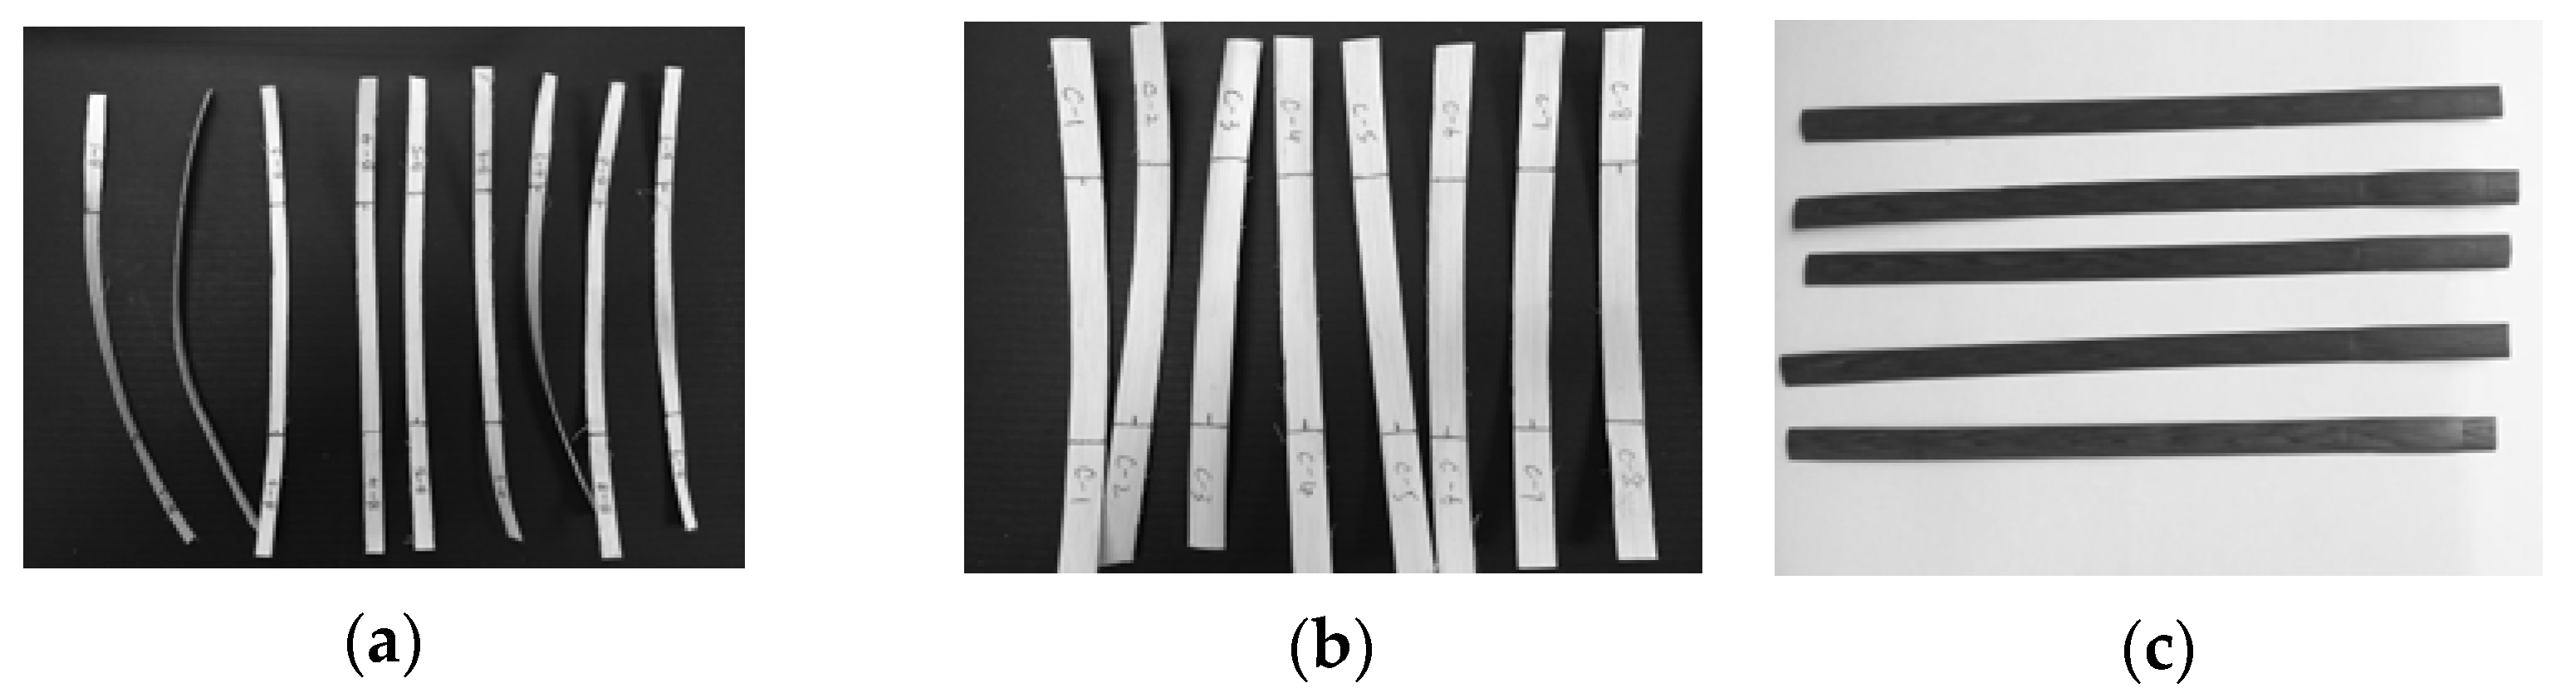
2.1. Materials

The species of NRSs used in this study was the Rattan manau (Calamus manan Miq.), provided by Boxuan Rattan Furniture Co., Ltd. (Nanjing, China). Specifically, rattan bast and core strips (Figure 1a,b) had their dimensions measured 6 mm wide by 1 mm thick and 9 mm wide by 2 mm thick in their cross-sections, respectively. These materials are originally from Indonesia and commercially available in Asian markets.
SRSs (Figure 1c) used in this study were purchased from Hongbo Plastic Industry Co., Ltd. (Hangzhou, China). These SRSs were extruded at two-stage processing temperatures of 170 °C and 200 °C using plastics’ mixtures of LDPE, propylene (5502), and PE (linear 7042) with their mass ratio of 5:3:2. SRSs were 8 mm wide by 1 mm thick in their cross-section.

2.2. Cross-Sectional Area Calculation

The cross-section of three types of rattan strips had a flat side and an arc-shape on the other side (Figure 1d). The cross-sectional area was equal to the sum of the area of the rectangular cross-section and the area of the circular segment. Moreover, the area of the circular segment can be presented as the area of the circular sector minus the area of the triangle. The cross-sectional area, S (mm2), can be calculated using the following formulas:
S = α ( β + γ ) + π ( 90 a r c α β γ ) [ α 2 + ( β γ ) 2 ] 360 cos 2 a r c α β γ α α 2 + ( β γ ) 2 2 cos a r c α β γ
where α is half the width of a rattan strip (mm); β is the overall thickness of a rattan strip (mm); γ is the thickness of the rectangular cross-section of a rattan strip (mm).

2.3. Experimental Design

Test 1 was a one-factor unbalanced factorial experiment with 30, 30, and 10 replicates for natural bast and core, and synthetic rattan strips, respectively. The experiment was designed to evaluate rattan type (bast, core, synthetic) effects on major tensile properties of rattan strips such as tensile strengths and strains at the proportional limit, yield point, ultimate point, and modulus of elasticity (MOE) in tension. A fixed unit loading speed of 0.3 mm/min/mm was considered for NRSs, while a fixed unit loading speed of 0.4 mm/min/mm was for SRSs. In addition, a fixed rattan gauge length of 100 mm [15,16,17] was used. Gauge length is the distance between the lower surface of a grip upper part and the upper surface of a grip lower part that holds a rattan strip (Figure 2). The unit loading speed refers to the ratio of the loading speed of a test machine to the gauge length of a tested rattan strip.
Test 2 was a complete 2 × 4 factorial experiment with 10 replicates designed to evaluate two factors on major tensile properties of natural rattan bast strips such as ultimate tensile strength, MOE, and failure strain. The factors were gauge length (100, 140 mm) and unit loading speed (0.1, 0.2, 0.3, 0.4 mm/min/mm).
Test 3 was a complete one-factor factorial experiment with 5 replicates designed to evaluate unit loading speed effects on major mechanical properties of SRSs such as tensile strengths and strains at the proportional limit, yield point, ultimate point, and MOE. The unit loading speed had five levels of 0.1, 0.2, 0.3, 0.4, 0.5 mm/min/mm. A fixed gauge length of 100 mm was considered for this experiment.

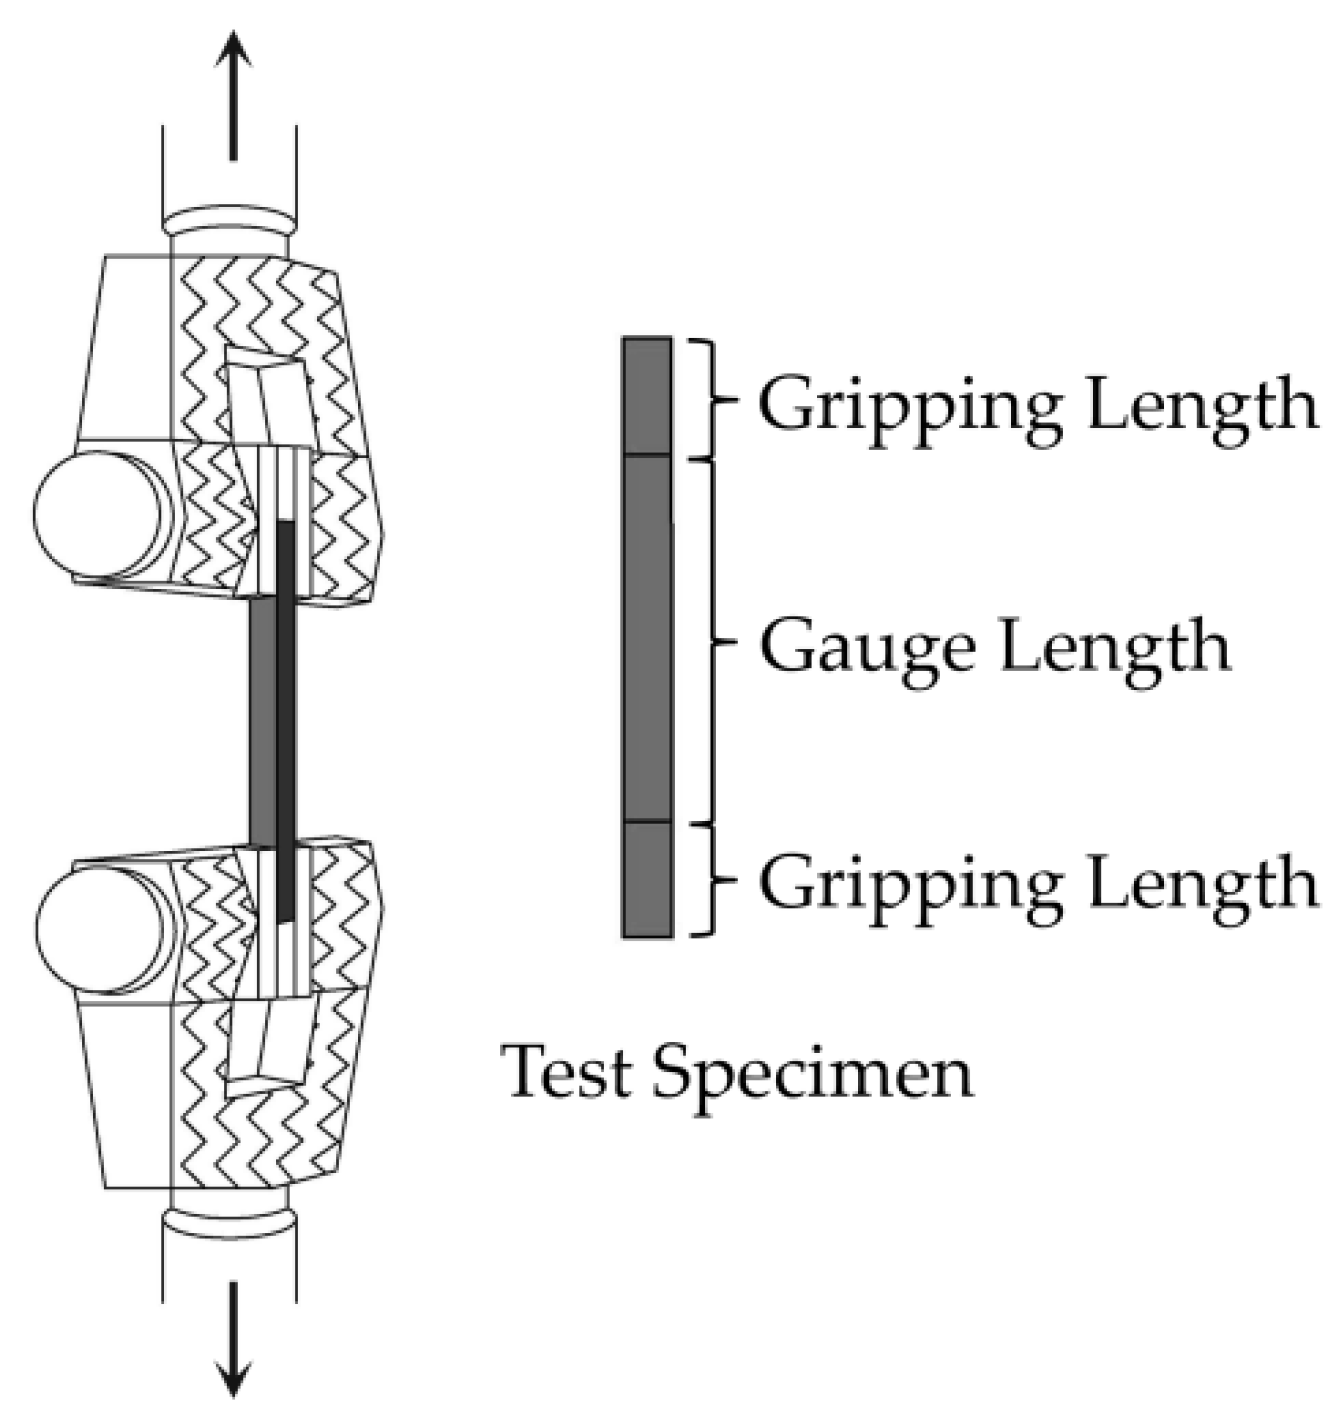
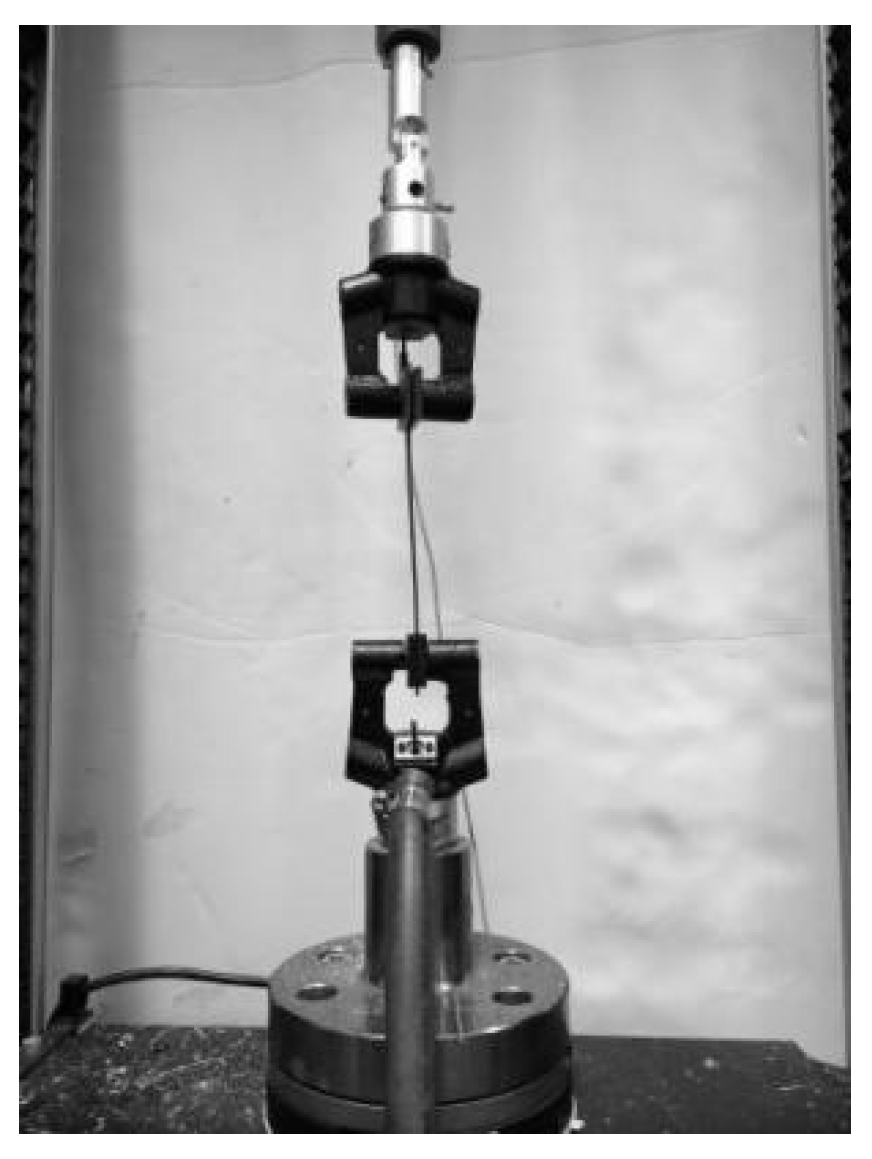
2.4. Experimental Preparation and Testing

Two length groups of 160 mm and 200 mm for bast strips and one length group of 160 mm for core strips were prepared by cutting two NRSs’ rolls. The grip length of 30 mm at each of two gripping heads [15,16] was considered. One length 200 mm for SRSs considering the grip length of 50 mm at each of two gripping heads [16] was prepared through cutting its roll. Evaluated rattan strips for tests 1, 2, and 3 were randomly selected from these prepared supplies (Figure 3), respectively. In general, selected strips were free of visible defects such as cracks, scratches, and burrs.
All rattan strips were conditioned in an environment with an ambient temperature of 25 ± 2 ℃ and relative humidity of 40 ± 2% for over 48 h prior to testing. The width and thickness of a rattan strip were measured at three locations within the gauge length (Figure 1d) using an electronic digital caliper right before tensile testing. The average cross-sectional area of a rattan strip was calculated using formulas [1].
All tensile tests were performed on a universal-testing machine (INSTRON 5566, Instron Corp., Norwood, MA, USA) (Figure 4) in accordance with the procedure outlined in Chinese National Standards (CNS) GB/T 1938–2009 [15] and GB/T 15780-1995 [16] for NRSs and American Society of Testing Materials (ASTM) D882-2012 [17] for SRSs, respectively. All NRSs were loaded until a fracture breakage occurred to the strips, while all SRSs were tested till reaching a strain level of 20% because it was observed that in general, the stress-strain curve of a tested SRS became flatten after reaching this strain level without a fracture breakage occurring. Failure modes and load-elongation curves of all tested strips were recorded.
The stress-strain curve of each tested rattan strip was plotted based on its recorded load-elongation curve. The critical tensile stresses of σpl at the proportional limit, σy at yield point, and σu at the ultimate point, (MPa), of a tested rattan strip, was calculated using the following formulas:
σ = P / S
where P is the test tensile load at each critical point as determined from load-elongation curves (N); S is the average cross-sectional area (mm2) of a tested rattan strip.
The critical tensile strains of εpl at the proportional limit, εy at yield point, and εu at the ultimate point, (%), of a tested rattan strip, were calculated using the following formulas:
ε = Δ L L 0 × 100
where ΔL is the elongation of a tested rattan strip measured (mm); L0 is the gauge length (mm) of a tested rattan strip.
The yield stress of a tested rattan strip was determined by fitting a straight line to the initial linear portion of the stress-strain curve, offsetting this line by a strain equal to 0.2% [18]. The MOE of a tested rattan strip, E (MPa), was derived based on the calculation of the slope of a best-fit line of the initial linear portion on its stress-strain curve. All NRSs broken or failed outside gauge length region like at grip contact points were discarded for ultimate strength and strain calculation, but saved for proportional limit, yield stress, and MOE calculation. There was no any tensile breakage occurring to SRSs observed. Therefore, the point of starting the flatten curve on a stress-strain curve was considered as the ultimate point for an SRS.
Moisture content (MC) of each tested NRS was measured right after the tensile test was completed. Images were taken for fracture surfaces of rattan strips using scanning electron microscopy (SEM, Quanta 200, FEI, Hillsboro, OR, USA) with fracture surfaces sputter coated with gold [19].

2.5. Statistical Analyses

For a one-factor experiment, mean comparisons of each mechanical property for the factor investigated were performed. The protected least significant difference (LSD) multiple comparisons procedure was considered if a balanced rattan strip number was found. The least-squares mean (LSMEAN) multiple comparisons procedure was considered if an unbalanced rattan strip number was found.
For a two-factor experiment, two-factor analysis of variance (ANOVA) general linear model (GLM) procedure (SAS Software, SAS Institute Inc., Cary, NC, USA) was performed first for each of the tensile properties of NRSs to analyze main effects and their interactions on those tensile properties. If the ANOVA result indicated a significant interaction, then the LSD multiple comparisons procedure was performed for a balanced number of tested rattan strips, while using the LSMEAN multiple comparisons procedure was performed for an unbalanced number of tested rattan strips. Otherwise, the main effects were concluded. All statistical analyses in this study were performed at the 5% significance level.

3. Results and Discussions

3.1. Rattan Type Effects

Failure modes and locations. Three typical failure modes observed in test 1 were: splintering tension, brash tension, and combined splintering and brash tension (Figure 5). Figure 6 and Figure 7 show SEM images of tensile fracture surfaces and cross-sections of NRSs. Figure 8 summarizes the major locations of NRSs failed. No fracture failure modes were observed in SRSs, but a localized yield necking mode was observed for all SRSs (Figure 5g).
Table 2 indicates that 43.3% of bast strips failed in brash tension, while 30% of bast strips failed in splintering tension and 26.7% of bast strips failed in combination tension because of their underdeveloped and unevenly distributed vascular bundles in the epidermis of bast strips [20]. Specifically, Figure 7a indicated that the bark section of bast strips had more vascular bundles (i.e., higher fiber ratio) than the inner section. It was observed that bast strips failed with fibers’ fractured first in the cross-section with less vascular bundles, followed by the resisting load lost because fractured fibers were transferred from the interface to the adjacent rattan fibers through shear forces. The cracking expanded along the fracture surface when shear forces exceeded the interface strength. Table 2 also indicates that 73.3% of core strips failed in brash tension, only 6.7% and 20% failed in splintering tension and combination tension, respectively. Figure 7b indicated that the vascular bundles of core strips were fully developed and evenly distributed, leading in that the tensile stress was uniformly distributed on the cross-section of core strips. This resulted in most core strips failed in the middle of gauge length with brash tension mode. These indicated that failure modes of natural rattan strips subjected to tension are related to the distribution of vascular bundles.
Under tensile loadings, NRSs failed mainly at two locations: strip broken at grips and within strip gauge length (Figure 8). The location within strip gauge length included strip broken near grips, strip broken in the middle of the gauge length, strip broken off gauge length center, and strip broken within entire gauge length. Table 2 summarizes numbers of NRSs failed at each of two locations within each of the three failure modes. 53.3% of the core and 63.3% of bast strips failed in the middle of the strip gauge length. 3.3% of the core and 23.3% of bast strips failed within the entire gauge length. 13.3% of the core and 10% of bast strips failed near grips. 23.3% of core strips failed off gauge length center.
Stress-strain curves. Figure 9 shows three typical stress-strain curves for each of three types of rattan strips evaluated in test 1. In general, three regions can be identified for NRSs: an initial long straight linear region indicating elastic deformation, a long uptrend curvilinear region indicating excessive plastic deformation, and a post-failure fracture region showing a sharp drop in stress when the stress reached its upper limit, i.e., the ultimate stress σu. The long uptrend curvilinear region indicated that the load-deformation behavior of NRSs was similar to plastic materials because of the large fiber filament angle (MFA) in cell tissues [13]. Only two regions could be identified for SRSs: an initial short straight linear region and a long slower uptrend curvilinear region. This curvilinear region indicated excessive plastic deformation without an obvious post-fracture failure.
Tensile properties. Table 3 andTable 4 summarize mean values of tensile strengths, including MOE and tensile strains of rattan strips evaluated in test 1, respectively. Mean comparisons of strength, MOE, and strain for rattan type performed using the LSMEAN multiple comparisons procedure are also summarized in Table 3 and Table 4, respectively.
Mean comparisons of tensile strengths (Table 3) indicated that bast strips had significantly higher ultimate tensile strength and MOE than core ones, followed by significantly lower ultimate tensile strength and MOE of synthetic strips. The mean ultimate tensile strength of bast strips was 1.2 and 3.4 times of the one of core and synthetic, respectively. The MOE of bast strips was 1.2, 3.8 times of core ones and synthetic ones on average, respectively. The significant difference in ultimate tensile strength between bast and core strips can be mainly because of denser vascular bundles and fibers in bast (Figure 7a) than core strips (Figure 7b) [4,5,8,9,10]. The significantly lower MOE of core than bast strips can also be explained by the observation of differences in vascular bundles and fibers’ distribution. There was no significant difference in strengths at the proportional limit and yield point between bast and core strips. The strengths at proportional limit and yield point of NRSs were significantly higher than SRSs, i.e., about 3 times of SRSs. In general, the ultimate tensile strength of each of three evaluated rattan strips was significantly higher than its corresponding yield strength, followed by significantly lower strength at the proportional limit. Specifically, the tensile yield strength of each of three rattan strips was 1.2 times its corresponding tensile strength at proportional limits, while the ultimate tensile strength was about 2 times its corresponding strength at the proportional limit.
Table 4 indicated that there was no significant difference in strains among three types of rattan strips at proportional limit and yield point. At the ultimate point, the strain of SRSs was higher than the one of bast rattan strips, but not significant, and core rattan strips had a significantly lower strain than bast and SRSs, i.e., about half of SRSs. Both NRSs and SRSs had higher strains at the ultimate point than ones at the yield point and proportional limit, respectively. The strains of bast, core, and synthetic rattan strips at yield point were 1.5, 1.3, and 1.3 times their corresponding strains at the proportional limit, respectively. The strains of bast, core, and synthetic rattan strips at the ultimate point were 6.2, 3.5, and 5.9 times of their corresponding strains at yield limit, respectively. The strains of bast, core, and synthetic rattan strips at the ultimate point were 8.5, 4.5, and 7.4 times of their corresponding strains at the proportional limit, respectively. It can be concluded that natural bast and synthetic strips had significantly larger plastic formations than core ones when subjected to tensile loading, i.e., about 1.9 and 1.6 times of core ones on average, respectively.

3.2. Factors on Bast Strip Properties

Table 5 summarizes ANOVA results obtained from the GLM procedure performed for each of three tensile properties. Table 6 summarizes mean values of ultimate tensile strength, MOE, and failure strain of bast strips evaluated in test 2, and their corresponding mean comparisons for each of two factors evaluated.
For ultimate tensile strength, ANOVA results indicated that the two-factor interaction was not significant, indicating the main effects were the focus. Mean comparisons of main effects indicated that bast strips with the gauge length of 100 mm yielded significantly higher ultimate tensile strengths than ones of 140 mm, i.e., the difference can reach 42%. There were no significant differences among ultimate tensile strengths of rattan bast strips tested in four different unit loading speeds, indicating that the ultimate tensile strengths of rattan bast strips were not sensitive to unit loading speed changes.
For MOE, ANOVA results indicated that the two-factor interaction was marginally significant. This suggested that further analyses should be focused on the interaction. Mean comparisons of MOE for gauge length and unit loading speed are shown in Table 6. The results were based on LSMEAN multiple comparisons procedure because of unbalanced numbers of rattan strips.
For failure strains, ANOVA results indicated that the two-factor interaction was significant. This suggested that further analyses should be focused on the significant interaction. Mean comparisons of failure strain for gauge length and unit loading speed are shown in Table 6. The results were based on LSMEAN multiple comparisons procedure because of unbalanced numbers of rattan strips.
Gauge length effect. Mean comparisons (Table 6) indicated that gauge length had influences on the magnitude of three tensile properties of bast strips evaluated in this study. Bast strips tested under the gauge length of 100 mm had a significantly higher ultimate tensile strength than ones tested under the gauge length of 140 mm for each of four-unit loading speeds, i.e., about 25 to 42% higher (Table 6). Bast strips tested under the gauge length of 100 mm had higher MOE and failure strain values than ones tested under the gauge length of 140 mm. The longer the selected gauge length is, the lower tensile strength and MOE will be. This may be caused by the uneven-distributed rattan material in the longitudinal direction. These differences were significant for each of three-unit loading speeds less than 0.4 mm/min/mm, but not significant when unit loading speed was 0.4 mm/min/mm.
Unit loading speed effect. Mean comparisons (Table 6) indicated that there were no significant differences among the four ultimate tensile strengths of bast strips measured at four different unit loading speeds within each of the two gauge lengths evaluated. There were no significant differences among four MOE values as well as four failure strains for bast strips measured at four different unit loading speeds within the gauge length of 100 mm. The MOE and failure strain values measured at the unit loading speed of 0.4 mm/min/mm were significantly higher than their corresponding three values measured at unit loading speeds less than 0.4 mm/min/mm when the gauge length of bast strips was 140 mm, but there were no significant differences among three MOE and failure strain values measured at the three-unit loading speeds less than 0.4 mm/min/mm. This may imply that the tensile properties of bast strips can be affected by unit loading speed and gauge length when both factors increase their values beyond 0.4 mm/min/mm and 140 mm, respectively.

3.3. Unit Loading Speed Effect on Synthetic Rattan Strip Properties

Table 7 and Table 8 summarize mean values of tensile strengths and MOE, and tensile strains of SRSs evaluated in test 3, respectively. Mean comparison results of each mechanical property for unit loading speed were based on the protected LSD multiple comparisons procedures using the single LSD value provided in Table 7 and Table 8 for each property.
Mean comparisons of tensile strengths for unit loading speed (Table 7) indicated that unit loading speed had a similar effect on the tensile strengths of SRS at the proportional limit and yield point. Specifically, both tensile strengths showed an increasing trend as unit loading speed increased from 0.1 to 0.5 mm/min/mm with an increment of 10 mm/min/mm, and even though there was a decrease in tensile strengths when unit loading speed increased from 0.3 to 0.4 mm/min/mm. However, these increases or decrease were not significant till unit loading speed increased to 0.5 mm/min/mm; in other words, there were no significant differences among tensile strengths measured at unit loading speed ranging from 0.1 to 0.4 mm/min/mm and both tensile strengths at the proportional limit, and yield point measured at the unit loading speed of 0.5 mm/min/mm were all significantly higher than the ones at 0.1 mm/min/mm. In addition, there were no significant differences among four tensile strengths within each of tensile strength at the proportional limit and yield point measured at the unit loading speed ranging from 0.2 to 0.5 mm/min/mm.
The ultimate strengths measured at the unit loading speed of 0.3 mm/min/mm or greater were significantly higher than the ones measured at the unit loading speed less than 0.3 mm/min/mm. There was no significant difference between the two ultimate strengths of SRSs measured at unit loading speeds of 0.3 and 0.5 mm/min/mm, respectively. The ultimate tensile strength measured at the unit loading speed of 0.4 mm/min/mm tended to show a 1.2 times significantly higher value than the other two measured at unit loading speeds of 0.3 and 0.5 mm/min/mm. There was no significant difference between the two ultimate strengths of SRSs measured at unit loading speeds of 0.1 and 0.2 mm/min/mm, respectively. Tensile yield strengths of SRSs measured at each of five unit loading speeds were 1.2 times of their corresponding strengths at proportional limits. Meanwhile, ultimate tensile strengths were 1.3 times their corresponding yield strengths for four of five unit loading speeds evaluated. The ultimate tensile strength measured at the unit loading speed of 0.4 mm/min/mm was 1.6 times its corresponding yield strength. Ultimate tensile strengths were 1.5 to 1.6 times of their corresponding strengths at the proportional limit for four of five unit loading speeds evaluated. The ultimate tensile strength measured at the unit loading speed of 0.4 mm/min/mm was 2 times of its corresponding strength at proportional limit.
Three MOE values of SRSs (Table 7) measured at unit loading speeds higher than 0.2 mm/min/mm were about 1.1 times higher than one measured at the unit loading speed of 0.2 mm/min/mm, followed by about 1.1 times lower one measured at 0.1 mm/min/mm. There were no significant differences among the three MOE values of SRSs measured at unit loading speeds higher than 0.2 mm/min/mm.
There were no significant differences among five strains at the proportional limit and also at yield point for SRSs measured at five evaluated unit loading speeds (Table 8). The ultimate strain measured at the unit loading speed of 0.5 mm/min/mm was significantly higher than the one at 0.4 mm/min/mm, followed by three significantly lower ultimate strains measured at unit loading speed slower than 0.4 mm/min/mm. There were no significant differences among the three ultimate strains measured at unit loading speeds lower than 0.4 mm/min/mm. The strain ratios of yield to proportional limit, ultimate to proportional limit, and ultimate to yield were in the ranges of 1.2 to 1.3, 6 to 7.4, and 5.2 to 5.9, respectively.

4. Conclusions

The major conclusions from the experimental results of this study are the following:
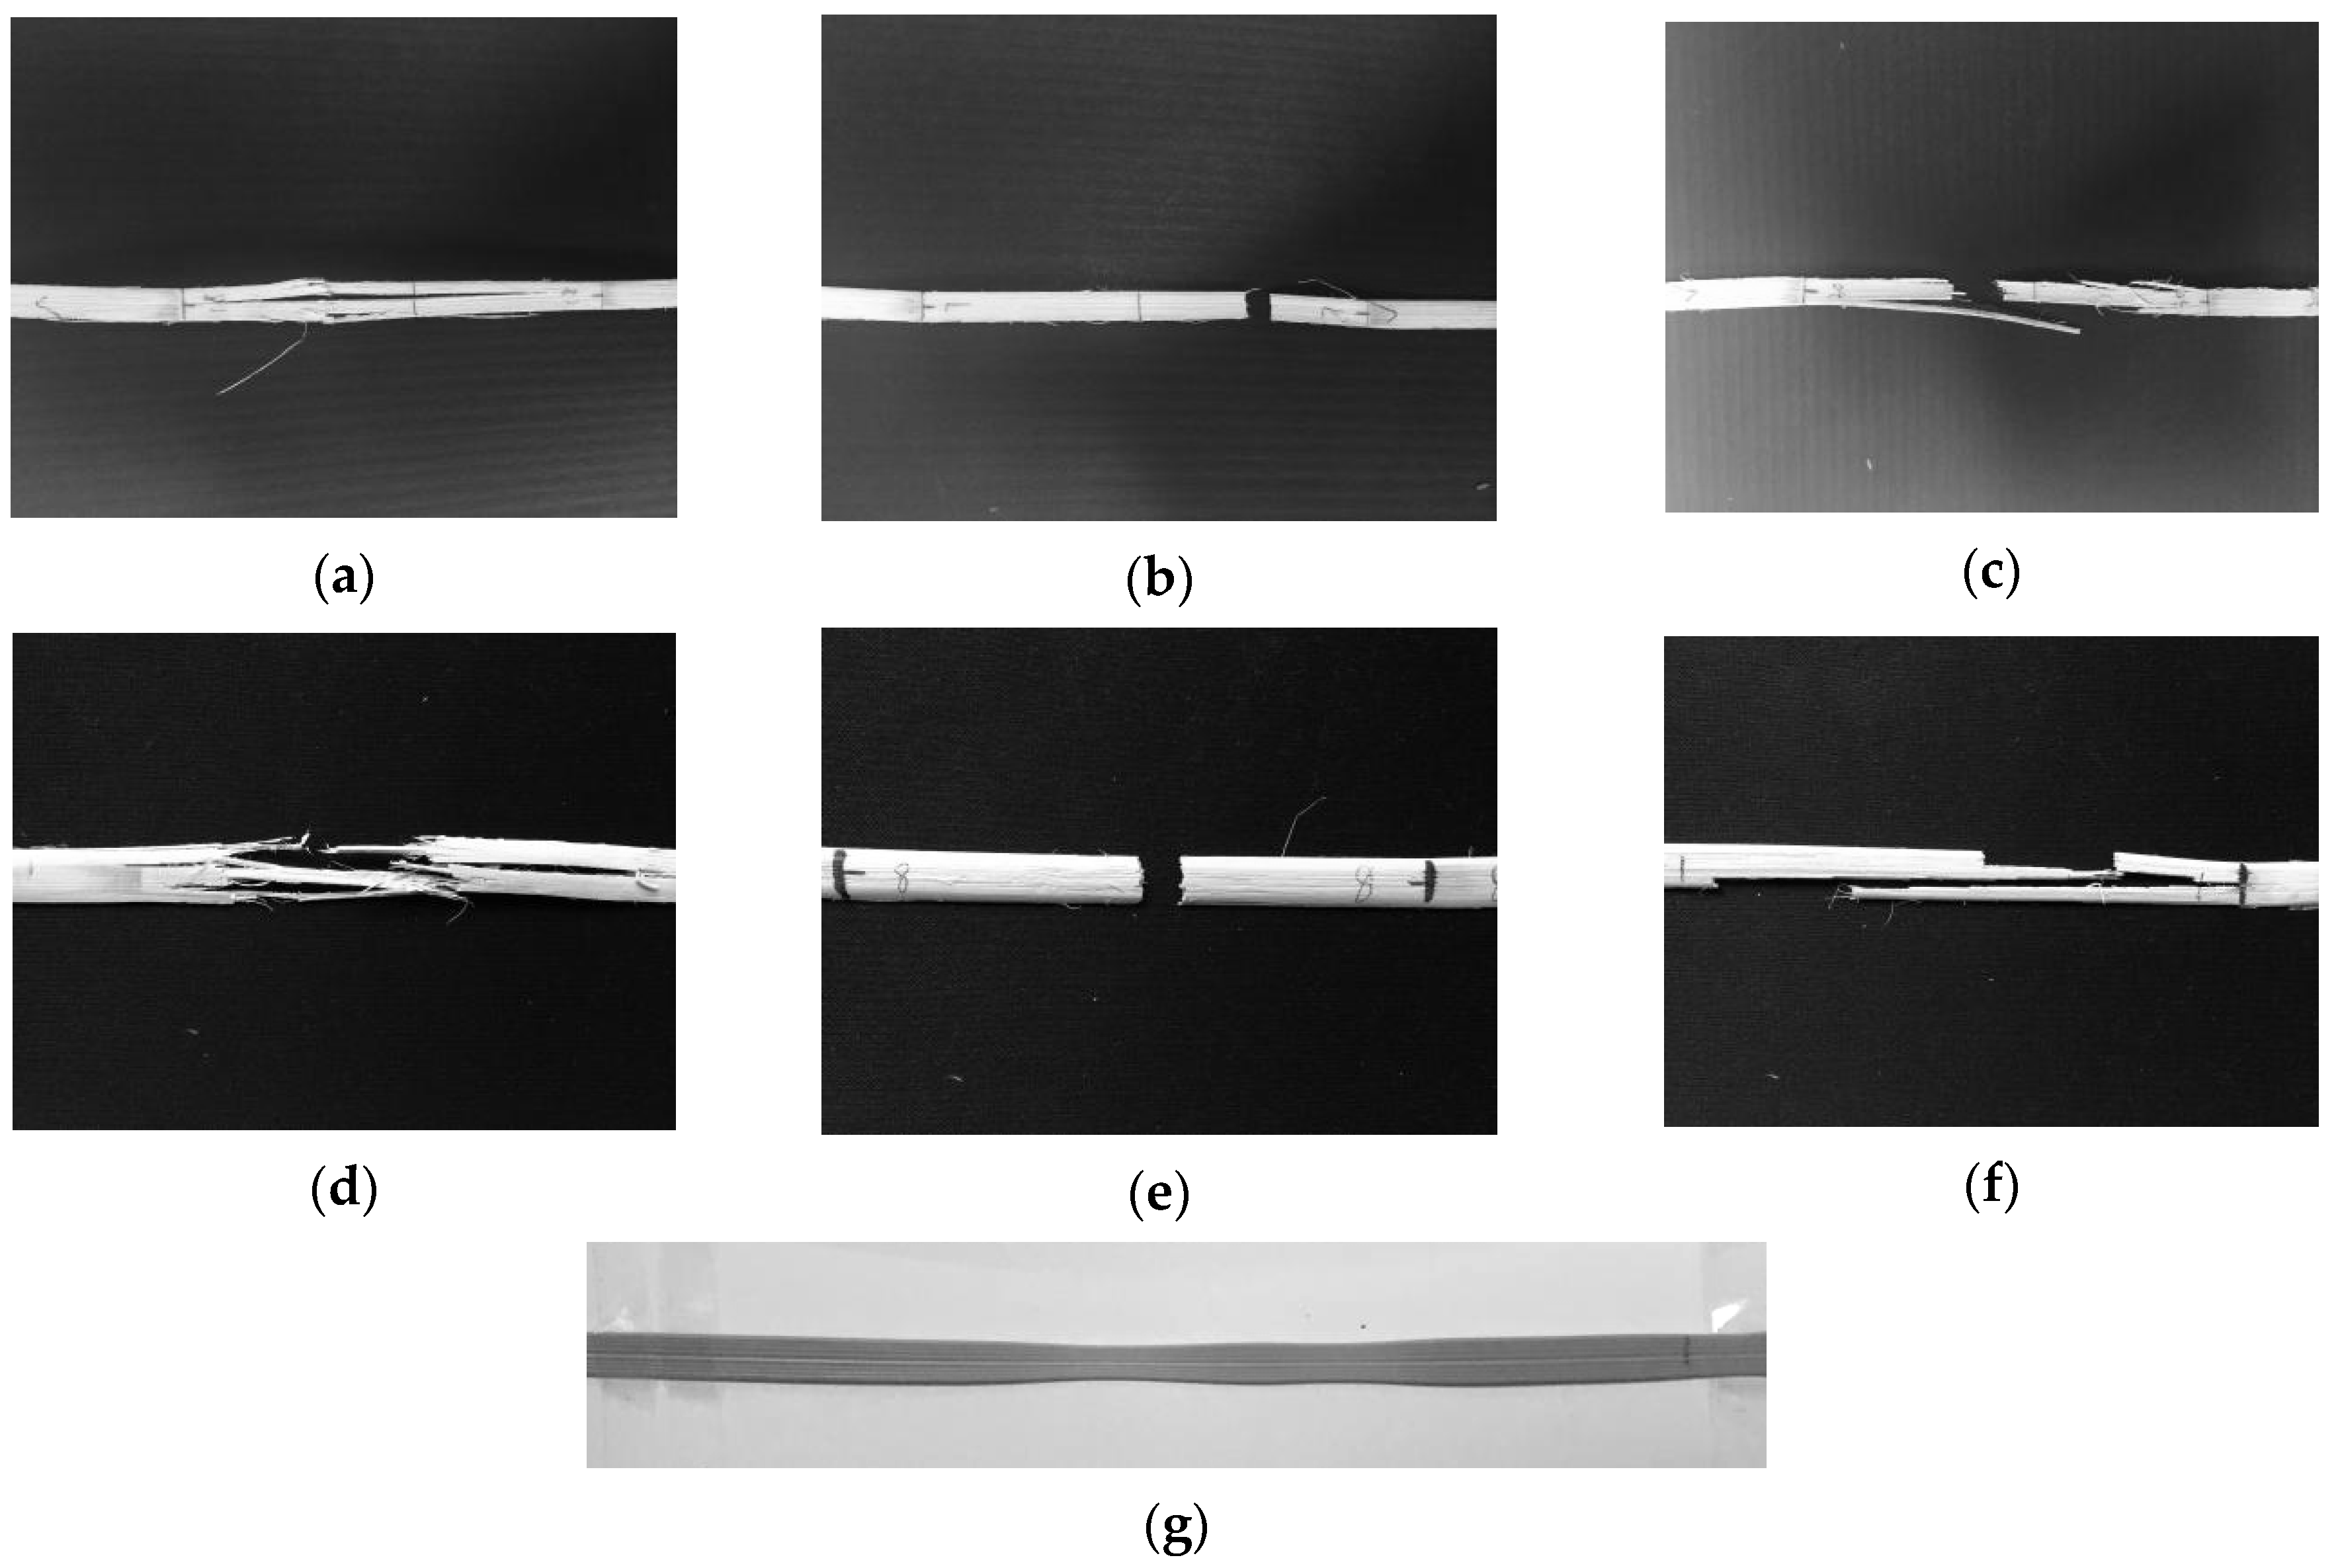
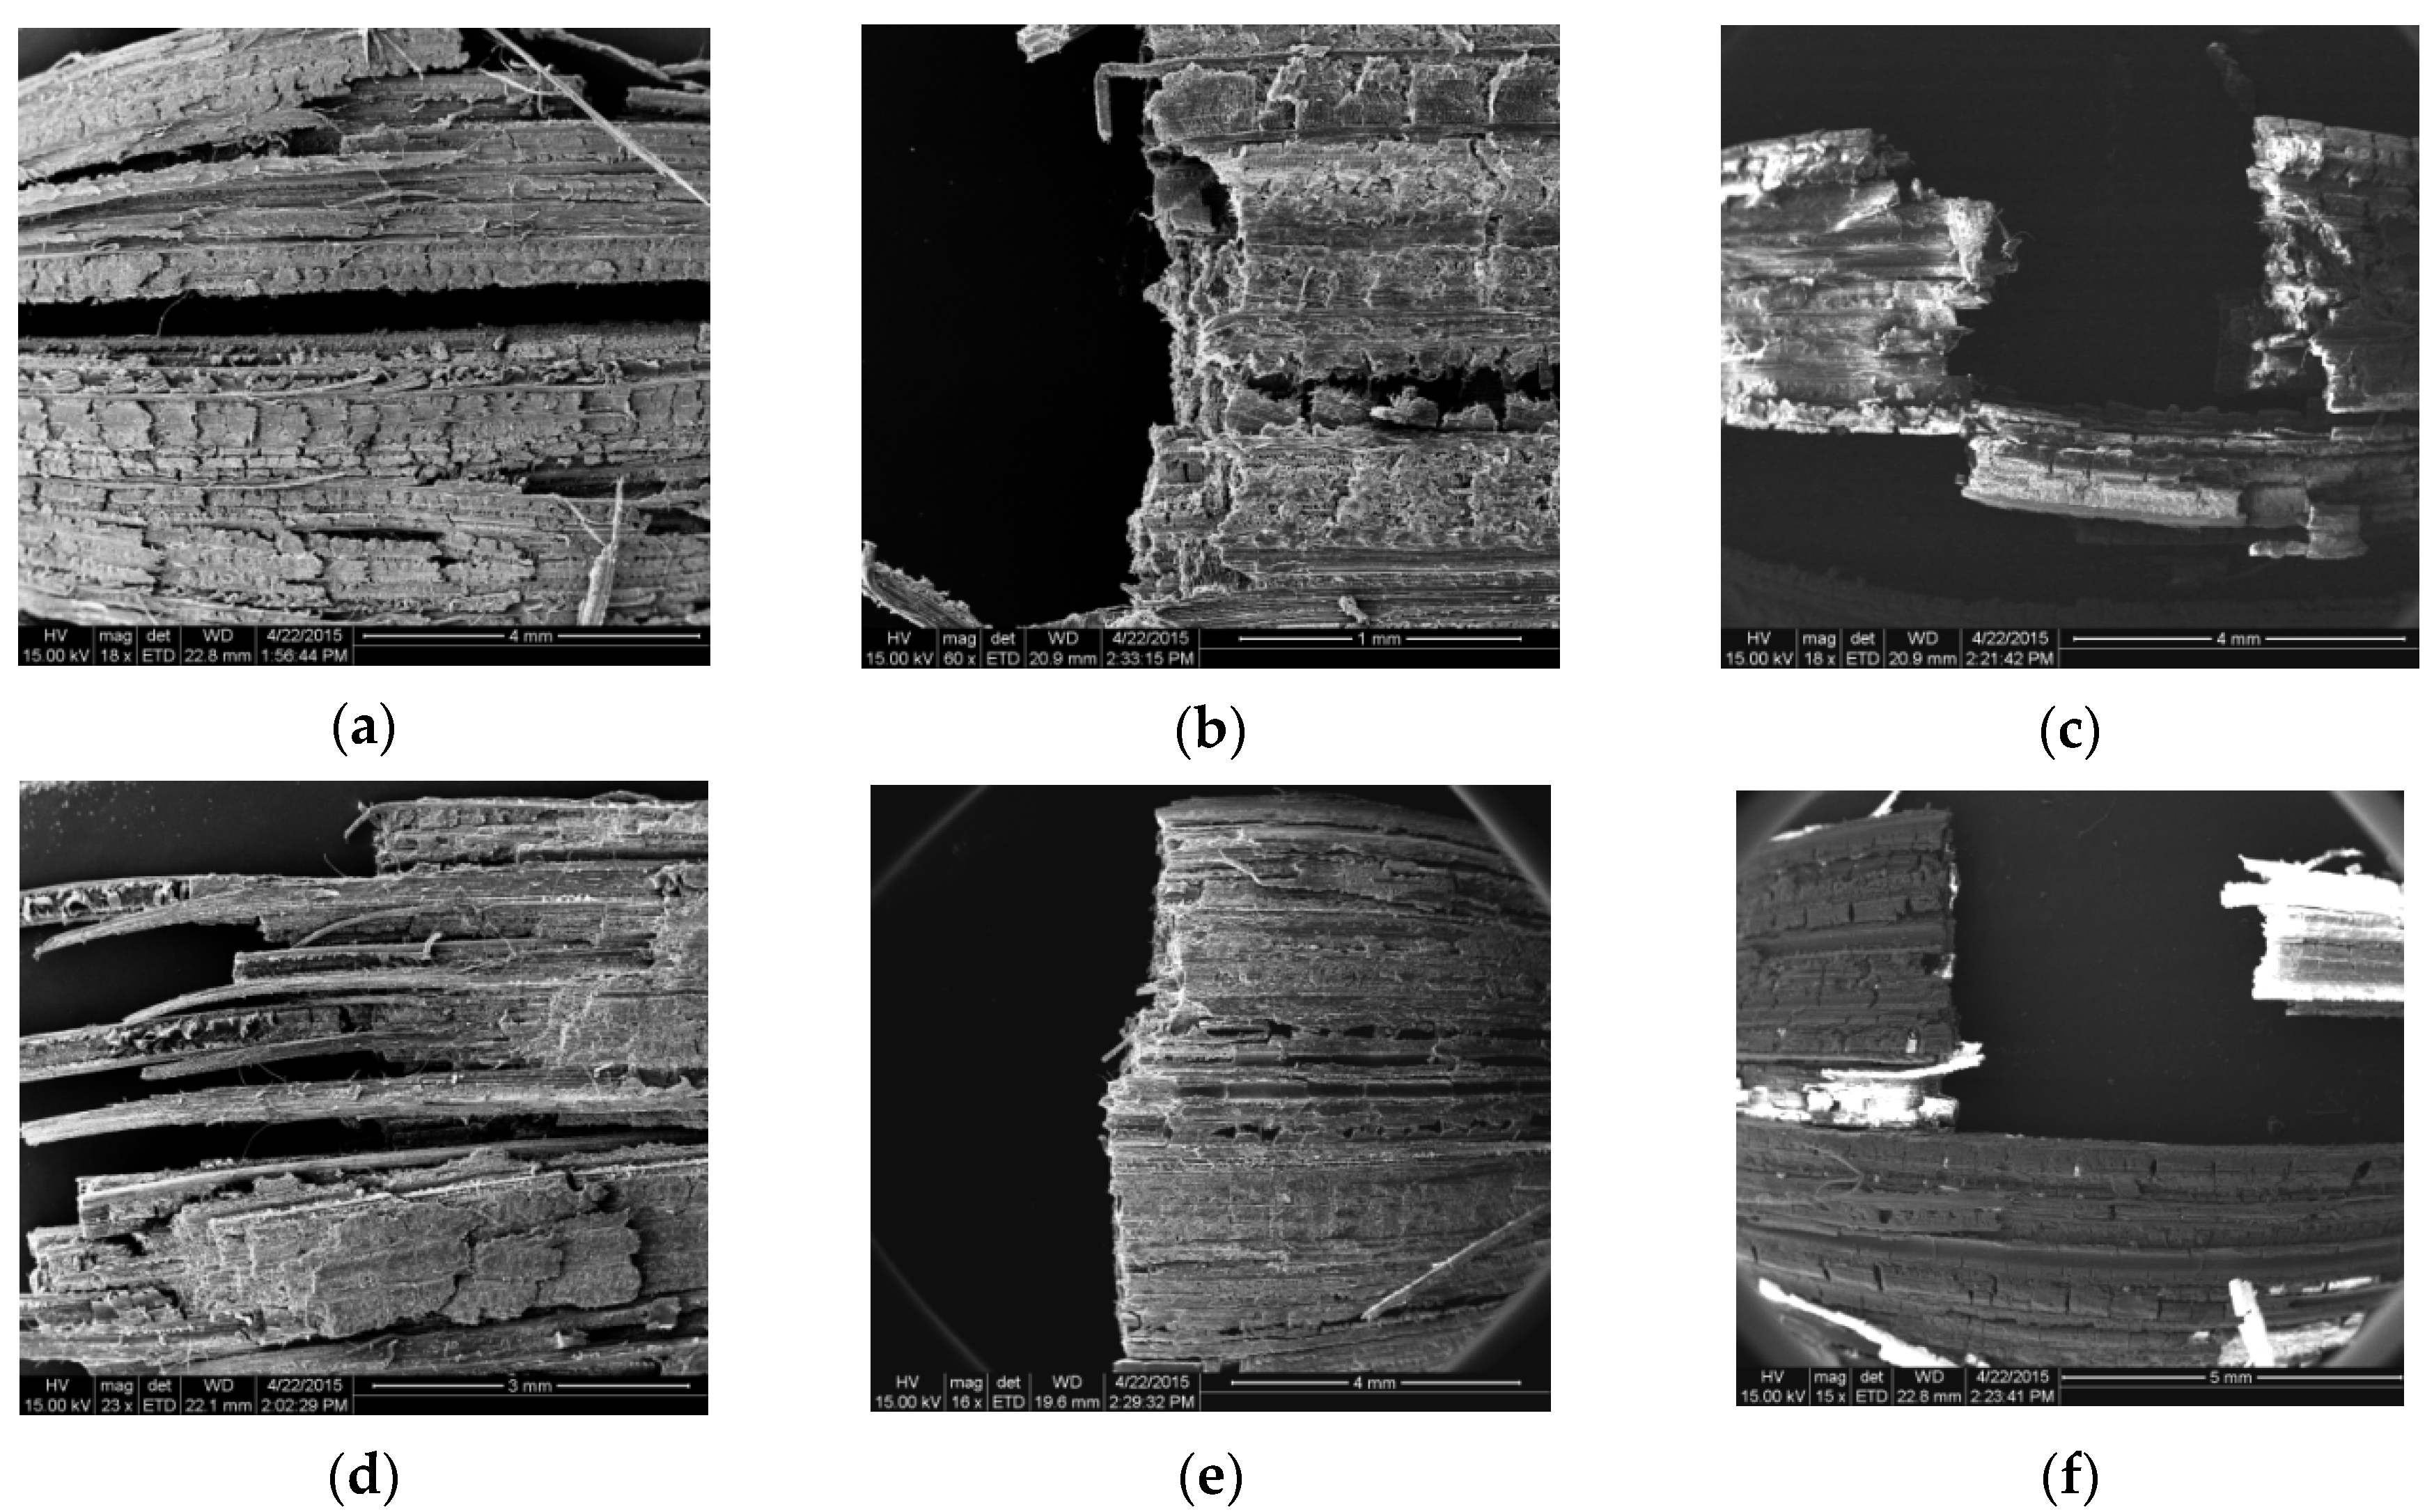
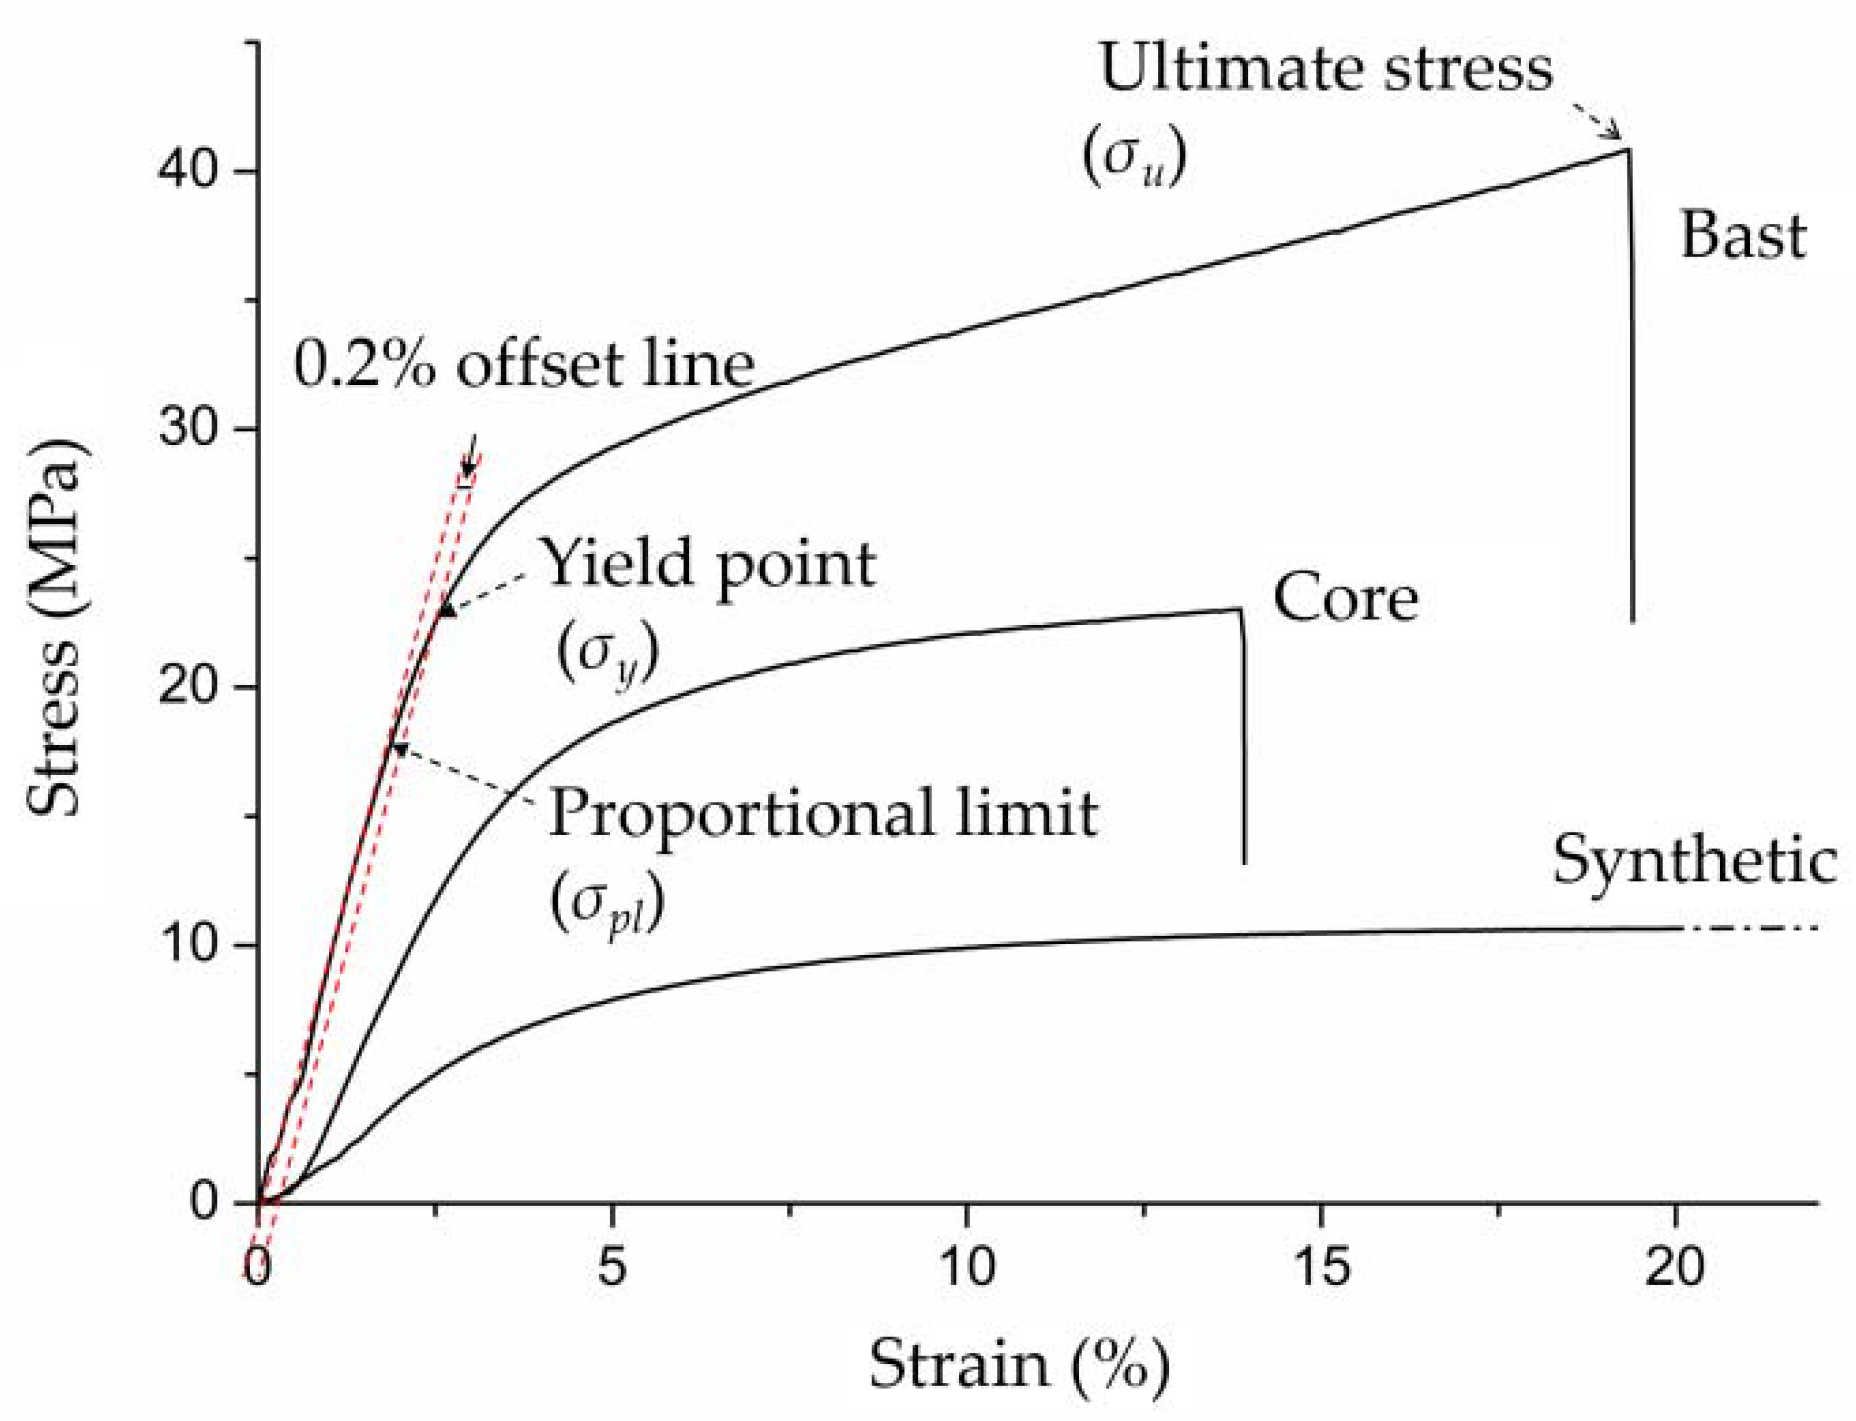
  • NRSs, when subjected to tensile loading, behaved like SRSs in terms of their stress-strain curves showing excessive plastic deformation. Bast and synthetic strips had significantly larger plastic deformations than core ones. Bast rattan strips had the highest ultimate tensile strength and MOE values among the three materials evaluated in this study, followed by core strips and SRSs. Bast strips are more suitable for the weaving surface required a higher strength. Core strips with better elasticity can be good for hand knitting with easy operation. NRSs with the best elasticity can be used as a good substitute for NRSs.
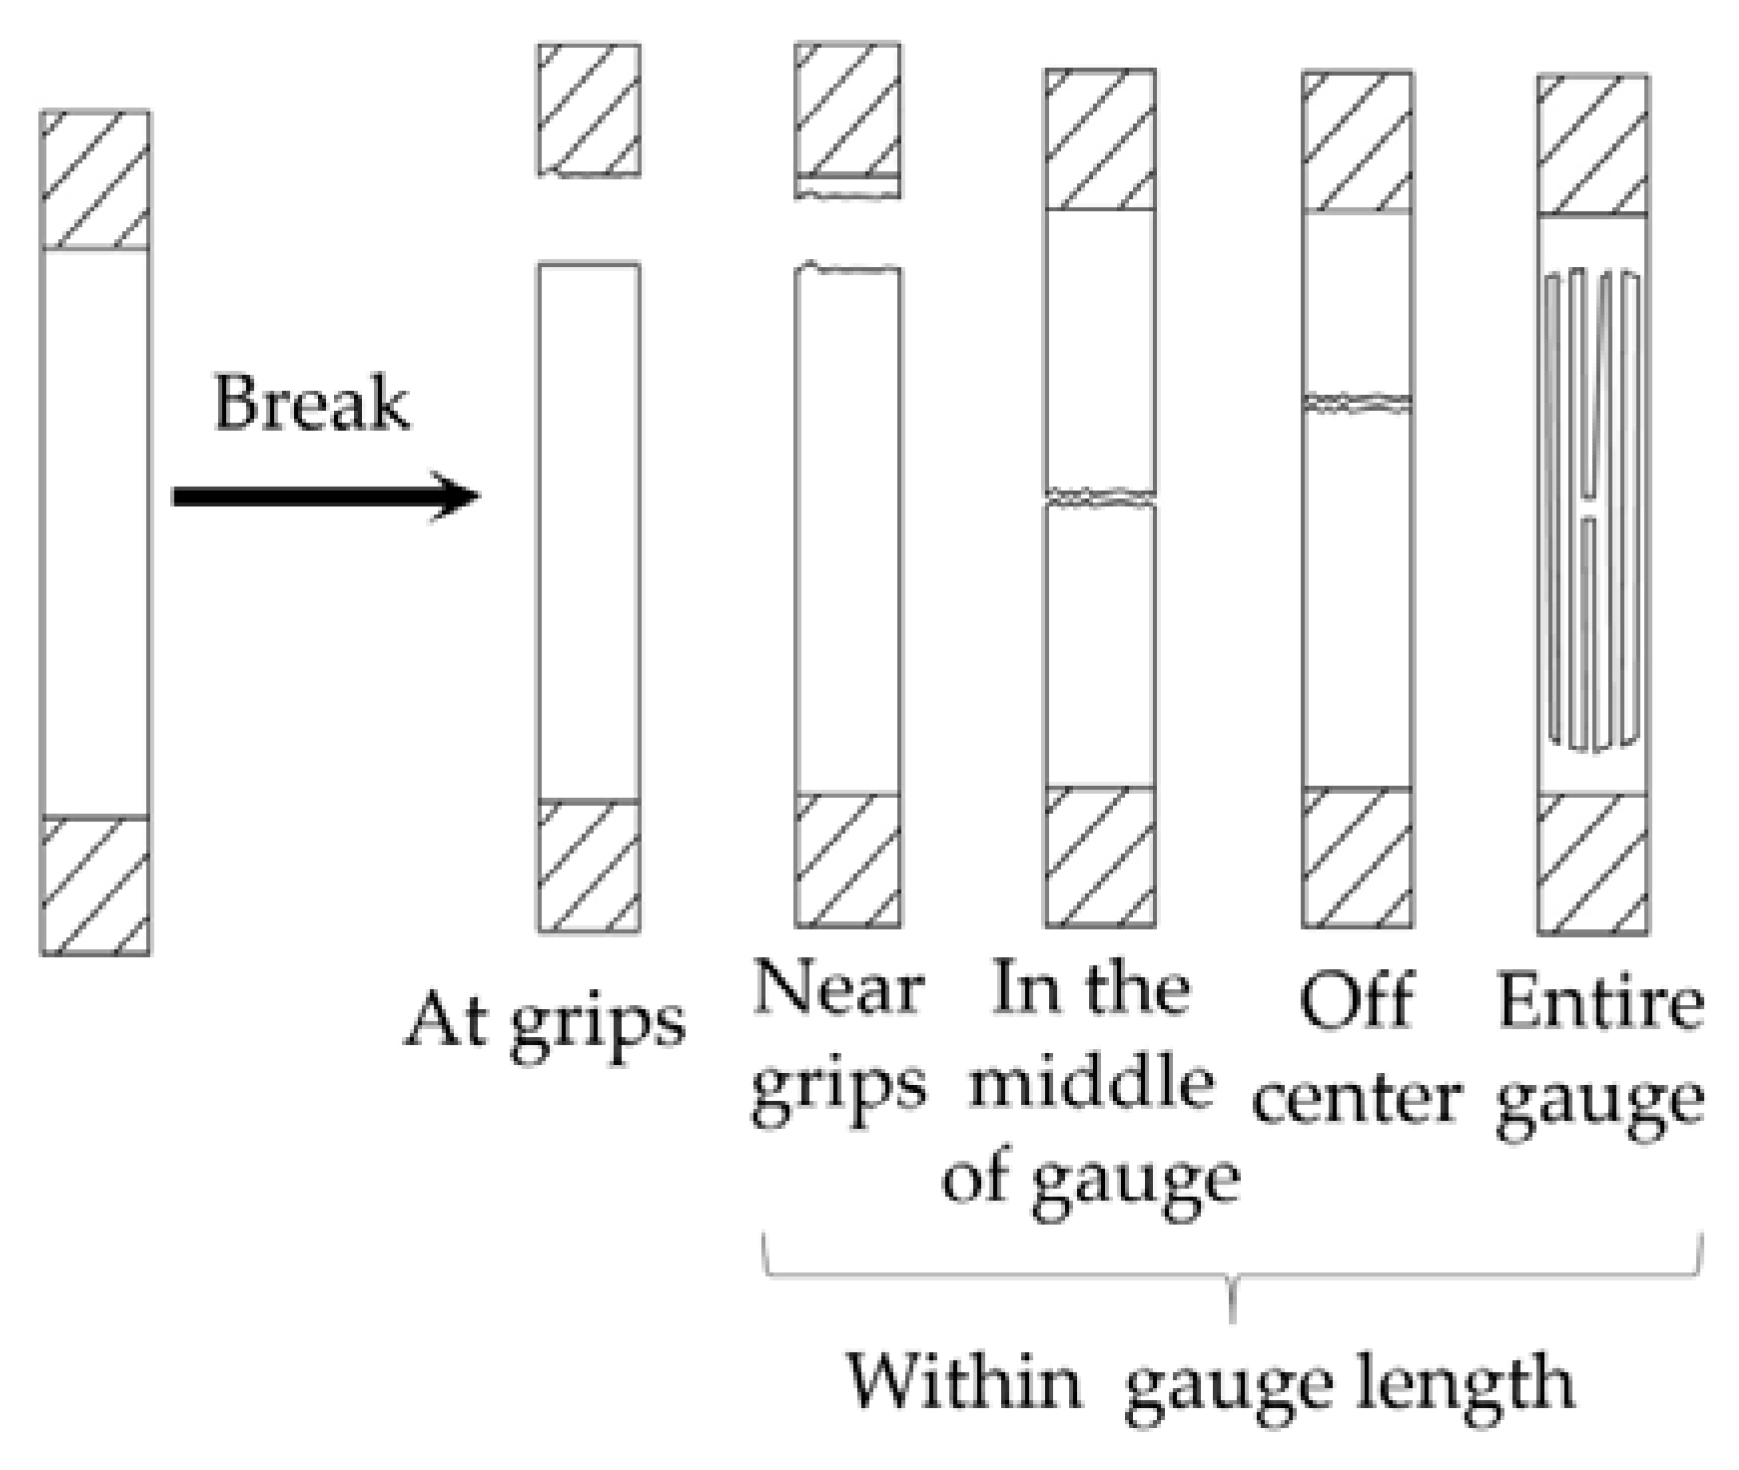
  • Major tensile properties of NRSs such as ultimate tensile strength, MOE, and failure strain can be significantly influenced by its gauge length adapted in its evaluation test. Unit loading speeds evaluated in this study, in general, had no significant effects on major tensile properties of NRSs tested under two gauge lengths of 100 mm and 140 mm. The exception case was when the bast strip of 140 mm gauge length was tested at 0.4 mm/min/mm. For structural strength assessments of natural rattan furniture, the variability of NRSs’ mechanical properties in the longitudinal direction should be considered.
  • Unit loading speeds evaluated in this study tend to affect the ultimate strengths of SRSs used in this study significantly, but less significantly to strengths at the proportional limit and yield point. For structural assessments of synthetic rattan furniture, the loading speed should be taken into account.

Author Contributions

Conceptualization, J.Z., and Y.G.; methodology, J.Z., and Y.G.; software, Y.G.; validation, J.Z.; investigation, Y.G.; resources, J.Z.; data curation, Y.G.; writing—original draft preparation, Y.G.; writing—review and editing, J.Z., and Y.G. All authors have read and agreed to the published version of the manuscript.

Funding

This work was funded by the General Program of the Natural Science Foundation of Jiangsu Province Higher Education Institutions in China (Grant No. 18KJB220007); Youth Science and Technology Innovation Foundation of Nanjing Forestry University in China (Grant No. CX2017010); Highly Educated Talent Scientific Research Foundation of Nanjing Forestry University in China (Grant No. GXL2016029); International Cooperation Joint Laboratory for Production, Education, Research and Application of Ecological Health Care on Home Furnishing.

Acknowledgments

The authors thank Boxuan Rattan Furniture Co., Ltd. (Nanjing, China), and Hongbo Plastic Industry Co., Ltd. (Hangzhou, China) for supplying rattan materials for this experiment.

Conflicts of Interest

The authors declare no conflict of interest.

References

  1. Gu, Y.T.; Wu, Z.H.; Zhang, Z.L. Load–deflection behavior of rattan chair seats. Wood Fiber Sci. 2016, 48, 1–12. [Google Scholar]
  2. Gu, Y.T.; Wu, Z.H.; Zhang, Z.L. Tensile and Bending Moment Resistances of T-Shaped Joints in Rattan Chairs. Wood Fiber Sci. 2013, 45, 429–441. [Google Scholar]
  3. Gu, Y.T.; Wu, Z.H.; Zhang, Z.L. Comparison on the axial tensile properties of five Calamus simplicfoilius. rattan strips used in rattan furniture. China For. Sci. Technol. 2015, 29, 105–108. [Google Scholar]
  4. Desmond, P.C. The Rattan Plant. Manual on the Production of Rattan Furniture; United National Industrial Development Organization: New York, NY, USA, 1983; pp. 5–6. [Google Scholar]
  5. Jiang, Z.H. The Rattan Plant. Bamboo and Rattan in the World; Liaoning Science and Technology Publishing House: Shenyang, China, 2002; pp. 567–571. [Google Scholar]
  6. Hu, W.G.; Liu, N.; Guan, H.Y. Optimal design of a furniture frame by reducing the volume of wood. Drewno 2019, 62, 85–97. [Google Scholar]
  7. Hu, W.G.; Liu, N. Numerical and Optimal Study on Bending Moment Capacity and Stiffness of Mortise-and-Tenon Joint for Wood Products. Forests 2020, 11, 501. [Google Scholar] [CrossRef]
  8. Yudodibroto, H. Anatomy Strength properties and the utilization of some Indonesian rattans. In Proceedings of the the Rattan Seminar, Kuala Lumpur, Malaysia, 2–4 October 1985; pp. 117–122. [Google Scholar]
  9. Bhat, K.M.; Thulasidas, P.K.; Mohamed, C.P. Strength properties of ten south Indian canes. Trop. For. Sci. J. 1992, 5, 26–34. [Google Scholar]
  10. Cai, Z.M. Testing of axial tensile strength of rattan canes. Sci. Silvae Sin. 1994, 30, 93–95. [Google Scholar]
  11. Lv, W.H.; Liu, X.E.; Wang, Y.H. The test methods of axial tensile strength of rattan canes. Wood Process. Mach. 2010, 21, 20–23. [Google Scholar]
  12. Luo, Z.F.; Zhang, X.F.; Lu, B.Y.; Pan, B.; Ruan, Z.Y. Mechanical Properties and Test Methods of Rattan. Furnit. Des. Room Dec. 2012, 7, 108–110. [Google Scholar]
  13. Liu, X.E.; Wang, R.; Tian, G.; Yang, Y.H.; Jiang, Z.H. Tensile properties of single rattan fibers. Wood Fiber Sci. 2014, 46, 1–8. [Google Scholar]
  14. Chen, Z.; Zhang, J.; Chen, H.H.; Su, M.Y. Analysis of Design Elements of Plastic Rattan Furniture. Furnit. Des. Room Dec. 2012, 2, 18–19. [Google Scholar]
  15. CNS. Method of Testing in Tensile Strength Parallel to Grain of Wood. GB/T 1938–2009; China National Standard: Beijing, China, 2009. [Google Scholar]
  16. CNS. Testing Methods of Physical and Mechanical Properties of Bamboos. GB/T 15780–1995; China National Standard: Beijing, China, 1995. [Google Scholar]
  17. ASTM. Standard Test Method for Tensile Properties of Thin Plastic Sheeting. ASTM D882–2012; American Society for Testing and Materials: West Consholocken, PA, USA, 2012. [Google Scholar]
  18. Liu, H.W. Stretch, compress and shear. In Mechanics of Materials I, 6th ed.; Higher Education Press: Beijing, China, 2017; pp. 13–27. [Google Scholar]
  19. Bian, H.Y.; Chen, L.D.; Dong, M.L.; Wang, L.Y.; Wang, R.B.; Zhou, X.L.; Wu, C.; Wang, X.; Ji, X.X.; Dai, H.Q. Natural lignocellulosic nanofibril film with excellent ultraviolet blocking performance and robust environment resistance. Int. J. Biol. Macromol. 2020. [Google Scholar] [CrossRef] [PubMed]
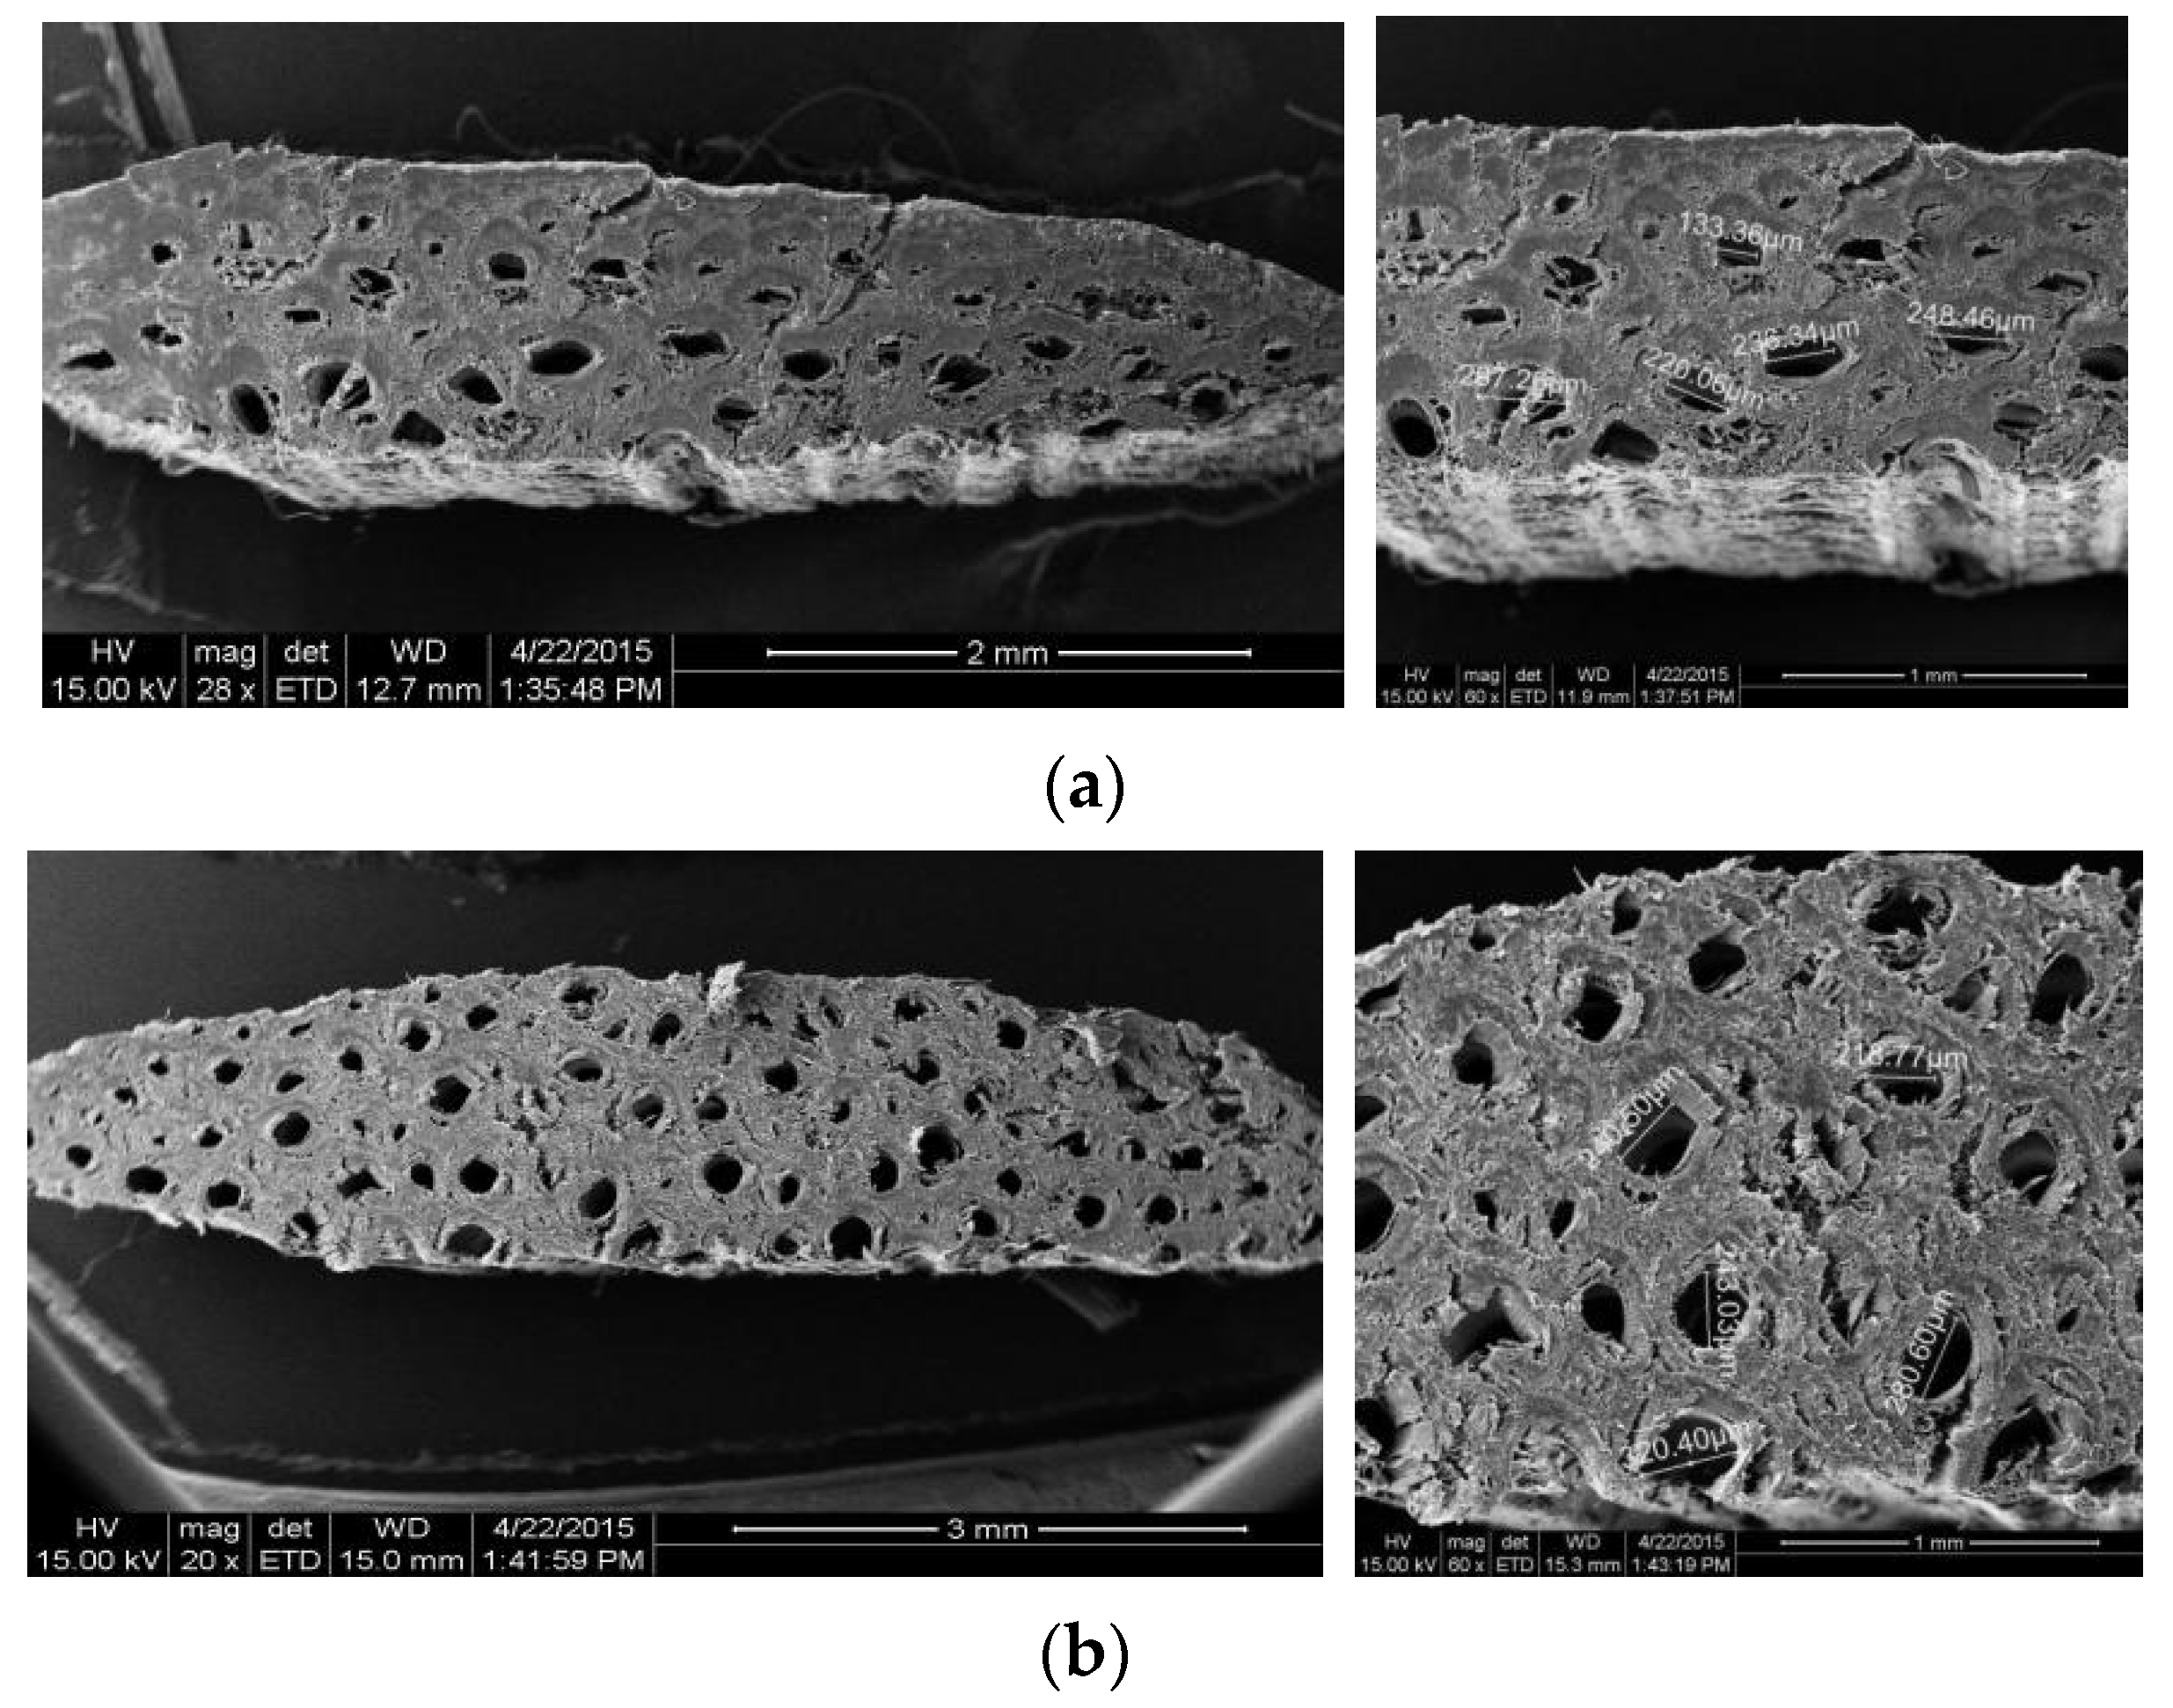
  20. Zhou, A.P.; Huang, D.S.; Chen, S.S.; Zhang, P.D. Distribution of vascular bundles of bamboo and its tensile mechanical performances. Build. Mater. J. 2012, 15, 105–108. [Google Scholar]
Figure 1. Physical appearance of evaluated bast (a), core (b), and synthetic (c) rattan strips and their cross-section geometry (d).
Forests 11 01299 g001
Figure 2. Illustration of the defined gauge length of a rattan strip evaluated in this experiment.
Forests 11 01299 g002
Figure 3. Testing strips of bast (a), core (b), and synthetic (c) rattan materials.
Forests 11 01299 g003
Figure 4. Setup for evaluating tensile properties of rattan strips in this experiment.
Forests 11 01299 g004
Figure 5. Typical tensile failure modes of natural rattan bast strips observed in test 1: splintering tension (a), brash tension (b), and combined splintering and brash tension (c); natural rattan core strips: splintering tension (d), brash tension (e), and combined splintering and brash tension (f) and typical failure modes of synthetic rattan strips: yield necking (g).
Forests 11 01299 g005
Figure 6. SEM images of typical tensile fracture surfaces of natural rattan bast strips evaluated in test 1: splintering tension (a), brash tension (b), and combined splintering and brash tension (c); natural rattan core strips: splintering tension (d), brash tension (e) and combined splintering and brash tension (f).
Forests 11 01299 g006
Figure 7. SEM images of typical cross-sections of fractured surfaces of bast (a) and core (b) rattan strip tested in tension.
Forests 11 01299 g007
Figure 8. Major failure locations of natural rattan strips subjected to tensile loading in test 1.
Forests 11 01299 g008
Figure 9. Typical stress-strain curves of natural bast, core, and synthetic rattan strips subjected to tensile loading.
Forests 11 01299 g009
Table 1. Summary of reviewed tensile properties of natural rattan materials.
SpeciesOriginMaterial TypeTensile Strength (MPa)Reference
C. inopsSulawesi, Indonesiabast121.5Yudodibroto 1985 [8]
C. inopsSulawesi, Indonesiacore85.6Yudodibroto 1985 [8]
C. symphysipusSulawesi, Indonesiabast81.5Yudodibroto 1985 [8]
C. symphysipusSulawesi, Indonesiacore74.1Yudodibroto 1985 [8]
C. sp.Sulawesi, Indonesiabast83.1Yudodibroto 1985 [8]
C. sp.Sulawesi, Indonesiacore75.7Yudodibroto 1985 [8]
C. simplicifolius WeiHainan, Chinabast79.5Cai 1994 [10]
C. simplicifolius WeiHainan, Chinacore49.9Cai 1994 [10]
C. simplicifolius WeiGuangdong, Chinabast75.7Cai 1994 [10]
C. simplicifolius WeiGuangdong, Chinacore43.5Cai 1994 [10]
C. simplicifolius WeiGuangdong, Chinabast41.97Lv et al. 2010 [11]
Table 2. Summary of numbers of natural rattan strips failed at each of major failure locations within each of three tensile failure modes observed in test 1 and numbers of the strips used for calculation of each of four tensile properties, strength at the proportional limit (σpl), strength at yield point (σy), strength at ultimate point u), and modulus of elasticity (MOE).
Rattan TypeFailure ModeNo. of Strips
SplinteringBrashCombinationMOEσplσyσu
Location
At GripsWithin Gauge LengthAt GripsWithin Gauge LengthAt GripsWithin Gauge Length
Near GripsMiddleNear GripsMiddleOff-CenterNear GripsMiddleEntire
Bast0091390001730303029
Core00222117023130303028
Table 3. Mean values of tensile strength and modulus elasticity (MOE) of rattan strips evaluated in test 1 and their mean comparisons for rattan type 1.
Rattan TypeTensile Strength atMOEStrength Ratio
Proportional Limit (σpl)Yield Point (σy)Ultimate Point (σu)σyplσuyσupl
(MPa)
Bast17.57(16)(A)21.26(13)(A)35.00(18)(A)1004(13)A1.22.01.6
Core16.22(19)(A)20.17(19)(A)30.13(17)(B)806(09)B1.21.91.5
Synthetic4.84(17)(B)5.87(15)(B)10.29(05)(C)267(11)C1.21.82.1
1 Values in the first parentheses are coefficients of variation in percentage, and means not followed by a common uppercase letter in the same column are significantly different one from another at p = 0.05 level.
Table 4. Mean values of tensile strains at different critical points of rattan strips evaluated in test 1 and their mean comparisons for rattan type 1.
Rattan TypeStrain atStrain Ratio
Proportional Limit (εpl)Yield Point (εy)Ultimate Point (εu)
(%)εyplεuyεupl
Bast2.17(13)(A)3.00(17)(A)18.53(22)(A)1.56.28.5
Core2.27(14)(A)2.92(10)(A)10.22(32)(B)1.33.54.5
Synthetic2.71(20)(A)3.42(18)(A)20.03(0)(A)1.35.97.4
1 Values in the first parentheses are coefficients of variation in percentage, and means not followed by a common uppercase letter in the same column are significantly different one from another at p = 0.05 level.
Table 5. Summary of analysis of variance (ANOVA) results obtained from the general linear model (GLM) performed on two factors for each of three tensile properties.
SourceUltimate Tensile StrengthMOEFailure Strain
F Valuep ValueF Valuep ValueF Valuep Value
Unit speed1.540.2151.480.22955.760.0017
Gauge length64.81<0.000150.09<0.000153.94<0.0001
Unit speed × gauge length0.840.47763.180.030210.27<0.0001
Table 6. Mean values of ultimate tensile strength, tensile modulus, and failure strain of rattan bast strips evaluated in test 2 for each combination of unit speed and gauge length and their corresponding mean comparisons for unit loading speed and gauge length 1.
Gauge Length (mm)Unit Loading Speed (mm/min/mm)
0.10.20.30.4
Ultimate tensile strength (MPa)
10044.19(13)(10)(A)(a)42.61(14)(9)(A)(a)41.89(14)(9)(A)(a)40.14(11)(10)(A)(a)
14032.63(12)(6)(B)(a)34.39(11)(7)(B)(a)29.43(9)(7)(B)(a)32.18(14)(6)(B)(a)
Strength ratio1.351.241.421.25
Modulus (MPa)
1001386(8)(10)(A)(a)1328(19)(9)(A)(a)1269(7)(10)(A)(a)1296(11)(10)(A)(a)
1401025(9)(8)(B)(b)1075(10)(9)(B)(b)1021(7)(8)(B)(b)1238(13)(6)(A)(a)
Modulus ratio1.351.241.241.05
Failure strain (%)
1009.7(33)(10)(A)(a)10.0(31)(9)(A)(a)15.0(27)(9)(A)(a)7.1(17)(10)(A)(a)
1406.3(33)(6)(B)(b)5.7(34)(7)(B)(b)4.1(28)(7)(B)(b)6.0(24)(6)(A)(a)
Strain ratio1.541.753.661.18
1 Values in the first and second parentheses are coefficients of variation in percentage and valid replicates of tested strips, respectively; means not followed by a common uppercase capital letter in the same column are significantly different one from another at p = 0.05 level considering gauge length effect, means not followed by a common lowercase letter in the same row are significantly different one from another at p = 0.05 level considering unit loading speed effect.
Table 7. Mean values of tensile strength and modulus of elasticity (MOE) of synthetic rattan strips tested in test 3 and their corresponding mean comparisons for unit loading speed 1.
Unit Loading Speed (mm/min/mm)Tensile Strength atMOEStrength Ratio
Proportional Limit (σpl)Yield Point (σy)Ultimate Point (σu)σyplσuyσupl
(MPa)
0.14.74(13)(B)5.76(14)(B)7.72(11)(C)199(11)(C)1.21.31.6
0.25.12(14)(AB)6.04(10)(AB)7.98(3)(C)227(5)(B)1.21.31.6
0.35.64(18)(AB)6.64(16)(AB)8.75(8)(B)258(5)(A)1.21.31.6
0.45.46(9)(AB)6.56(4)(AB)10.65(0)(A)263(8)(A)1.21.62.0
0.55.92(10)(A)6.95(9)(A)9.11(4)(B)262(4)(A)1.21.31.5
LSD0.880.960.6522
1 Values in the first parentheses are coefficients of variation in percentage, and means not followed by a common uppercase letter in the same column are significantly different one from another at p = 0.05 level.
Table 8. Mean values of tensile strains at different critical points and their mean comparisons for unit loading speed 1.
Unit Loading Speed (mm/min/mm)Strain atStrain Ratio
Proportional Limit
(εpl)
Yield Point
(εy)
Ultimate Point
(εu)
εy/εplεu/εyεu/εpl
(%)
0.12.81(12)(A)3.65(9)(A)20.00(0)(C)1.35.57
0.23.10(19)(A)3.65(9)(A)20.00(0)(C)1.25.56
0.33.26(12)(A)3.88(11)(A)20.01(0)(C)1.25.26
0.43.09(13)(A)3.87(10)(A)20.03(0)(B)1.35.26.5
0.52.71(12)(A)3.37(11)(A)20.05(0)(A)1.25.97.4
LSD0.580.580.01
1 Values in the first parentheses are coefficients of variation in percentage, and means not followed by a common uppercase letter in the same column are significantly different one from another at p = 0.05 level.
Publisher’s Note: MDPI stays neutral with regard to jurisdictional claims in published maps and institutional affiliations.

