Article

Spatial Structure and Genetic Variation of a Mangrove Species (Avicennia marina (Forssk.) Vierh) in the Farasan Archipelago

by
Rahmah N. Al-Qthanin
1,* and
Samah A. Alharbi
2
1
Biology Department, College of Sciences, King Khalid University, Abha 61421, Saudi Arabia
2
Biology Department, College of Applied Sciences, Umm-Al-Qura University, Makkah 21421, Saudi Arabia
*
Author to whom correspondence should be addressed.
Forests 2020, 11(12), 1287; https://doi.org/10.3390/f11121287
Submission received: 12 August 2020 / Revised: 14 November 2020 / Accepted: 18 November 2020 / Published: 30 November 2020
(This article belongs to the Section Forest Ecophysiology and Biology)

Abstract

:
Avicennia marina (Forssk.) Vierh is distributed in patches along the Farasan archipelago coast and is the most common mangrove species in the Red Sea. However, to date, no studies have been directed towards understanding its genetic variation in the Farasan archipelago. In this investigation, genetic variations within and among natural populations of Avicennia marina in the Farasan archipelago were studied using 15 microsatellite markers. The study found 142 alleles on 15 loci in nine populations. The observed (Ho) and expected (He) heterozygosity values were 0.351 and 0.391, respectively, which are much lower than those of earlier studies on A. marina in the Arabian Gulf. An inbreeding effect from self-pollination might explain its heterozygote deficiency. Population genetic differentiation (FST = 0.301) was similar to other mangrove species. Our findings suggest that the sea current direction and coastal geomorphology might affect genetic dispersal of A. marina. The more isolated populations with fewer connections by sea currents exhibited lower genetic variation and differentiation between populations. The genetic clustering of populations fell into three main groups—Group 1 (populations of Farasan Alkabir Island), Group 2 (populations of Sajid Island), and Group 3 (mix of one population of Farasan Alkabir Island and a population of Zifaf Island). More genetic variation and less genetic differentiation occurred when the population was not isolated and had a direct connection with sea currents. Both of these factors contributed to limited propagule dispersal and produced significant structures among the population. It is expected that the results of this research will be useful in determining policy and species-conservation strategies and in the rehabilitation of A. marina mangrove stands on the Farasan islands in an effort to save this significant natural resource.

1. Introduction

Mangroves are trees or shrubs found in coastal areas, lagoons, estuaries, and deltas. They form the main vegetation in tidal and saline wetlands, in turn providing habitats for many other species [1]. They are present in the tropics [2], and grow in mud with a flow of freshwater bringing nutrients [3]. The most-extensive mangrove areas are situated in Asia (42%), Africa (20%), North and Central America (15%), Oceania (12%), and finally South America (11%) [4]. They play a vital role in marine life and fisheries by providing food and shelter for a large and varied group of marine organisms, including fish and shellfish [5], and protect coastal areas from storms and sea level rises [6]. Globally, many mangrove forests have been converted to productive lands for agriculture and aquaculture [7]. Estimates of loss range from 35 to 86% [4,8] for the last two decades. Approximately only 6.9% of the world’s mangrove areas are protected under the International Union for Conservation of Nature (IUCN) program [8]. These mangrove communities are vulnerable to threats, mainly due to human impact through coastal construction, industrial pollution, littering, a loss of water quality, and the development of fisheries [9,10,11,12]. In addition, in some areas, natural disasters, such as earthquakes, tsunamis, coastal erosion [13,14], and climate change [15,16], threaten mangroves.
The first record of mangroves in the Red Sea dates to 323 BC [17,18]. Mangroves are not continuously distributed in the Red Sea and show evidence of being at the edge of their environmental range, being stunted in comparison to other deltaic and estuary areas in the world [19]. This is mainly due to a high salinity, reaching around 40%, as well as poor soil textures and very high seawater temperatures (32 °C) [19,20]. A study conducted by Saifullah (1997) revealed that the conditions in the southern part of the Red Sea are more favorable for mangroves than the northern parts because of higher nutrient concentrations, more rainfall, many runnels, and a lower salinity due to the connection to the Indian ocean and the water flow from the Gulf of Aden into the Red Sea [21]. Although large stands of mangroves are found along the Red Sea mainland coast, the Farasan archipelago, which is an uplifted fossil coral reef in the southern part of the Arabian coast of the Red Sea [22,23,24], only has around 36.15 km² of mangroves [25]. The Farasan archipelago is characterized by a high humidity, high mean annual temperatures, and low rainfall [26]. Two species of mangrove occur on these islands: Avicennia marina and the less common Rhizophora mucronata [27,28].
This paper focuses on Avicennia marina (Avicenniaceae) in the Farasan archipelago because it is the dominant mangrove species and because it can reproduce and thrive across a wide range of climatic, saline, and tidal conditions [29,30]. It has several mechanisms leading to a high tolerance of high salinity levels, reaching 70% for populations of Avicennia marina in the Arabian Gulf [31]. The scientific literature on A. marina found on the Farasan islands is limited in coverage of the distribution and coastal ecology. The distribution size of A. marina in the archipelago ranges from stunted bushes, usually growing on the inner fringes of the stand, to well-developed trees reaching up to 4 m in height. This species has been reported on three major islands, including Farasan Al-Kabir, Sajid, and Zifaf (Figure 1); the largest stands occur within the Port of Farasan Alkabir Island [32,33].
A. marina is important for the people of the islands and there is a strategy for its conservation in the natural environment [11]. However, the loss and fragmentation of A. marina are enormous at a regional level. Camel grazing has been reported to be a major problem causing the degradation of A. marina, excluding only a few stands growing on Zifaf Island [12]. Cutting has led to a reduction in the number of trees [34]. Mass mortality of A. marina trees has been caused by the construction of a new soil dam, leading to dry-up, particularly for one stand of A. marina on Farasan Alkabir Island. This modification in the topography of the coastal area diverts tidal water away from A. marina, reducing the area of this species inundated by tidal water in the upper reaches of the stands [12].
The pollution of A. marina areas is largely confined to domestic solid waste, such as polythene bags and bottles, plastic, and metal cans, which are disposed of in large quantities by tourists visiting places near A. marina populations [35]. This practice may have a serious impact by covering the young seedlings and pneumatophores, and blocking tidal channels [36]. The industrial/commercial and artisanal fisheries sectors and coastal urbanization are likely to increase [37]. Many changes are expected on land, and a large part of southeast Farasan Alkabir has been earmarked for a naval base. This development could affect terrestrial and marine wildlife in the area [36].
To provide an integrated management plan for the species, the use of genetic-based methods to measure the diversity and structure among and within populations is fundamental [38]. For A. marina worldwide, genetic diversity has been studied using allozymes [39], random amplified polymorphic DNA (RAPD) [40,41,42], amplified fragment length polymorphisms (AFLPs) [43,44], and microsatellites (SSRs). SSRs have proved appropriate for conservation studies focused on estimating population sizes, population structures, genetic variation, genetic drift, and inbreeding [45]. SSRs have been widely used to study the population-level variation of A. marina in South Africa and Oceania [46,47,48,49]. In addition, the population structure of A. marina has been studied by many researchers and two scenarios have been found. First, some researchers have suggested that there are no discrete boundaries between different parts of the range with allele frequencies changing gradually without any discontinuities, and with little genetic structure [50,51]. This scenario is a rare case in mangrove forests; however, it is common in major forest trees [52,53]. Others have reported propagule dispersal limited by barriers of sea movement and/or isolation by distance causing highly genetic structures between populations [54,55]. Table 1 presents summaries of the findings of these studies on A. marina.
Only one study has focused on A. marina in the Red Sea [47], which concluded that the loss of genetic diversity in the northern Red Sea populations could be attributed to limited gene flow and increased genetic drift arising from a patchy distribution. This study suggested that the Red Sea plants have a distinct genetic composition in comparison to other regions of the Indo-Pacific Ocean [47]. To date, the extent and patterns of genetic diversity in natural A. marina populations in the Farasan archipelago are unknown.
Sexual reproduction in A. marina is conducted through flies and bees. The production of one-seeded fruits may be due to maternal resource limitations or the maternal regulation of seed sets. Each fruit contains one seed, and it grows and matures within 4 weeks [58]. In all these species, the single seed is not germinated directly to produce offspring but remains within the fruit, while still on the maternal parent. This is a specific distinguishing feature of “crypto-viviparous” mangroves [39]. The propagules are flattened ovoids that are small and light, floating on the surface of the water, and the entire embryo is buoyant after detachment from the maternal parent [39]. When the seedlings settle, a radicle penetrates the sediment before the cotyledons unfold. The first formal leaves appear one month after germination and the second pair after one to two months [59].
Propagule dispersal is an important ecological factor in understanding the distribution of mangrove populations and patterns of genetic diversity. The high density of the propagules of A. marina is not found in other mangrove species. Due to their high density, they are not affected by wind action [60]. Knowledge of dispersal distances and directions is essential, as it allows an assessment and prediction of the chance that propagules reach and colonize remote habitat fragments. Flowers appear all year round, but propagule maturation occurs during July–August in the northern hemisphere [50,61]. It has been suggested that the dispersal of A. marina is strongly affected by sea currents [50]. In addition to the effect of sea currents on the genetic structure of A. marina, some barriers exist, such as land barriers in fragmented habitats, the distance between populations [44,56], the geomorphological coast line of the islands (Pavlopoulos et al., 2018), and sea level change. Although there are limited studies on the impacts of climate change on mangroves within the Middle East, a recent study by [62] estimated the recent relative sea level rise (SLR) to be 3.3 mm/year in the Gulf of Aden and the Red Sea. This may threaten the mangroves, as [63] have suggested that up to 96% of coastal wetlands including mangroves are likely to be lost from the region because of the sea level rise.
Here, microsatellite markers, which were developed for A. marina by [46], were used to: (1) assess the genetic diversity of the mangrove species A. marina in the densest area of the Farasan archipelago, (2) identify levels of inbreeding in populations of A. marina found on the Farasan islands, and (3) investigate the genetic structure of populations of A. marina found on the Farasan islands.

2. Material and Methods
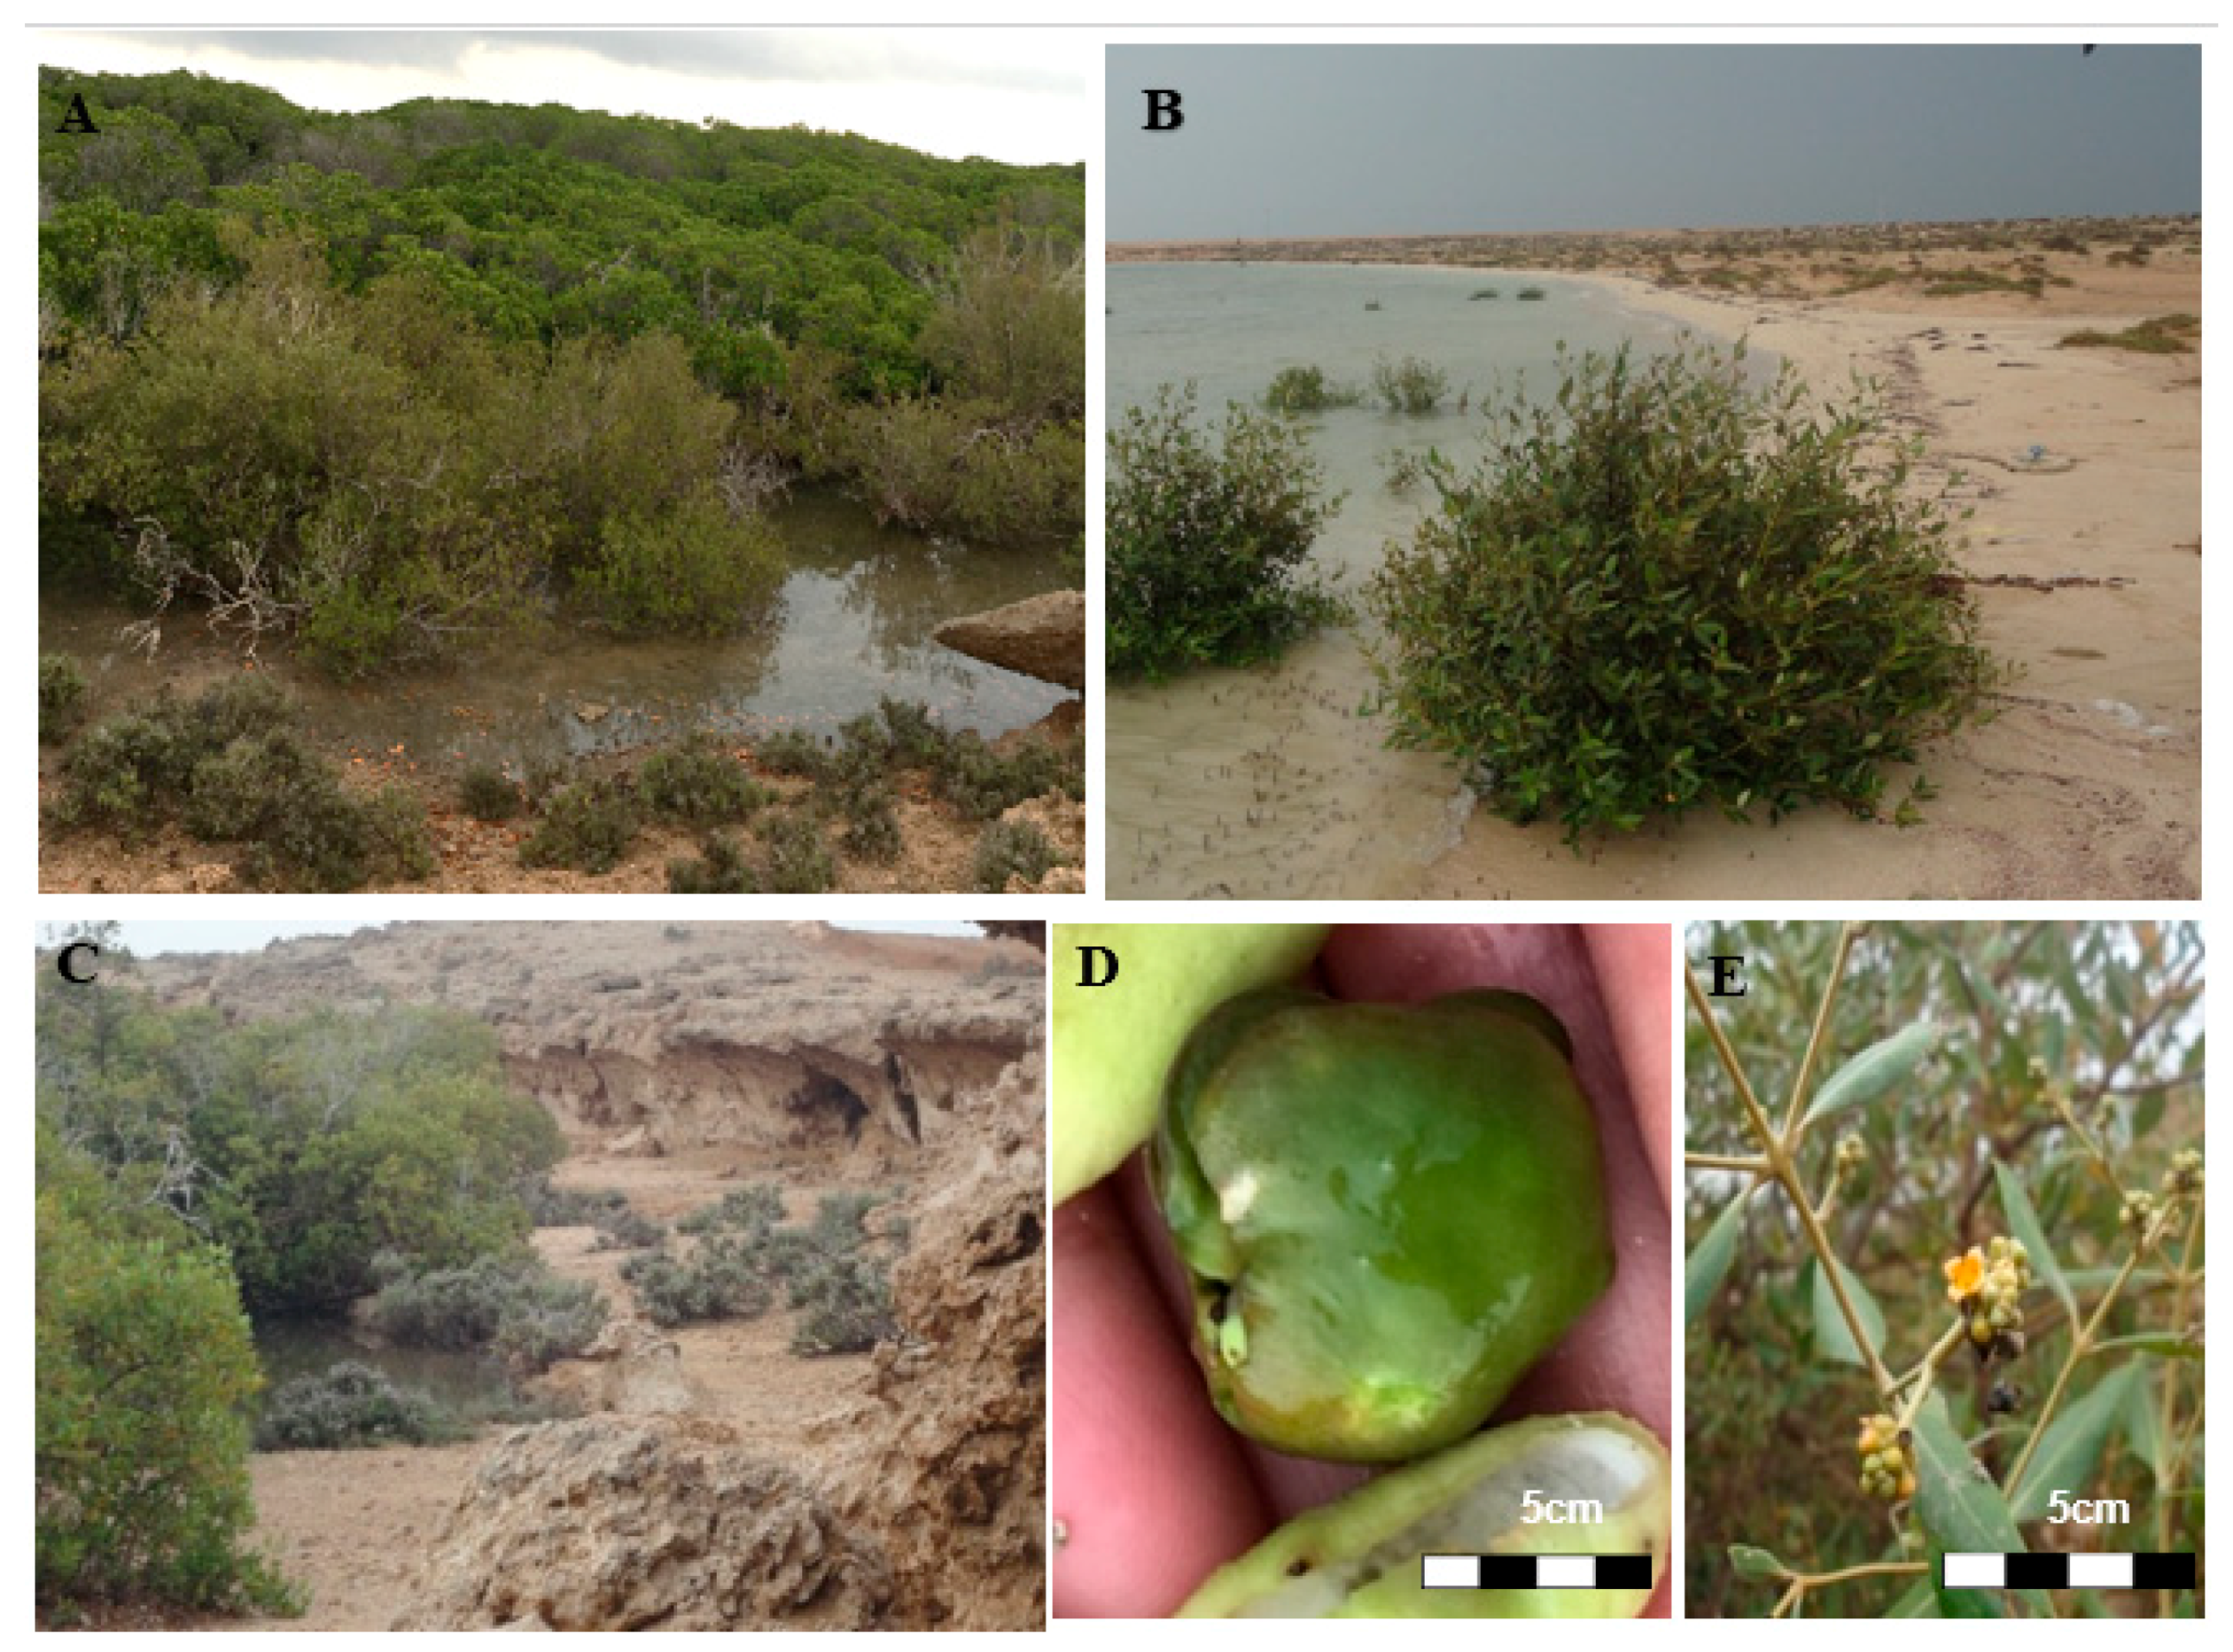
2.1. Study Area

A. marina leaves were collected from nine populations across the Farasan archipelago, during three field studies, between 2015 and 2016 (Table 2). Populations were sampled based on the accessibility of different habitats (Figure 2) and ensuring 5 m between samples to prevent sampling ramets. The number of individuals collected ranged from six to 33 per population, based on the accessibility of samples.
Avicennia marina populations on the Farasan islands occur in discontinuous stretches along the coast in suitable environments interspersed by unsuitable habitats, such as long sandy beaches and rocky shores. The island’s name and size, sampling locations, and coordinates were recorded using a global positioning system (GPS) and are given in Table 2. Permission for sampling was obtained from the Saudi wildlife authority in the Kingdom of Saudi Arabia because these islands are registered as protected areas due to the presence of endemic Arabian gazelle.

2.2. DNA Extraction

Leaves were dried in silica gel prior to extraction. The total genome of DNA was extracted from each individual of A. marina using a modified CTAB protocol, following the method of [64]. The final DNA was suspended in 50 µL of TE buffer. DNA extractions were visualized on 0.7% agarose gels in 1× TAE buffer, in order to confirm the size and concentration of the extracted DNA, using Hyper LadderTM 1kb (Bioline Reagents Ltd., London, UK) as a marker, and gels were illuminated by T: Genius. The concentration and quality were determined with NanoDrop Lite (Thermo Fisher Scientific Inc., Waltham, MA, USA). DNA was diluted to 5 ng/µL for polymerase chain reaction (PCR) amplification. After dilution, the stock DNA solutions were stored in the freezer at −20 °C.

2.3. DNA Amplification by PCR

Microsatellite primer sequences (16 pairs) published by [46] were applied to A. marina samples. Initial primer optimization and screening resulted in the selection of 15 of the original 16 published primer sets for this study. Primer M76 was discarded due to its failure to prime to the samples. The 193 A. marina individuals were genotyped by PCR with 15 polymorphic microsatellite markers, as described in [48,54]. Primers were labeled with fluorescent dyes (6FAM, VIC, PET, and NED) for suspend amplification. The 1× PCR buffer contained 6 µL BioMixTM, 2.6 µL water, 0.2 µL of each primer, and 10–50 ng genomic DNA and yielded a total volume of 10 µL.
The conditions for amplifying the loci (M3, M32, M34, M40, M47, M62, M64, M73, M75, M81, M98, and M85) were one activation cycle at 94 °C for 3 min, followed by the samples being incubated for 30 cycles of 94 °C for 30 s, 60 °C for 35 s, and 72 °C for 1 min. Reactions were completed by incubating samples at 72 °C for 5 min and holding them at 4 °C. For loci (M13, M27, and M49), the conditions were one activation cycle at 94 °C for 3 min, and then 35 amplification cycles as follows: 94 °C for 40 s, 56 °C for 40 s, and 72 °C for 30 s, ending with one extension cycle at 72 °C for 4 min. The microsatellite fragments were separated on 2% agarose gels in 1× TAE buffer. The allele size was estimated using Hyper LadderTM 100 bp (100 to 1000 bp; Bioline Reagents Ltd., London, UK) as a marker. Amplified products were run on an ABI 3031xl automated sequencer with the GeneScan-600 LIZ size standard. Visualization and scoring were carried out using Geneious R11 [65].

2.4. Basic Genetic Parameters: Diversity and Differentiation

After genotyping, the Hardy–Weinberg equilibrium (HWE) was tested using the software popgene 32 [66]. Linkage disequilibrium (LD) between all microsatellite loci pairs was estimated for all accessions using poppr in Rstudio [67]. The number of permutations performed for the LD analysis was 999.
GenAlEx v6.5 software [68], was used to determine the observed heterozygosity (HO), expected heterozygosity (HE), number of alleles for each population, allelic richness (AR), and average of inbreeding coefficient FIS and FST across all loci [69] to assess the population differentiation.
Population differentiation was measured between population pairs across all loci using Arlequin 3.5 [70].

2.5. Genetic Structure Across the Farasan Islands

A simple Mantel test was carried out to determine the relationship between the geographic distance and genetic distance of populations with 10,000 permutations. The genetic differentiation between population pairs was calculated as an FST computed with GenAlEx v6.5 [69].
AMOVA was carried out to examine the hierarchical partitioning of genetic variance, and was performed with GenAlEx v6.5 with 10,000 permutations. As a complementary visualization of the genetic structure, principal coordinate analysis (PCoA) was conducted for A. marina accessions using GenAlEx v6.5 software. The analysis computed a matrix of mean genotypic distance values between all pairs of individuals. A scatter diagram was plotted according to the eigenvalues along the first two principal coordinate axes, which accounted for most of the variation. Discriminant analysis of principal components (DAPC) was used to identify and describe genetic clusters. These analyses were done using the adegenet 2.00 package [71] and the visualization function for DAPC by ‘find.clusters’ [72]. A model-based clustering program Structure v2.3.4 was used to infer the population structure of all accessions in A. marina and the ΔK method was used with the Structure harvester v.0.6.93 to identify the optimal K value following [73]. The length of the Burnin Period was 10,000 and the number of MCMC Reps after Burnin was 50,000. The ancestry model was a no admixture model and to ensure that the run was long enough, we obtained 20 different runs. The Unweighted Pair Group Method with Arithmetic (UPGMA) phylogram was clustered with the function hclust. Murtagh et al. [74] in Rstudio to estimate the genetic distance among accessions.

2.6. The Red Sea Movement

To generate the sea surface circulation, the data were collected from [75,76,77,78], and the Earth observatory EOS at NASA Goddard Space Flight Center. Circulation patterns were compared to the genetic clusters and clusters were identified by STRUCTURE on the map bb QGIS 12.18.16 [79].

3. Results

3.1. Basic Parameters: Genetic Diversity and Variation

Polymerase chain reaction optimization and presentation resulted in a range of 15 simple sequence repeat (SSR) published primers. The observed heterozygosity was slightly lower than the expected heterozygosity in all primers and populations. All the markers were polymorphic except M62 and a total of 142 alleles were detected across the 15 primers (Table 3). The number of alleles per locus varied among markers, ranging from 2 (M62) to 16 (M3, M47, and M81). Major allele frequencies per locus ranged from 1.043 (M62) to 4.153 (M40) (Table 4). Primers M13, M27, and M62 might not be amplified in some individuals, which were preserved as missing data. Missing data comprised 0.06% of the entire data set for A. marina. According to the result of LD, alleles are linked across loci with p < 0.001 overall Pic percent from 93.33% (pop1 and pop3) to 73.33% (pop8 and pop9). Five loci were monomorphic in some populations (M62 in all populations except Pop 2, M98 in Pop4 and Pop9, M27 in Pop2, M64 in Pop7, and M85 in Pop2 and Pop9). Genetic diversity index values ranged from 0.422 (Pop8) to 1.040 (Pop1), indicating low genetic diversity in Sajid and Zifaf Island populations whereas the Farasan Alkabir Island population indicated moderate genetic diversity (Table 4). Hardy–Weinberg Equilibrium (HWE) departures were tested. All of populations had significant departures from HWE, which corresponded to their significant levels of inbreeding. In each case, departures from HWE were due to homozygote excess. Expected heterozygosity (HE) ranged from 0.500 (Pop1) to 0.252 (Pop8), based on populations analysis. The average number of alleles was from 5.733 (Pop1) to 2.067 (Pop8), indicating populations with a mean of 3.467 affected alleles. The number of alleles detected across the nine populations ranged from 86 (Pop1) to 31 (Pop8) (Table 3). The value of F (inbreeding coefficient) was negative in Pop3 from Farasan Alkabir Island and Pop9 from Zifaf Island, implying a considerable degree of outbreeding, whereas positive F in the other populations showed a considerable degree of inbreeding. Pairwise FST values showed significant differentiation between the two populations and among the pairs of all subpopulations ranging from 0.886 to 0.004 (Figure 3), which indicated that the populations and the subpopulations were significantly different. Pop3 and Pop8 were more differentiated from each other according to the FST value (0.886), followed by Pop3 and Pop6 (FST = 0.866). The AMOVA for the nine populations revealed that 55% (p < 0.001) of the genetic variation is found within populations, whereas 45% (p < 0.001) of the genetic variation is found among populations.

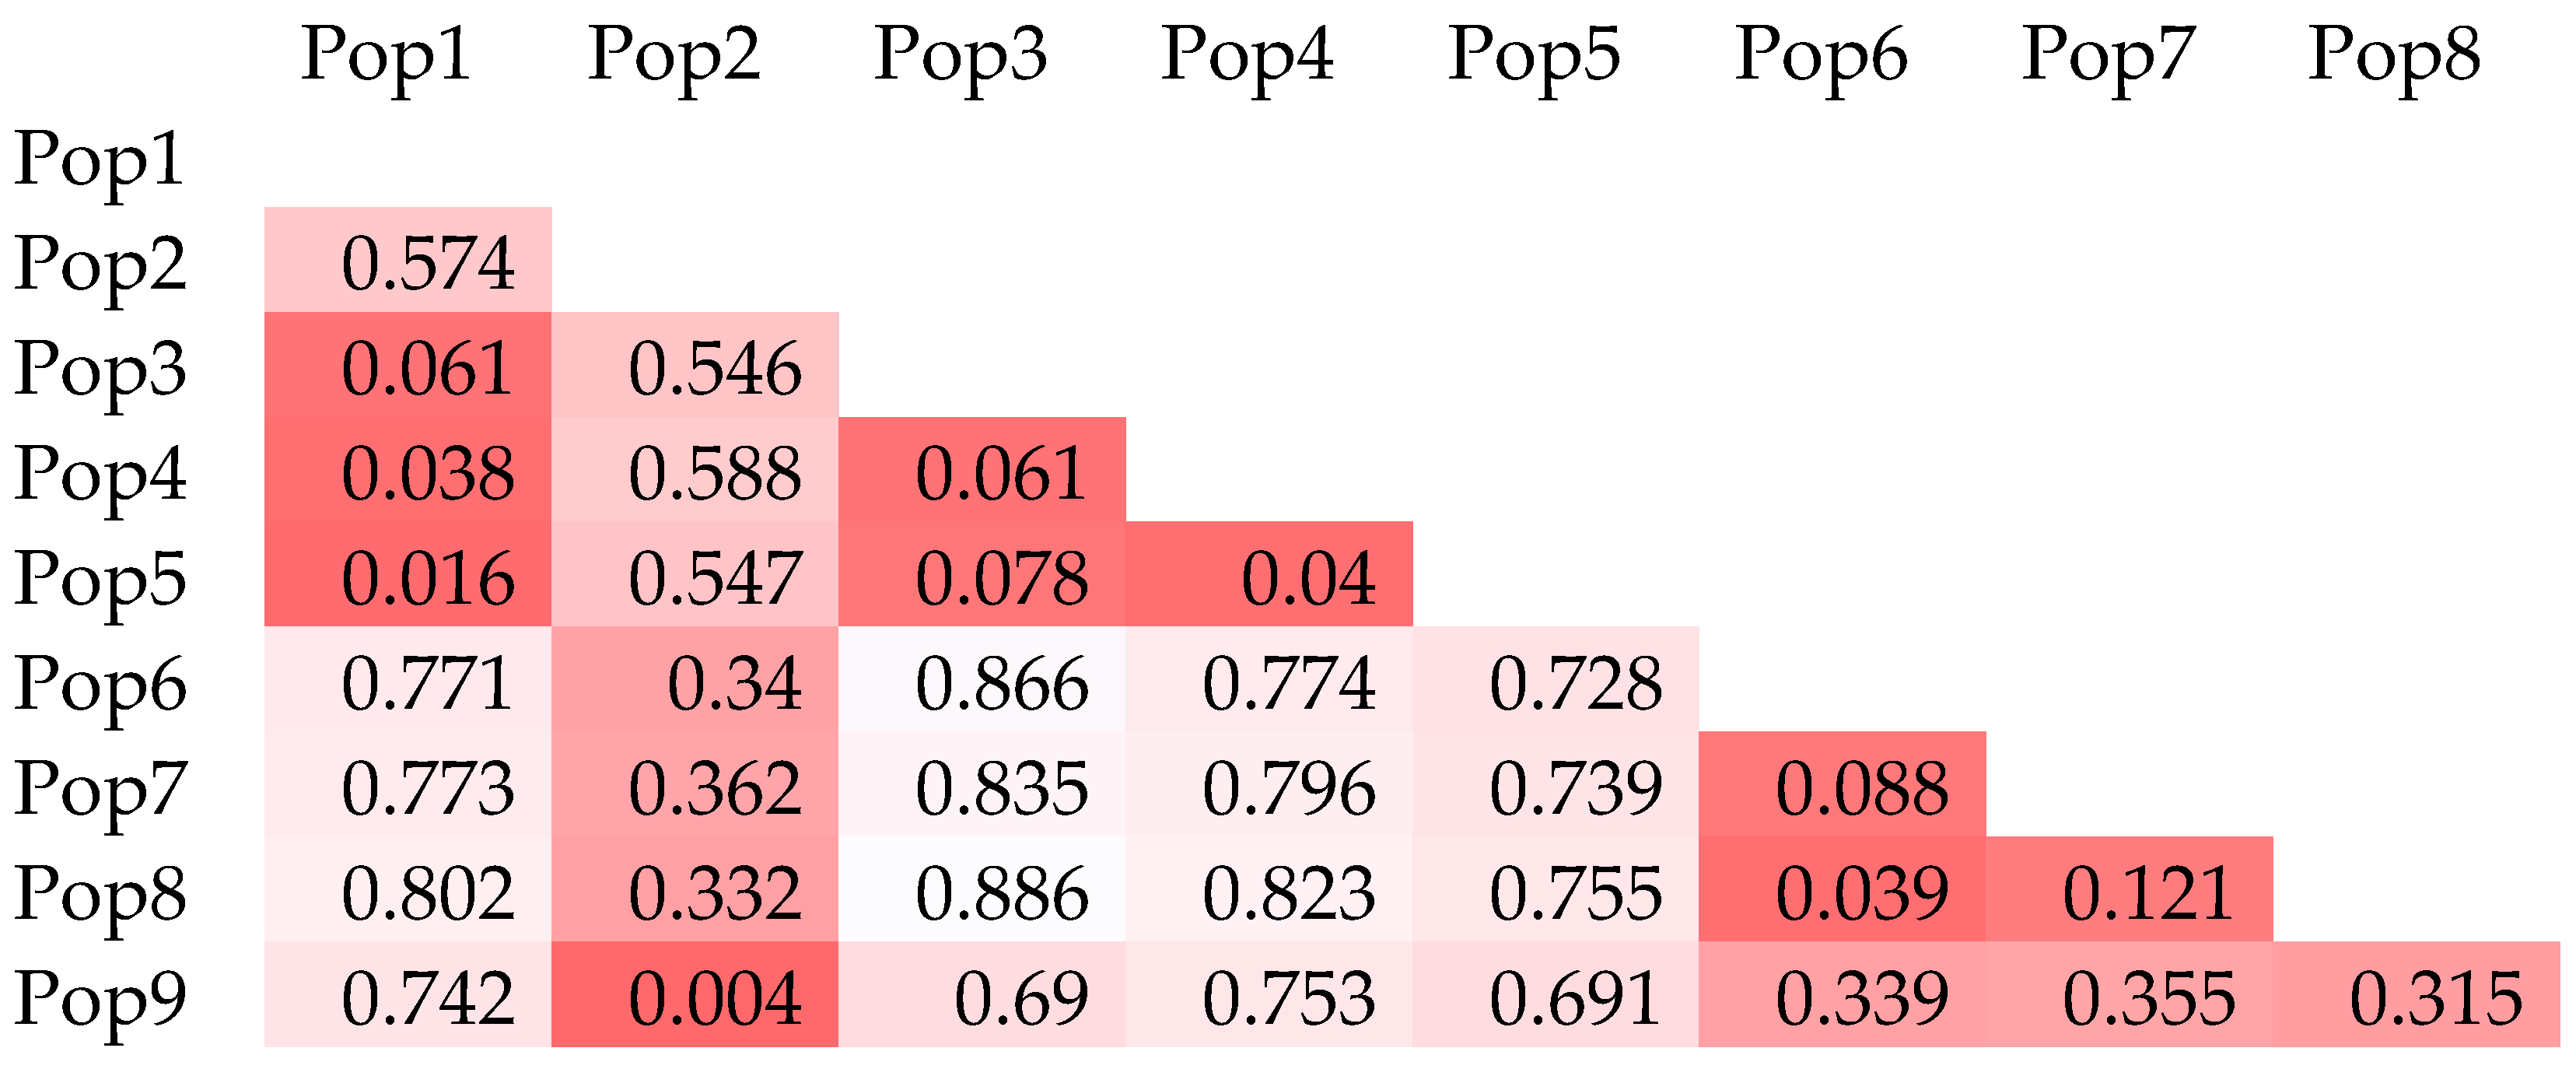
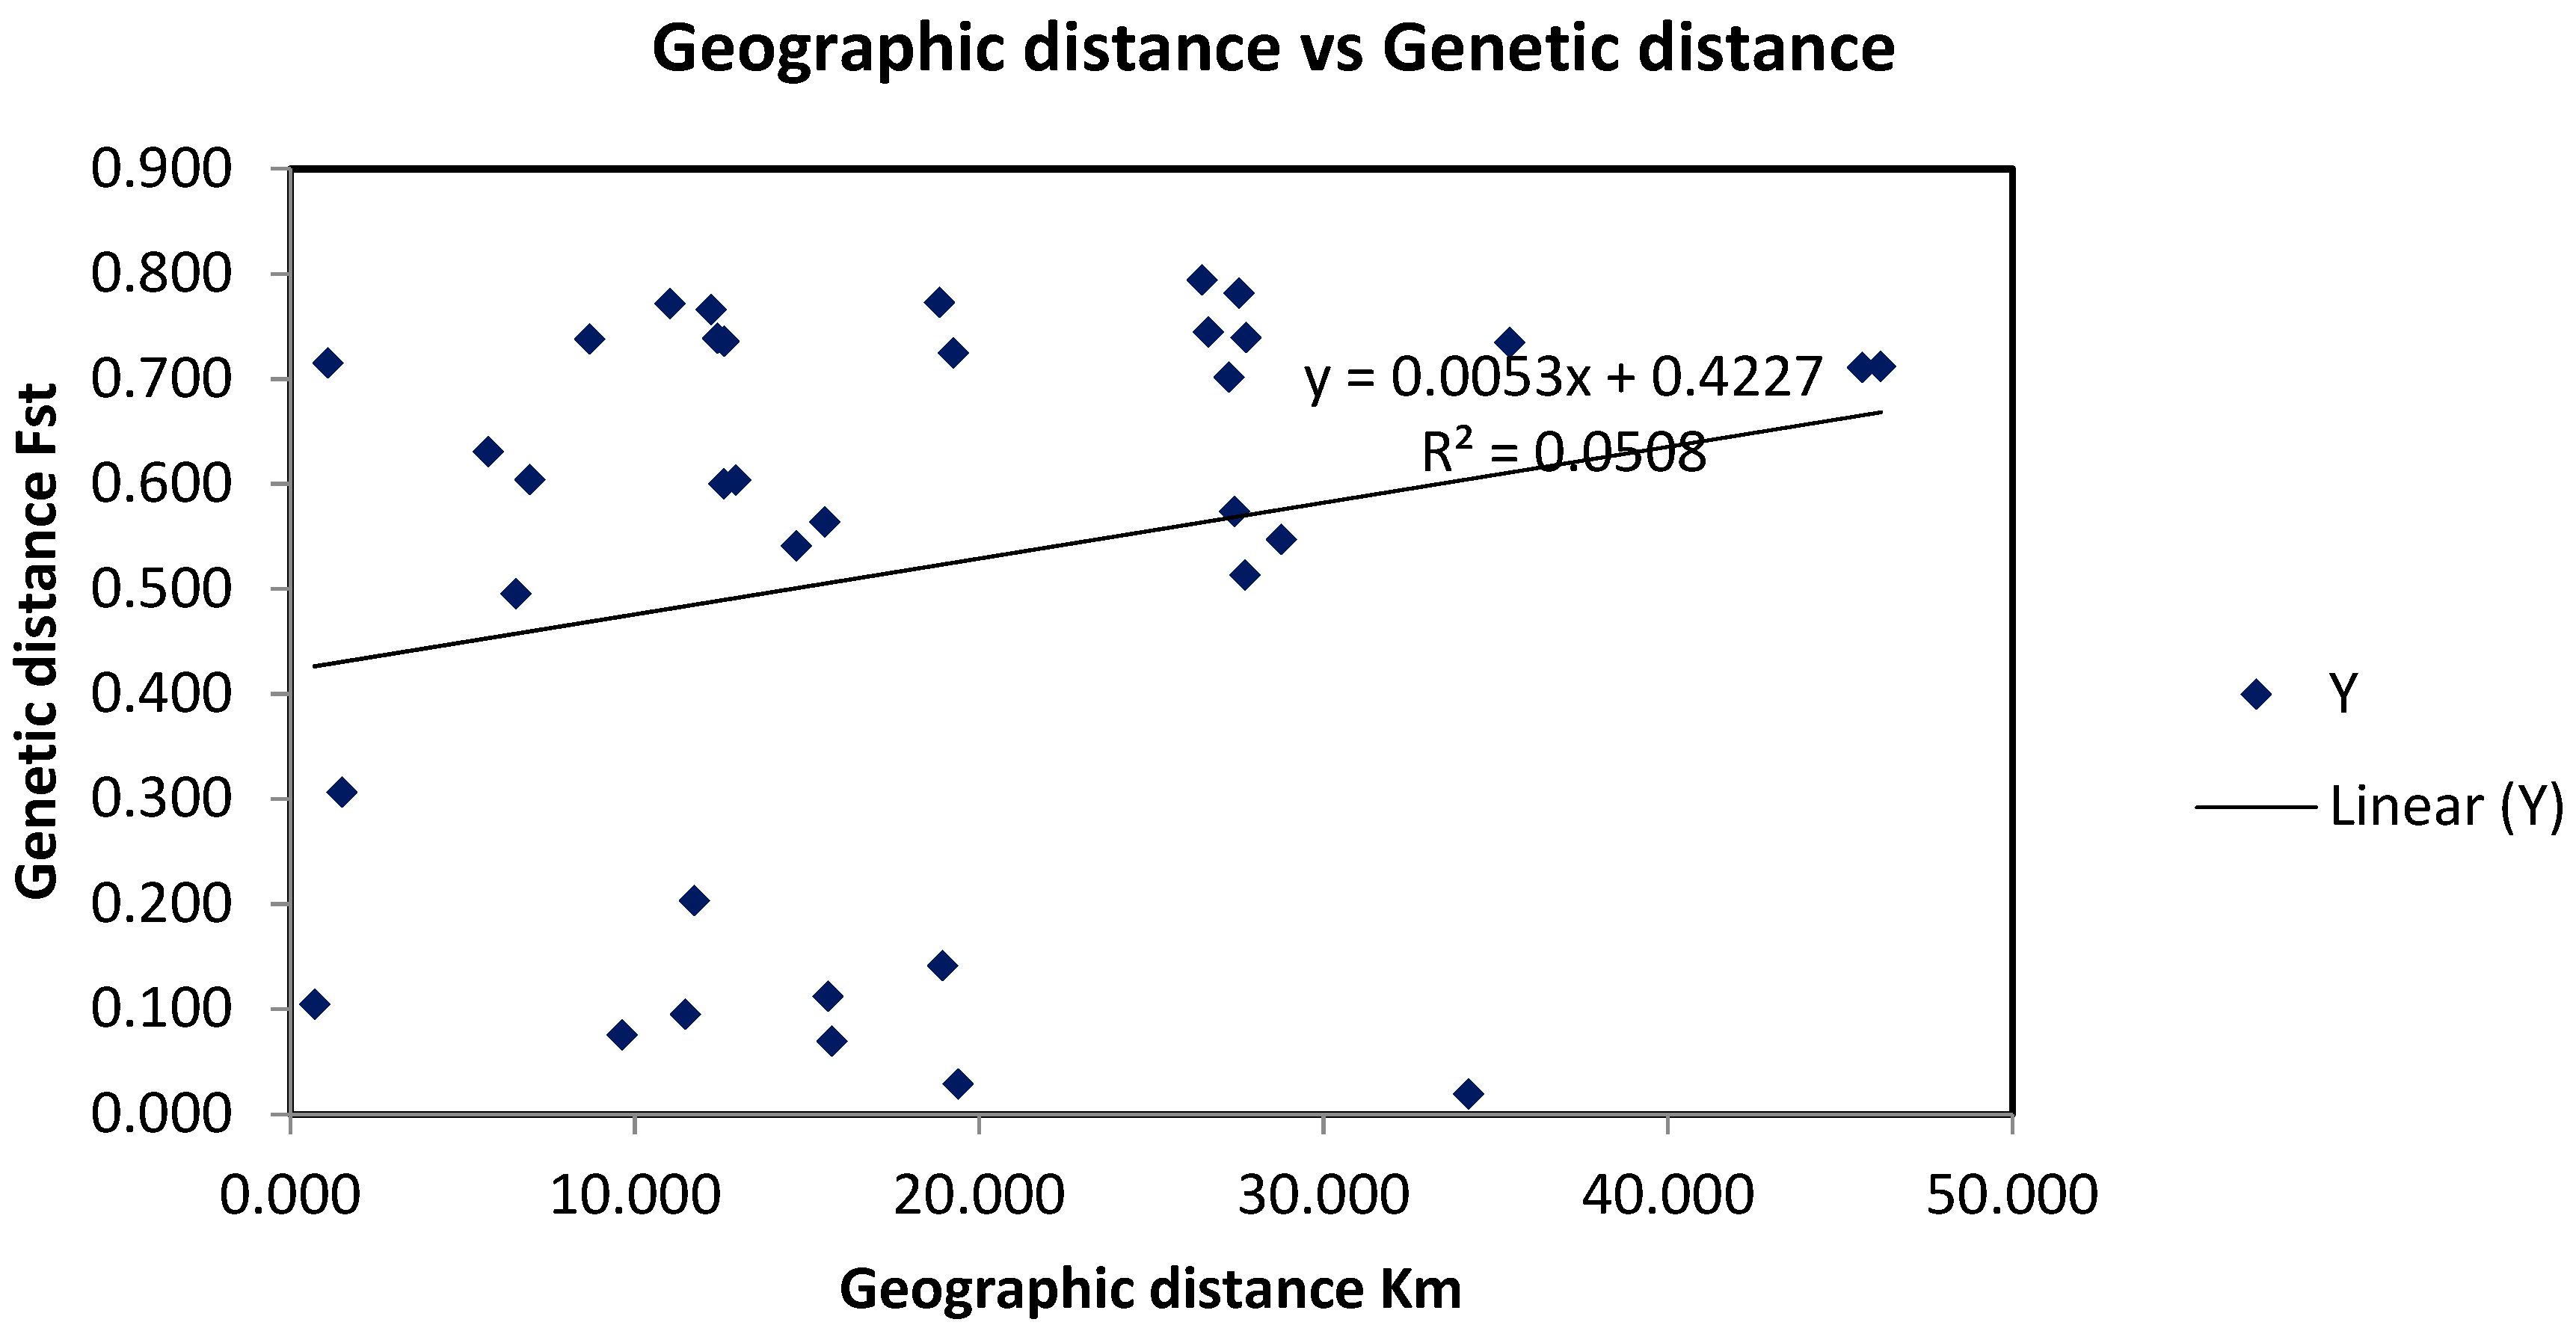
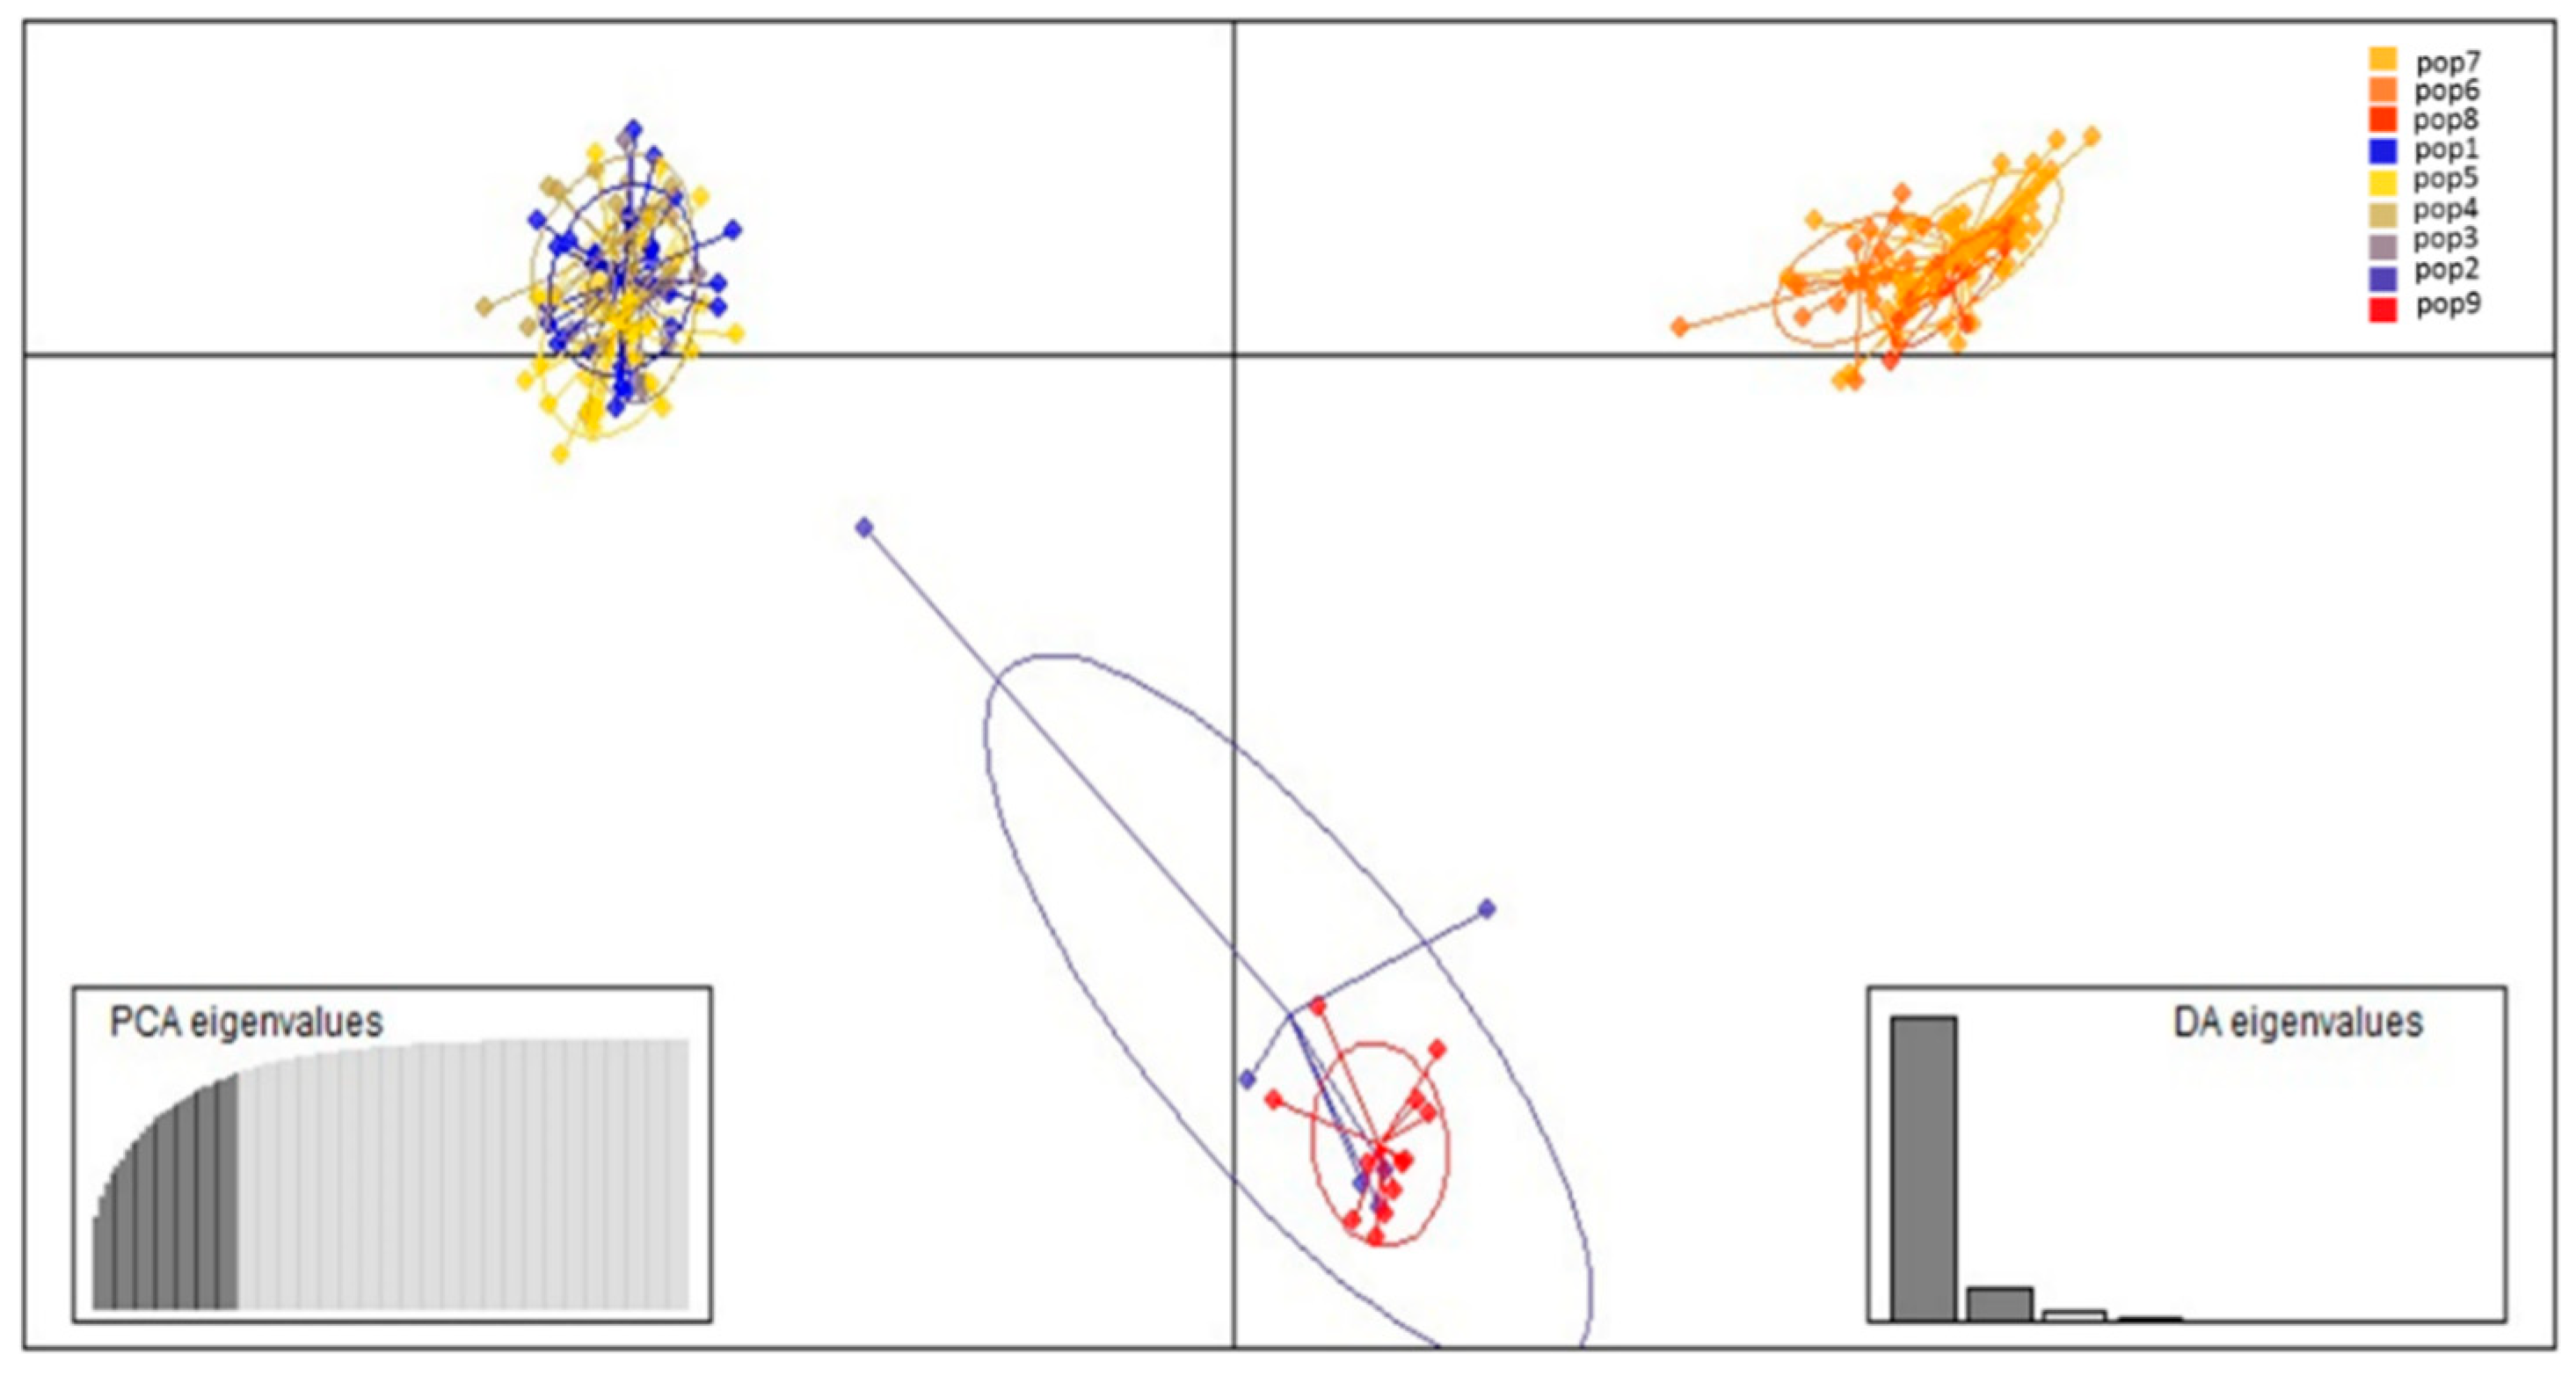
3.2. Population Structure and Cluster Analysis Across the Farasan Islands

Significant genetic divergence between populations from different islands was detected in A. marina populations, with the exception of Pop2 on Farasan Alkabir Island, which was most closely linked to the population of Zifaf Island. Six different genetic analyses detected A. marina populations in the Farasan archipelago: Mantel tests revealed a weak positive correlation between the genetic distance matrix and the geographic distance matrix among the islands (Figure 4) (R2 = 0.0778; p < 0.054).
The PCoA (Figure 5), DAPC (Figure 6), and structure analysis showed the distinct clustering of individuals based on the origin of the island, and the first two principal component axes cumulatively accounted for 90% of the total variance in A. marina accessions on the different islands, including Group 1 A. marina on Farasan Alkabir Island (Pop1, Pop3, Pop4, and Pop5), Group 2 A. marina on Sajid Island (Pop6, Pop7, and Pop8), and Group 3 accessions from Farasan Alkabir Island (Pop2) and A. marina from Zifaf Island (Pop9).
The results from the structure harvester analysis indicated a high peak for the number of clusters when the K value was 2.5–3. This meant that the optimal value of K should have been K = 3. A UPGMA (Figure 7) tree of all 193 accessions was constructed based on Nei’s genetic distance and all the accessions were assigned to the three main clusters. The clustering of accessions in the UPGMA tree was generally in agreement with the population structure identified by the structure analyses.

3.3. Red Sea Current Surface Simulation

The Red Sea current flows in a southeast direction from the Indian Ocean to the northwest direction (January) and there are strong north-west and east-west current drifts during the maturation period of A. marina in the winter season. In contrast, during the summer season (June), the maps of surface circulation climatology indicate that the current direction is from the north to south direction and the flow through the northern part is stronger than that in the southern part of the islands. The genetic link detected between pop9 from Zifaf Island and Pop2 of Farasan Alkabir Island was congruent with Red Sea current patterns on the northern side of the islands (Figure 8).

4. Discussion

In this investigation, A. marina from the Farasan archipelago was studied to understand the genetic variation and the pattern of population structure of this ecologically- and economically-dominant mangrove tree species. This study included 193 individuals and 15 SSR loci, and is more comprehensive and representative in comparison with previous microsatellite studies of A. marina because the number of samples and SSR loci were low in these studies [46,47,48,57]. This study showed that the lack of polymorphism of some loci could be associated with shorter repeats (GGC) 8 and Tri or combined repeats type, which were more frequently monomorphic than long repeats, and dinucleotide repeats (TG) 15 [80]. Departures from HWE of a similar magnitude were also reported in A. marina in Vietnam [44] and Avicennia germinans and Rhizophora mangle in the Caribbean and the Pacific estuaries of Panama [81].
In the analyses of allelic diversity per locus, the average allele diversity found here was 9.4, showing a slightly high level of allelic diversity compared to the values detected previously for A. marina samples from the Australia’s Northern Territory (6.7) [43,46,48]. This is possibly because these previous studies used less than half of the SSR loci and small-sized populations. The allelic diversity in this study showed a lower level of allelic diversity than [46], who investigated six different Australian states and territories (17.3).
The SSRs were more informative for understanding population genetic diversity when the studies used a greater number of loci and increased the number of samples. A comparative analysis of allelic diversity across the populations, focused on the observed and expected heterozygosity, revealed that A. marina populations display moderate genetic variation on Farasan Alkabir Island, which is consistent with the study of Avicennia marina worldwide (He 0.494; Maguire et al., 2000) and north of the Red Sea [47]. The low genetic variation on Zifaf and Sajid islands was also revealed for A. marina in Vietnam (He 0:322; Le et al., 2003); Australia, especially the northern population [43]; and the east coast of India [48]. In comparison with A. marina populations in the Arabian Gulf [42], the Red Sea populations show a lower genetic diversity, because of the harsh environmental conditions in the Red Sea. Authors of previous studies suggested that a reduction in the heterozygosity level may be due to repeated bottlenecks and founder effects [82,83], which are associated with the geoclimatic history in the Red Sea and genetic drift in the small isolated populations. This could explain the pattern of A. marina populations in the Farasan archipelago. The historical Red Sea level fluctuations due to past climatic changes [84] would further reduce the long-term effective population size, in addition to distinct genetic compositions, which would lead to low genetic diversity within populations. Besides the sea level fluctuation factor, the patchy distribution of A. marina populations along the coast of the Farasan archipelago, with a complicated geomorphological coastline [85], prevents genetic exchanges among sampled populations, as demonstrated in the study on the north Red Sea by [47]. The pattern of isolated populations increases the inbreeding coefficient, which is the most reasonable explanation for heterozygote deficiency. Moreover, strong inbreeding and high self-fertilization have been reported as common characteristics among mangrove species Avicennia germinans and Rhizophora mangle [81].
The estimation of FST showed high genetic differentiation among populations (0.322). The value was similar to those in populations of A. marina worldwide [8,42] and in Vietnam populations [44]. This indicates that the gene flow is limited between populations within the archipelago. As A. marina pollen dispersal can only occur within populations or between populations, propagule dispersal is the main factor for the genetic connectivity in A. marina populations. In this study, the dispersal of A. marina propagules was limited by sea currents and the gene flow has shown the populations which are separated by a few tens of kilometers [54,86]. Therefore, it is clear that A. marina in the Farasan archipelago exhibit significant genetic differentiation among populations. The hierarchical analysis of molecular variance (AMOVA) also showed that most of the variation was partitioned among populations and within individuals in the total population. There was little variation among individuals within populations. From these analyses, discrete subpopulation patterns are likely for A. marina which agrees with [40,44,54,57].
The results of Bayesian clustering showed that the genetic structure of A. marina was affected by many factors, such as the isolation by distance, geomorphological coastline, and direction of sea currents (Figure 8A,B). The isolation by distance has weak effects on the genetic structure, as indicated by the Mantel test, which displayed a weak correlation between the genetic and geographic distance. For example, populations 2 and 9 have the greatest geographic distance (49.28 km); however, they share the same genetic group. In this case, migration could have been driven by high-speed currents during winter seasons. However, population 5 displays a distance of only 1.460 m over the water from the nearest population, which is population 6; these two populations exhibited significant differentiation between each other and each population in a different genetic group [54,57].
The geomorphological coastline plays important roles in the distribution pattern of populations in the Farasan archipelago and has a strong effect on the limited dispersal ability of propagules. The populations that are isolated by land and with less interconnected sea currents have smaller gene flow, as shown among populations between islands. In contrast, a higher level of genetic exchange occurred when the population location was directly connected by the sea currents and there were no land barriers, such as the populations of each island on the same coast [44].
There is a correlation between the genetic structure and the sea circulation patterns in the archipelago, preventing propagule exchange between Farasan Alkabir populations and Sajid Island populations. Further evidence for sea circulation in the northern part of the archipelago revealed the mixing of some individuals from Farasan Alkabir Island and Zifaf Island (Figure 4C). This similar congruence between the genetic structure and bifurcating sea currents was also found in A. marina populations in southeast Asia [55] and Vietnam [44]. Hence, the explicit inclusion of sea circulation patterns in phylogeographical studies of coastal (even if it is a straight coast) and marine organisms is valuable in understanding complex genetic structures.

5. Conclusions

Populations of A. marina are threatened by complicated geomorphological coastlines, human-induced pressure, urbanization, wood harvesting, grazing, and tourism sector development. This could lead to a loss of genetic diversity through increased population fragmentation of A. marina in the Farasan archipelago. The use of microsatellites to assess the genetic diversity of natural populations can support the improved conservation of A. marina in the Farasan archipelago, which may be one of the most important issues facing the future of mangrove forestry practices. A. marina on Sajid and Zifaf Islands displayed a lower genetic diversity than populations on Farasan Alkabir Island. This suggests that sufficient genetic variation exists for the selection of superior individuals or populations to advance the genetic improvement program. These results contribute to knowledge of the population structure in the Farasan archipelago, as consequences of restricted gene dispersal. High levels of genetic structure on local scales can be detected here due to the coastal geomorphology, climate change, and the direction of sea currents. Therefore, they are likely to be of interest for conservation strategies and breeding or genetic-improvement programs not only based on preserving large areas, but also smaller and separate ones, in order to encompass the different genetic patterns found between the islands.

Author Contributions

R.N.A.-Q. and S.A.A. processed the experimental data, R.N.A.-Q. performed the analysis, R.N.A.-Q. drafted the manuscript and designed the figures. R.N.A.-Q. and S.A.A. manufactured the samples and R.N.A.-Q. aided in interpreting the results and worked on the manuscript. All authors discussed the results and commented on the manuscript. All authors have read and agreed to the published version of the manuscript.

Funding

This research was funded by King Khalid University and the Saudi Cultural Bureau.

Acknowledgments

This research was supported by the University of Reading, School of Biological Science. Many thanks to Alastair Culham—our supervisor—for his guidance. Thanks to the Saudi Cultural Bureau and King Khalid University for funding, as well as Saudi Wildlife Authority, for helping us obtain permission and providing a field trip guide.

Conflicts of Interest

The authors declare that there is no conflict of interest.

References

  1. Duke, N.C. Mangrove floristics and biogeography. Trop. Mangrove Ecosyst. 1992, 41, 63–100. [Google Scholar]
  2. Chen, R.; Twilley, R.R. A simulation model of organic matter and nutrient accumulation in mangrove wetland soils. Biogeochemistry 1999, 44, 93–118. [Google Scholar] [CrossRef]
  3. Kathiresan, K.; Bingham, B.L. Biology of mangroves and mangrove ecosystems. Adv. Mar. Biol. 2001, 40, 81–251. [Google Scholar]
  4. Giri, C.; Ochieng, E.; Tieszen, L.L.; Zhu, Z.; Singh, A.; Loveland, T.; Masek, J.; Duke, N. Status and distribution of mangrove forests of the world using earth observation satellite data. Glob. Ecol. Biogeogr. 2011, 20, 154–159. [Google Scholar] [CrossRef]
  5. Bosire, J.O.; Dahdouh-Guebas, F.; Kairo, J.G.; Cannicci, S.; Koedam, N. Spatial variations in macrobenthic fauna recolonisation in a tropical mangrove bay. Biodivers. Conserv. 2004, 13, 1059–1074. [Google Scholar] [CrossRef] [Green Version]
  6. Barbier, E.B.; Hacker, S.D.; Kennedy, C.; Koch, E.W.; Stier, A.C.; Silliman, B.R. The value of estuarine and coastal ecosystem services. Ecol. Monogr. 2011, 81, 169–193. [Google Scholar] [CrossRef]
  7. Mastaller, M. Mangroves: The Forgotten Forest between Land and Sea; Tropical Press: Kuala Lumpur, Malaysia, 1997. [Google Scholar]
  8. Duke, N.C.; Meynecke, J.O.; Dittmann, S.; Ellison, A.M.; Anger, K.; Berger, U.; Cannicci, S.; Diele, K.; Ewel, K.C.; Field, C.D.; et al. A World without Mangroves? Science 2007, 317, 41–42. [Google Scholar] [CrossRef] [PubMed] [Green Version]
  9. Tawfiq, N.; Olsen, D.A. Saudi Arabia’s response to the 1991 Gulf oil spill. Mar. Pollut. Bull. 1993, 27, 333–345. [Google Scholar] [CrossRef]
  10. Macintosh, D.J.; Ashton, E.C. A Review of Mangrove Biodiversity Conservation and Management; Centre for Tropical Ecosystems Research, University of Aarhus: Aarhus, Denmark, 2002. [Google Scholar]
  11. PERSGA. Strategic Action Programme for the Red Sea and Gulf of Aden, (Regional Organization for the Conservation of the Environment of the Red Sea and Gulf of Aden); The World Bank: Washington, DC, USA, 2004. [Google Scholar]
  12. Kotb, M.; Abdulaziz, M.; Al-Agwan, Z.; Alshaikh, K.; Al-Yami, H.; Banajah, A.; Devantier, L.; Eisinger, M.; Eltayeb, M.; Hassan, M. Status of coral reefs in the Red Sea and Gulf of Aden in 2004. Wilkinson 2004, 70, 137–139. [Google Scholar]
  13. Kumar, A. Reclaimed islands and new offshore townships in the Arabian Gulf: Potential natural hazards. Curr. Sci. (00113891) 2009, 96, 34–44. [Google Scholar]
  14. Kumar, A.; Khan, M.A.; Muqtadir, A. Distribution of mangroves along the Red Sea coast of the Arabian Peninsula: Part-I: The northern coast of western Saudi Arabia. Earth Sci. India 2010, 3, 1–22. [Google Scholar]
  15. Spalding, M.D.; Blasco, F.; Field, C.D. World Mangrove Atlas; The International Society for Mangrove Ecosystems: Okinawa, Japan, 1997; p. 178. [Google Scholar]
  16. Ellison, J.C.; Stoddart, D.R. Mangrove ecosystem collapse during predicted sea-level rise: Holocene analogues and implications. J. Coast. Res. 1991, 7, 151–165. [Google Scholar]
  17. Schneider, P. The discovery of tropical mangroves in Graeco-Roman antiquity: Science and wonder. J. Hakluyt Soc. 2011, 3, 1–16. [Google Scholar]
  18. Flenley, J.R. Tropical Forests under the Climates of the Last 30,000 Years. In Potential Impacts of Climate Change on Tropical Forest Ecosystems; Markham, A., Ed.; Springer: Dordrecht, The Netherlands, 1998; pp. 37–57. [Google Scholar]
  19. Mandura, A.S.; Khafaji, A.K.; Saifullah, S.M. Mangrove ecosystem of southern Red Sea coast of Saudi Arabia. Proc. Saudi Biol. Soc. 1987, 10, 165–193. [Google Scholar]
  20. Saifullah, S. Mangrove ecosystem of Red Sea coast (Saudi Arabia). Pak. J. Mar. Sci. 1997, 6, 115–124. [Google Scholar]
  21. Bailey, G. The Red Sea, Coastal Landscapes, and Hominin Dispersals. In The Evolution of Human Populations in Arabia. Vertebrate Palaeobiology and Palaeoanthropology; Petraglia, M.D., Rose, J.I., Eds.; Springer: Dordrecht, The Netherlands, 2009; pp. 15–37. [Google Scholar]
  22. Rohling, E.J.J.P. Glacial conditions in the Red Sea. Paleoceanography 1994, 9, 653–660. [Google Scholar] [CrossRef] [Green Version]
  23. Khan, M.A.; Kumar, A.; Muqtadir, A. Distribution of Mangroves along the Red Sea Coast of the Arabian Peninsula: Part 2. The Southern Coast of Western Saudi Arabia. Earth Sci. India 2010, 3, 154–162. [Google Scholar]
  24. Bailey, G.N.; Sakellariou, D.; Alsharekh, A.; Al Nomani, S.; Devès, M.; Georgiou, P.; Kallergis, M.; Kalogirou, S.; Manousakis, L.; Mantopoulos, P. Africa-Arabia connections and geo-archaeological exploration in the southern Red Sea: Preliminary results and wider significance. In Under the Sea: Archaeology and Palaeolandscapes of the Continental Shelf; Springer: Dordrecht, The Netherlands, 2017; pp. 361–373. [Google Scholar]
  25. Almahasheer, H.; Aljowair, A.; Duarte, C.M.; Irigoien, X. Decadal stability of Red Sea mangroves. Estuar. Coast. Shelf Sci. 2016, 169, 164–172. [Google Scholar] [CrossRef] [Green Version]
  26. Hall, M.; Llewellyn, O.; Miller, A.; Al-Abbasi, T.; Al-Wetaid, A.; Al-Harbi, R.; Al-Shammari, K. Important Plant Areas in the Arabian Peninsula: 2. Farasan Archipelago. Edinb. J. Bot. 2010, 67, 189–208. [Google Scholar] [CrossRef]
  27. El-Demerdash, M. The vegetation of the farasān islands, Red Sea, Saudi Arabia. J. Veg. Sci. 1996, 7, 81–88. [Google Scholar] [CrossRef]
  28. Farooqui, N.U.; Al Zahrani, D.A.; El Metwally, M.; Dangi, C. A Review on the Impact of Exotoxicology and Oil Spills in Mangrove of Saudi Arabia. J. Pure Appl. Microbiol. 2015, 9, 549–556. [Google Scholar]
  29. Khafaji, A.K.; Manfura, A.S.; Saifullah, S.M.; Sambas, A.Z. Litter production in two mangrove stands in southern Red Sea coast of Saudi Arabia (Jizan). J. King Abdulaziz Univ. Mar. Sci. 1991, 2, 93–100. [Google Scholar] [CrossRef]
  30. Migahid, A.M. Flora of Saudi Arabia; Riyadh University Publications: Riyadh, Saudi Arabia, 1978. [Google Scholar]
  31. Dodd, R.S.; Blasco, F.; Rafii, Z.A.; Torquebiau, E. Mangroves of the United Arab Emirates: Ecotypic diversity in cuticular waxes at the bioclimatic extreme. Aquat. Bot. 1999, 63, 291–304. [Google Scholar] [CrossRef]
  32. Mutairi, K.A.; El-Bana, M.; Mansor, M.; Al-Rowaily, S.; Mansor, A. Floristic diversity, composition, and environmental correlates on the arid, coralline islands of the Farasan Archipelago, Red Sea, Saudi Arabia. Arid Land Res. Manag. 2012, 26, 137–150. [Google Scholar] [CrossRef]
  33. Rasul, N.M.A.; Stewart, I.C.F. The Red Sea: The Formation, Morphology, Oceanography and Environment of a Young Ocean Basin; Springer: Berlin/Heidelberg, Germany, 2015. [Google Scholar]
  34. Mandura, A.S.; Khafaji, A.K. Human impact on the mangrove of Khor Farasan Island, southern Red Sea coast of Saudi Arabia. In Towards the Rational Use of High Salinity Tolerant Plants; Springer: Dordrecht, The Netherlands, 1993; pp. 353–361. [Google Scholar]
  35. Hariri, K.; Gladstone, W.; Facey, C. State of the Marine Environment-Report for the Red Sea and Gulf of Aden: 2006; PERSGA: Jeddah, Saudi Arabia, 2014. [Google Scholar]
  36. Al-Wetaid, A.; Khalil, A. Status of Red Sea Mangrove in Kingdom of Saudi Arabia; Draft Report; PERSGA: Jeddah, Saudi Arabia, 2003. [Google Scholar]
  37. Gladstone, W. The ecological and social basis for management of a Red Sea marine-protected area. Ocean Coast. Manag. 2000, 43, 1015–1032. [Google Scholar] [CrossRef] [Green Version]
  38. Allendorf, F.W.; Luikart, G. Conservation and the Genetics of Populations; John Wiley & Sons: Hoboken, NJ, USA, 2009. [Google Scholar]
  39. Duke, N.C.; Benzie, J.A.; Goodall, J.A.; Ballment, E.R. Genetic structure and evolution of species in the mangrove genus Avicennia (Avicenniaceae) in the Indo-West Pacific. Evolution 1998, 52, 1612–1626. [Google Scholar] [CrossRef]
  40. Parani, M.; Lakshmi, M.; Elango, S.; Ram, N.; Anuratha, C.; Parida, A. Molecular phylogeny of mangroves II. Intra-and inter-specific variation in Avicennia revealed by RAPD and RFLP markers. Genome 1997, 40, 487–495. [Google Scholar] [CrossRef]
  41. Parida, A.; Parani, M.; Lakshmi, M.; Elango, S.; Ram, N.; Anuratha, C. Molecular Phylogeny of Mangroves IV. Nature and Extent of Intra-Specific Genetic Variation and Species Diversity in Mangroves; M.S. Swaminathan Research Foundation: Madras, India, 1998; pp. 95–105. [Google Scholar]
  42. Hazarika, D.; Thangaraj, M.; Sahu, S.K.; Kathiresan, K. Genetic diversity in three populations of Avicennia marina along the eastcoast of India by RAPD markers. J. Environ. Biol. 2013, 34, 663. [Google Scholar]
  43. Maguire, T.; Peakall, R.; Saenger, P. Comparative analysis of genetic diversity in the mangrove species Avicennia marina (Forsk.) Vierh. (Avicenniaceae) detected by AFLPs and SSRs. Theor. Appl. Genet. 2002, 104, 388–398. [Google Scholar] [CrossRef]
  44. Le, H.G.; Hong, P.N.; Tuan, M.S.; Harada, K. Genetic variation of Avicennia marina (Forsk.) Vierh. (Avicenniaceae) in Vietnam revealed by microsatellite and AFLP markers. Genes Genet. Syst. 2003, 78, 399–407. [Google Scholar]
  45. Allendorf, F.W.; Luikart, G. Conservation and the Genetics of Populations; Blackwell Pub.: Malden, MA, USA, 2013. [Google Scholar]
  46. Maguire, T.L.; Saenger, P.; Baverstock, P.; Henry, R. Microsatellite analysis of genetic structure in the mangrove species Avicennia marina (Forsk.) Vierh. (Avicenniaceae). Mol. Ecol. 2000, 9, 1853–1862. [Google Scholar] [CrossRef] [PubMed]
  47. Yoshimori, I.; Seo, A.; Nawata, H.; Fouda, M.M.; Yoshikawa, K. New Microsatellite Markers to Analyze Genetic Structure of Gray Mangrove, Avicennia marina. J. Arid Land Stud. 2015, 25, 11–16. [Google Scholar]
  48. Zolgharnien, H.; Kamyab, M.; Keyvanshokooh, S. Genetic diversity of Avicennia marina populatians in the persian Gulf by Microsatellite Markers. J. Fish. Aquat. Sci. 2010, 223–229. [Google Scholar]
  49. Manurung, J.; Siregar, I.Z.; Kusmana, C.; Dwiyanti, F.G. Genetic variation of the mangrove species Avicennia marina in heavy metal polluted estuaries of Cilegon Industrial Area, Indonesia. Biodiversitas J. Biol. Divers. 2017, 18, 1109–1115. [Google Scholar] [CrossRef]
  50. Duke, N.C. Mangrove taxonomy, biogeography and evolution—An Indo West Pacific perspective of implications for conservation and management. Perm. Agric. Resour. 2006, 77, 641–666. [Google Scholar]
  51. De Ryck, D.J.; Koedam, N.; Van Der Stocken, T.; Van Der Ven, R.M.; Adams, J.; Triest, L. Dispersal limitation of the mangrove Avicennia marina at its South African range limit in strong contrast to connectivity in its core East African region. Mar. Ecol. Prog. Ser. 2016, 545, 123–134. [Google Scholar] [CrossRef]
  52. Leonardi, S.; Menozzi, P. Spatial structure of genetic variability in natural stands of Fagus sylvatica L. (beech) in Italy. Heredity 1996, 77, 359. [Google Scholar] [CrossRef] [Green Version]
  53. Rossetto, M.; Slade, R.; Baverstock, P.R.; Henry, R.J.; Lee, L.S. Microsatellite variation and assessment of genetic structure in tea tree (Melaleuca alternifolia–Myrtaceae). Mol. Ecol. 1999, 8, 633–643. [Google Scholar] [CrossRef]
  54. Maguire, T.L.; Edwards, K.J.; Saenger, P.; Henry, R. Characterisation and analysis of microsatellite loci in a mangrove species, Avicennia marina (Forsk.) Vierh. (Avicenniaceae). Theor. Appl. Genet. 2000, 101, 279–285. [Google Scholar] [CrossRef]
  55. Arnaud-Haond, S.; Teixeira, S.; Massa, S.I.; Billot, C.; Saenger, P.; Coupland, G.; Duarte, C.M.; Serrao, E. Genetic structure at range edge: Low diversity and high inbreeding in Southeast Asian mangrove (Avicennia marina) populations. Mol. Ecol. 2006, 15, 3515–3525. [Google Scholar] [CrossRef]
  56. Melville, F.; Burchett, M. Genetic variation in Avicennia marina in three estuaries of Sydney (Australia) and implications for rehabilitation and management. Mar. Pollut. Bull. 2002, 44, 469–479. [Google Scholar] [CrossRef]
  57. Kahrood, H.V.; Korori, S.A.A.; Pirseyedi, M.; Shirvany, A.; Danehkar, A. Genetic variation of mangrove species Avicennia marina in Iran revealed by microsatellite markers. Afr. J. Biotechnol. 2008, 7, 1–16. [Google Scholar]
  58. Raju, A.J.S.; Rao, P.V.S.; Kumar, R.; Mohan, S.R. Pollination biology of the crypto-viviparous Avicennia species (Avicenniaceae). J. Threat. Taxa 2012, 4, 3377–3389. [Google Scholar] [CrossRef] [Green Version]
  59. Wickham, H. Ggplot2: Elegant Graphics for Data Analysis; Springer: Dordrecht, The Netherlands, 2016. [Google Scholar]
  60. Van Der Stocken, T.; Vanschoenwinkel, B.; De Ryck, D.J.; Bouma, T.J.; Dahdouh-Guebas, F.; Koedam, N. Interaction between water and wind as a driver of passive dispersal in mangroves. PLoS ONE 2015, 10, e0121593. [Google Scholar] [CrossRef] [PubMed] [Green Version]
  61. Giesen, W.; Wulffraat, S.; Zieren, M.; Scholten, L. Mangrove guidebook for Southeast Asia. In Mangrove Guidebook for Southeast Asia; Wetlands International: Wageningen, The Netherlands, 2007; 769p. [Google Scholar]
  62. Alothman, A.O.; Bos, M.S.; Fernandes, R.M.S.; Ayhan, M.E. Sea level rise in the north-western part of the Arabian Gulf. J. Geodyn. 2014, 81, 105–110. [Google Scholar] [CrossRef]
  63. Blankespoor, B.; Dasgupta, S.; Laplante, B. Sea-level rise and coastal wetlands. Ambio 2014, 43, 996–1005. [Google Scholar] [CrossRef] [PubMed] [Green Version]
  64. Maguire, T.L.; Collins, G.G.; Sedgley, M. A modified CTAB DNA extraction procedure for plants belonging to the family Proteaceae. Plant Mol. Biol. Report. 1994, 12, 106–109. [Google Scholar] [CrossRef]
  65. Kearse, M.; Moir, R.; Wilson, A.; Stones-Havas, S.; Cheung, M.; Sturrock, S.; Buxton, S.; Cooper, A.; Markowitz, S.; Duran, C.; et al. Geneious Basic: An integrated and extendable desktop software platform for the organization and analysis of sequence data. Bioinformatics 2012, 28, 1647–1649. [Google Scholar] [CrossRef]
  66. Yeh, F.C.; Yang, R.C.; Boyle, T.B.J.; Ye, Z.; Xiyan, J.M. PopGene32, Microsoft Windows-Based Freeware for Population Genetic Analysis; Version 1.32; Molecular Biology and Biotechnology Centre, University of Alberta: Edmonton, AB, Canada, 2000. [Google Scholar]
  67. Kamvar, Z.N.; Tabima, J.F.; Grünwald, N.J. Poppr: An R package for genetic analysis of populations with clonal, partially clonal, and/or sexual reproduction. PeerJ 2014, 2, e281. [Google Scholar] [CrossRef] [Green Version]
  68. Peakall, R.; Smouse, P.E. GENALEX 6: Genetic analysis in Excel. Population genetic software for teaching and research. Mol. Ecol. Notes 2006, 6, 288–295. [Google Scholar] [CrossRef]
  69. Weir, B.S.; Cockerham, C.C. Estimating F-statistics for the analysis of population structure. Evolution 1984, 38, 1358–1370. [Google Scholar] [PubMed]
  70. Excoffier, L.; Lischer, H.E. Arlequin suite ver 3.5: A new series of programs to perform population genetics analyses under Linux and Windows. Mol. Ecol. Resour. 2010, 10, 564–567. [Google Scholar] [CrossRef] [PubMed]
  71. Jombart, T. Adegenet: A R package for the multivariate analysis of genetic markers. Bioinformatics 2008, 24, 1403–1405. [Google Scholar] [CrossRef] [PubMed] [Green Version]
  72. Jombart, T.; Devillard, S.; Balloux, F. Discriminant analysis of principal components: A new method for the analysis of genetically structured populations. BMC Genet. 2010, 11, 94. [Google Scholar] [CrossRef] [Green Version]
  73. Earl, D.A. Structure Harvester: A website and program for visualizing structure output and implementing the Evanno method. Conserv. Genet. Resour. 2012, 4, 359–361. [Google Scholar] [CrossRef]
  74. Murtagh, F.; Legendre, P. Ward’s hierarchical agglomerative clustering method: Which algorithms implement Ward’s criterion? J. Classif. 2014, 31, 274–295. [Google Scholar] [CrossRef] [Green Version]
  75. Sofiaos, S.S. An Oceanic General Circulation Model (OGCM) investigation of the Red Sea circulation, 1. Exchange between the Red Sea and the Indian Ocean. J. Geophys. Res. 2002, 107, 1–17. [Google Scholar]
  76. Sofiaos, S.S. An Oceanic General Circulation Model (OGCM) investigation of the Red Sea circulation: 2. Three-dimensional circulation in the Red Sea. J. Geophys. Res. 2003, 108. [Google Scholar] [CrossRef]
  77. Yao, F.; Hoteit, I.; Pratt, L.J.; Bower, A.S.; Köhl, A.; Gopalakrishnan, G.; Rivas, D. Rivas, Seasonal overturning circulation in the Red Sea: 2. Winter circulation. J. Geophys. Res. Ocean. 2014, 119, 2263–2289. [Google Scholar] [CrossRef] [Green Version]
  78. Yao, F.; Hoteit, I.; Pratt, L.J.; Bower, A.S.; Zhai, P.; Köhl, A.; Gopalakrishnan, G. Seasonal overturning circulation in the Red Sea: 1. Model validation and summer circulation. J. Geophys. Res. Ocean. 2014, 119, 2238–2262. [Google Scholar] [CrossRef] [Green Version]
  79. Neteler, M.; Mitasova, H. Open Source GIS: A GRASS GIS Approach; Springer Science & Business Media: Berlin, Germany, 2013. [Google Scholar]
  80. Biswas, M.K.; Xu, Q.; Mayer, C.; Deng, X. Genome wide characterization of short tandem repeat markers in sweet orange (Citrus sinensis). PLoS ONE 2014, 9, e104182. [Google Scholar] [CrossRef] [PubMed] [Green Version]
  81. Cerón-Souza, I.; Bermingham, E.; McMillan, W.O.; Jones, F.A. Comparative genetic structure of two mangrove species in Caribbean and Pacific estuaries of Panama. BMC Evol. Biol. 2012, 12, 205. [Google Scholar] [CrossRef] [PubMed] [Green Version]
  82. Islam, M.S.; Lian, C.; Kameyama, N.; Hogetsu, T. Low genetic diversity and limited gene flow in a dominant mangrove tree species (Rhizophora stylosa) at its northern biogeographical limit across the chain of three Sakishima islands of the Japanese archipelago as revealed by chloroplast and nuclear SSR analysis. Plant Syst. Evol. 2013, 300, 1123–1136. [Google Scholar]
  83. Yang, Y.; Li, J.; Yang, S.; Li, X.; Fang, L.; Zhong, C.; Duke, N.C.; Zhou, R.; Shi, S. Effects of Pleistocene sea-level fluctuations on mangrove population dynamics: A lesson from Sonneratia alba. BMC Evol. Biol. 2017, 17, 22. [Google Scholar] [CrossRef] [Green Version]
  84. Saad, A.M.E. Wave and Wind Conditions in the Red Sea. A Numerical Study Using a Third Generation Wave Model; The University of Bergen: Bergen, Norway, 2010. [Google Scholar]
  85. Pavlopoulos, K.; Koukousioura, O.; Triantaphyllou, M.; Vandarakis, D.; De Procé, S.M.; Chondraki, V.; Fouache, E.; Kapsimalis, V. Geomorphological changes in the coastal area of Farasan Alkabir Island (Saudi Arabia) since mid Holocene based on a multi-proxy approach. Quat. Int. 2018, 493, 198–211. [Google Scholar] [CrossRef]
  86. Dodd, R.S.; Rafii, Z.A. Evolutionary genetics of mangroves: Continental drift to recent climate change. Trees 2002, 16, 80–86. [Google Scholar] [CrossRef]
Figure 1. Geographical locations of the nine natural populations of Avicennia marina in the Farasan archipelago.
Forests 11 01287 g001
Figure 2. Different habitats of A. marina in the Farasan archipelago. (A) coral sand on Farasan Alkabir Island, (B) sand on Sajid Island, (C) rocky habitat on Farasan Alkabir Island, (D) propagule of A. marina, and (E) the flower of A. marina.
Forests 11 01287 g002
Figure 3. Heatmap of pairwise FST values estimated from microsatellite data between all populations. All values are significant at the p < 0.001 level, a dark color indicates the minimum value of genetic variation, and a light color indicates the maximum value of genetic variation between populations. For abbreviations of localities see Table 1.
Forests 11 01287 g003
Figure 4. Mantel’s test for the correlation between Fst genetic distance and geographic distance (km) (R2 = 0.0508; p < 0.05).
Forests 11 01287 g004
Figure 5. Principal coordinate analysis (PCoA) of the microsatellite diversity among the 193 accessions of A. marina. Samples are color coded according to their membership in the nine populations.
Forests 11 01287 g005
Figure 6. Discriminant analysis of principal components (DAPC) among nine natural populations of A. marina across the Farasan archipelago. Eigenvalues are presented here.
Forests 11 01287 g006
Figure 7. UPGMA tree of A. marina from nine natural populations along the Farasan archipelago, red color includes individuals from Farasan Alkabir Island (Pop1, Pop3, and Pop4), blue color includes individuals from Sajid Island (Pop5, Pop6, and Pop7), and green color includes individuals from Zifaf Island and Farasan Alkabir Island (Pop2 and Pop9).
Forests 11 01287 g007
Figure 8. Maps depicting the genetic structure among populations of Avicennia marina and the sea surface circulations in the Farasan archipelago. (A,B) Surface current climatology from the model is shown for (A) the summer season (B) and winter season, where the number indicates the current speed in m/s. (C) Structure bar plots showing the assignment of individuals to three distinct genetic clusters (K = 3).
Forests 11 01287 g008
Table 1. Summary of the findings from genetic variation and genetic structure studies on A. marina.
Study AreaNo. of PopMarkerNo. LociNo. AllelesGenetic DiversityFstGenetic StructureData AnalysisStudy Source
Pichavaram, Bhitarkanika Goa, Calicut10RAPD1413227.47%26.5%Discrete subpopulations, 77% differential among populations.Multivariate statistics package[40]
Worldwide18Allozymes826High level
0–0.217
Low level
0.384
Discrete subpopulations, gene flow among populations was relatively low, except where populations were geographically continuous.Biosys-l[39]
India10RAPD1417276.7%--Nei’s index, UPGMA tree[41]
Worldwide closet site = 500 km14SSRs3700.4070.384Discrete sub-populations with inbreeding at the edge.AMOVA- Mantel tests-
Genepop
[54]
Australia6SSRS
AFLPs
3
3
52
918 b
0.78
0.193
- GeeneAlEX (AMOVA-Mantel test)[43]
Local scale: Sydney9Isozyme2283--Isolation by distance with inbreeding in each estuary.AMOVA, TWINSPAN[56]
Vietnam6AFLAP
SSRS
3
5
232
21
0.086
0.210
0.262
0.338
Discrete sub-populations with inbreeding at all sites.Popgene 3.2, PHYLP[44]
Southeast Asia12SSRs71180.15–0.790.01–0.67Discrete sub-populations with reduced diversity at range edges.Bottleneck 1.2.02, Genetix.[55]
Iran3SSRs3140.451 to 0.6670.03–0.05Reduced level of genetic variation was found in the central population, indicating a strong genetic structure among the other population with a large area and less exploitation.Popgene 3.2, UPGMA tree[57]
Arabian Gulf4SSRs54 to 4.60.782 to 0.9600.044Low genetic differentiation among the populations.FSTAT, UPGMA tree by TFPGA Ver. 1.3[48]
East coast of India3RAPD103880.2274 ± 0.1122--PopGene[42]
North Red Sea coast3Est SSRs53–60.5–0.7--GeeneAlEX Version 6.4[47]
Indonesia3SSRs4140.54–0.60.002–0.09Low level of genetic variation in heavily polluted area.PopGene, AMOVA by GeneAlEX Ver. 6.4,UPGMA tree by NTSys[49]
Table 2. A. marina populations tested (name and code), latitude and longitude of the location, island area, island habitat, and inhabited status.
Island’s PopulationsHabitatInhabited AreaCodeLatitudeLongitude
Farasan Al-KabirSandYesPop116.70860842.177948
Farasan Al-KabirSandYesPop216.75272142.065627
Farasan Al-KabirRockyYesPop316.70496942.172678
Farasan Al-KabirRockyYesPop416.80416642.069108
Farasan Al-KabirSandYesPop516.74760242.000543
SajidSandYesPop616.75675542.00426
SajidSandYesPop716.85641741.968098
SajidSandYesPop816.85764841.981981
ZifafRockyNoPop916.73315641.745078
Table 3. Simple Sequence Repeat (SSR) primers screened for SSR-polymerase chain reaction (PCR) in A. marina: primer sequence, repetitive sequence, range size (bp), total number of alleles per primer over all localities (A), observed heterozygosity (Ho), expected heterozygosity (He), gene flow (Nm), and F-statistic (Fis, Fit, and Fst).
LocusPrimer SequenceTm (°C)Repetitive SequenceRange Size (bp)AHoHeNmFisFitFst
M13F:CAATGGTGATTCTCCAAAATTGCTTTG
R:TGGTGAATAGATGACAGTAAGGATCAGCC
56(AT)10(GT)12175–205120.7770.6270.889−0.2380.0330.219
M3F:GGTTCCTGCAAGTATGTCAACACCCTC
R:ACCTCGATTCCTCCCCGAATGC
60(TG)15183–200160.6940.7090.9650.0210.2220.206
M27F:GGTGGAGTTTCAGTTCATCGTTCG
R:CCGCAGTGGGGTTCATCAAAC
56(CCG)8103–10850.3830.2801.666−0.370−0.1910.131
M32F:TGTGAACTTTGCTTCAGAGTCTCGAAGATG R:AGTCAAATGGAGCCTCATTCCTCCG60(AC)14156–177110.4170.3702.252−0.126−0.0140.100
M34F:TCTGCTGTTGCTGTTGTTGTTGATGC R:TGGTGTTGAAGACTAATCATGTGTTTCGC60(GCT)14189–19440.2620.2150.147−0.2180.5500.630
M40F:CCCATAGATGACGGCAATCTTATGATCC R:ACCATCCAAAATAAAATAAATCTCCCTCCC60(AG)32140–168140.6090.6821.2840.1060.2520.163
M47F:TGACACCAAGGGAAATCAACATGCC R:GAACCTAGCGACCAATAGATCATCCTGG60(CA)13180–210160.3330.6650.8130.4990.6170.235
M49F:TTTCCTCACGACAGACTAGAAACCACC R:CAATAAACTTGGATAAAGGCAACTCCGAC56(TG)16176–18050.0980.2970.5720.6710.7710.304
M62F:TTGAGGAAAACATGGGACTTTCACTCG R:GTGGGAGTAGCCGCATAGAGTCACG60(CGC)8227–22920.0000.0310.0171.0001.0000.938
M64F:CAAACCCTACCAATCAGAACACTTCAAGC R:CGATATTTGGCTAATCCACTCTGCTGACTG60(CAG)8148–15870.3950.3300.192−0.1990.4790.565
M73F:TTCCACAATCACTTGACCCTCGTCC R:TCTTCACAGGTCCTCTCCTGCCCTG60(TG)15167–172120.1840.2760.1800.3340.7210.582
M75F:TCCATAATCAAACAACTCGACAACGAAATC R:TCTTCTCTCCCTATTCCAAACTGGCTTG60(TG)14208–21090.4120.5741.6880.2810.3740.129
M81F:GAATGATGATCGGATGTTGCTACTCCTG R:CAATCCCAAAGCCCCAAAAATAATCC60(CA)9(CT)1154–167160.2920.4290.3510.3180.6020.416
M85F:TGACAGAGGTTTAGAGACATGGAGGGTGAG R:TGCCTCCCACATTCACCACACTGC60(GGC)8105–11890.2010.2242.2510.1040.1930.100
M98F:CCCAAACTCGTTACGATGGATGACTTC R:CTTACAGTTGCGGTAAAATGAGACGTGC60(CGG)8211–22040.2120.1862.077−0.139−0.0170.107
Table 4. Descriptive statistics of the overall loci for each population of A. marina: number of individuals (N), number of alleles (A), average number of alleles per locus (Na), percentage of polymorphic loci (Pic,%), number of effective alleles (Ne), observed heterozygosity (Ho), expected heterozygosity (HE), Shannon’s information index (I), and fixation index (F).
PopulationNANaPicNeH0HEIF
Pop133865.73393.33%2.7590.4340.5001.0400.114
Pop26483.20086.67%2.2360.3560.4210.7910.190
Pop311553.66793.33%2.4120.4610.4590.878−0.047
Pop419583.86786.67%2.3980.3440.4370.8410.169
Pop532614.06793.33%2.4020.4040.4620.8880.084
Pop650543.60086.67%2.0450.3200.3890.7400.098
Pop720402.66780.00%1.6790.2730.2920.5350.028
Pop810312.06773.33%1.4700.2530.2520.4220.005
Pop912352.33373.33%1.8200.3170.3250.557−0.041
Total/Mean193523.46785.19%2.1360.3510.3930.7430.070
Publisher’s Note: MDPI stays neutral with regard to jurisdictional claims in published maps and institutional affiliations.

