Article

Plot-Scale Agroforestry Modeling Explores Tree Pruning and Fertilizer Interactions for Maize Production in a Faidherbia Parkland

1
Center for Environmental Science, College of Natural and Computational Sciences, Addis Ababa University, Addis Ababa 1000, Ethiopia
2
Tasmanian Institute of Agriculture, University of Tasmania, Private Bag 98, Hobart, TAS 7001, Australia
3
Commonwealth Scientific and Industrial Research Organization, Private Bag 12, Hobart, TAS 7001, Australia
4
Commonwealth Scientific and Industrial Research Organization, 203 Tor St, Toowoomba, QLD 4350, Australia
*
Author to whom correspondence should be addressed.
Forests 2020, 11(11), 1175; https://doi.org/10.3390/f11111175
Submission received: 16 September 2020 / Revised: 29 October 2020 / Accepted: 3 November 2020 / Published: 4 November 2020
(This article belongs to the Section Forest Ecology and Management)

Abstract

:
Poor agricultural productivity has led to food shortages for smallholder farmers in Ethiopia. Agroforestry may improve food security by increasing soil fertility, crop production, and livelihoods. Agroforestry simulation models can be useful for predicting the effects of tree management on crop growth when designing modifications to these systems. The Agricultural Production Systems sIMulator (APSIM) agroforestry tree-proxy model was used to simulate the response of maize yield to N fertilizer applications and tree pruning practices in the parkland agroforestry system in the Central Rift Valley, Ethiopia. The model was parameterized and tested using data collected from an experiment conducted under trees and in crop-only plots during the 2015 and 2016 growing seasons. The treatments contained three levels of tree pruning (100% pruned, 50% pruned, and unpruned) as the main plots, and N fertilizers were applied to maize at two rates (9 or 78 kg N ha−1) as sub-plots. Maize yield predictions across two years in response to tree pruning and N applications under tree canopies were satisfactorily simulated (NSE = 0.72, RSR = 0.51, R2 = 0.8). Virtual experiments for different rates of N, pruning levels, sowing dates, and cultivars suggest that maize yield could be improved by applying fertilizers (particularly on crop-only plots) and by at least 50% pruning of trees. Optimal maize yield can be obtained at a higher rate of fertilization under trees than away from them due to better water relations, and there is scope for improving the sowing date and cultivar. Across a 34-year range of recent climate, small increases in yields due to optimum N-fertilizing and pruning were probably limited by nutrient limitations other than N, but the highest yields were consistently in the 2–4 m zone under trees. These virtual experiments helped to form hypotheses regarding fertilizers, pruning, and the effects of trees on soil that warrant further field evaluation.

1. Introduction

Crop production in Ethiopia and other sub-Saharan Africa countries is strongly affected by low levels of soil fertility [1,2] as well as inadequate or poorly distributed rainfall [3,4]. Cereal crops including maize constitute a crucial part of the diet in Ethiopia. Maize accounts for 27% of Ethiopia’s total cereal production and is critical for the food security of smallholder subsistence farmers [5]. However, average maize yield (3.2 t ha−1) at the farm level [6] remains far below the yields (5–10 t ha−1) reported from experimental stations [5,7], mainly due to more nutrient and water stresses on farms, which indicates that the maize yield there could be increased by improving nutrient and water availability to the crops. Trees can reduce surface soil temperatures, wind, and evapotranspiration, and enhance biological and ecological processes such as nutrient cycling, nitrogen fixation, and soil microbial activity [8]. Growing crops with leguminous trees in the parklands of Ethiopia, where scattered mature trees occur as an integral part of crop and livestock production landscapes, therefore could potentially provide sustainable and affordable strategies to improve crop productivity and livelihoods for smallholder farmers with limited access to N fertilizer [9].
Parklands are one of the oldest agroforestry systems and are common features of the agricultural landscape of Ethiopia. For example, in the Central Rift Valley (CRV) of Ethiopia, Faidherbia is the most common tree species, and crops such as maize (Zea mays L.), wheat (Triticum aestivum L.), teff (Eragrostis tef (Zucc.) Trotter), and beans (Phaseolus vulgaris L.) are grown under it. These trees are considered to improve crop productivity and provide services such as shade, erosion control, soil fertility, and tree products [10]. Despite these positive effects, tree competition for light, nutrients, and water can reduce crop yields [11]. Thus, an understanding of how trees affect crop productivity is critical to managing the potential impacts of competition on crop yields [12]. Pruning is useful for reducing competition for light [13,14] and smaller canopies can have reduced water and nutrient demands that thereby also reduce below-ground competition. Prunings are also needed for fencing materials and fuel wood. As a result, farmers in the current study area totally prune tree branches (pollarding) at intervals of 3–4 years. A study in the parkland of the CRV on the impacts of F. albida (Delile) A. Chev. trees and fertilizer management on maize production found that maize yields could be maintained or improved by partial pruning of F. albida and by preferentially applying fertilizers in normal and wet years [15].
Ethiopia is a country that is quite vulnerable to the impacts of climate variability and change due to its heavy reliance on small-scale rain-fed farming systems. Climate variability, particularly rainfall variability and associated droughts, have been reported as major causes of food insecurity in Ethiopia [7]. Thus, there is a high demand for quantitative information on climate variability and their impacts on crop yields. The application of simulation models is important for improved understanding of the variability and expected future changes of climatic conditions and to evaluate the climate risk management options [16].
APSIM (the Agricultural Production Systems sIMulator) is a modular modeling framework developed to simulate biophysical processes in farming systems at plot and farm scales [17]. The model has been applied to explore management options, genetic trait evaluation, crop choice, and farming system design [18]. This modeling framework was validated for agroforestry use by successfully simulating maize yield, soil water content, and soil carbon in response to interactions of N fertilizer and intercropping with shrubs or small trees of Gliricidia sepium (Jacq.) Kunth) in row systems in Kenya and Malawi [19]. Their simulations were undertaken using field data collected over two years (short-term) in Kenya and 11 years (long-term) in Malawi. Successful application of the model indicated that this agroforestry model warranted further application including in widely spaced (circular, single-tree) geometries of tree–crop interactions and using trees with large canopies. The capability to simulate crop growth in response to competition for solar radiation (shading) is one of this model’s capabilities [20,21], which provides an opportunity to simulate crop production under tree canopies.
Simulation models can be applied to quantitatively understand the interactions amongst components of agroforestry systems including management for improved productivity [19,22]. Understanding the mechanisms by which factors influence crop growth under a range of biophysical and socioeconomic conditions is necessary for enhancing crop productivity [23]. Crop models like APSIM can be employed to quantitatively integrate key processes governing crop growth including climate, soil conditions, genotype, and management [16,24]. For example, a study in a Faidherbia parkland showed that interacting levels of tree pruning and fertilizer determined crop productivity, and that N fertilizers should be preferentially applied in normal and wet years [25]. The study recommended that further research in these parklands include the simulation of crops as affected by management options such as cultivar, sowing date, and N fertilization rate.
The objectives of this study were to: (i) calibrate and test the APSIM model for predicting the response of maize to different tree and fertilizer management treatments under trees and in crop-only areas, observed in field experiments; (ii) test the sensitivity of maize yield to shading, N fertilizer rate, sowing date, and cultivar using virtual experiments, and (iii) determine the range of simulated maize yield as impacted by climate variability at low and optimum combinations of N fertilizers and pollarding.

2. Materials and Methods

2.1. Site Description

Data from the field experiments conducted in a parkland at Adulala Village were used for both model calibration and evaluation. The parkland is in the CRV in Ethiopia, located approximately 104 km southeast of Addis Ababa [7]. The study area is situated at 8°29.5′ N latitude, 39°20.5′ E longitude and has an elevation of 1688 m above sea level. The location has a bimodal rainfall distribution, with mean annual rainfall of 820 mm. The short rainy season extends from March to May and the long rainy season from June to October. Annual means of daily minimum and maximum temperatures are 13.9 °C and 28.5 °C, respectively. The soil is classified as a Fluvisol [26], and texture classes of the soils are dominated by sandy loam and loam soils. Surface soil (0–20 cm) in crop-only areas had pH 7.6, 0.11% total N, 4.3% organic matter, 21.89 µg g−1 Olsen extractable P [7], and 155 mg g−1 available water holding capacity [26]. Soil at the site was at ca. 3.5 m deep. Natural vegetation in the region is dominated by tree species such as Acacia tortilis (Forssk.) Hayne, A. seyal Delile, and F. albida (previously A. albida) [27,28], but overall, tree density in the study area was sparse (ca. 5.8 trees ha−1, [7]). Maize, teff, and wheat were the main crops grown in the area, and livestock (cattle, sheep, and goats) graze crop residues.

2.2. Field Experiments for Model Calibration and Testing

2.2.1. Experimental Design and Maize Establishment

Data were collected during the growing seasons of 2015 and 2016 from an experiment in the farmers’ fields in the Adulala watershed, as described previously [7]. The treatments were laid out as a split-plot design with six replications. The main-plot treatments (one tree at the center of each main-plot) included three levels of tree crown pruning (i.e., unpruned, 50% pruned, and 100% pruned (pollarding)) and crop-only plots (about 30 m from any tree trunks; a study by [7] estimated that mean tree crown radius in the parkland is about 4.31 m, mean height is 8.95 m, and shading by trees may not exceed 30 m). Sub-plot treatments were fertilizer applications on four maize sub-plots (i.e., one sub-plot in each quarter of a main plot was randomly allocated a fertilizer treatment). At sowing, urea (46 kg N ha−1) was added to one sub-plot, di-ammonium phosphate (9 kg N ha−1 and 23 kg P ha−1) to the second sub-plot, both urea and di-ammonium phosphate were added to the third sub-plot (55 kg N ha−1 and 23 kg P ha−1), and the fourth sub-plot was left as a control (no fertilizer applied). Additional urea at half the sowing rate (23 kg N ha−1) was applied to the first and third sub-plots 10 days after sowing. Maize (Melkassa cultivar) was sown on May 15 during the 2015 and 2016 cropping seasons. Maize seeds were sown in each sub-plot (a total of 18 trees, i.e., six trees per pruning level, plus six crop-only main-plots. and the seeds were sown at a spacing of 0.75 m between and 0.30 m within rows (4.44 plants/m2)). Weeding was applied manually every two weeks.

2.2.2. Measurements

In 2015, soil samples were taken prior to sowing of the maize from each tree position (zone): 0–2 m, 2–4 m, and 4–6 m, and the crop-only zone at 0–20 cm, 20–40 cm, 40–60 cm, and 60–80 cm depths. Samples were analyzed for gravimetric water content, organic C (Walkley & Black), total N (Kjeldahl), and available P (Olsen). Further details of soil sampling can be found in [7]. These measured data were used to parameterize the soil module of APSIM (described below).
Photosynthetically active radiation (PAR, µmol s−1 m−2) was measured under a total of nine trees (three randomly selected trees from each of the unpruned, 50% pruned, and 100% pruned trees) at different positions from the tree trunks (positions): 0–2 m, 2–4 m, and 4–6 m, and in each crop-only plot, in order to estimate the amount of radiation under trees and in crop-only plots. Measurements were located at the center of each crop-only plot; and at four aspects (north, south, east, and west) around each tree to provide an average value for each position. Measurements were taken after sowing at different times of the day: approximately 9:00 AM, 10:30 AM, 12:00 PM, 1:30 PM, 3:00 PM, and 4:00 PM. PAR under each tree was measured for three consecutive days. Maize yield (grain weight) was measured per plant on maize harvested at physiological maturity from 1 m2 quadrats (1 m × 1 m including two rows of maize plants) located randomly in the sub-plots under each tree position (within each zone) and in the crop-only plot.
Root samples were taken from soils collected under trees (unpruned trees) at 0−2, 2−4, 4−6, and 6−8 m distances from the tree trunk at depths of 0−10, 10−30, 30−60, 60−120 cm (i.e., a total of 16 soil samples were collected per tree for root measurements). Roots in the samples were carefully washed out of the soil over a 0.5 mm sieve. The samples were then spread out on a clear plastic tray that was filled with water, and root samples were separated from the organic debris using tweezers. Tree roots were distinguished from crop roots by their color and morphology. Lengths of fine roots (diameters ≤2 mm) were estimated using the line intercept method: L = πND/4, where L (cm) = root length, N = number of counts, and D (cm) = grid size. Root lengths were divided by the known volume of soil sampled to calculate root length densities.

2.2.3. Modeling

The agroforestry proxy tree model of APSIM Next Generation (www.apsim.info, [18]) was used for all simulations. As this version of APSIM did not have a P capability, and a response to P fertilizer was observed, only the N effect in the P-fertilized sub-plot treatments was simulated. Fertilization was simulated as an ammonium-N addition for both urea and DAP applications). Datasets for daily temperature, rainfall, and radiation were obtained from the Melkassa weather station (located about 6 km from the experimental site). Management (e.g., cultivar, sowing date, depth, and fertilization) and initial soil properties for simulation were based on measurements where available (Table 1, Table 2 and Table 3, [20]).
Daily temperatures and rainfall above canopies were to be assumed unaffected by trees, but microclimatic effects of tree canopies were estimated by the model by reducing light (radiation), surface soil temperature, and potential evapotranspiration. Radiation inputs to the model were based on light measurements for each tree pruning level and position (Table 1). Tree root length density values were also based on the measured values from the experiment (Table 2). Maize root length density was simulated by the maize model using the Melkassa cultivar provided in the model. Maize roots were assumed to have full access to soil down to a 2 m depth and no access below that depth.
Soil properties such as initial available water, nitrogen parameters (NO3 and NH4), and fraction of C in microbial biomass (Fbiom), and maize root parameters such as the lower limit of soil water content from which roots could extract water, were based on the literature [24,29] and examples available in the software (Table 3). These values were then further calibrated to achieve adequate predictions of grain yield in the unpruned treatment and crop-only zones in both years and for both fertilized and unfertilized treatments. For example, maize KL (daily maximum proportion of water extraction by roots) values (i.e., the proportion of available water that could be taken up each day from each depth) were set very low as a surrogate for non-N nutrient deficiencies. Predictions in other treatment combinations (i.e., all zones unfertilized and fertilized with 50% or 100% pruning in both years) were then tested against observations. A C:N ratio of 19.8 and pH of 7.6 were assumed across all soil zones and depths. Compared to crop-only areas, soil conditions under trees were assumed to provide better nutrient availability for other nutrients in addition to N, and higher soil water contents, which were supported by field observations [7]. Together, these effects were assumed to manifest in the model through improved maximum plant available soil water content to a 2 m depth: 280 mm under tree zones, 165 mm in the crop-only zone.
The following statistics were used to evaluate the model performance [30,31,32]: (1) Linear regression of observed (O) vs. predicted (P) data as summarized by its coefficient of determination (R2); (2) Nash Sutcliffe efficiency (NSE), which describes the relative magnitude of the residual variance was compared to the measured variance; and (3) root mean square error to standard deviation ratio (RSR), which provides a standardized value of the root mean square error. ‘Very good’ performance equated to NSE 0.75–1.00 or RSR 0.00–0.50, ‘good’ NSE 0.65–0.75 or RSR 0.50–0.60, ‘satisfactory NSE 0.50–0.65 or RSR 0.60–0.70, and ‘unsatisfactory’ if NSE < 0.50 or RSR > 0.70 [31]. An R2 > 0.70 was judged satisfactory [33].

2.2.4. Virtual Experiments

Simulation models can provide the opportunity to explore hypothetical outcomes by imposing a wider range of treatments. Therefore, the model calibrated on the experimental study described above was used in virtual experiments to explore the short-term influence of pruning level (daily radiation), N fertilizer rates, cultivar, and sowing date on a simulated maize yield in a high-rainfall year. Scenarios are reported for 2016, which was a high rainfall year that de-emphasized water stress relative to N stress. Rainfall in 2015 was highly drought-affected and therefore unsuitable for this virtual experiment as it would have suppressed responses to N fertilizer. In addition, the effect of climate variability was used to explore long-term patterns experienced at the study location. All aspects of the simulations were based on those presented earlier to test the model performance, except for the variables examined in each scenario.
Light experiment: For the crop-only treatment, radiation was reduced in 5% steps from full light to determine its effect on crop yield under trees, and light reduction was related to pruning level using observed data. Soil from the 0–2 m zone under trees was used to indicate the light effects on growth in that zone without the confounding effect of other micro-climate factors such as temperature and evapotranspiration.
N fertilizer, pruning, and tree position experiment: Effect of N fertilizer rate on grain yield 16 days after sowing (0, 25, 50, 100, and 200 kg N ha−1), in crop-only and under-tree zones, was determined for each pruning level (0%, 50%, and 100% pruning). The optimum rate of N fertilizer was defined as the rate that resulted in 90% of maximum yield.
Genotype and sowing date experiment: Early (15 May) and late (30 June) sowing of two cultivars Melkassa (early-medium maturing cultivar) and mh19 (medium-late maturing cultivar), in relation to rates of fertilizers (0, 6, 12.5, 25, 50 and 200) in crop-only and 2–4 m zones of 100% pruned trees.
Climate variability experiment (from 1977–2016): To determine the response of maize yield to climate variability (rainfall, temperature and radiation) under contrasting growing conditions and 0 kg N ha−1 with no pruning or 200 kg N ha−1 with 100% pruning. Weather data for the period were provided by the Melkassa Agricultural Research Center.

3. Results

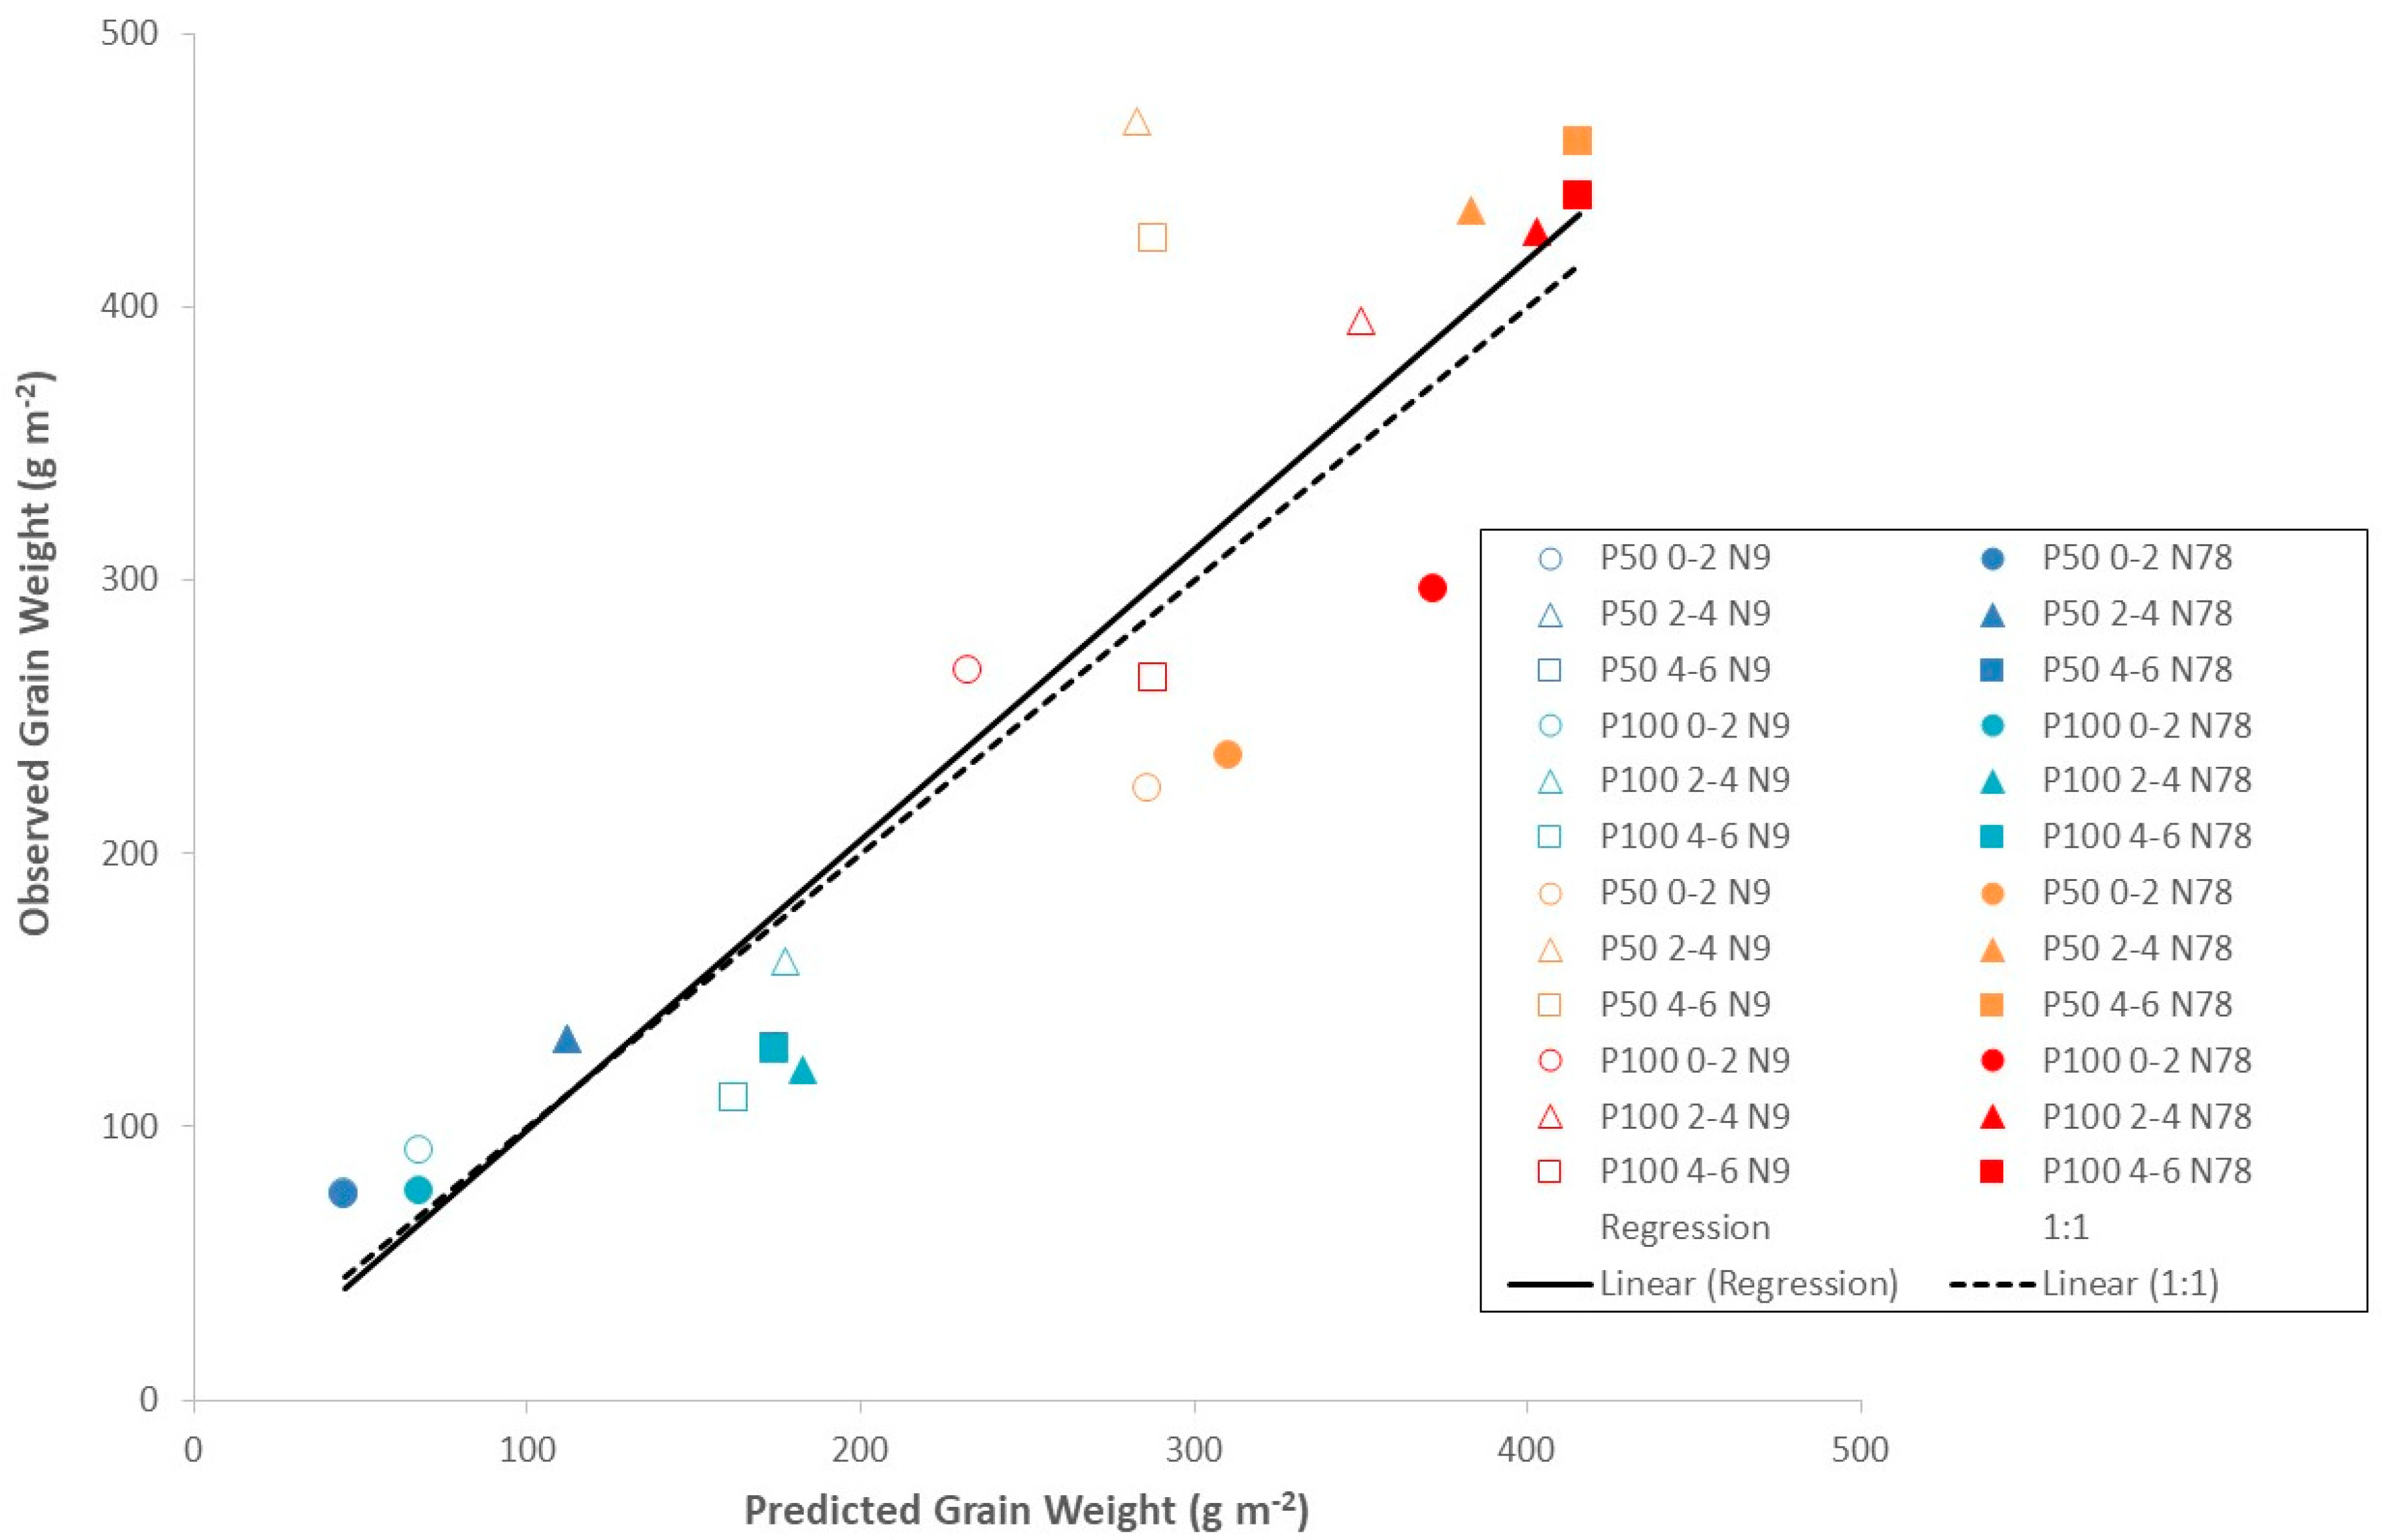
3.1. Evaluation of Model Performance

For the calibration dataset, two years of grain yield in unpruned combinations of all zones and fertilizer applications showed the model performance was very good (R2 = 0.92; NSE = 0.91, RSR = 0.29).
Although the uncalibrated dataset had reduced performance compared to the calibrated dataset (NSE = 0.72, RSR = 0.51, R2 = 0.81), it provided a good fit (Figure 1). Yields in 2015 were substantially lower than in 2016 due to low rainfall, and model predictions with higher rainfall in 2016 generally reflected the observed effects of pruning, zone, and fertilizer (i.e., highest yields in (1) the 2–4 m or 4–6 m zones, (2) N fertilizer, and (3) 50% or 100% pruning).

3.2. Virtual Experiments

3.2.1. Light Experiment

There was an approximate linear reduction in shading from 46% to 9% as pruning increased from 0 to 100% (data not presented). Over this range of pruning, simulated maize yield increased from 69 to 105 g m−2. Maximum maize yield was therefore simulated at 100% pruning, because it provided maximum radiation.

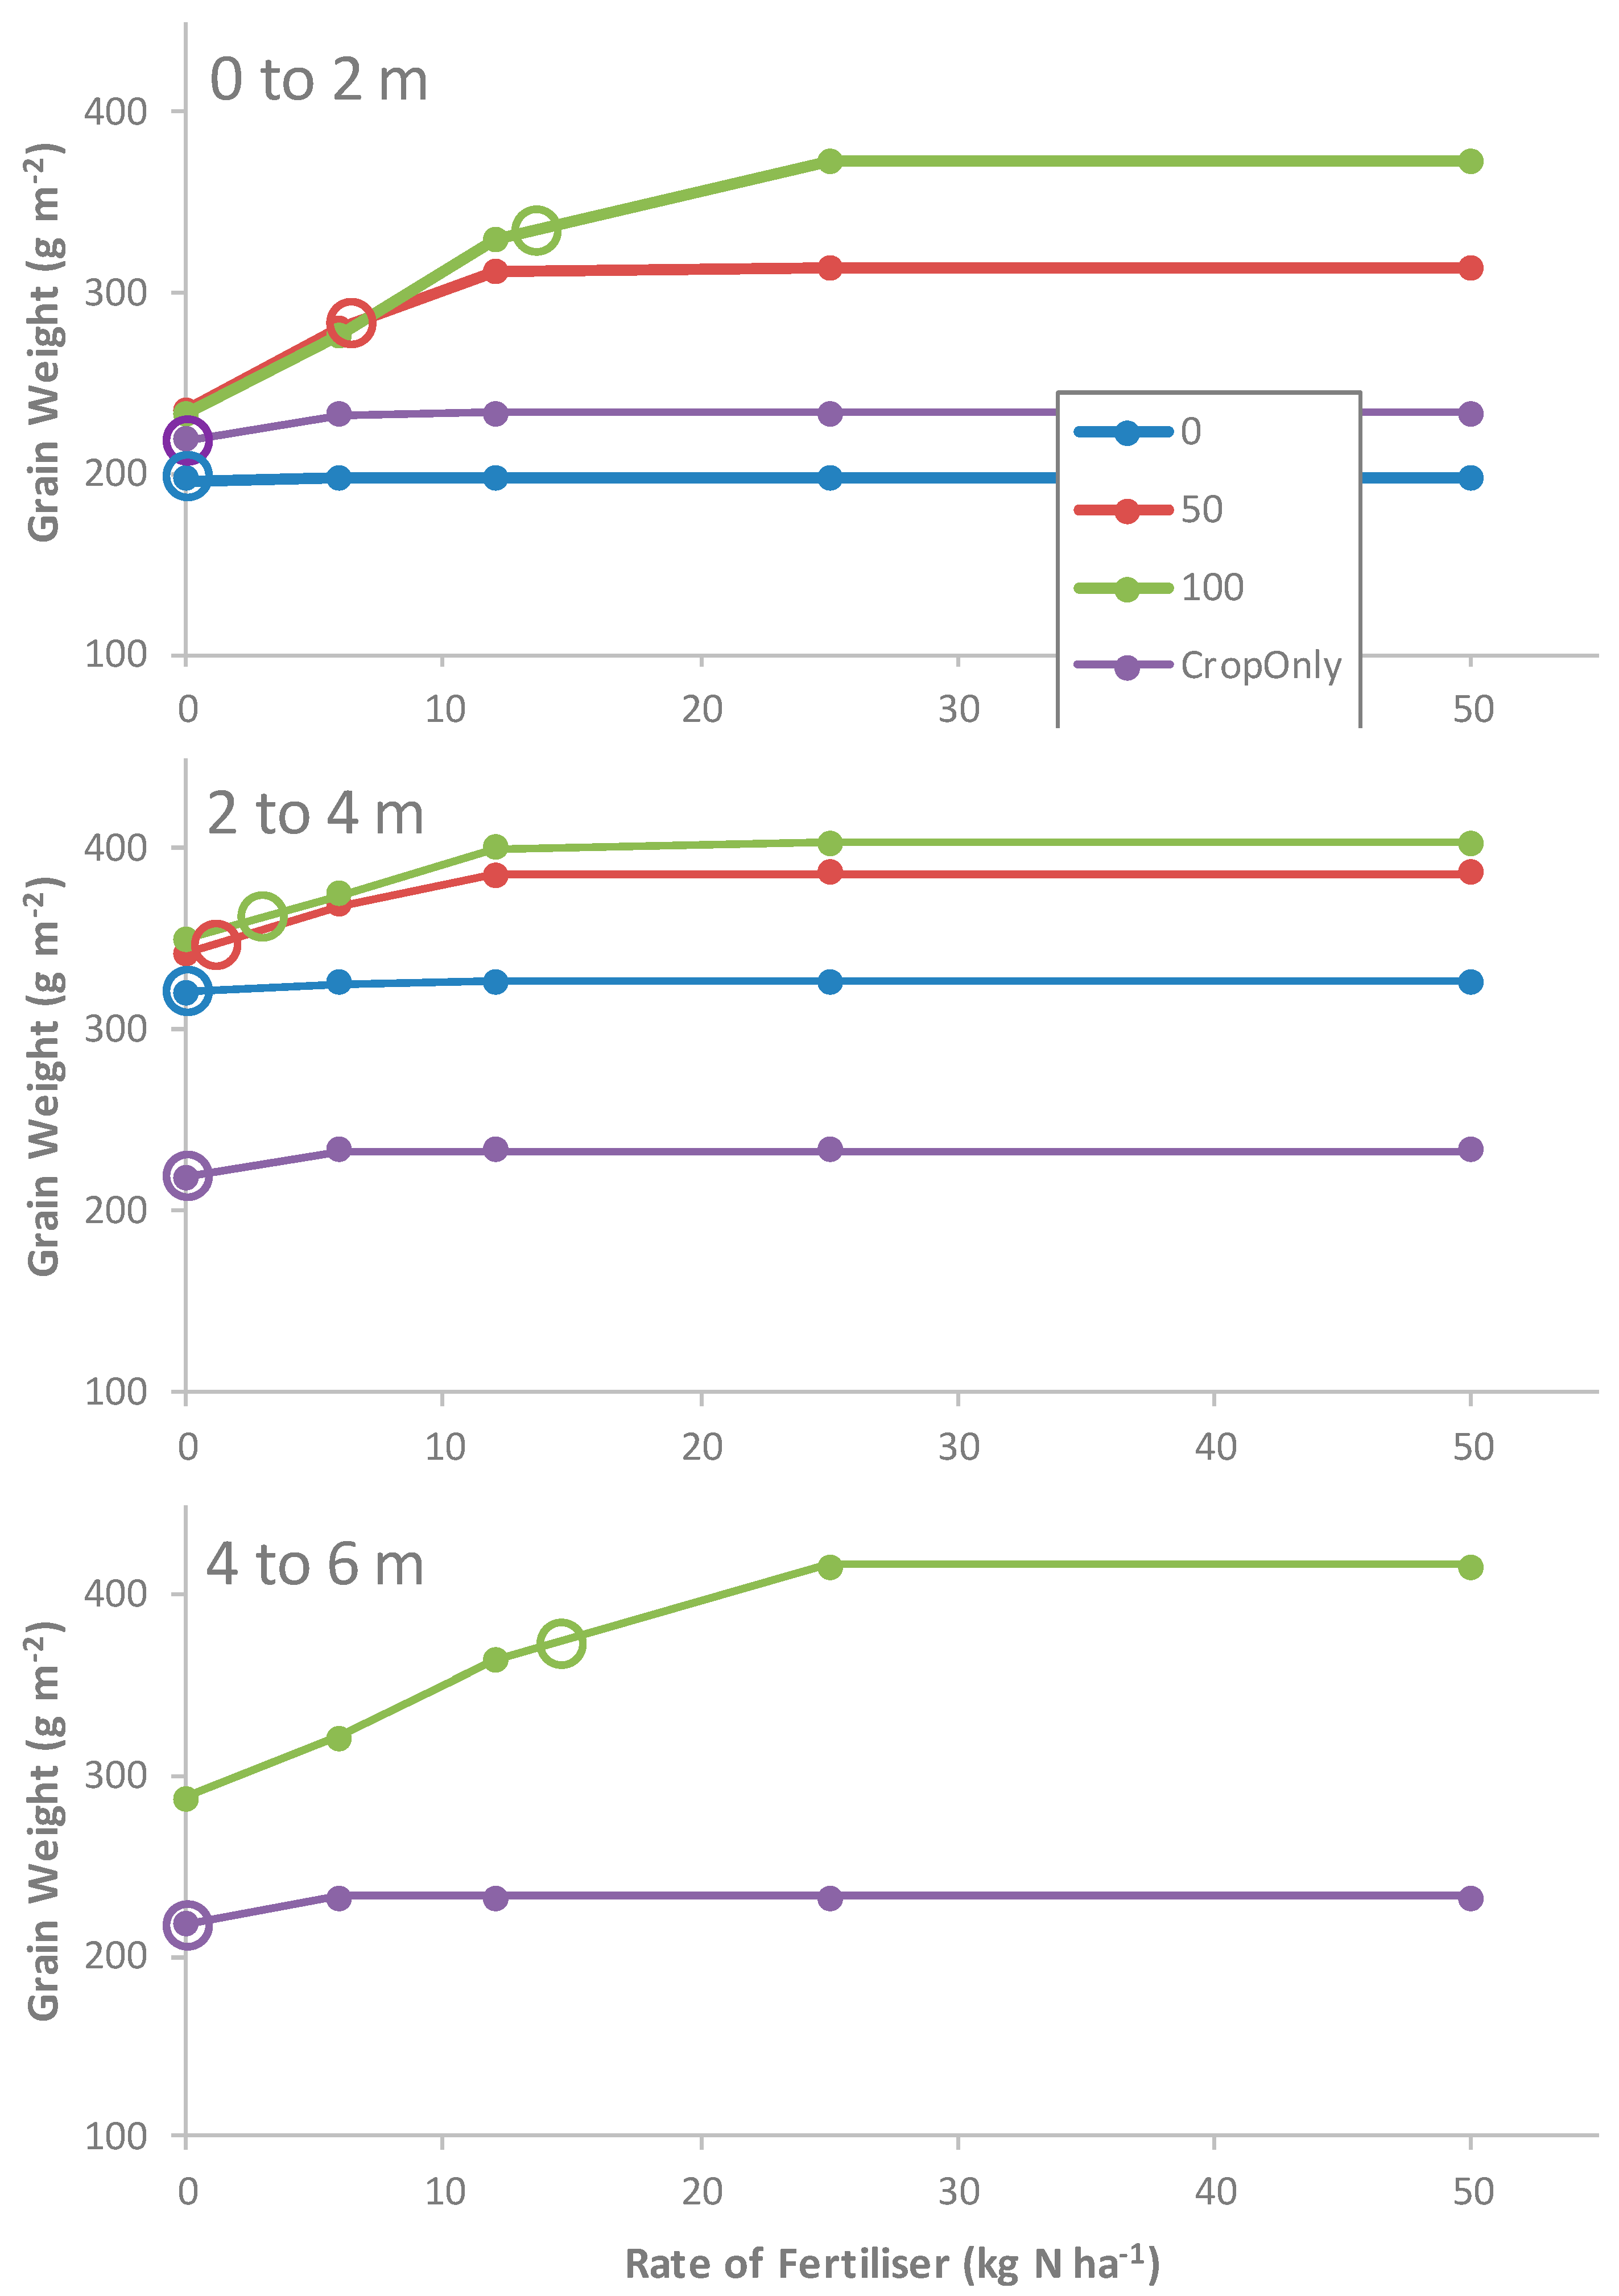
3.2.2. N Fertilizer, Pruning, and Zone Experiment

In crop-only plots, maize yield increased directly with N inputs. Simulated maize yield response to rates of N fertilizer applied 16 days after sowing in crop-only and under-tree zones for the different pruning levels is shown in Figure 2. Optimum yield was simulated without any 16-day N fertilizer addition (Figure 2), which reflects the limitations imposed by lower water availability and other factors not specifically included in the model (e.g., low P and K availability). Optimum fertilizer rate increased with maximum yield, and pruning was most important for reaching the maximum yield at the 0–2 m zone and least at 4–6 m (Figure 2). Each soil zone has different soil characteristics, which also affects the maximum attainable yield.
Scenarios under trees with radiation reduced by 46% (unpruned), 23% (50% pruned), and 9% (totally pruned) predicted higher responses by maize to N fertilizer in the 2–4 m and 4–6 m zones under all light conditions (Figure 2, 2016 data presented). Optimum rates of N fertilizer under trees ranged from 0 kg N ha−1 without pruning in the 0–2 m and 2–4 m zones to 14.6 kg N ha−1 for all under-tree zones with 100% pruning.

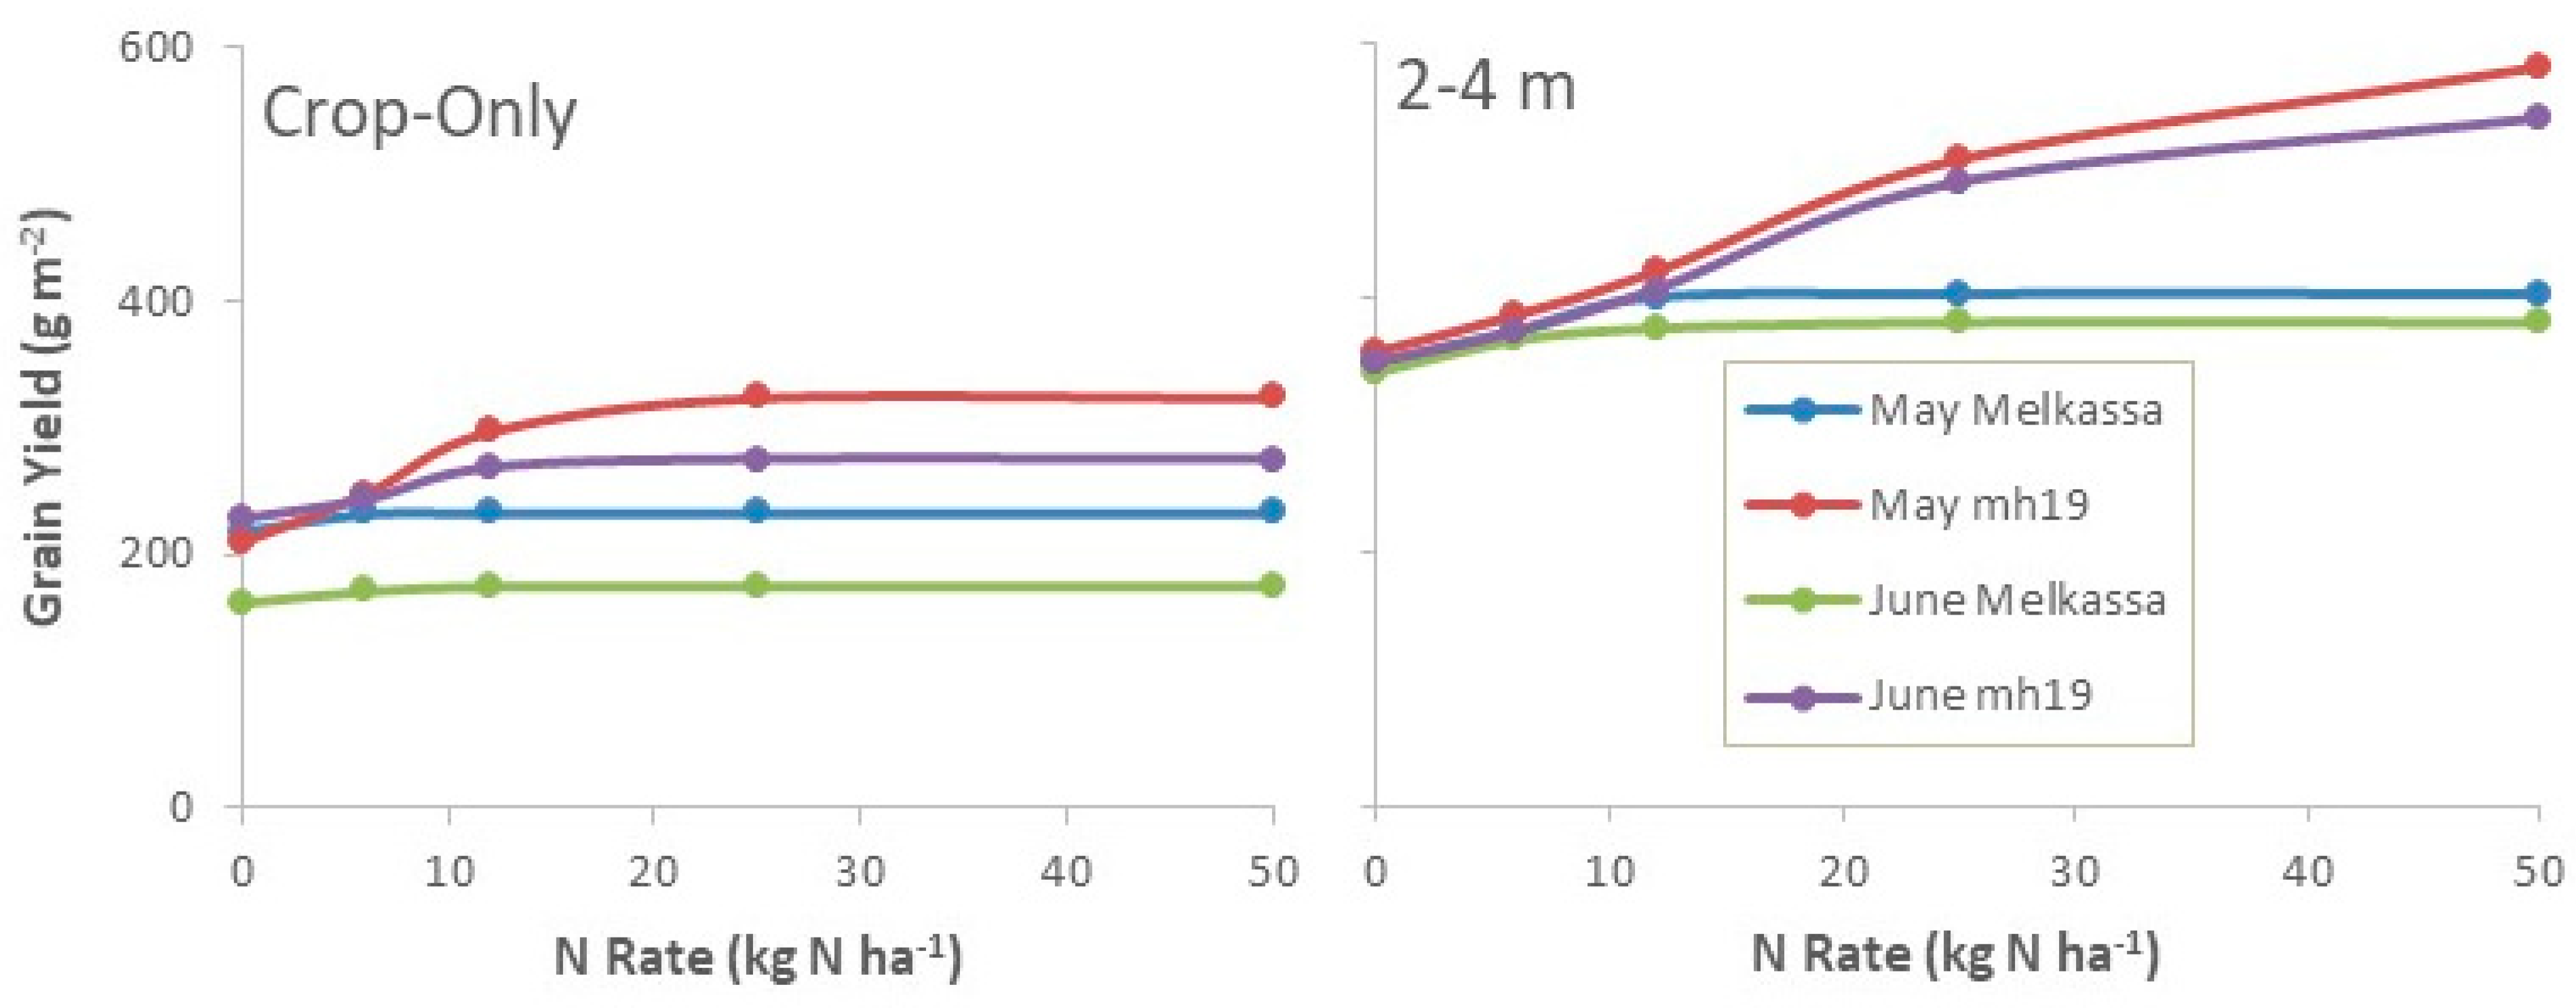
3.2.3. Genotype and Sowing Date Experiment

For the Melkassa cultivar of maize in the crop-only zone, delaying sowing in 2016 from 15 May to 30 June approximately decreased the simulated yields by 25%, and there was no response to N fertilizer (Figure 3). A change to the mh19 cultivar increased yields and responsiveness to N fertilizer, but the highest yields and responses to fertilizer were in the 2–4 m zone where sowing date had little effect.

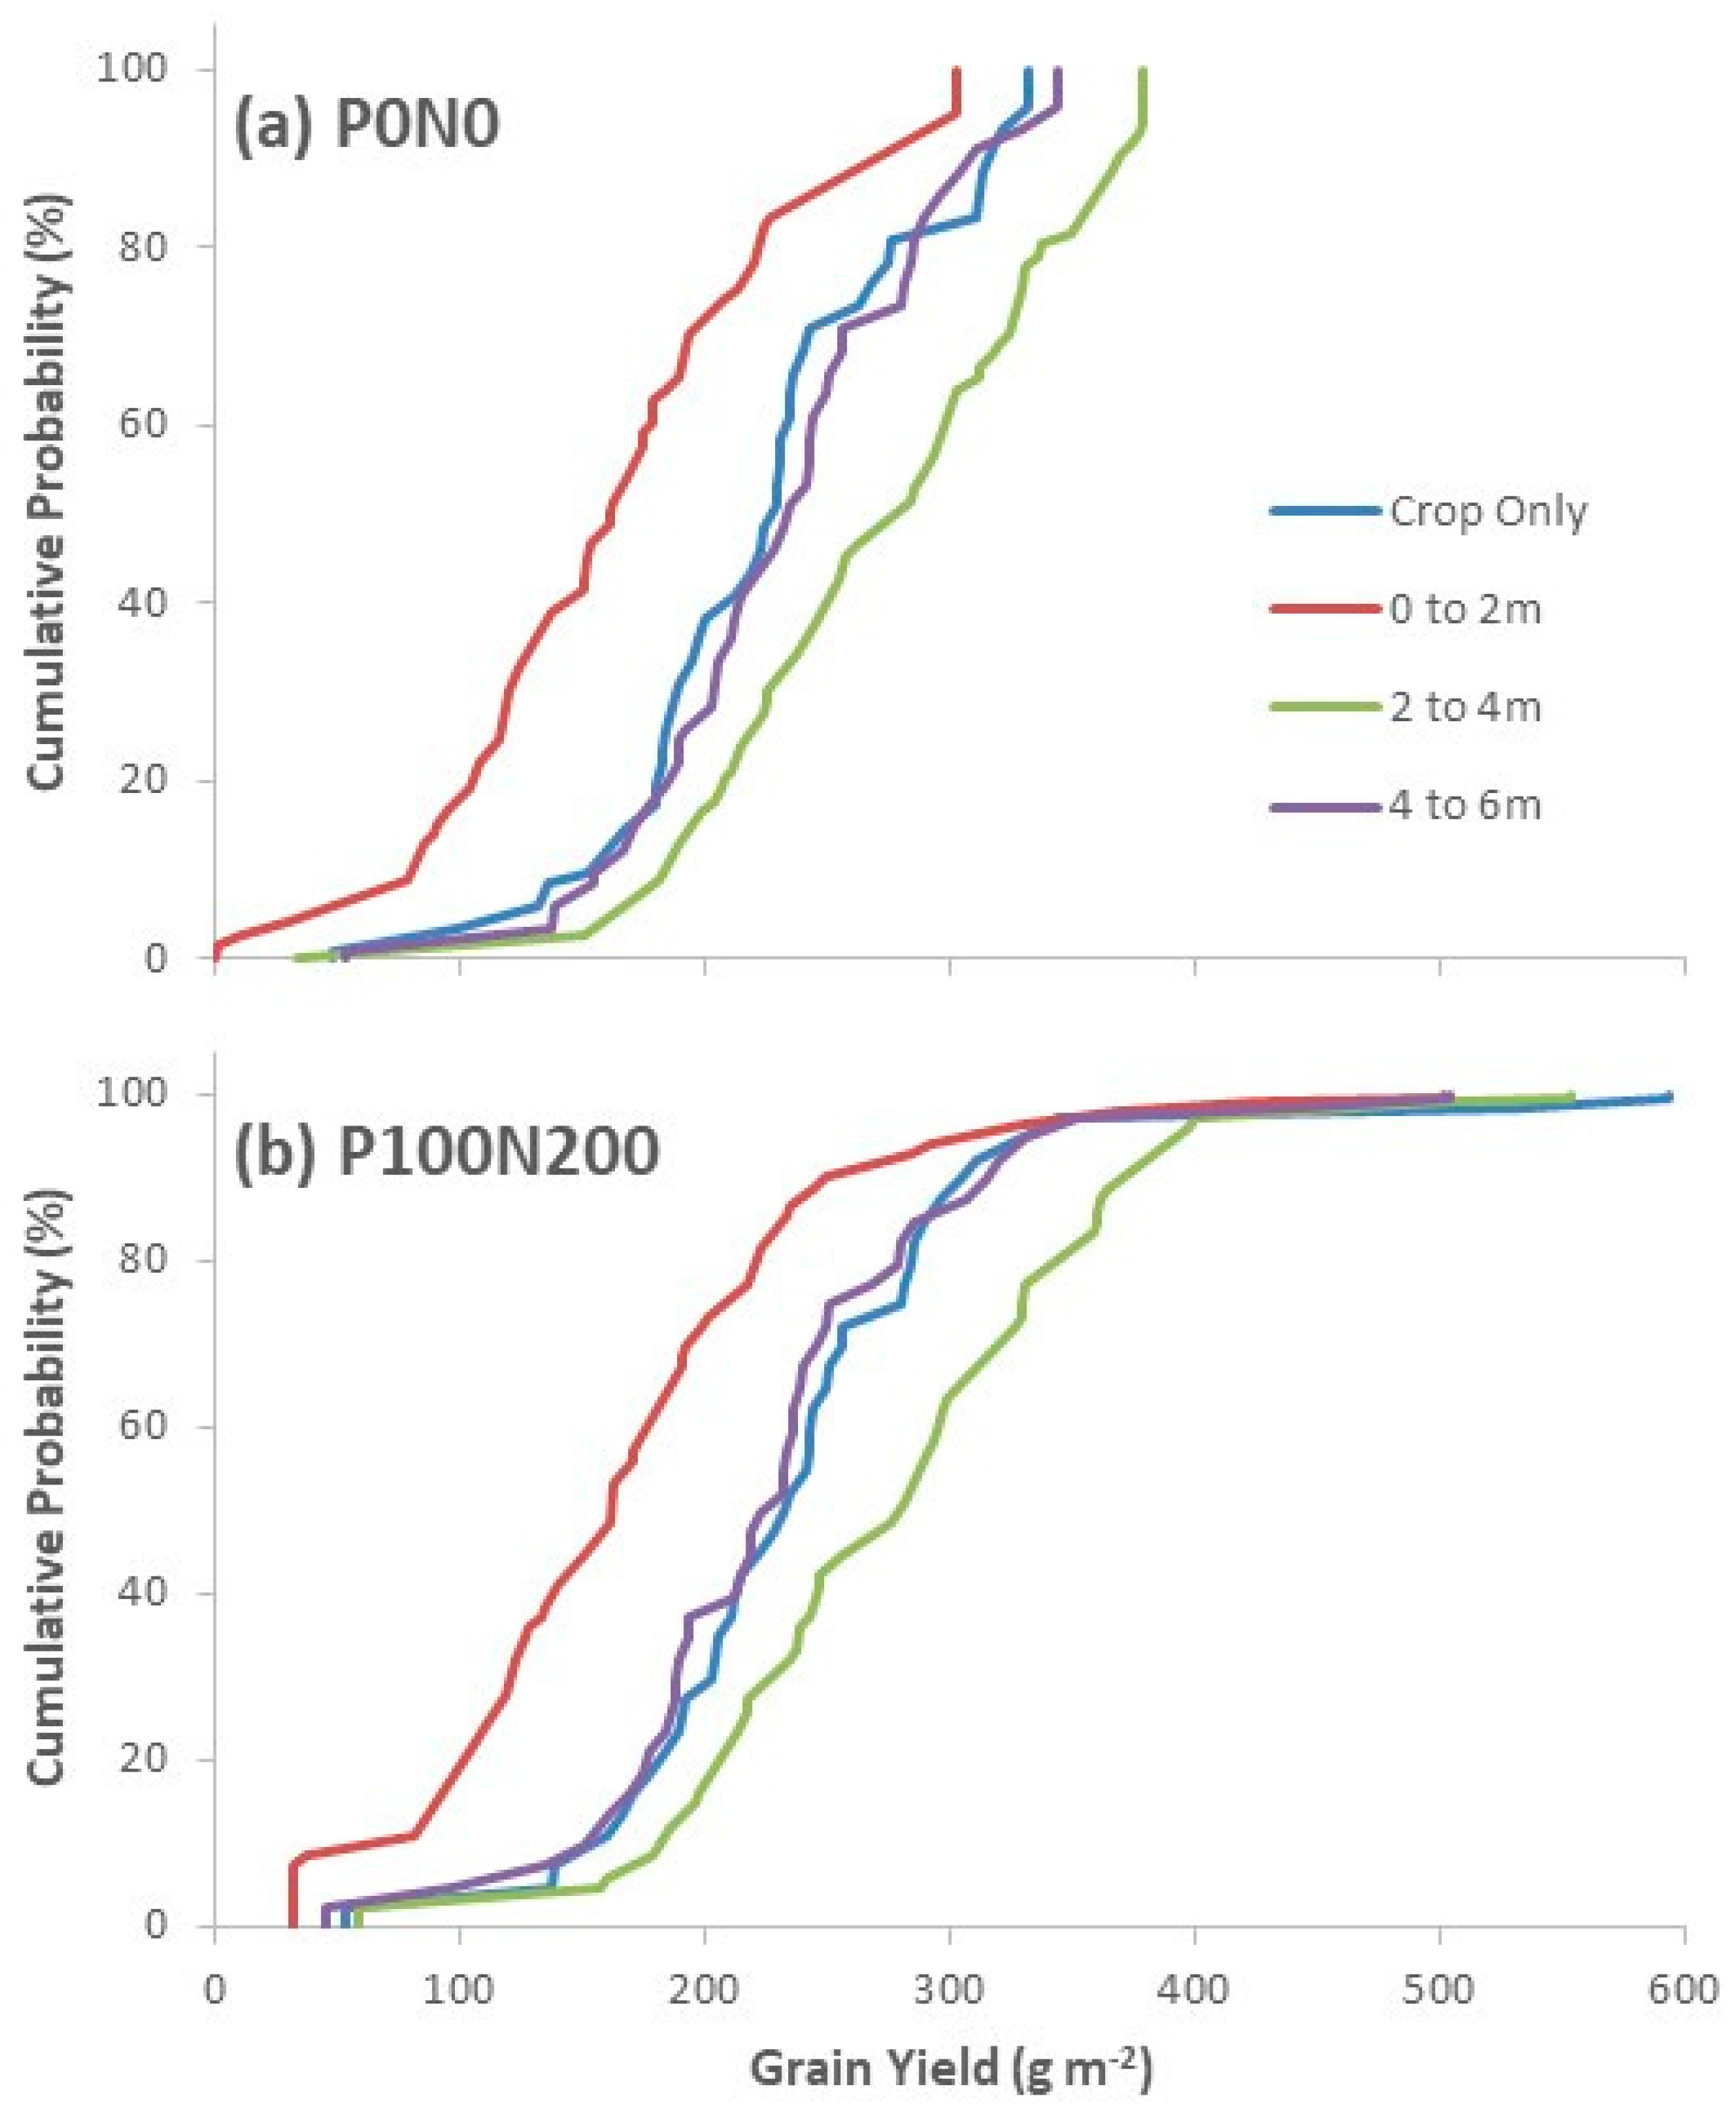
3.2.4. Climate Variability Experiment

Under past climate conditions without N fertilizer and pruning, simulated maize yields ranged between 50 and 330 g m−2 in the crop only zone, and between 0 and 380 g m−2 under-trees, depending on zone (Figure 4a). With pruning and N fertilizer, maize yield increased to 550–590 g m−2 with optimal climate, depending on zone (Figure 4b), but these treatments led to only minor increases in yield at less than optimal climates. Within each set of pruning and N fertilizer conditions, crop-only and 4–6 m zones had similar yields at all probabilities, highest yields were in the 2–4 m zone, and lowest in the 0–2 m zone, which emphasizes the importance of soils over other factors.

4. Discussion

Reasonably accurate predictions of maize yield in the current study, despite a range of low to moderate yields (91–468 g m−2, Figure 1), showed that APSIM can be used to simulate crop responses to radiation, N fertilizer, soil, and micro-climate in F. albida parklands in the CRV in Ethiopia. APSIM is already known to perform credibly in predicting yield responses to N fertilizer [34,35] and variability in radiation and air temperature in this region [36] and in Northern Rwanda [37], but this is the first application of the APSIM agroforestry model that involved tree pruning and soil gradients in relation to zones under tree crowns. An earlier use of the model was in alley-cropping systems in Kenya and Malawi but did not include soil and light gradients [19]. Thus, the model can be considered for research and decision-making in relation to fertilizer and other tree and crop management strategies for improving crop productivity in a range of farming systems.
The APSIM model tended to marginally underestimate maize yield at the lowest light level (Figure 1). Low maize yield prediction by APSIM at shade levels >50% was also reported in this region where the model was used to predict the response of maize to three levels of artificial shading (25%, 50%, and 75%) [7]. Results suggested a need to improve the mechanistic processes simulated in APSIM governing responses to >50% shade. However, where competition for light is low to medium, as in most of the area under trees, the model could be employed to simulate the impacts of light competition on understory crop production. Shading levels under Faidherbia trees in the current study were within this range of acceptability, even close to the trunk (0–2 m zone) and without pruning. Hence, our results support the earlier recommendation that APSIM can adequately simulate responses to shading down to 50% of full sunlight.
Maize grain yield in all zones under trees increased with pruning relative to that in the crop-only zone (Figure 1). This result suggests that adequate pruning can reduce the negative effect of shade in agroforestry systems and enable better utilization of available soil water and N under trees by outweighing any negative effects of shading remaining after pruning.
A virtual experiment indicated that maize yield was sensitive to both pruning and N fertilizer when grown under trees, and there was little response to fertilizer in the crop-only zone (Figure 2). Greater response of maize yield to N fertilizer under trees than in the crop-only zone can be attributed to higher water and nutrient availability in soils under trees. Lower responsiveness to N fertilizer in the crop-only zone compared to under trees is an emergent property of the calibration process that is consistent with non-N nutrients being generally less limiting under trees due to generally higher soil fertility [38,39]. In the current study, we also calibrated the maximum water holding content of soils, in part to compensate for the higher levels of nutrients under trees. Strong responses to N fertilizer or green manures in crop-only areas can occur and be simulated where other factors are less limiting than N (e.g., in Malawi) [35]. These hypothesized interactions with non-N fertility emphasize the need for further field experimentation to improve our understanding of these processes and improve their representation in models.
A virtual experiment using different cultivars and sowing dates showed that, at whatever rate of N fertilizer was applied above zero, the ranking of simulated yield was consistently mh19 (hybrid cultivar) sown early > mh19 sown late > Melkassa (open pollinated cultivar) sown early > Melkassa sown late (Figure 3). Additionally, responsiveness to N fertilizer was greatest for the mh19 cultivar in the 2–4 m zone, without reaching a plateau in response at the top rate of 50 kg N ha−1. Hence, there is scope to tailor the cultivar, sowing date, and N fertilizer rate, but in this case (using 2016 climate), there was only a minor response to sowing date. In contrast, resource poor farmers claim that local open pollinated cultivars (such as the Melkassa cultivar) are better adapted to shade than hybrids (such as mh19) under agroforestry [40], and landraces of maize are also used extensively in Ethiopia. A recent study explored the performance of maize cultivars, open pollinated, and hybrids in agroforestry systems in Rwanda and Ethiopia [37]. They reported that hybrids yielded more than open pollinated cultivars under Grevillea robusta A.Cunn. ex R.Br. and Senna spectabilis (DC.) Irwin and Barneby in Rwanda, but they performed equally well under A. tortilis in Ethiopia. Like the current study, their result suggests scope for tailoring the genotype to growing conditions of local agroforestry systems [37].
The long-term simulations, with varied climate conditions, indicated that high maize yields could be obtained in some years with pruning and a high 16-day fertilizer rate of (200 kg N ha−1), but with 50% probability, this high rate of N fertilizer yielded only 300 g m−2, which further emphasizes the need to identify and remove other limitations to crop growth (Figure 4). Results also showed that zones close to tree trunks (0–2 m) consistently produced less maize yield than the crop-only zone, despite having the highest soil nutrient concentration. This result can be attributed to competition for resources between crops and trees in that position [41]. Although yield suppression in the 0–2 m zone was offset by that in the 2–4 m zone on a g m−2 basis, the 2–4 m zone had a total area 3-fold that of the 0–2 m zone, and therefore contributes to overall more yield under trees than in crop-only zones.
As already mentioned, nutrients other than N (such as P and K) were probably limiting factors at the current study site, particularly in crop-only conditions [7]. As the APSIM model did not consider P as a limiting factor, simulated yields in response to N fertilizers were compared with observed values at a base P fertilizer rate of 23 kg P ha−1, and the rates of N and P used probably only partially met the demand for these nutrients. As a surrogate for non-N nutrient deficiencies, maize KL values were set very low, which limited water uptake, instead to below that which would normally be experienced in the study area with adequate levels of those other nutrients. Hence, the model would benefit from further improvement to explicitly simulate nutrients such as P and K. Research is also needed to refine the types, rates, and timings of fertilizers for maize production in the CRV, as it appears that some shift of investment from N fertilizer to other types of fertilizer might be worthwhile.
Integrating more trees such as F. albida into crop fields in the CRV might provide sustainable options that would enhance crop production, ecosystem services such as C sequestration [7], biodiversity conservation [42], and livelihoods. Tree numbers could be increased by promoting the use of tree seedlings or natural regeneration as free grazing presents substantial risks in Ethiopia, which necessitates substantial tree protection methods. However, increasing tree stocking (as recommended by Ethiopian policy, [43]) should be pursued with caution as there are several uncertainties regarding such an approach. First, two or more decades of tree growth will be needed before substantial effects on soil properties can be expected. Meanwhile, the use of coppicing agroforestry ‘fertilizer’ shrubs could be tested in combination with fertilizers, which would boost nutrient cycling and positively affect crop production within just a few years [44]. Second, tree and crop behavior at higher population densities might not be the same as found in this study, particularly tree growth rates, radial patterns of tree influence, and animal behavior. Third, we are uncertain to what extent higher concentrations of C and available nutrients found in this study and others are directly attributable to litter inputs by the trees. Trees can also reduce soil erosion, which leads to higher proportions of silt and clay under trees, which would favor better soil development. Livestock preferentially congregate under trees and drop manure that fertilizes under-tree soils, which is effectively a concentration of crop residues under trees. The droppings of birds perched in trees also enriches the soil below. Fourth, some researchers have noted a high proportion of trees growing on old termite mounds, but it is unknown how that observation developed (e.g., natural regeneration might be highest on those fertile microsites leading to larger seedlings that might have been preferentially retained by farmers). Fifth, higher concentrations of C and nutrients under trees might also be the result of less decomposition under trees due to lower temperatures as low rates of fertilizer use, as used in the CRV, can be expected to promote the net loss of soil C [19]. Higher rates of fertilizer than currently used will probably be needed for both food production and maintenance or increase of soil C. Sixth, trees can obstruct mechanization of agriculture, which is concurrently being promoted. Thus, compatible tree spacing designs might need to be explored. Finally, labor, fertilizer, fodder, fuel costs, and other socio-economic aspects have not yet been fully evaluated in relation to increasing tree population densities. Simulations indicate that an increase in maize yield can be achieved with partial tree pruning and moderate (recommended) N fertilization scenarios (Figure 1). Moderate pruning, reducing total canopy volume by about 35% before the onset of the rainy season, may not appreciably reduce tree growth [45], would be less demanding of labor.
A good fit between simulated and observed values confirmed that APSIM provided a scientifically sound prediction of maize yields in response to N fertilizer use and tree pruning management and could be employed for a large-scale maize yield analysis in agroforestry systems of Ethiopia. The model could also provide the opportunity to assess a range of farming practices over several seasons that cannot be easily done using field experimental trials. In smallholder farming systems, experimental options are limited spatially and temporally (e.g., space, labor, and machinery constraints [46]) and a whole farm modeling approach may be required to allow exploration of the combined interactions of system components. With regard to these factors, modeling presented here did not consider farm-scale context factors like animals, manure amounts and distribution, residue removal, tree litter inputs, and pests and diseases. Moreover, starting values of nitrogen parameters such as NO3 and NH4 and microbial biomass were taken from the literature and part of the calibration process, which would have affected the modeled results as these parameters change rapidly. Crop models have been developed to adequately simulate crop yield and other crop variables across a range of conditions, but large uncertainties remain in all of these models for the prediction of soil N dynamics [47]. Thus, some caution is needed when using the results to provide recommendations to farmers and policy makers.
Generally, our study demonstrated that the highest yields could be attained when using fertilizers at moderate-to-high rates alone (in crop-only plots) or in combination with agroforestry trees, which highlights the need to add external inputs to the soil in these systems. Other studies in Sub-Saharan Africa also reported that declining soil fertility is one of the causes of low agricultural productivity, and that the soils are low in fertility due to continuous cultivation without external inputs [48]. The use of chemical fertilizers in these regions is limited by the high cost of fertilizers, untimely distribution in rural areas, and shortage of nutrients not supplied by the chemical fertilizers as well as the associated environmental risk [49]. Though agroforestry options provide alternatives for resource poor farmers, the adoption of practices such as intercropping and crop rotation with legumes is constrained by limited land and immediate food concern (i.e., the cost of leaving land fallow to conserve soil fertility for two years is high) [49]. Thus, combined application of chemical fertilizers and organic matter (e.g., from agroforestry trees) provide a better alternative in improving crop yields [50]. Further research to address soil fertility problems should focus on understanding the mechanisms related to the combined use of organic and chemical fertilizers.

5. Conclusions

Simulations using the APSIM agroforestry model were adequate for reproducing the observations that tree pruning and fertilization can improve maize productivity by increasing light, water, and N availability to understory crops. Virtual experiments for rates of N, pruning levels, sowing dates, and cultivars suggested optimum combinations of these inputs for maize production depends due to soil and micro-climate on the position under tree canopies or in crop-only areas, but generally, maize yield could be improved by applying fertilizers and by pruning at least 50% of each tree canopy. Nutrients other than N (such as P and K) were probably factors that limited crop growth, which indicates the need for further field experimentation and modeling studies in the parkland agroforestry systems of Ethiopia.

Author Contributions

A.M.D., P.J.S. and N.I.H. designed the experiment and performed data analysis; A.M.D. conducted the experiment; A.M.D. and P.J.S. wrote the manuscript; N.I.H. and K.M.B. revised the manuscript. All authors have read and agreed to the published version of the manuscript.

Funding

This research was funded by ACIAR and project partners (including CSIRO) under the auspices of the CGIAR research program on Forests, Trees, and Agroforestry.

Acknowledgments

This research was conducted as part of the Trees-for-Food-Security project (http://aciar.gov.au/aifsc/projects/trees-food-security-improving-sustainableproductivityfarming-systems-and-evergreen), under the auspices of the CGIAR research program on Forests, Trees, and Agroforestry. The project was managed by ICRAF with financial support from ACIAR and project partners (including CSIRO). We thank the staff at the Melkassa Agricultural Research Center and ICRAF Ethiopia for field and laboratory support. We thank Catherine Muthuri for her professional advice at the inception of the project proposal, and also the development agents and farmers at Adulala Village for their assistance and cooperation during field work. Comments on earlier drafts by Daniel Mendham, Allan Peake, Stephen Roxburgh, and anonymous reviewers were also appreciated.

Conflicts of Interest

The authors declare no conflict of interest.

References

  1. Tittonell, P.; Giller, K.E. When yield gaps are poverty traps: The paradigm of ecological intensification in African smallholder agriculture. Field Crop Res. 2013, 143, 76–90. [Google Scholar] [CrossRef] [Green Version]
  2. Vågen, T.-G.; Winowiecki, L.A.; Tondoh, J.E.; Desta, L.T.; Gumbricht, T. Mapping of soil properties and land degradation risk in Africa using MODIS reflectance. Geoderma 2016, 263, 216–225. [Google Scholar] [CrossRef] [Green Version]
  3. Cooper, P.; Dimes, J.; Rao, K.; Shapiro, B.; Shiferaw, B.; Twomlow, S. Coping better with current climatic variability in the rain-fed farming systems of sub-Saharan Africa: An essential first step in adapting to future climate change? Agric. Ecosyst. Environ. 2008, 126, 24–35. [Google Scholar] [CrossRef] [Green Version]
  4. Thornton, P.K.; Jones, P.G.; Ericksen, P.J.; Challinor, A.J. Agriculture and food systems in sub-Saharan Africa in a 4 C+ world. Philos. Trans. R. Soc. Lond. A Math. Phys. Eng. Sci. 2011, 69, 117–136. [Google Scholar] [CrossRef] [Green Version]
  5. Legesse, W.; Mosisa, W.; Berhanu, T.; Girum, A.; Wende, A.; Solomon, A.; Tolera, K.; Dagne, W.; Girma, D.; Temesgen, C.; et al. Genetic improvement of maize for mid-altitude and lowland sub-humid agro-ecologies of Ethiopia. In Meeting the Challenges of Global Climate Change and Food Security through Innovative Maize Research; CIMMYT: Mexico City, Mexico, 2011; p. 24. [Google Scholar]
  6. Abate, T.; Shiferaw, B.; Menkir, A.; Wegary, D.; Kebede, Y.; Tesfaye, K.; Kassie, M.; Bogale, G.; Tadesse, B.; Keno, T. Factors that transformed maize productivity in Ethiopia. Food Secur. 2015, 7, 965–981. [Google Scholar] [CrossRef] [Green Version]
  7. Dilla, A.M.; Smethurst, P.J.; Barry, K.; Parsons, D.; Denboba, M.A. Tree pruning, zone and fertiliser interactions determine maize productivity in the Faidherbia albida (Delile) A. Chev parkland agroforestry system of Ethiopia. Agrofor. Syst. 2019, 93, 1897–1907. [Google Scholar] [CrossRef]
  8. Snapp, S.S.; Grabowski, P.; Chikowo, R.; Smith, A.; Anders, E.; Sirrine, D.; Chimonyo, V.; Bekunda, M. Maize yield and profitability tradeoffs with social, human and environmental performance: Is sustainable intensification feasible? Agric. Syst. 2018, 162, 77–88. [Google Scholar] [CrossRef]
  9. Lin, B.B. Agroforestry management as an adaptive strategy against potential microclimate extremes in coffee agriculture. Agric. For. Meteorol. 2007, 144, 85–94. [Google Scholar] [CrossRef]
  10. Sileshi, G.W.; Nyoka, B.I.; Beedy, T.L.; Chanyenga, T. Modelling the scaling of stem growth with crown size and optimum stocking densities for systematic grid plantation of Faidherbia albida. New For. 2014, 45, 699–714. [Google Scholar] [CrossRef]
  11. Bayala, J.; Sanou, J.; Teklehaimanot, Z.; Ouedraogo, S.; Kalinganire, A.; Coe, R.; Van Noordwijk, M. Advances in knowledge of processes in soil–tree–crop interactions in parkland systems in the West African Sahel: A review. Agric. Ecosyst. Environ. 2015, 205, 25–35. [Google Scholar] [CrossRef]
  12. García-Barrios, L.; Ong, C. Ecological interactions, management lessons and design tools in tropical agroforestry systems. In New Vistas in Agroforestry; Springer: Berlin/Heidelberg, Germany, 2004; pp. 221–236. [Google Scholar]
  13. Semwal, R.; Maikhuri, R.; Rao, K.; Singh, K.; Saxena, K. Crop productivity under differently lopped canopies of multipurpose trees in Central Himalaya, India. Agrofor. Syst. 2002, 56, 57–63. [Google Scholar] [CrossRef]
  14. Siriri, D.; Ong, C.; Wilson, J.; Boffa, J.; Black, C. Tree species and pruning regime affect crop yield on bench terraces in SW Uganda. Agrofor. Syst. 2010, 78, 65. [Google Scholar] [CrossRef] [Green Version]
  15. Demeke, A.B.; Keil, A.; Zeller, M. Using panel data to estimate the effect ofrainfall shocks on smallholders food security and vulnerability in rural Ethiopia. Clim. Chang. 2011, 108, 185–206. [Google Scholar] [CrossRef]
  16. Kassie, B.; Van Ittersum, M.; Hengsdijk, H.; Asseng, S.; Wolf, J.; Rötter, R.P. Climate-induced yield variability and yield gaps of maize (Zea mays L.) in the Central Rift Valley of Ethiopia. Field Crop Res. 2014, 160, 41–53. [Google Scholar] [CrossRef]
  17. Keating, B.A.; Carberry, P.S.; Hammer, G.L.; Probert, M.E.; Robertson, M.J.; Holzworth, D.; Huth, N.I.; Hargreaves, J.N.; Meinke, H.; Hochman, Z. An overview of APSIM, a model designed for farming systems simulation. Eur. J. Agron. 2003, 18, 267–288. [Google Scholar] [CrossRef] [Green Version]
  18. Holzworth, D.; Huth, N.I.; Fainges, J.; Brown, H.; Zurcher, E.; Cichota, R.; Verrall, S.; Herrmann, N.I.; Zheng, B.; Snow, V. APSIM Next Generation: Overcoming challenges in modernising a farming systems model. Environ. Model. Softw. 2018, 103, 43–51. [Google Scholar] [CrossRef]
  19. Smethurst, P.J.; Huth, N.I.; Masikati, P.; Sileshi, G.W.; Akinnifesi, F.K.; Wilson, J.; Sinclair, F. Accurate crop yield predictions from modelling tree-crop interactions in gliricidia-maize agroforestry. Agric. Syst. 2017, 155, 70–77. [Google Scholar] [CrossRef] [Green Version]
  20. Dilla, A.; Smethurst, P.J.; Parsons, D.; Barry, K.; Denboba, M. Potential of the APSIM model to simulate impacts of shading on maize productivity. Agrofor. Syst. 2018, 92, 1699–1709. [Google Scholar] [CrossRef]
  21. Knörzer, H.; Lawes, R.; Robertson, M.; Graeff-Hönninger, S.; Claupein, W. Evaluation and performance of the APSIM crop growth model for German winter wheat, maize and fieldpea varieties in monocropping and intercropping systems. J. Agric. Sci. Technol. B 2011, 9, 698–717. [Google Scholar]
  22. Dufour, L.; Metay, A.; Talbot, G.; Dupraz, C. Assessing light competition for cereal production in temperate agroforestry systems using experimentation and crop modelling. J. Agron. Crop Sci. 2013, 199, 217–227. [Google Scholar] [CrossRef]
  23. Cooper, M.; Messina, C.D.; Podlich, D.; Totir, L.R.; Baumgarten, A.; Hausmann, N.J.; Wright, D.; Graham, G. Predicting the future of plant breeding: Complementing empirical evaluation with genetic prediction. Crop Pasture Sci. 2014, 65, 311–336. [Google Scholar] [CrossRef] [Green Version]
  24. Seyoum, S.; Rachaputi, R.; Chauhan, Y.; Prasanna, B.; Fekybelu, S. Application of the APSIM model to exploit G× E× M interactions for maize improvement in Ethiopia. Field Crop Res. 2018, 217, 113–124. [Google Scholar] [CrossRef]
  25. Dilla, A.M.; Smethurst, P.J.; Barry, K.; Parsons, D. Preliminary estimate of carbon sequestration potential of Faidherbia albida (Delile) A. Chev in an agroforestry parkland in the Central Rift Valley of Ethiopia. For. Trees Livelihoods 2019, 28, 79–89. [Google Scholar] [CrossRef]
  26. Goma, M. Characterization of Climate Variability and Water Harvesting System for Crop Production in Adulala Watershed, Central Rift Valley of Ethiopia; Haramaya University: Haramaya, Oromia, Ethiopia, 2015. [Google Scholar]
  27. Argaw, M.; Teketay, D.; Olsson, M. Soil seed flora, germination and regeneration pattern of woody species in an Acacia woodland of the Rift Valley in Ethiopia. J. Arid Environ. 1999, 43, 411–435. [Google Scholar] [CrossRef]
  28. Endale, Y.; Derero, A.; Argaw, M.; Muthuri, C. Farmland tree species diversity and spatial distribution pattern in semi-arid East Shewa, Ethiopia. For. Trees Livelihoods 2017, 26, 199–214. [Google Scholar] [CrossRef]
  29. Araya, A.; Girma, A.; Getachew, F. Exploring impacts of climate change on maize yield in two contrasting agro-ecologies of Ethiopia. Asian J. Appl. Sci. Eng. 2015, 4, 26–36. [Google Scholar]
  30. Dawson, I.K.; Lengkeek, A.; Weber, J.C.; Jamnadass, R. Managing genetic variation in tropical trees: Linking knowledge with action in agroforestry ecosystems for improved conservation and enhanced livelihoods. Biodivers. Conserv. 2009, 18, 969–986. [Google Scholar] [CrossRef]
  31. Moriasi, D.N.; Arnold, J.G.; Liew, M.W.V.; Bingner, R.L.; Harmel, R.D.; Veith, T.L. Model evaluation guidelines for systematic quantification of accuracy in watershed simulations. Trans. ASABE 2007, 50, 885–900. [Google Scholar] [CrossRef]
  32. Yang, J.M.; Yang, J.Y.; Liu, S.; Hoogenboom, G. An evaluation of the statistical methods for testing the performance of crop models with observed data. Agric. Syst. 2014, 127, 81–89. [Google Scholar] [CrossRef]
  33. Ritter, A.; Muñoz-Carpena, R. Performance evaluation of hydrological models: Statistical significance for reducing subjectivity in goodness-of-fit assessments. J. Hydrol. 2013, 480, 33–45. [Google Scholar] [CrossRef]
  34. MacCarthy, D.S.; Sommer, R.; Vlek, P.L. Modeling the impacts of contrasting nutrient and residue management practices on grain yield of sorghum (Sorghum bicolor (L.) Moench) in a semi-arid region of Ghana using APSIM. Field Crop Res. 2009, 113, 105–115. [Google Scholar] [CrossRef]
  35. Robertson, M.; Sakala, W.; Benson, T.; Shamudzarira, Z. Simulating response of maize to previous velvet bean (Mucuna pruriens) crop and nitrogen fertiliser in Malawi. Field Crop Res. 2005, 91, 91–105. [Google Scholar] [CrossRef]
  36. Sida, T.S.; Baudron, F.; Kim, H.; Giller, K.E. Climate-smart agroforestry: Faidherbia albida trees buffer wheat against climatic extremes in the Central Rift Valley of Ethiopia. Agric. For. Meteorol. 2018, 248, 339–347. [Google Scholar] [CrossRef]
  37. Ndoli, A.; Baudron, F.; Schut, A.G.; Mukuralinda, A.; Giller, K.E. Disentangling the positive and negative effects of trees on maize performance in smallholdings of Northern Rwanda. Field Crop Res. 2017, 213, 1–11. [Google Scholar] [CrossRef]
  38. Kho, R.; Yacouba, B.; Yayé, M.; Katkoré, B.; Moussa, A.; Iktam, A.; Mayaki, A. Separating the effects of trees on crops: The case of Faidherbia albida and millet in Niger. Agrofor. Syst. 2001, 52, 219–238. [Google Scholar] [CrossRef]
  39. Sileshi, G.W. The magnitude and spatial extent of influence of Faidherbia albida trees on soil properties and primary productivity in drylands. J. Arid Environ. 2016, 132, 1–14. [Google Scholar] [CrossRef]
  40. Tiwari, T.P.; Brook, R.M.; Wagstaff, P.; Sinclair, F.L. Effects of light environment on maize in hillside agroforestry systems of Nepal. Food Secur. 2012, 4, 103–114. [Google Scholar] [CrossRef]
  41. Jose, S.; Gillespie, A.; Seifert, J.; Biehle, D. Defining competition vectors in a temperate alley cropping system in the midwestern USA: 2. Competition for water. Agrofor. Syst. 2000, 48, 41–59. [Google Scholar] [CrossRef]
  42. Pardon, P.; Reubens, B.; Reheul, D.; Mertens, J.; De Frenne, P.; Coussement, T.; Janssens, P.; Verheyen, K. Trees increase soil organic carbon and nutrient availability in temperate agroforestry systems. Agric. Ecosyst. Environ. 2017, 247, 98–111. [Google Scholar] [CrossRef]
  43. Mekonnen, K.; Amede, T.; Duncan, A.; Gebrekirstos, A. Sustainable agricultural intensification and its role on the climate resilient green economy initiative in Ethiopia. In Proceedings of the 3rd National Platform Meeting on Land and Water Management in Ethiopia, Addis Ababa, Ethiopia, 23–24 July 2012; International Livestock Research Institute: Nairobi, Kenya, 2013. [Google Scholar]
  44. Makumba, W.; Janssen, B.; Oenema, O.; Akinnifesi, F.K.; Mweta, D.; Kwesiga, F. The long-term effects of a gliricidia–maize intercropping system in Southern Malawi, on gliricidia and maize yields, and soil properties. Agric. Ecosyst. Environ. 2006, 116, 85–92. [Google Scholar] [CrossRef]
  45. Boffa, J.-M. Agroforestry Parklands in Sub-Saharan Africa; FAO: Rome, Italy, 1999. [Google Scholar]
  46. Rodriguez, D.; Cox, H.; Power, B. A participatory whole farm modelling approach to understand impacts and increase preparedness to climate change in Australia. Agric. Syst. 2014, 126, 50–61. [Google Scholar] [CrossRef]
  47. Yin, X.; Kersebaum, K.C.; Beaudoin, N.; Constantin, J.; Chen, F.; Louarn, G.; Manevski, K.; Hoffmann, M.; Kollas, C.; Armas-Herrera, C.M.; et al. Uncertainties in simulating N uptake, net N mineralization, soil mineral N and N leaching in European crop rotations using process-based models. Field Crop Res. 2020, 255, 107863. [Google Scholar] [CrossRef]
  48. Akinnifesi, F.K.; Chirwa, P.W.; Ajayi, O.C.; Sileshi, G.; Matakala, P.; Kwesiga, F.R.; Harawa, H.; Makumba, W. Contributions of agroforestry research to livelihood of smallholder farmers in Southern Africa: 1. Taking stock of the adaptation, adoption and impact of fertilizer tree options. Agric. J. 2008, 3, 58–75. [Google Scholar]
  49. Mafongoya, P.; Bationo, A.; Kihara, J.; Waswa, B.S. Appropriate technologies to replenish soil fertility in southern Africa. Nutr. Cycl. Agroecosyst. 2006, 76, 137–151. [Google Scholar] [CrossRef]
  50. Vanlauwe, B.; Aihou, K.; Aman, S.; Iwuafor, E.N.; Tossah, B.K.; Diels, J.; Sanginga, N.; Lyasse, O.; Merckx, R.; Deckers, J. Maize yield as affected by organic inputs and urea in the West African moist savannah. Agron. J. 2001, 93, 1191–1199. [Google Scholar] [CrossRef]
Figure 1. Uncalibrated comparison of observed and predicted maize grain yield grown in all zones under trees in the 2015 (blue symbols) and 2016 (orange and red symbols) cropping seasons. Lines are linear regression (solid) and 1:1 (broken).
Forests 11 01175 g001
Figure 2. Simulated maize yield response to rates of N in crop-only and under-tree zones (0–2 m, 2–4 m, and 4–6 m) for 100% pruned, 50% pruned, and unpruned conditions in the 2016 cropping season. Circles indicate yield at the optimum fertilizer rate. Simulated values for all pruning levels in the 4 to 6 m zone (0%, 50%, and 100% pruning) were approximately identical and therefore indistinguishable on the graph.
Forests 11 01175 g002
Figure 3. Maize yield response to N fertilizer rate in relation to sowing date (15 May or 30 June) and cultivar (Melkassa or mh19) in the crop-only and 2–4 m zones with 100% pruning in the 2016 cropping season.
Forests 11 01175 g003
Figure 4. Cumulative probability of maize yield (1977–2016) by zone under two contrasting growth conditions (i.e., without pruning or fertilizer (P0N0)) (a), and with 100% pruning and high N (P100N200) (b).
Forests 11 01175 g004
Table 1. Measured shade values used to set up the model.
Pruning LevelShade (%)
Zone (m)
0–22–44–66–8Crop-Only
Unpruned46.341.727.400
50% Pruned31241400
100% Pruned179900
Table 2. Measured tree root length density (cm cm−3, unpruned) values used to set up the model. Root length densities were reduced by an assumed 25% in the 50% pruned treatment and by 50% in the 100% pruned treatment.
Depth
(cm)
Zone (m)
0–22–44–66–8Crop-Only
0–200.510.440.240.100
20–400.480.300.230.140
40–600.160.060.140.020
60–800.060.030.060.010
80–1200.030.010.010.010
120–2000.020.010.010.010
200–3500.010.010.010.010
Table 3. Soil properties (0–80 cm) used for simulations.
ZoneDepthBD 1,2OCNO3NH4FbiomFinertDULLLmaizeKLmaizePAWCmaize
(g cm−3)(%)(µg g−1)(µg g−1) (mm mm−1)(d)(mm mm−1)
0–2 m0–201.1501.7002.1740.8700.0200.6500.3500.1600.0050.190
20–401.1501.4000.8700.4350.0200.7000.3500.1700.0040.180
40–601.3401.3000.3730.1870.0100.8000.3500.2000.0040.150
60–801.3401.2000.1870.0000.0100.9000.3500.2100.0040.140
2–4 m0–201.1501.482.1740.8700.0200.6500.3500.1600.0060.190
20–401.1501.460.8700.4350.0200.7000.3500.1700.0050.180
40–601.3401.420.3730.1870.0100.8000.3500.2000.0040.150
60–801.3401.350.1870.0000.0100.9000.3500.2100.0030.140
4–6 m0–201.1501.332.1740.8700.0200.6500.3500.1600.0050.190
20–401.1501.120.8700.4350.0200.7000.3500.1700.0040.180
40–601.3400.900.3730.1870.0100.8000.3500.2000.0040.150
60–801.3400.760.1870.0000.0100.9000.3500.2100.0040.140
Crop-only0–201.1501.072.1740.8700.0100.6000.2300.1800.0050.050
20–401.1500.860.8700.4350.0100.6500.2600.1900.0040.070
40–601.3400.790.3730.1870.0010.6500.2970.2200.0040.077
60–801.3400.700.1870.0000.0000.7500.3300.2300.0040.100
1 Abbreviations: bulk density (BD), organic C (OC), nitrate (NO3), ammonium (NH4), fraction of C in microbial biomass (Fbiom), fraction of inert C (Finert), crop lower limit (LLmaize), daily maximum proportion of water extraction by roots (KLmaize), and plant available water content (PAWCmaize). 2 BD and OC were measured values, others were calibrated.
Publisher’s Note: MDPI stays neutral with regard to jurisdictional claims in published maps and institutional affiliations.

