Article

Comparative Proteomic Analysis of Leaves at Different Ages in Allotriploid Populus

1
Beijing Advanced Innovation Center for Tree Breeding by Molecular Design, Beijing Forestry University, Beijing 100083, China
2
Horticulture and Landscape College, Zhongkai University of Agriculture and Engineering, Guangzhou 510225, China
3
College of Forest Resources and Environmental Science, Michigan Technological University, Houghton, MI 49931, USA
4
National Engineering Laboratory for Tree Breeding, Beijing Forestry University, Beijing 100083, China
5
College of Biological Sciences and Technology, Beijing Forestry University, Beijing 100083, China
*
Author to whom correspondence should be addressed.
Forests 2020, 11(11), 1154; https://doi.org/10.3390/f11111154
Submission received: 27 August 2020 / Revised: 27 October 2020 / Accepted: 28 October 2020 / Published: 30 October 2020
(This article belongs to the Special Issue Emerging Principles of Tree Biology in the Omics Era)

Abstract

:
Triploid poplar trees have been shown to have a number of growth advantages, especially much bigger leaves that contribute greatly to the increased biomass. In this study, we focused on the relationships between leaf age and leaf metabolism in triploids. We performed comparative proteomic analysis of the 5th (FDR5), 10th (FDR10), and 25th (FDR25) leaves from the apical meristems in allotriploids originated from first-division restitution (FDR). A total of 1970, 1916, and 1850 proteins were identified in the FDR5, FDR10, and FDR25, respectively. Principle component analysis (PCA) and differentially accumulated protein (DAP) analysis showed that FDR10 and FDR25 displayed higher similarities of protein accumulation patterns as compared to FDR5. MapMan enrichment analysis showed that several primary metabolic pathways or processes were significantly enriched in the DAPs. For example, photosynthesis, major CHO metabolism, glycolysis, N metabolism, redox, C1-metabolism, DNA, and protein turnover were significantly altered in both FDR10 and FDR25 compared with FDR5. In addition, amino acid metabolism and gluconeogenesis/glyoxylate cycle also underwent significant changes in FDR25 compared with FDR5. However, only amino acid metabolism was significantly enriched in the DAPs between FDR25 and FDR10. Further, DAP accumulation pattern analysis implied that FDR5, FDR10, and FDR25 were placed in the young, mature, and primary senescence stages of leaves. The most DAPs involved in the light reaction, photorespiration, Calvin cycle, starch and sucrose metabolism, pentose phosphate pathway (OPP), tricarboxylic acid (TCA) cycle, N metabolism, and C1-metabolism displayed higher accumulation in both FDR10 and FDR25 compared to FDR5. However, the most DAPs that are involved in cell wall and lipid metabolism, tetrapyrrole synthesis, nucleotide metabolism exhibited lower accumulation in both FDR10 and FDR25. Almost all DAPs between FDR-10 and FDR-25 showed a dramatic decrease in FDR25. KEGG enrichment analysis showed that carbon metabolism was altered significantly at different leaf ages. DAPs that are involved in carbon metabolism were predicted as different points in protein–protein interaction (PPI) networks from the STRING database. Finally, inconsistent transcript and protein abundance was found for DAPs, indicating the presence of posttranscriptional regulation during leaf-age progression process.

1. Introduction

Proteomics has contributed greatly to our understanding of information on protein accumulation. In plants, proteomics has been applied to protein quantitative profiling [1], post-translational modifications [2], signaling pathway recognition [3], subcellular localization, and interactions [4,5]. Many biological processes, including biotic and abiotic stress [6,7], development [8], nutrient sensing, and polyploidization [9,10], have been characterized by using proteomics.
Populus has long been an important model system for studies of forest tree species because of the available genetic and genomic resources, small genome size, and fast growth speed [11]. Yet, large-scale profiling using proteomics are limited to a few. Plomion et al. profiled 2-D-maps for proteins from eight tissues/organs of poplar, detecting 398 proteins, in which about 91.2% were identified by nanospray LC-MS/MS [12]. Kalluriet et al. reported shotgun MS/MS profiling to the proteome of Populus developing xylem, identifying nearly 6000 proteins [13]. Hurst et al. investigated the proteome of fully expanded leaves from greenhouse-grown Populus trees using a shotgun mass spectrometry-based proteomics method, detecting over 2500 proteins [14]. Liu et al. presented a proteome profiling of Populus early stem from primary to secondary growth using two-dimensional gel electrophoresis (2-DE) followed by LC-ESI-Q-TOF-MS, identifying 165 differential abundant proteins during various growth stages of Populus early stems [15]. Wang et al. analyzed the mature Populus pollen proteome, identifying 159 distinct proteins from 242 spots analyzed by 2-DE and matrix-assisted laser desorption/ionization-time of flight mass spectrometry (MALDI-TOF/TOF MS) [16]. Leijon et al. used a similar approach to identify 201 proteins specifically enriched in responses to stress, transport, metabolism and signal transduction from plasmodesmata of Populus cell suspension cultures [17]. Bonhomme et al. performed leaf proteome analysis of eight Populus × euramericana genotypes using 2D gel separation followed by MS identification, detecting 863 reproducible gel spots and photosynthesis-related proteins involved in genetic variation in drought response and in water use efficiency [18]. In some cases, Populus proteomics studies focused on differential sexual responses under abiotic stresses. Proteomics of Populus males and females by isobaric tag for relative and absolute quantification (iTRAQ)-based quantitative approach identified 2405 proteins under UV-B radiation. Further, this study detected 245 and 126 proteins responsive to UV-B in males and females, respectively [19]. Zhang et al. presented proteomic analysis of male and female poplars under drought and chilling stress using 2-DE followed by MALDI-TOF/TOF MS, respectively, which reported 563 and 700 reliable matched spots in drought and chilling stress, respectively. Out of the 64 drought and 65 chilling responsive spots, 44 and 48 showed significant sexual differences, respectively [20,21].
In recent years, triploid breeding has achieved great success in Populus genetic improvement. The resultant allotriploid plants usually have higher photosynthetic rate, higher relative chlorophyll content, larger leaf area and differential protein accumulation profile compared to diploid counterparts [22,23,24]. The leaf-age progression follows a common basic program that is flexible and adjusted according to species, developmental stage, and environmental circumstances, which is followed by a highly complicated and genetically programmed death process. It exemplifies the dynamic nature and flexibility of plant development in response to internal and external cues. However, the molecular mechanism underlying leaf-age progression remains unclear in Populus triploids.
In this study, we utilized a label-free shotgun proteomics approach to perform a comprehensive proteomic profiling of leaves of different leaf-ages in Populus allotriploids, which were obtained through first-division restitution (FDR) induced by high-temperature exposure. Previous phenotype analysis has implied that leaves from the 5th (FDR5), 10th (FDR10), and 25th (FDR25) from stem apices represented young, mature, and initially aged leaves, respectively [25]. These leaves from these three positions were investigated. The acquired results provide an informative proteomic basis for leaf-age progression in triploid Populus.

2. Materials and Methods

2.1. Plant Materials

Populus triploids were generated by crossing 2n maternal gametes and 1n paternal pollens. The maternal and paternal parent were ‘Zheyin3#’ (Populus pseudo-simonii × P. nigra) and ‘BJY’ (P. pyramidalis × P. cathayana cv.‘Beijingensis’), respectively. Diploid gametes were originated from first-division restitution (FDR) induced by high-temperature exposure (41–44 °C). The triploid plants acquired were ultimately assessed and confirmed by flow cytometry (FACSCaliburTM: BD Biosciences, Mississauga, ON, Canada) and chromosome counting.
One-year-old branches with a length of about 15 cm from seedlings were cut in April. Cuttings were planted in plastic pots (25 cm diameter × 25 cm depth) containing sand, organic matter, and vermiculite (2:2:1, v/v/v). After sprouting and growing in the greenhouse for 4 months, the leaves at three positions (the 5th, 10th and 25th leaves from stem apices) were collected from nine plants with uniform growth vigor (Supplementary Figure S1). Leaves from the same position were divided into three pools, and each pool consisted of three plants to form a biological replicate. All samples were used for protein and RNA extraction.

2.2. Protein Extraction, Digestion, and Desalting

Total protein was extracted using a modified method as previously described [24]. 1 g of the samples was ground to fine powder in liquid nitrogen using a mortar and pestle and then transferred into 10 times volume of precooled acetone (−20 °C) containing 10% trichloroacetic acid and 0.07% 2-mercaptoethanol. After the mixture was thoroughly mixed, it was incubated for 2 h at −20 °C and then centrifuged at 9000× g for 30 min at 4 °C. The supernatant was discarded for collecting precipitates. The resulting precipitation was repeatedly suspended with precooled acetone solution and centrifuged several times until obtaining white precipitates. The washed protein was vacuum-dried and dissolved in solubilisation buffer consisting of 8 M urea, 4% CHAPS, 30 mM HEPES, 1 mM PMSF, 2 mM EDTA, and 10 mM 1, 4-Dithiothreitol (DTT). The solubilized protein was centrifuged at 20,000× g for 30 min at 4 °C. The resulting supernatant was final protein sample and the protein concentration was then assessed using the Bradford method [26].
DTT was added to 200 μg of protein sample to achieve 100 mmol/L DTT concentration in the final solution, which was then incubated for 5 min at 100 °C. 200 μL of universal buffer (8 M urea and 150 mM Tris–HCl, pH 8.0) was added to cooled solution. The obtained mixtures were loaded onto 30 kDa molecular weight cutoff filters and spun down. The filter unit was mixed with 200 μL UA (8 m urea. 0.1 m Tris-HCl (pH 8.5). 50 mM dithiothreitol) and then centrifuged at 14,000× g for 20 min. The precipitates were collected and dissolved in 100 μL of 5 mM iodoacetamide. The resulting solution was incubated in the dark for 30 min followed by centrifugation at 14,000× g for 20 min. The collected protein samples were digested using trypsin (Promega, 1:50 for trypsin: protein) at 37 °C for 18 h. The digested solution was desalted using a C18 pipette tips.

2.3. LC-MS/MS Analysis of Digested Peptides

Briefly, 2 μg of the digested peptides was loaded onto an EASY-nLC 1000 (Thermo Fisher Scientific, Lenexa, KS, USA) HPLC system equipped with a C18 PepMap trap column (100 μm ID × 20 mm, Thermo Fisher Scientific). The peptides loaded on the trap column were separated at a flow rate of 400 nL/min with acetonitrile containing 0.1% formic acid. The peptide separation was performed on a 0–45% acetonitrile gradient for 90 min. The peptide ions were detected and analyzed on a Q Exactive mass spectrometer (Thermo Fisher Scientific). The full scan mass spectrometry (MS) spectra (300–1800 m/z at a resolution of 70,000 at 200 m/z) was measured using positive mode on a Q Exactive mass spectrometer. The 10 most abundant precursor ions from each MS scan were selected for higher-energy collisional dissociation fragmentation under a normalizaed collision energy of 35%.

2.4. Protein Identification

The label-free LC-MS/MS data were processed using MaxQuant software (version 1.6.14) [27]. A Populus trichocarpa protein database (V4.1) was used for MS/MS identification. A total of 34,699 protein sequences were used to search the MS/MS spectra by the Andromeda search engine. The first search and the main search were specified as 20 ppm and 4.5 ppm, respectively. Two missing cleavage sites were allowed for trypsin. Carbamidomethyl was set as fixed modification, as well as oxidation and acetyl as variable modifications. The minimum peptide length was specified as 7 amino acids and the false discovery rate (FDR) for peptide and protein identifications was specified as 0.01. The FDR for various levels, including peptide charge, length, modification numbers and the identification score, was controlled using a target-decoy search strategy. The identification was considered as valid only when the protein had at least 2 matched peptides and 1 unique peptide. The interference from laboratory contaminants and reverse database was removed to obtain final protein tables.

2.5. Analysis of Differentially Accumulated Proteins (DAPs)

The freely available Perseus platform (version 1.6.14) was used to identify DAPs between samples [28]. The protein tables were imported and the protein intensities were transformed to logarithmic scale with base 2. The value of the lowest intensity was used to replace the missing values. Student’s t-test was used to infer statistically significant protein accumulation difference. Proteins with a fold-change of at least 1.5 and a value of p ≤ 0.05 were identified as DAPs.

2.6. Protein Annotation and Enrichment Analysis

The identified proteins were annotated using MapMan bin codes and Kyoto Encyclopedia of Genes and Genomes (KEGG) pathways [29]. MapMan function categories and KEGG pathways were detected for DAP enrichment analysis.

2.7. Protein-Protein Interaction (PPI) Network Construction

STRING v11.0 was used to analyze the protein-protein interaction (PPI) of DAPs involved in carbon metabolism and construct PPI network. The minimum required interaction score parameter was specified as the highest confidence level.

2.8. RNA-Seq Data Analysis

The total RNAs were extracted and purified using TRIzol reagent kit (Invitrogen, Carlsbad, CA, USA) and RNase-Free DNase-Free DNaseSet (Qiagen China, Shanghai, China), respectively. Agarose gel electrophoresis was used to detect the integrity of RNA. NanoDrop 2000 biological analyzer (Thermo Fisher Scientific Inc., Wilmington, DE, USA) was applied to detect the concentration of RNA. Obtained high-quality RNA (1.6 ≤ 28 s/18 s ≤ 2.0) was subjected to RNA-seq sequencing in Shanghai Novelbio Biological Technology Co., Ltd. (Shanghai, China, http://www.novelbio.com/). Clean reads were obtained through removing adapter and low-quality reads from the raw data. MapSplice was used to map clean reads to Populus trichocarpa genome [30]. Reads per kilobase per million mapped reads (RPKM) was calculated for each gene based on the read count matched to the gene and the gene length. DESeq2 was used to perform differential expression analysis [31]. Genes with Benjamini and Hochberg FDR ≤ 0.05 and |log2(FC)| > 1 were considered differential expressed genes (DEGs).

3. Results

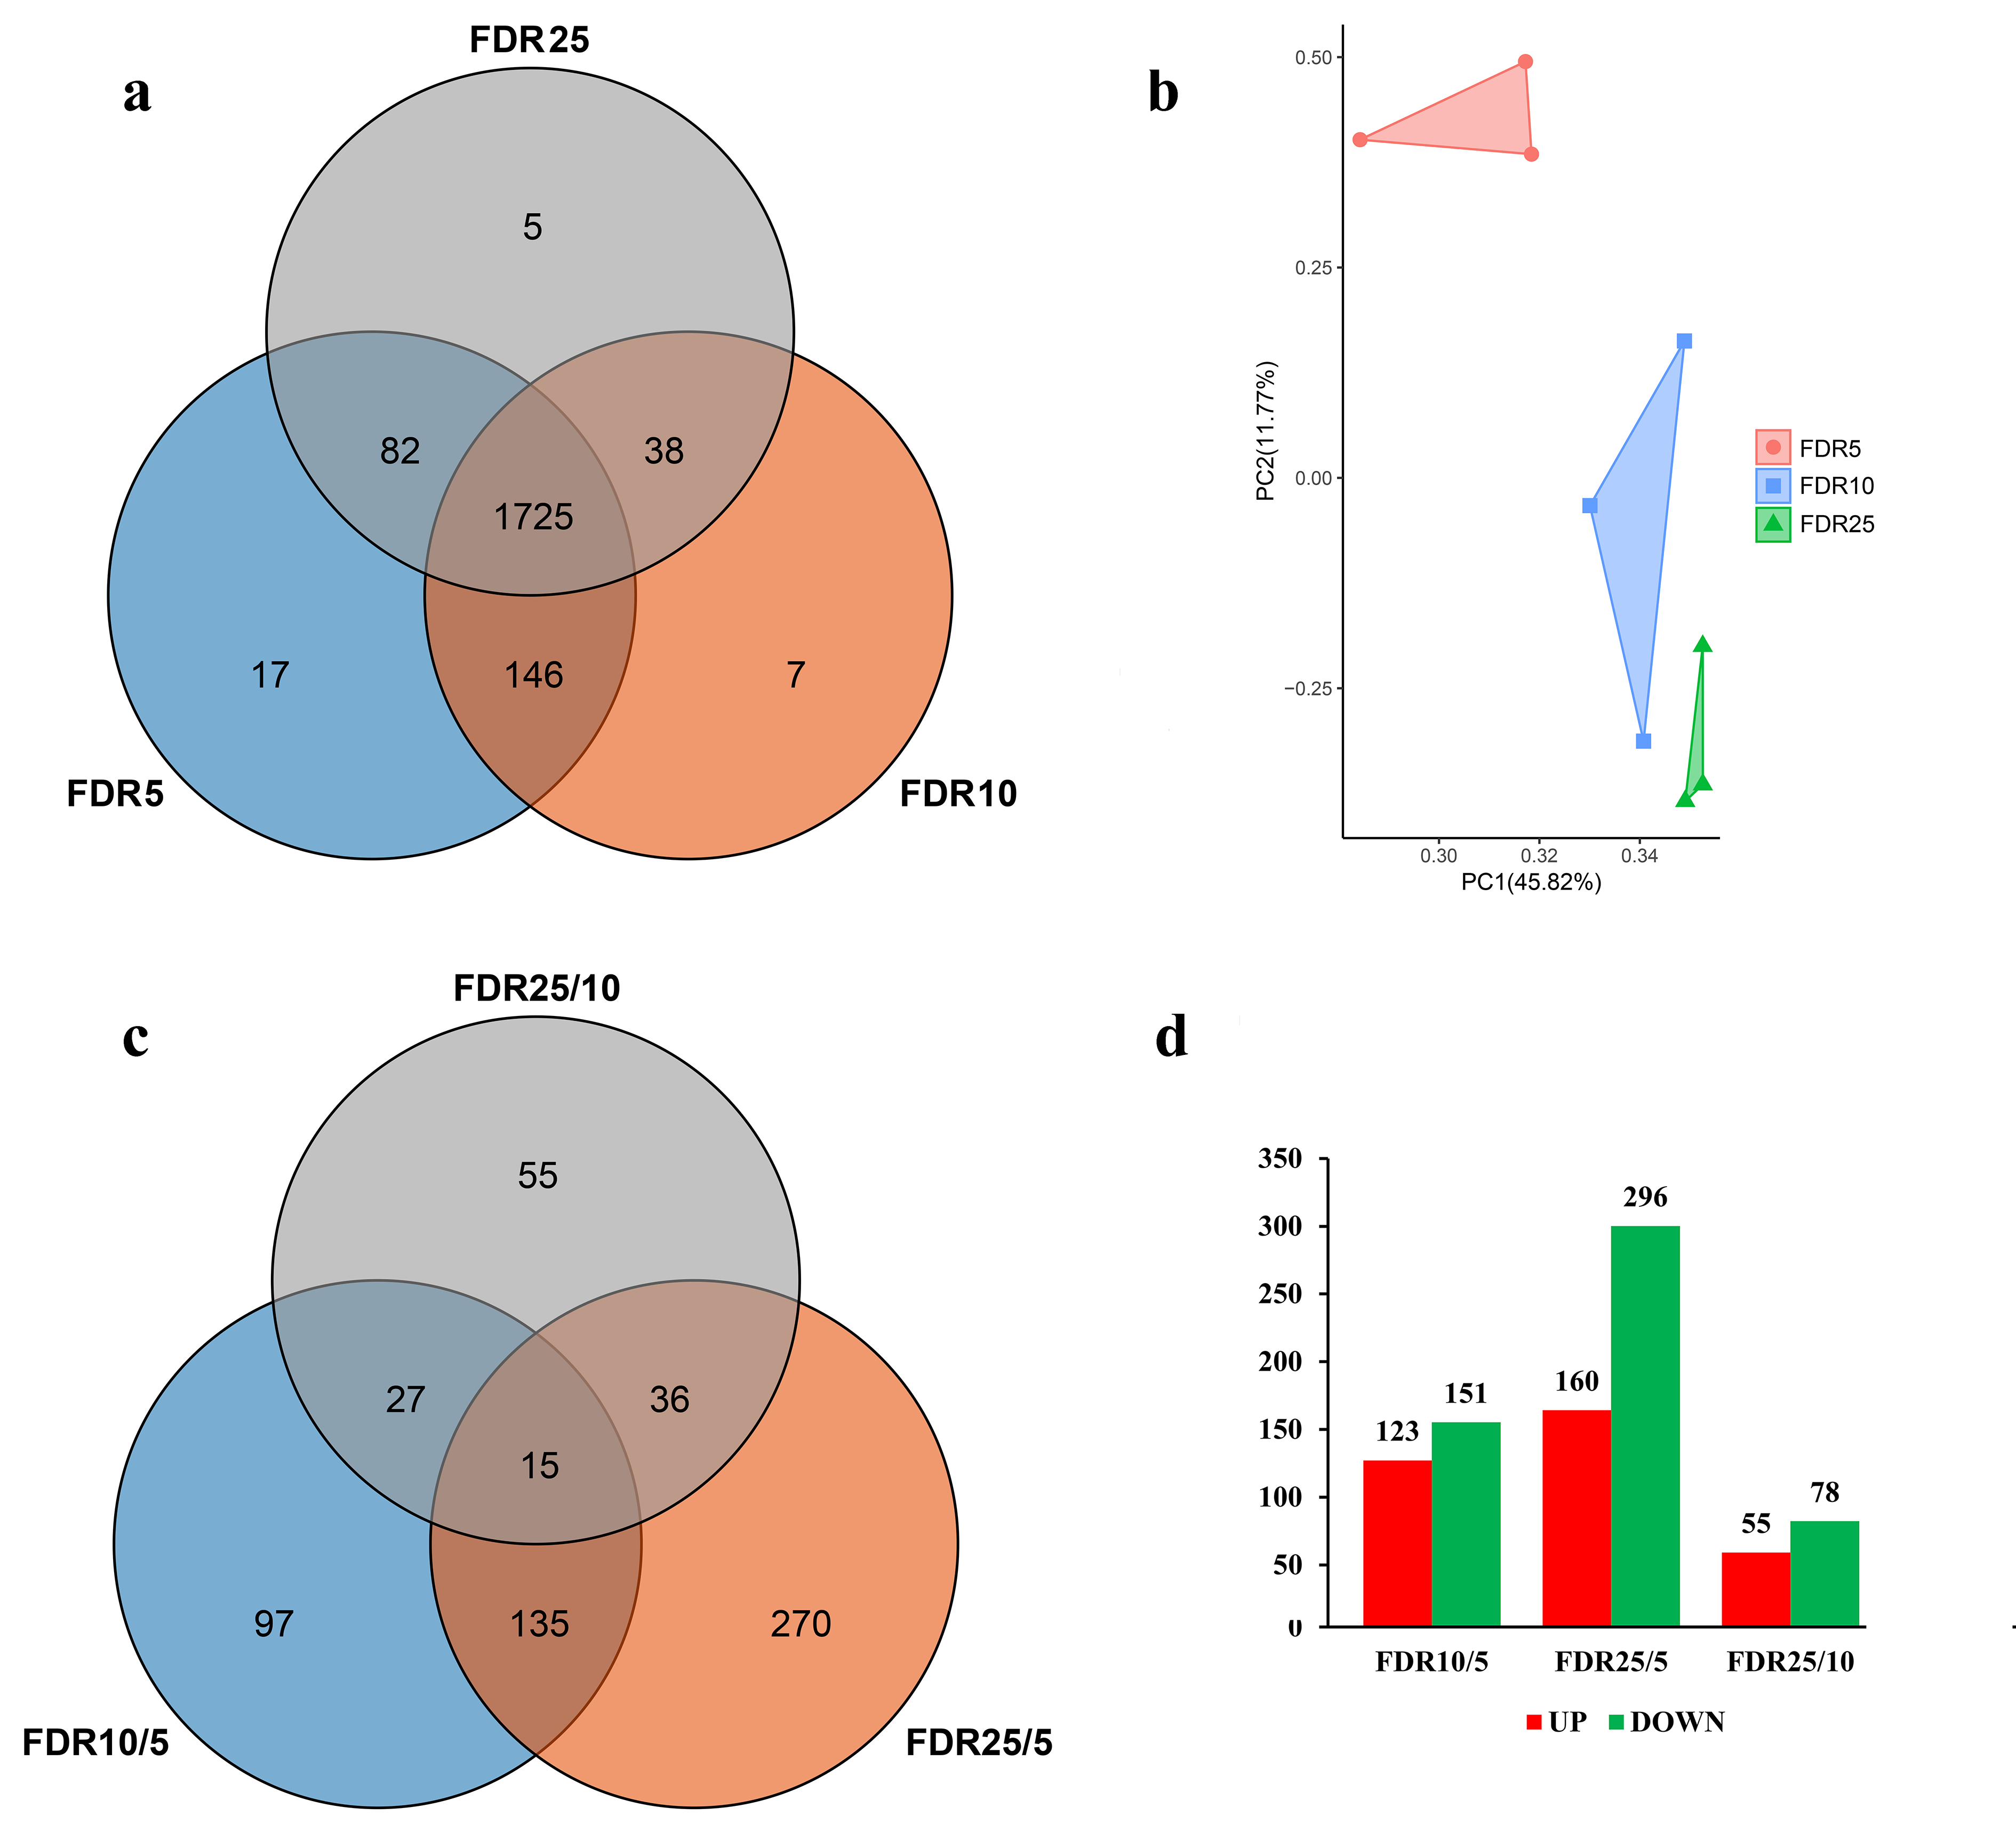
3.1. Overview of Proteome during Leaf Development

A total of 1970, 1916, and 1850 proteins were identified in FDR5, FDR10, and FDR25, respectively (Figure 1a). The majority of proteins (1725) were identified in all three age stages of leaves, suggesting the remarkable similarity of the range of measured proteins across all three stages. The comparison between proteins identified showed that 17, 7, and 5 proteins specifically expressed in FDR5, FDR10, and FDR25 tissues, respectively.
Principal component analysis (PCA) revealed that two major primary components, which explained 45.82% and 11.77% of the variance in abundance of proteins identified among three leaf ages, respectively (Figure 1b). The relative abundance of proteins from three leaf ages colocalized into distinct clusters corresponding to specific leaf age. However, FDR5 cluster was away from FDR10 and FDR25 cluster, implying a higher dissimilarity in the abundance of accumulated proteins in FDR5 compared to the other two leaf tissues.
The analysis of DAPs showed that the most DAPs (a total of 456) were identified between FDR5 and FDR25, while between FDR-5 and FDR10 as well as between FDR10 and FDR25 the numbers of DAPs were significantly lower than 456 (274 between FDR5 and FDR10, 133 between FDR10 and FDR25) (Figure 1c). In addition, a similar situation was observed for the numbers of specific DAPs identified from the three comparisons. These results further confirmed those of PCA analysis, indicating higher variance of abundance of proteins identified in FDR5 than those in either FDR10 or FDR25. The further analysis of DAPs showed that there were fewer up-accumulated proteins than down-accumulated proteins in all three comparisons (Figure 1d).

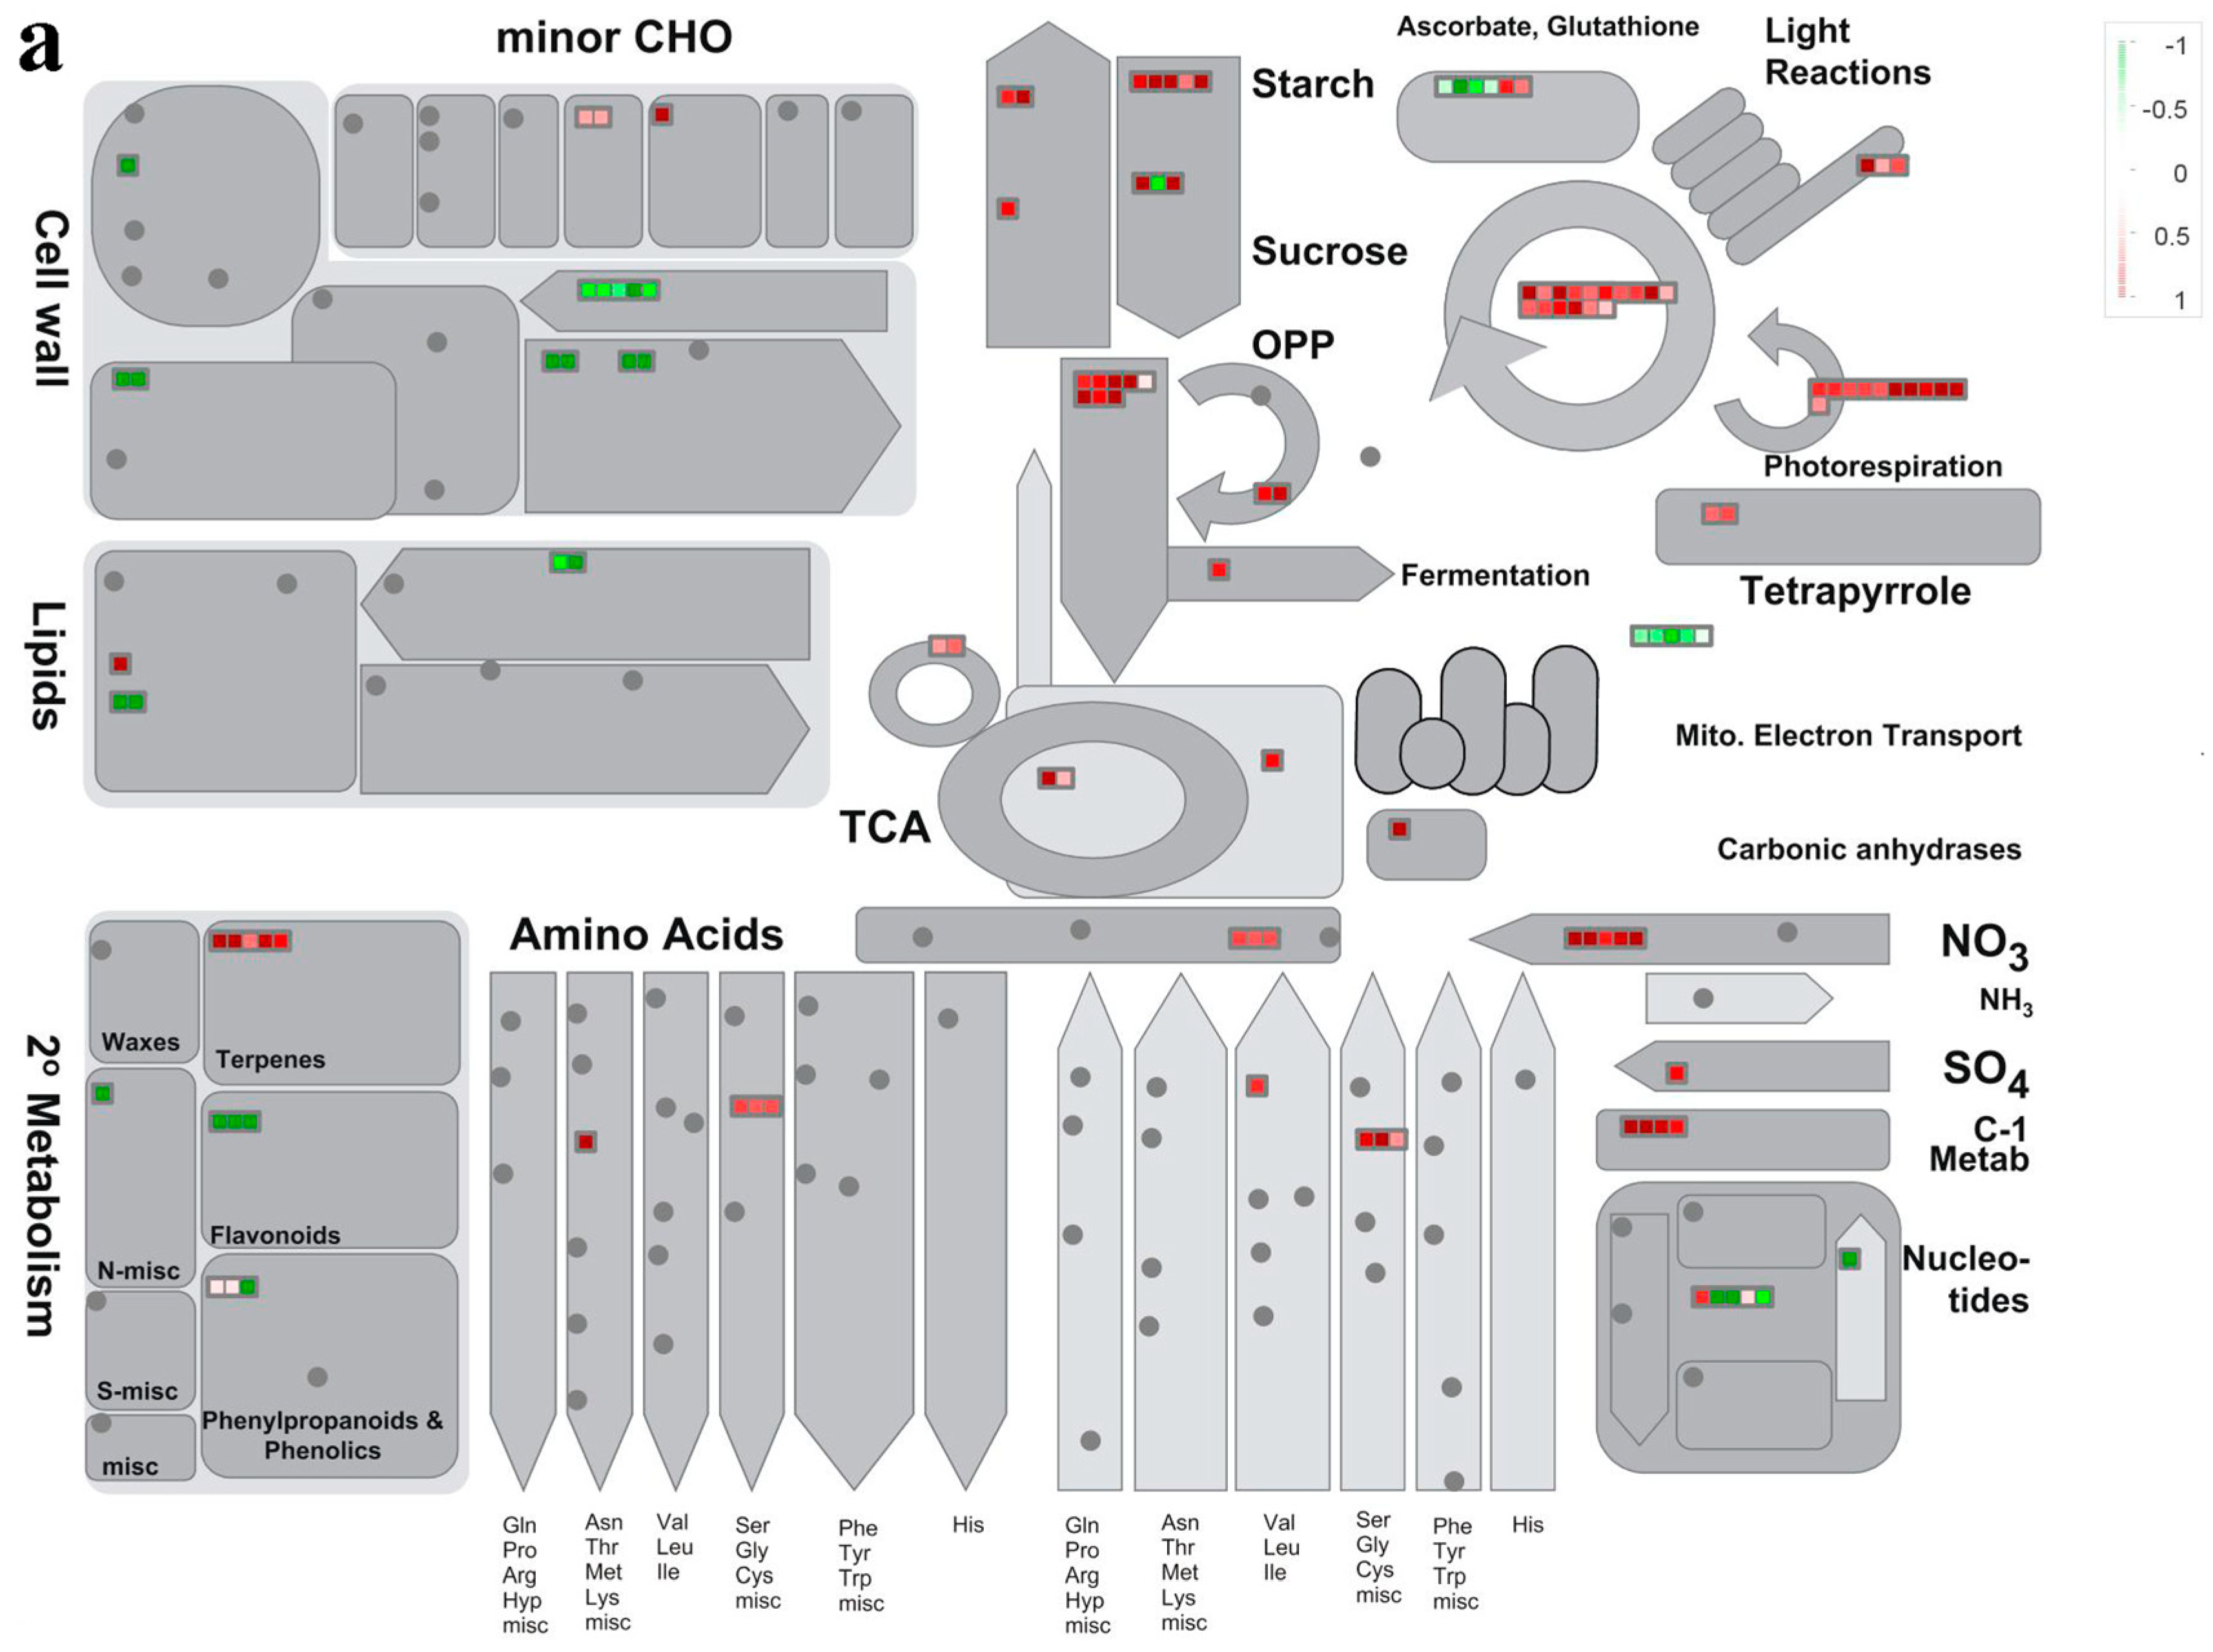
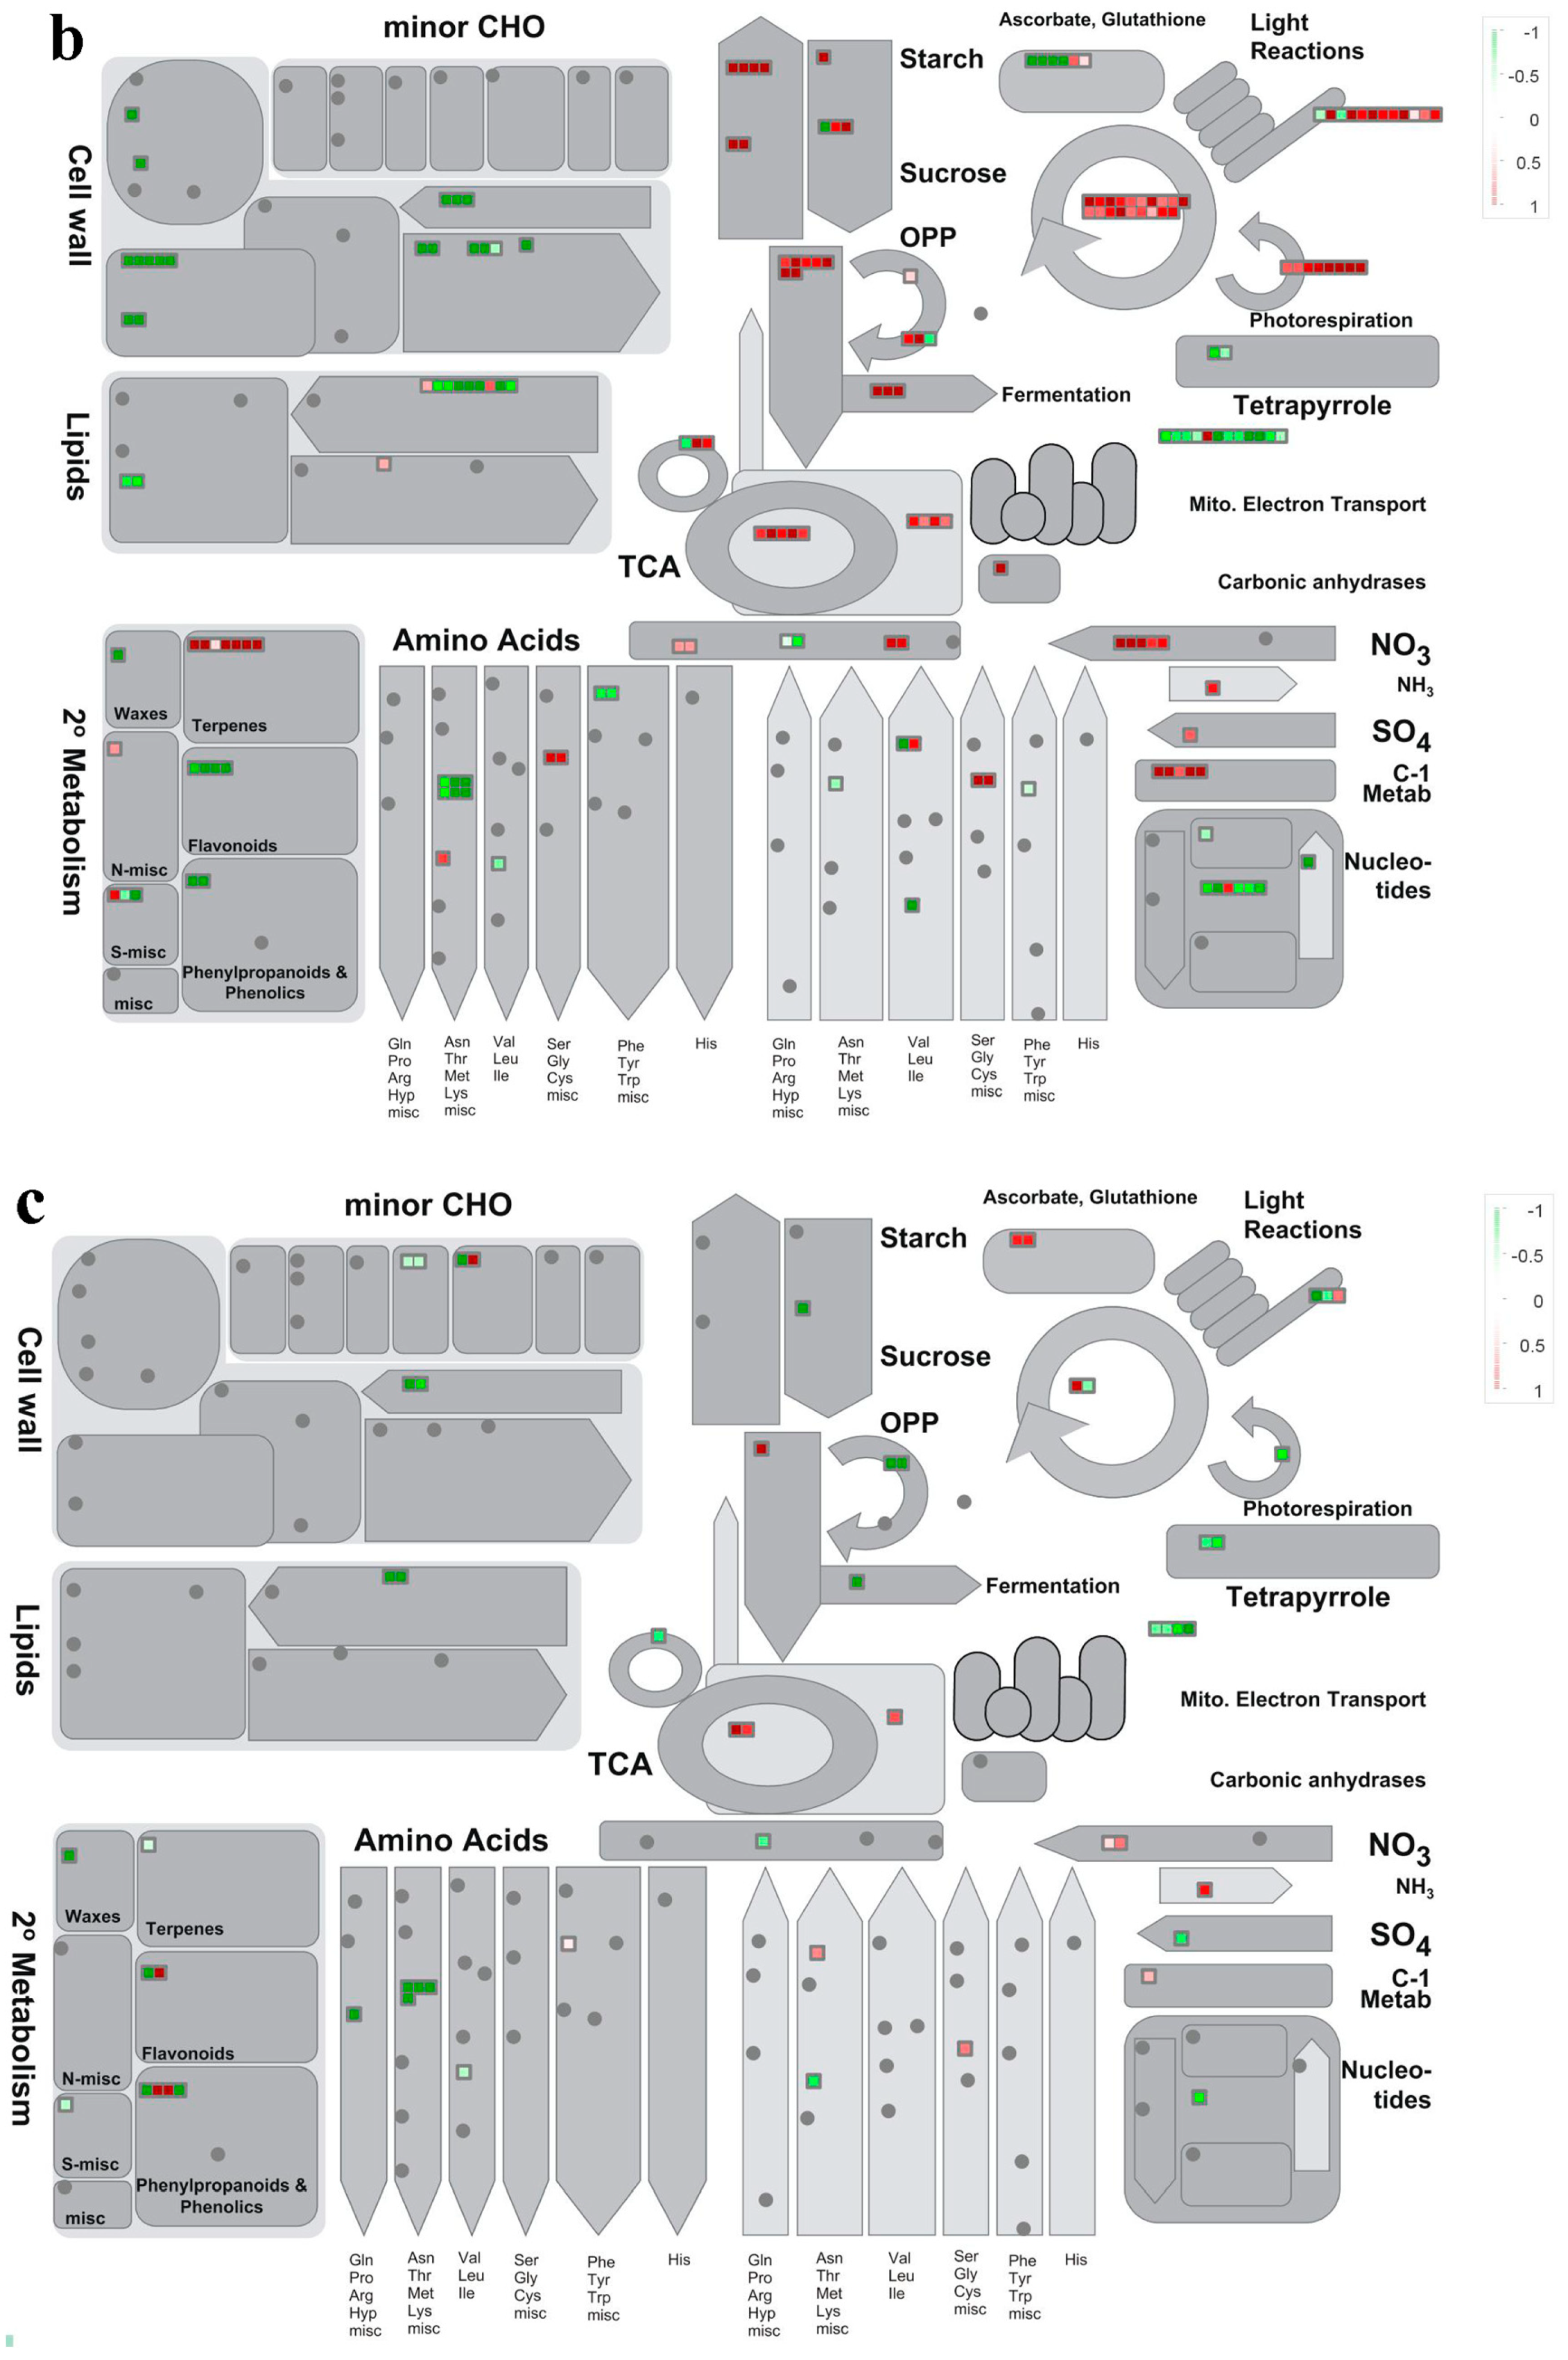
3.2. Cellular Processes Reflected by DAPs

Protein accumulation changes at different leaf ages reflect a sequential activation and repression of specific cellular processes. Supplementary Table S1 summarizes DAPs in the context of biological processes. The number of biological processes mapped by DAPs between FDR10 and FDR25 was lower than that of the other two comparisons, consistent with the numbers of DAPs identified from three differential analysis (Figure 1c).
In order to understand the significantly altered biological processes at different leaf ages, the enrichment analysis of MapMan ontology was carried out. It appeared that DAPs identified displayed significant enrichment in specific functional categories (Supplementary Table S1). Compared to FDR5, several major primary metabolism at MapMan bin hierarchy level 2, including photosynthesis, major CHO metabolism, glycolysis, N metabolism, redox, C1-metabolism, DNA, protein turnover, exhibited significant changes in both FDR10 and FDR25 (Figure 2). In addition, amino acid metabolism and gluconeogenesis/glyoxylate cycle have significantly altered for FDR25 (Figure 2). More significantly changed functional categories at MapMan bin level 3 displayed overlaps between FDR10 and FDR25 (Figure 2). Interestingly, only three biological processes, namely amino acid metabolism at level 2, mitochondrial electron transport/ATP synthesis.cytochrome c oxidase, and protein.aa activation at level 3, showed significant changes in the comparison between FDR10 and FDR25 (Figure 2). These results implied that physiological state and biological functions of FDR10 and FDR25 displayed a high similarity and have changed significantly compared with FDR5.

3.3. Accumulation Patterns of DAPs

The primary metabolism has altered during leaf-age progression. To examine changes in the accumulation levels of the identified DAPs in depth, the abundance changes of DAPs were visualized using MapMan software at three stages. The results showed that most DAPs involved in the light reaction, photorespiration, Calvin cycle, starch and sucrose metabolism, pentose phosphate pathway (OPP), tricarboxylic acid (TCA) cycle, N metabolism, and C1-metabolism displayed higher abundance in both FDR10 and FDR25 than those in FDR5 (Figure 3a,b), suggesting that FDR10 and FDR25 promoted the growth of poplars through vigorous carbohydrate synthesis and catabolism. However, most DAPs involved in cell wall and lipid metabolism, tetrapyrrole synthesis, nucleotide metabolism exhibited lower abundance in both FDR10 and FDR25 than those in FDR5, showing that FDR5 were undergoing vigorous cell division. Interestingly, almost all DAPs between FDR10 and FDR25 showed dramatic decrease in FDR25 (Figure 3c), implying that FDR25 could have entered the primary stage of leaf senescence. These results showed that FDR5, FDR10, and FDR25 at three different stem positions represented young, mature, and initially aged leaves, respectively.

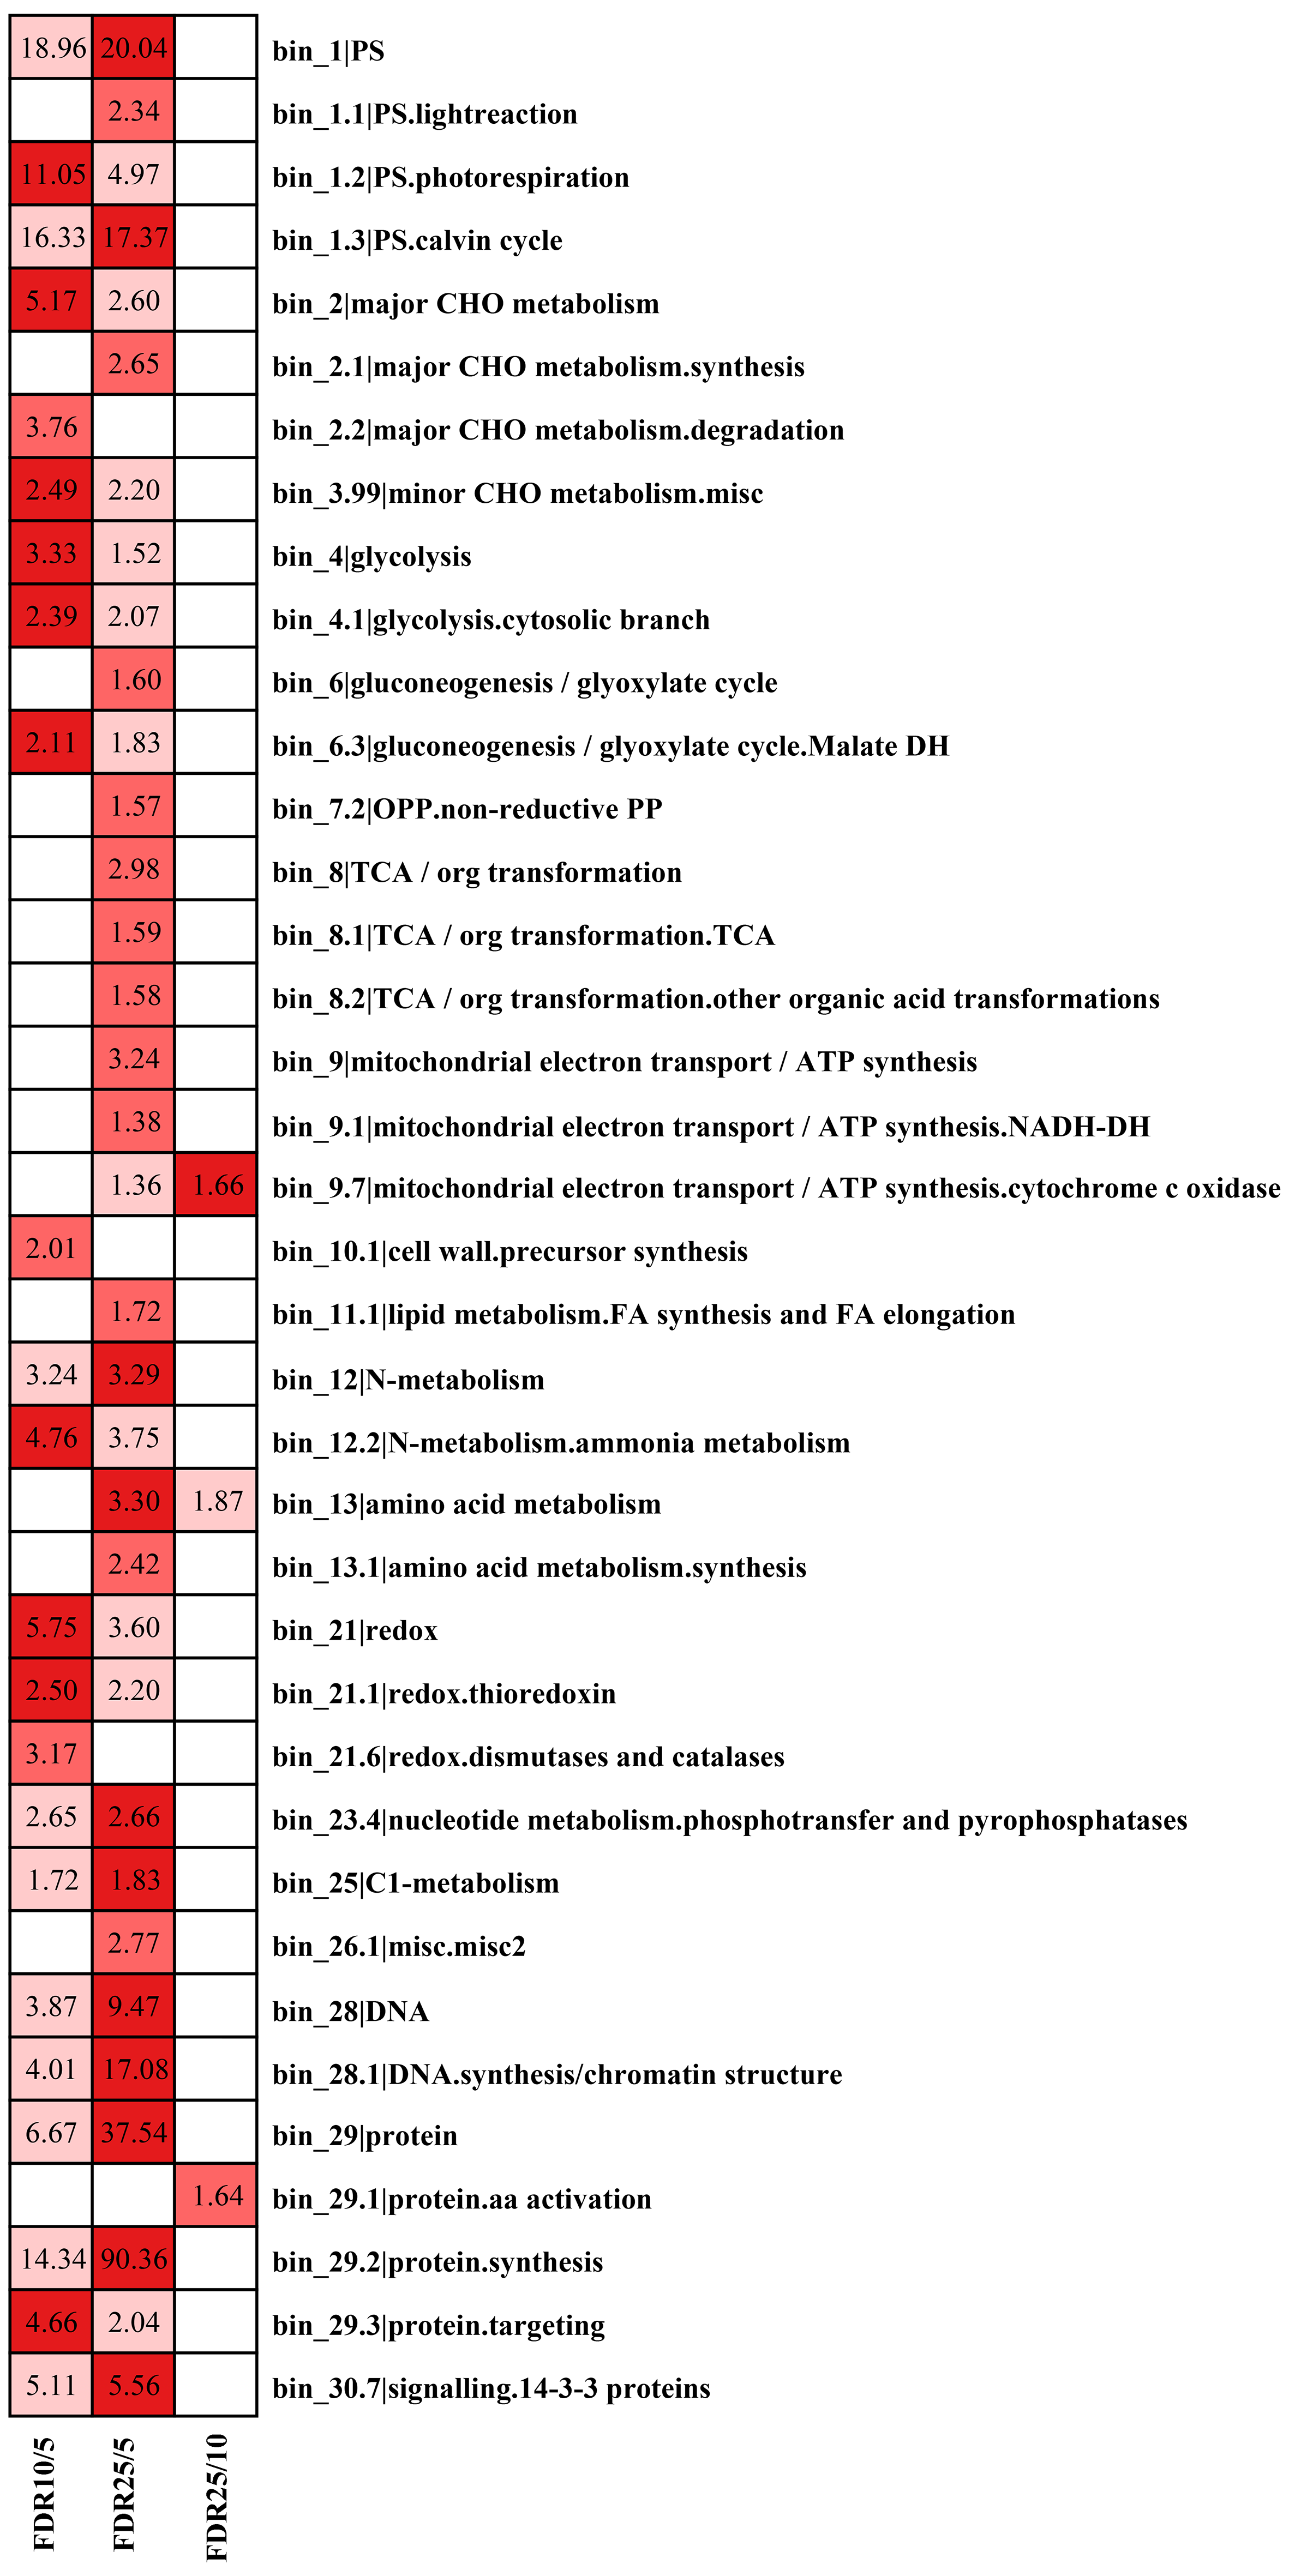
3.4. KEGG Enrichment Analysis

To further identify the significant changed metabolic pathways during leaf-age progression, the DAPs were investigated by Kyoto Encyclopedia of Genes and Genomes (KEGG) pathway analysis. The results showed that 55 significantly enriched KEGG pathways were identified at 0.05 FDR-corrected p-value level (Table 1). The most significant differential enrichment was found for carbon metabolism, glyoxylate and dicarboxylate metabolism, metabolic pathways, biosynthesis of secondary metabolites. Some specific pathways were enriched for DAPs from only one or two comparisons. For example, significant differential enrichment was observed for carbon fixation in photosynthetic organisms for FDR10/5 and FDR25/5; pyrimidine metabolism for FDR10/5 only; biotin metabolism for FDR25/5 only; riboflavin metabolism for FDR-25/10 only. The results indicated that these significant enriched pathways could play critical roles for the transition of leaf-age. More importantly, carbon metabolism appeared to be the more important metabolic pathway for the transition of leaf-age as the carbon metabolism pathway was detected as nearly the most significantly enriched pathway for DAPs in each comparison.

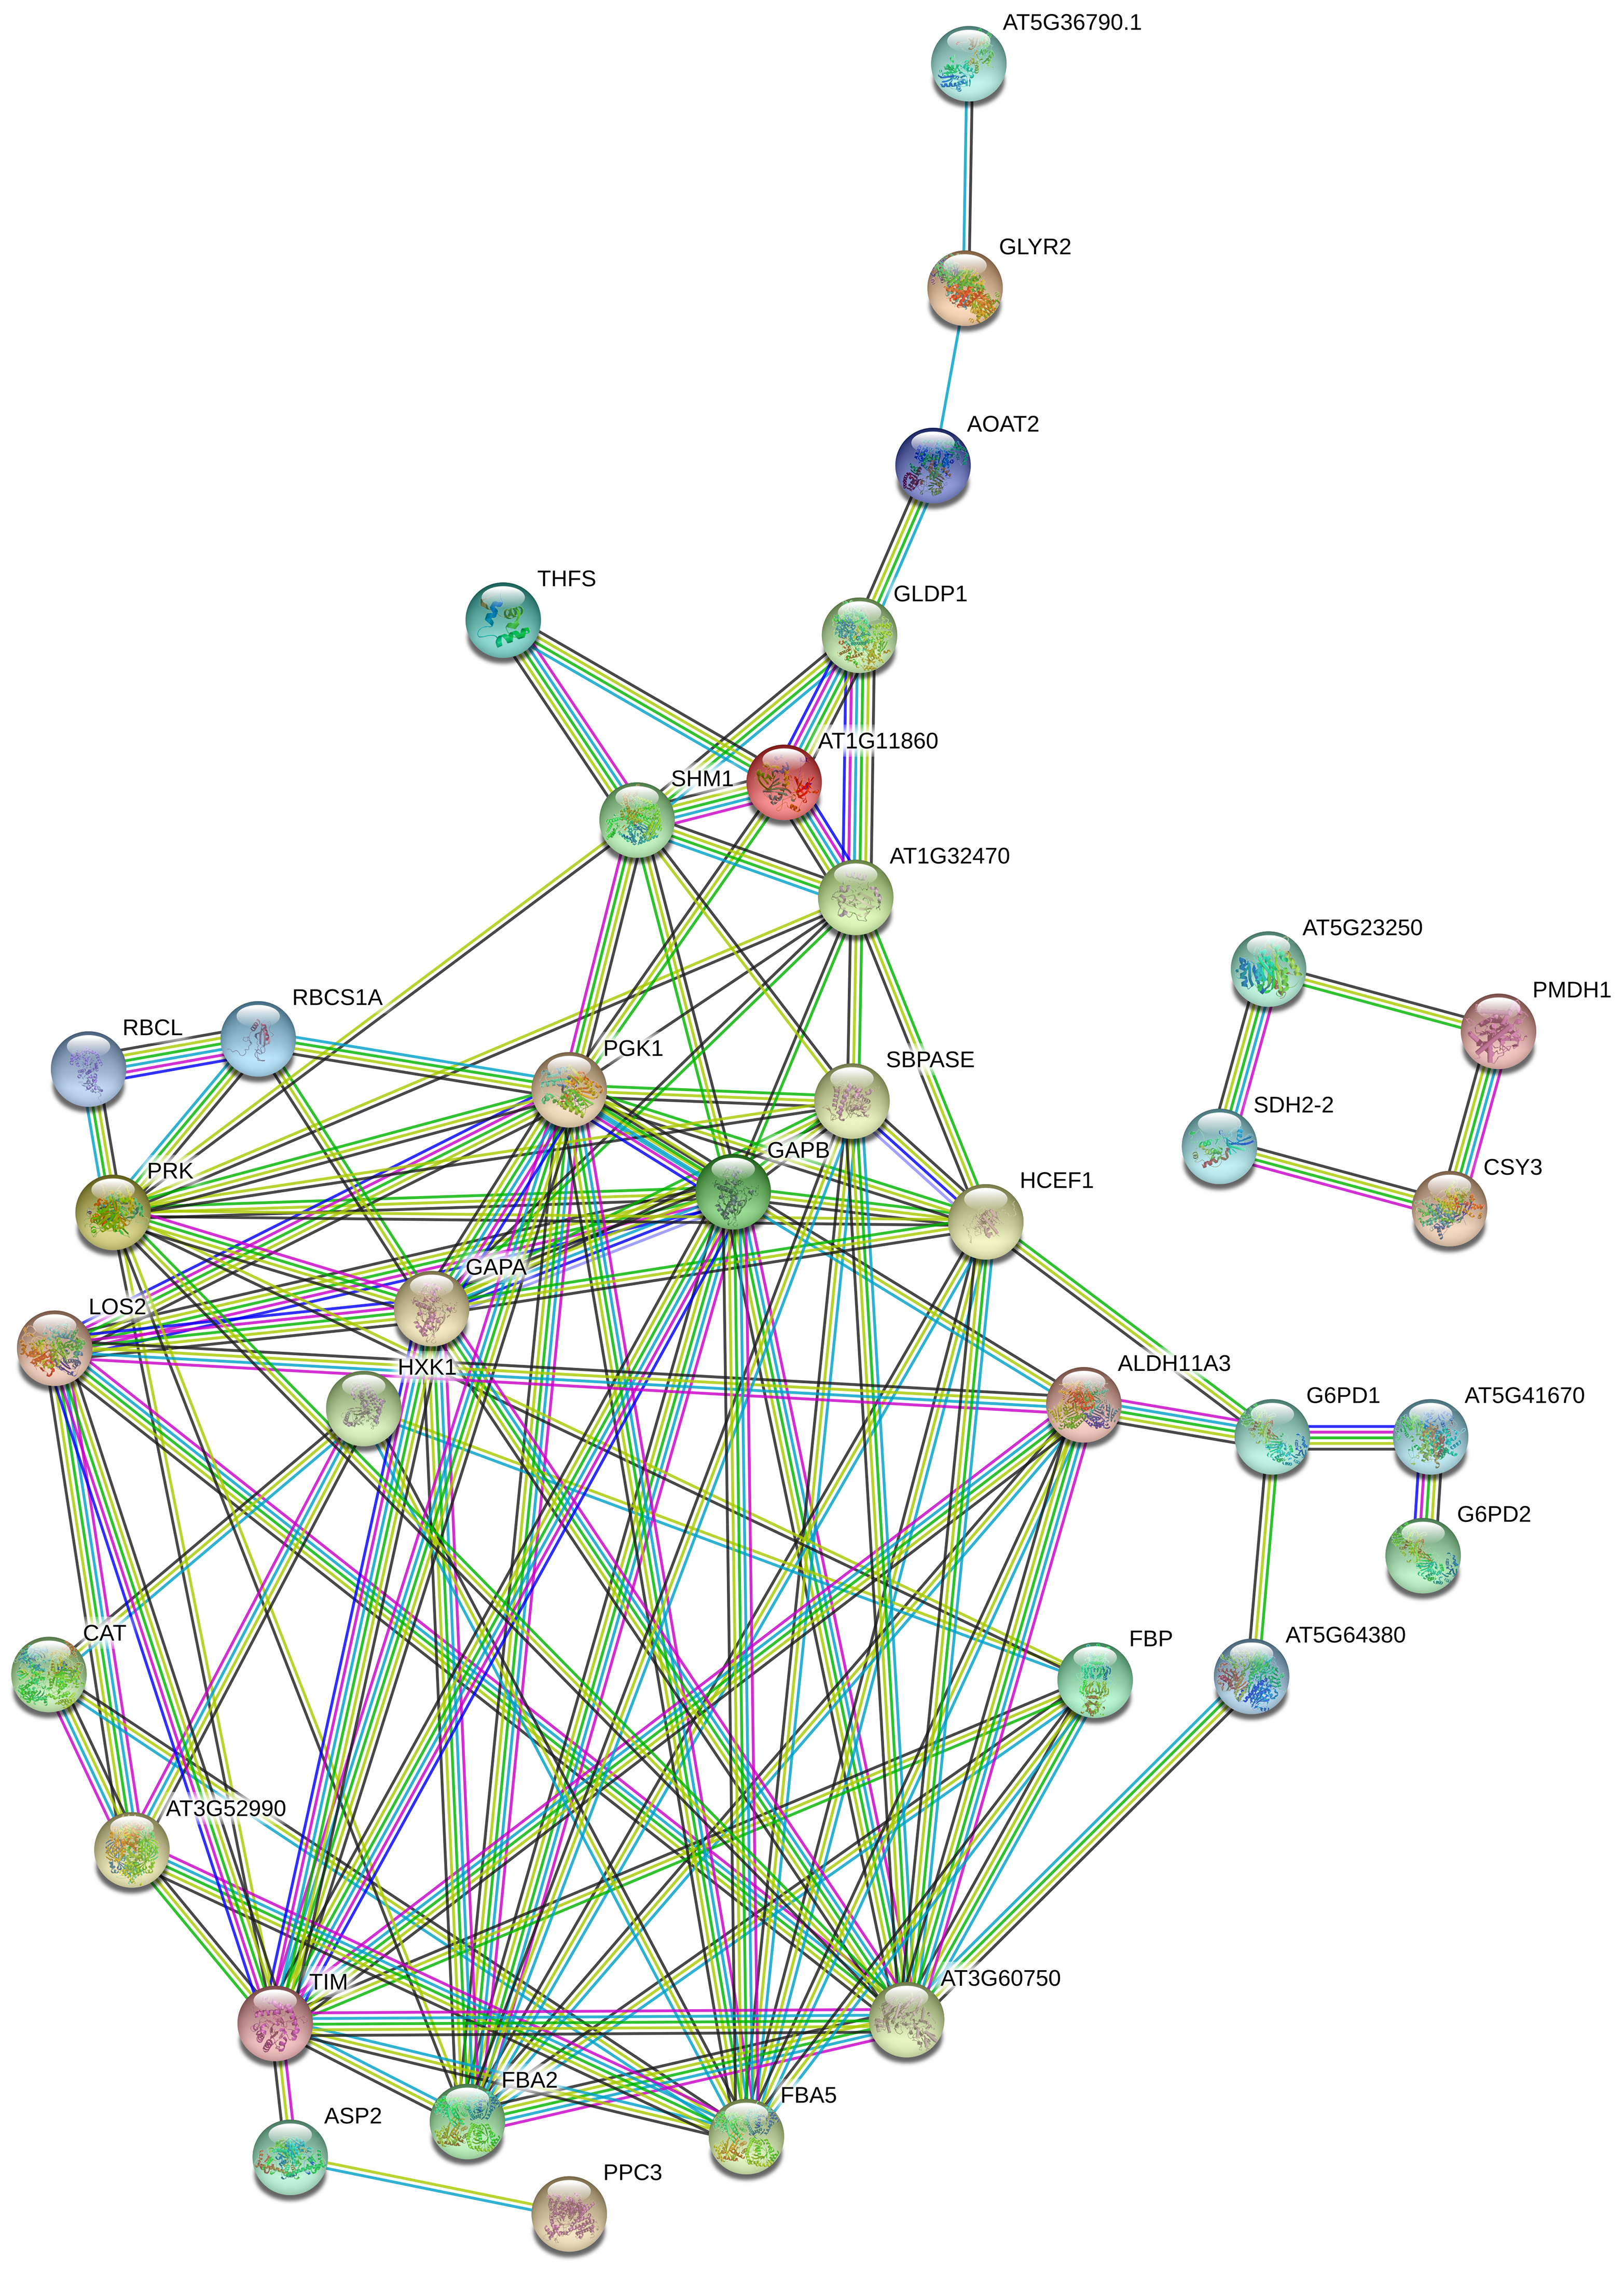
3.5. PPI Network Construction for DAPs Involved in Carbon Metabolism

To investigate the interactions among DAPs involved in carbon metabolism, DAPs predictively related with carbon metabolism were integrated with information from STRING database to construct a PPI network (Supplementary Table S2). The interaction network was predicted from 48 nodes proteins with the enrichment p-value < 1.0 × 10⁻¹⁶ at the highest confidence parameter level (Figure 4). Several proteins, including AT3G60750, FBA2 and 5, TIM, PRK, PGK1, GAPA, GAPB, and HCEF1, interacted with at least 10 protein species. These proteins could play critical roles for the alteration of carbon metabolism during leaf-age progression.

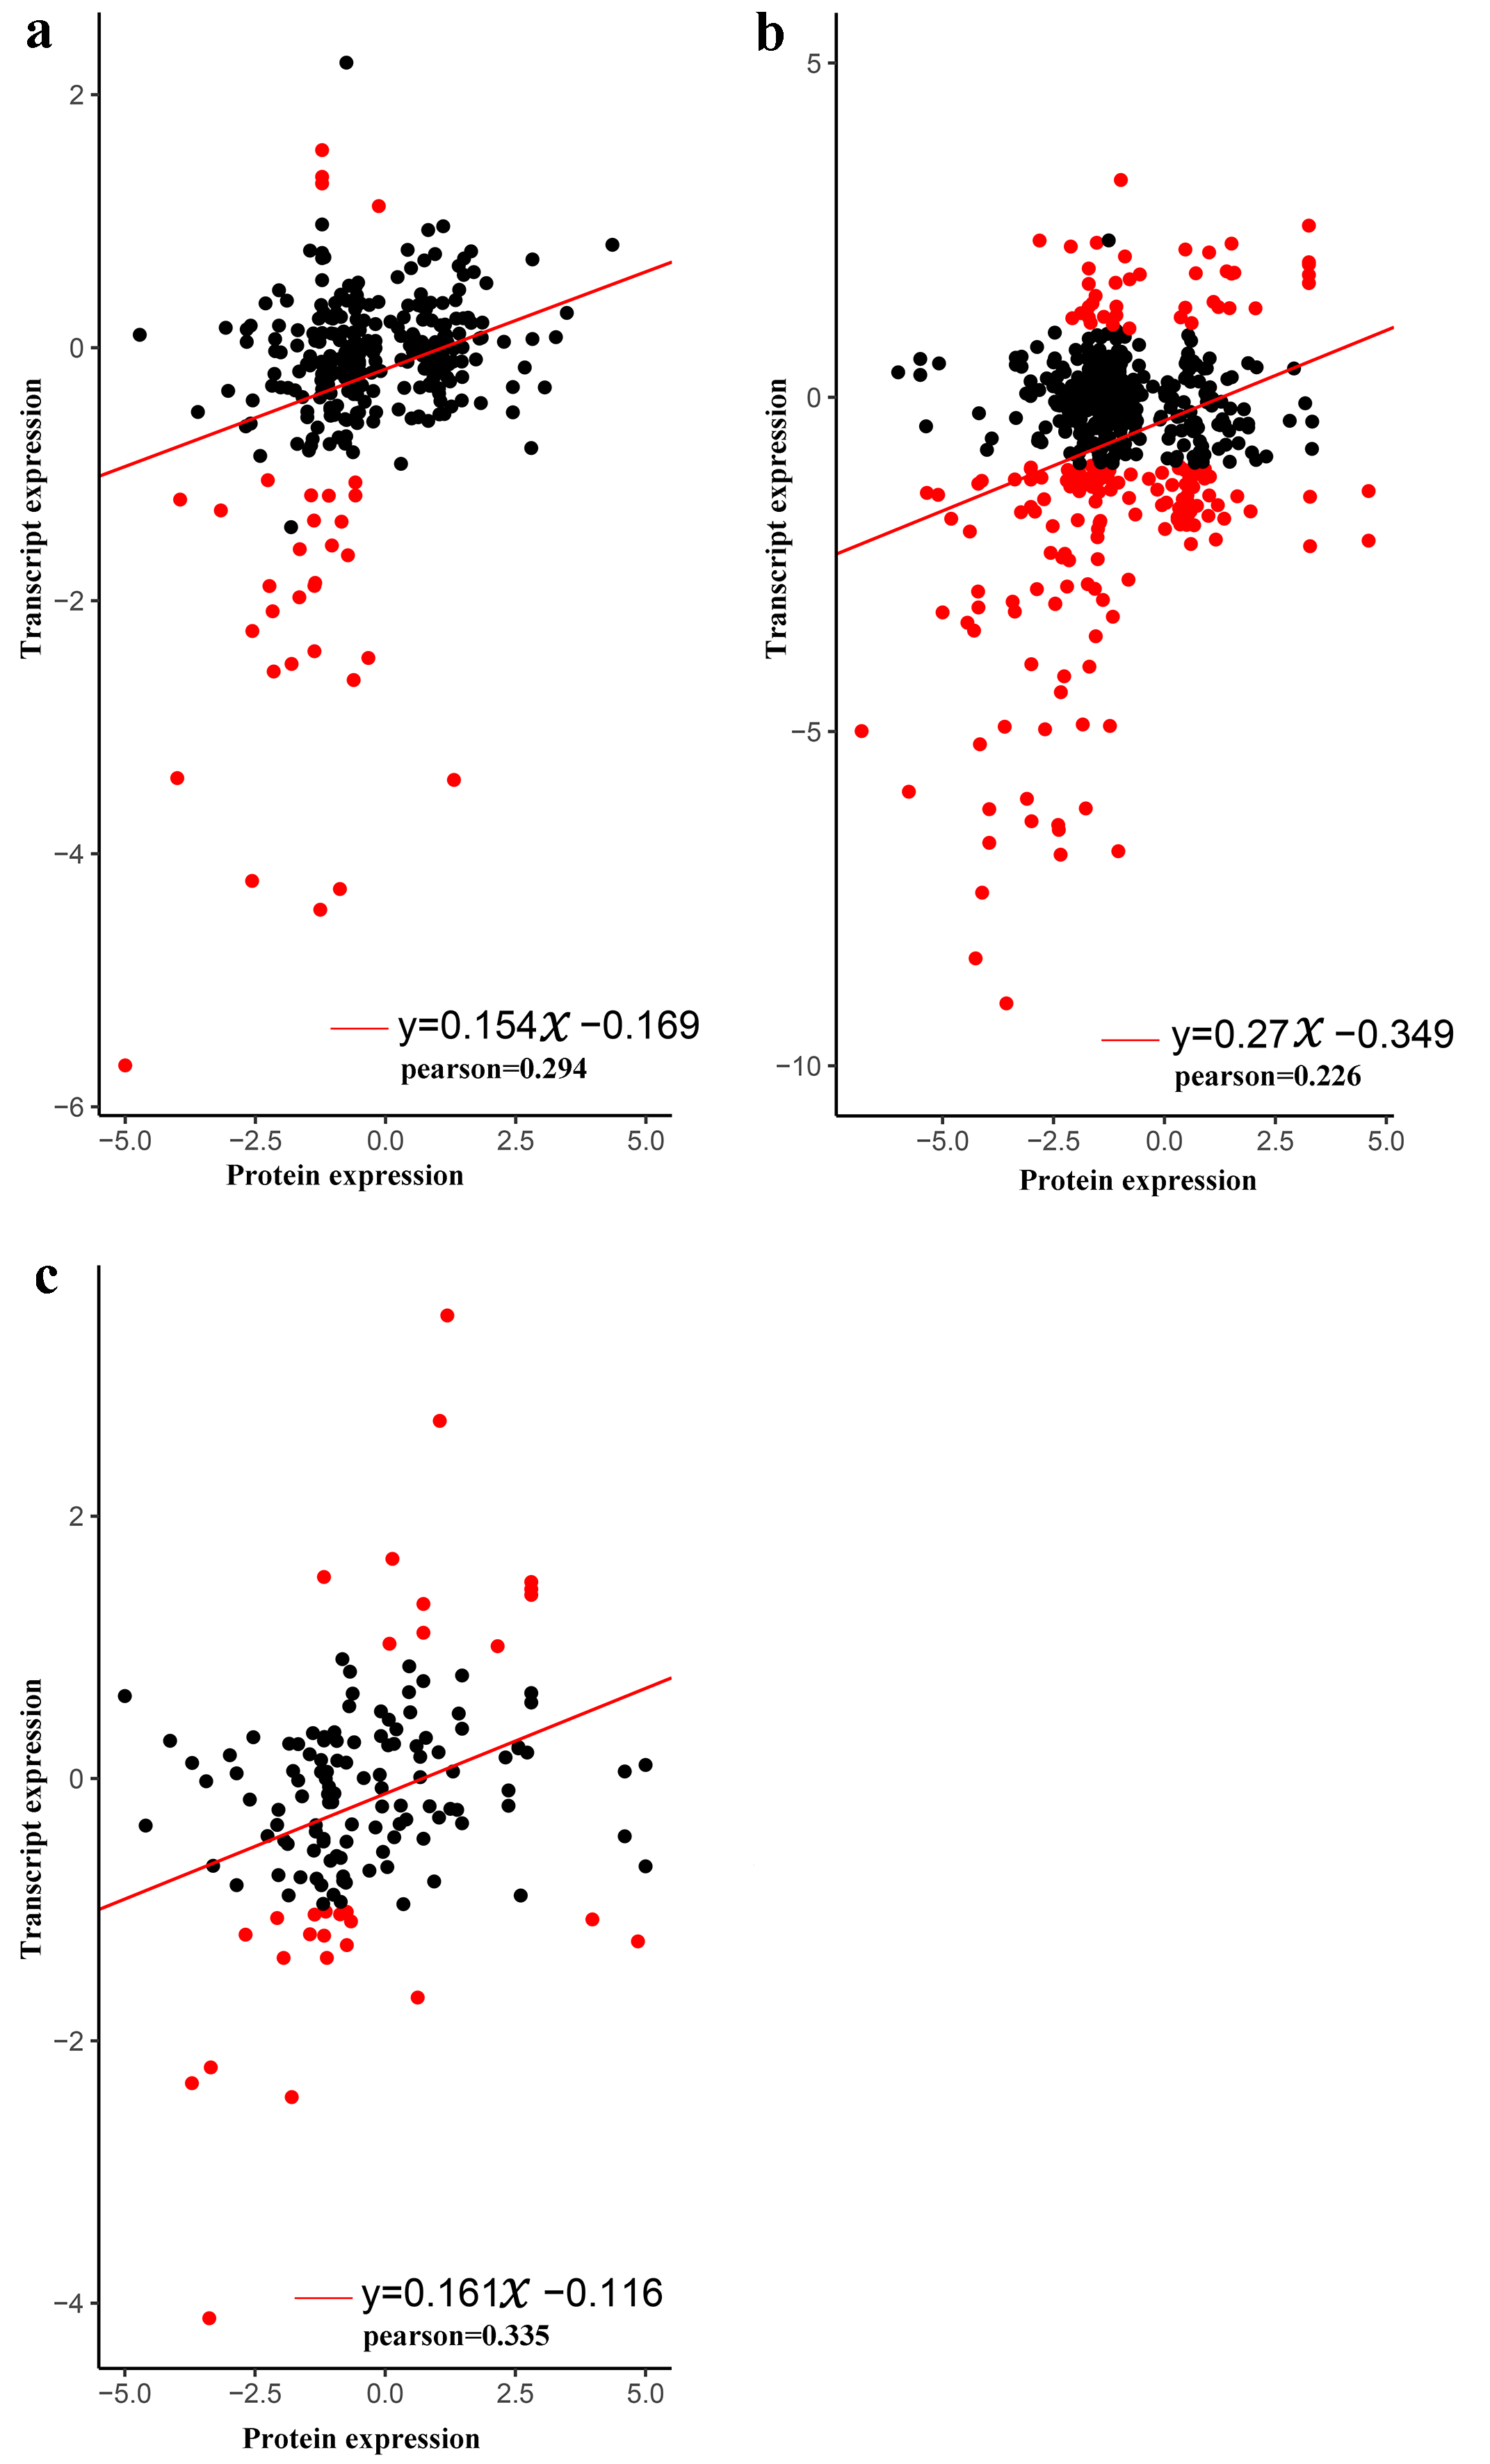
3.6. Transcriptome-Proteome Associated Analysis

In order to understand the association between protein and transcript abundance, the transcriptome data were obtained from the same leaf samples used to produce the proteome data, 29,967, 29,992, and 29,886 expressed genes were identified in FDR5, FDR10, and FDR25, respectively. We matched the identified DAPs with transcripts from the RNA-Seq data. A linear regression analysis revealed that the Pearson correlation coefficients in three comparisons were 0.294, 0.226 and 0.335, respectively (Figure 5), which indicated a poor correlation between the transcript and protein abundance profiles. As shown in Figure 5, the number of genes that simultaneously showed significant difference in protein and transcript levels was obviously lower than that of genes only displaying differential protein expression in all three comparisons. The results revealed that the changes at the transcript and protein levels did not display good consistency in triploid Populus. These findings implied the occurrence of posttranscriptional regulation during leaf-age progression.

4. Discussion

The unavailability of proteomics information during leaf-age progression prompted us to generate a protein accumulation dataset in triploid Populus. Label-free quantification proteomics was applied in the study, as there is no required labeling reagents and limit to samples in experiments [32]. Compared to most proteomics research in Populus [16,17,18], more proteins were identified in our study (Figure 1a). It could be due to the main advantages of label-free quantification, which can achieve higher proteome coverage as compared to the most widely used 2-DE in Populus proteome [1,16,17,18]. In label-free quantification, proteins were quantified by peptide peak intensity, which may be shared by two or more proteins. Therefore, the intensity information of each identified peptide is provided in Supplementary Table S3 for an interested audience.
The main biological function of a leaf is to perform photosynthesis which yields the carbonhydrates needed for plant growth. The leaf photosynthetic capacity is low in young leaves, increases as leaves mature, and declines as leaves senesce [33]. Developing leaves involve discernible increases in overall leaf thickness, mesophyll cell number and cell wall thickness [34,35,36,37,38], ultimately leading to a significant expansion of leaves in all dimensions and a measurable increase in leaf mass. In our study, DAPs involved in photosynthesis displayed higher abundance while DAPs involved in cell wall and lipid metabolism, tetrapyrrole synthesis, and nucleotide metabolism showed lower abundance in either FDR10 or FDR25 than FDR5 (Figure 3a,b). As a result, our proteomic analysis showed that FDR5 leaves were distinguishably younger than FDR10 and FDR25. Senescence is the final developmental step of a leaf, which is usually characterized by a decrease in chlorophyll content and photosynthesis [39]. The DAPs involved in photosynthesis displayed lower accumulation in FDR25 as compared to FDR10 (Figure 3c), consistent with the decrease of photosynthesis and chlorophyll reported by our previous study [25]. Additionally, the numbers of DAPs and significantly altered biological functional categories between FDR10 and FDR25 were the smallest among all comparisons, implying that FDR25 leaves were entering the early stages of aging (Figure 3c). Moreover, 22 DAPs involved in senescence phenomena were identified between FDR10 and FDR 25 (Supplementary Figure S2). Of these DAPs, E3 ubiquitin-protein ligase, whose transcript abundance increases during leaf aging in poplars [40], was only detected in FDR25; other 21 proteins, whose transcript expression decreases during aging [40], showed lower or no accumulation in FDR25 as compared to FDR10 (Supplementary Figure S2). These proteins could play important roles in early leaf senescence. In addition, several proteins involved in stress and protein degradation also exhibited noticeable differential accumulation in FDR25 compared to other two leaf ages (Supplementary Table S1), and these proteins may also have an important function in early leaf senescence.
The primary metabolism, especially carbon metabolism, was significantly enriched in the DAPs identified from all three comparisons (Table 1). The changes of leaf carbon metabolism have been shown to have critical effects on plant productivity [41]. At the same time, a number of ATPs are generated through the catabolism of carbohydrate. Here, 19 DAPs involved in photosynthesis, including 13 Calvin cycle related DAPs and 6 photorespiration related DAPs, were identified in this study (Supplementary Table S2). Photosynthesis incorporates CO2 into carbohydrates through Calvin cycle [42]. Photorespiration is a wasteful pathway that competes with the Calvin cycle, which results in loss of CO2. The balance of Calvin cycle and photorespiration is critical to plant vital activities [43]. The common up- and down-accumulation of related DAPs confirmed the coordination of Calvin cycle and photorespiration during leaf development in Populus triploids (Figure 3). TCA cycle is an important part of carbon catabolism, which produces CO2 and ATP via oxidation of energy-rich photosynthetic end-products [44]. Five involved proteins displayed differential abundance. Several DAPs involved in glycolysis and the pentose phosphate pathway were identified during leaf-age progression (Supplementary Table S2). Glycolysis is a catabolic process responsible for carbohydrate to produce ATPs [45]. The pentose phosphate pathway is an alternative route of carbon use, which produces the sugars making up DNA and RNA [46]. These results implied the coordination of carbon synthesis and catabolism during leaf-age progression, which could play significant roles in growth and development of triploid Populus.
Other metabolism pathways, including the biosynthesis of secondary metabolites, biosynthesis of amino acids, nitrogen metabolism, and fatty acid metabolism, changed significantly in all three comparisons of three leaf-age representative stages (Table 1). Secondary metabolites are usually used for plant defense and stress tolerance [47]. The significant enrichment of DAPs for biosynthesis of secondary metabolites implied the varying physical and chemical defense ability in leaves at different leaf-ages. Increased leaf amino acid and nitrogen supply play vital roles in increasing chlorophyll and Rubisco levels, photosynthetic nitrogen use efficiency, and carbon assimilation and transport to sinks [48]. Moreover, 17 biosynthesis of amino acids related DAPs and seven nitrogen metabolism related DAPs were identified through our analysis (Supplementary Table S1). It is known that fatty acids are present in the leaf cuticular layer, as well as various leaf cell and chloroplast membranes. An early study on the mesophytic green leaves and chloroplasts found that they are primarily characterized by a high concentration of non-conjugated octadecatrienoic acid [49]. In addition, the turnover of fatty acid can occur in the very early stage of leaf senescence [50], and nutrients are translocated to new sinks like younger leaves. In this study, 19 DAPs related to fatty acid metabolism were identified and most of them were declined during leaf-age progression (Figure 3, Supplementary Table S1). Our study suggests that leaf-age progression is accompanied by different metabolic changes, which could play vital roles in establishment of leaf structures and functions at early leaf developmental stages or breaking down leaf structures and functions at the senescence stage.
The poor correlation between transcriptome and proteome has been confirmed by a growing body of studies [51,52]. This uncoupling is assumed to reflect a relatively large number of post-transcriptional regulation and modifications, such as RNA secondary structure, siRNA and protein regulation, ribosomal density [53,54]. The low Pearson correlation coefficients between transcript and protein abundance verified the anticipated poor correlation between transcriptome and proteome during leaf-age progression in triploid Populus (Figure 5). The number of genes that simultaneously expressed DEG and DAP had a very small percentage (Figure 5), further implying that post-transcriptional regulation and modifications played a critical role during leaf-age progression in triploid Populus. Interestingly, the several genes having accumulated proteins in specific stage all showed expressed or unexpressed transcripts in all three stages (Supplementary Table S4). This phenomenon whereby proteins accumulated at a specific leaf-age needs further to be explored, which could contribute to the identification of factors involved in the final determination of protein abundance. The numerous discordant changes in mRNA and protein abundance were widespread in organisms, including Arabidopsis thaliana, Saccharomyces cerevisiae, and Populus. Thus, these proteome data provide a new perspective regarding transcriptome research in triploid Populus.

5. Conclusions

In conclusion, 1970, 1916, and 1850 proteins were detected in FDR5, FDR10, and FDR25, respectively. Comparative proteomic analysis revealed that FDR5, FDR10, and FDR25 represented three different age stages of leaves, namely young, mature, and primary senescence. Pathway enrichment analysis implied that carbon metabolism was critical for leaf-age progression. In addition, we explored the correlation between transcriptome and proteome and found inconsistent transcript and protein abundance. The poor correlation indicates the presence of a relatively large number of post-transcriptional regulation and modifications, which should be scrutinized in future studies. Our findings provide direct evidence at the protein level that could advance our understanding of the molecular networks of leaf-age progression in Populus triploids.

Supplementary Materials

The following are available online at https://www.mdpi.com/1999-4907/11/11/1154/s1, Figure S1: The illustration of Sampling, Figure S2: Accumulation patterns of DAPs involved in leaf senescence between FDR25 and FDR10, missing values are represented by white fields, Table S1: MapMan ontology annotation and enrichment analysis for DAPs, Table S2: Functional annotation for DAPs involved in carbon metabolism, Table S3: Preprocessed peptide intensities, Table S4: The expression (FPKM) patterns of transcripts corresponding to proteins accumulated specifically in each leaf age.

Author Contributions

Conceptualization, J.L. and X.K.; methodology, J.L. and Y.W.; formal analysis, J.L. and H.W.; investigation, J.L. and Y.W.; writing—original draft preparation, J.L. and H.W.; writing—review and editing, J.L. and X.K.; funding acquisition, X.K. All authors have read and agreed to the published version of the manuscript.

Funding

This work was supported by the National Natural Science Foundation of China (31530012).

Conflicts of Interest

The authors declare no conflict of interest. The funders had no role in the design of the study; in the collection, analyses, or interpretation of data; in the writing of the manuscript, or in the decision to publish the results.

References

  1. Szymanski, J.; Levin, Y.; Savidor, A.; Breitel, D.; Chappell-Maor, L.; Heinig, U.; Topfer, N.; Aharoni, A. Label-free deep shotgun proteomics reveals protein dynamics during tomato fruit tissues development. Plant J. 2017, 90, 396–417. [Google Scholar] [CrossRef]
  2. Jensen, O.N. Modification-specific proteomics: Characterization of post-translational modifications by mass spectrometry. Curr. Opin. Chem. Biol. 2004, 8, 33–41. [Google Scholar] [CrossRef]
  3. Kaufmann, K.; Smaczniak, C.; de Vries, S.; Angenent, G.C.; Karlova, R. Proteomics insights into plant signaling and development. Proteomics 2011, 11, 744–755. [Google Scholar] [CrossRef] [PubMed]
  4. Hossain, Z.; Nouri, M.Z.; Komatsu, S. Plant cell organelle proteomics in response to abiotic stress. J. Proteome Res. 2012, 11, 37–48. [Google Scholar] [CrossRef] [PubMed]
  5. Pflieger, D.; Bigeard, J.; Hirt, H. Isolation and characterization of plant protein complexes by mass spectrometry. Proteomics 2011, 11, 1824–1833. [Google Scholar] [CrossRef] [PubMed]
  6. Liu, Y.; Lu, S.; Liu, K.; Wang, S.; Huang, L.; Guo, L. Proteomics: A powerful tool to study plant responses to biotic stress. Plant Methods 2019, 15, 135. [Google Scholar] [CrossRef] [PubMed]
  7. Zhang, H.; Han, B.; Wang, T.; Chen, S.; Li, H.; Zhang, Y.; Dai, S. Mechanisms of plant salt response: Insights from proteomics. J. Proteome Res. 2012, 11, 49–67. [Google Scholar] [CrossRef] [PubMed]
  8. Mitprasat, M.; Roytrakul, S.; Jiemsup, S.; Boonseng, O.; Yokthongwattana, K. Leaf proteomic analysis in cassava (Manihot esculenta, Crantz) during plant development, from planting of stem cutting to storage root formation. Planta 2011, 233, 1209–1221. [Google Scholar] [CrossRef]
  9. Liang, C.; Tian, J.; Liao, H. Proteomics dissection of plant responses to mineral nutrient deficiency. Proteomics 2013, 13, 624–636. [Google Scholar] [CrossRef]
  10. Soltis, D.E.; Misra, B.B.; Shan, S.; Chen, S.; Soltis, P.S. Polyploidy and the proteome. Biochim. Biophys. Acta 2016, 1864, 896–907. [Google Scholar] [CrossRef] [Green Version]
  11. Jansson, S.; Douglas, C.J. Populus: A model system for plant biology. Annu. Rev. Plant Biol. 2007, 58, 435–458. [Google Scholar] [CrossRef] [PubMed]
  12. Plomion, C.; Lalanne, C.; Claverol, S.; Meddour, H.; Kohler, A.; Bogeat-Triboulot, M.B.; Barre, A.; Le Provost, G.; Dumazet, H.; Jacob, D.; et al. Mapping the proteome of poplar and application to the discovery of drought-stress responsive proteins. Proteomics 2006, 6, 6509–6527. [Google Scholar] [CrossRef] [PubMed]
  13. Kalluri, U.C.; Hurst, G.B.; Lankford, P.K.; Ranjan, P.; Pelletier, D.A. Shotgun proteome profile of Populus developing xylem. Proteomics 2009, 9, 4871–4880. [Google Scholar] [CrossRef] [PubMed]
  14. Hurst, G.; Yang, X.H.; Tschaplinski, T.; Tuskan, G.; Lankford, P.; Shah, M.; Jawdy, S.; Gunter, L.; Engle, N. Proteomics of Leaf Tissues from Populus. Proteom. 2010, 3, 4. [Google Scholar]
  15. Liu, J.; Hai, G.; Wang, C.; Cao, S.; Xu, W.; Jia, Z.; Yang, C.; Wang, J.P.; Dai, S.; Cheng, Y. Comparative proteomic analysis of Populus trichocarpa early stem from primary to secondary growth. J. Proteom. 2015, 126, 94–108. [Google Scholar] [CrossRef]
  16. Wang, L.; Zhang, X.; Zhang, J.; Fan, W.; Lu, M.; Hu, J. Proteomic Analysis and Identification of Possible Allergenic Proteins in Mature Pollen of Populus tomentosa. Int. J. Mol. Sci. 2018, 19, 250. [Google Scholar] [CrossRef] [Green Version]
  17. Leijon, F.; Melzer, M.; Zhou, Q.; Srivastava, V.; Bulone, V. Proteomic Analysis of Plasmodesmata From Populus Cell Suspension Cultures in Relation With Callose Biosynthesis. Front. Plant Sci. 2018, 9, 1681. [Google Scholar] [CrossRef]
  18. Bonhomme, L.; Monclus, R.; Vincent, D.; Carpin, S.; Lomenech, A.M.; Plomion, C.; Brignolas, F.; Morabito, D. Leaf proteome analysis of eight Populus x euramericana genotypes: Genetic variation in drought response and in water-use efficiency involves photosynthesis-related proteins. Proteomics 2009, 9, 4121–4142. [Google Scholar] [CrossRef]
  19. Zhang, Y.; Feng, L.; Jiang, H.; Zhang, Y.; Zhang, S. Different Proteome Profiles between Male and Female Populus cathayana Exposed to UV-B Radiation. Front. Plant Sci. 2017, 8, 320. [Google Scholar] [CrossRef] [PubMed] [Green Version]
  20. Zhang, S.; Chen, F.; Peng, S.; Ma, W.; Korpelainen, H.; Li, C. Comparative physiological, ultrastructural and proteomic analyses reveal sexual differences in the responses of Populus cathayana under drought stress. Proteomics 2010, 10, 2661–2677. [Google Scholar] [CrossRef]
  21. Zhang, S.; Feng, L.; Jiang, H.; Ma, W.; Korpelainen, H.; Li, C. Biochemical and proteomic analyses reveal that Populus cathayana males and females have different metabolic activities under chilling stress. J. Proteome Res. 2012, 11, 5815–5826. [Google Scholar] [CrossRef] [PubMed]
  22. Zhang, P.; Wu, F.; Kang, X. Genetic control of fiber properties and growth in triploid hybrid clones of Populus tomentosa. Scand. J. Forest Res. 2013, 28, 621–630. [Google Scholar] [CrossRef]
  23. Liao, T.; Cheng, S.; Zhu, X.; Min, Y.; Kang, X. Effects of triploid status on growth, photosynthesis, and leaf area in Populus. Trees 2016, 30, 1137–1147. [Google Scholar] [CrossRef]
  24. Wang, Y.; Li, Y.; Suo, Y.; Min, Y.; Kang, X. Proteomic Changes Between Populus Allotriploids and Diploids Revealed Using an iTRAQ-based Quantitative Approach. Curr. Proteom. 2017, 14, 166–174. [Google Scholar] [CrossRef] [PubMed] [Green Version]
  25. Du, K.; Liao, T.; Ren, Y.; Geng, X.; Kang, X. Molecular Mechanism of Vegetative Growth Advantage in Allotriploid Populus. Int. J. Mol. Sci. 2020, 21, 441. [Google Scholar] [CrossRef] [Green Version]
  26. Bradford, M.M. A rapid and sensitive method for the quantitation of microgram quantities of protein utilizing the principle of protein-dye binding. Anal. Biochem. 1976, 72, 248–254. [Google Scholar] [CrossRef]
  27. Tyanova, S.; Temu, T.; Cox, J. The MaxQuant computational platform for mass spectrometry-based shotgun proteomics. Nat. Protoc. 2016, 11, 2301–2319. [Google Scholar] [CrossRef]
  28. Tyanova, S.; Temu, T.; Sinitcyn, P.; Carlson, A.; Hein, M.Y.; Geiger, T.; Mann, M.; Cox, J. The Perseus computational platform for comprehensive analysis of (prote) omics data. Nat. Methods 2016, 13, 731–740. [Google Scholar] [CrossRef]
  29. Usadel, B.; Nagel, A.; Thimm, O.; Redestig, H.; Blaesing, O.E.; Palacios-Rojas, N.; Selbig, J.; Hannemann, J.; Piques, M.C.; Steinhauser, D.; et al. Extension of the visualization tool MapMan to allow statistical analysis of arrays, display of corresponding genes, and comparison with known responses. Plant Physiol. 2005, 138, 1195–1204. [Google Scholar] [CrossRef] [Green Version]
  30. Wang, K.; Singh, D.; Zeng, Z.; Coleman, S.J.; Huang, Y.; Savich, G.L.; He, X.; Mieczkowski, P.; Grimm, S.A.; Perou, C.M.; et al. MapSplice: Accurate mapping of RNA-seq reads for splice junction discovery. Nucleic Acids Res. 2010, 38, e178. [Google Scholar] [CrossRef] [Green Version]
  31. Wang, L.; Feng, Z.; Wang, X.; Wang, X.; Zhang, X. DEGseq: An R package for identifying differentially expressed genes from RNA-seq data. Bioinformatics 2010, 26, 136–138. [Google Scholar] [CrossRef]
  32. Shalit, T.; Elinger, D.; Savidor, A.; Gabashvili, A.; Levin, Y. MS1-based label-free proteomics using a quadrupole orbitrap mass spectrometer. J. Proteome Res. 2015, 14, 1979–1986. [Google Scholar] [CrossRef] [PubMed]
  33. Wilson, K.B.; Hanson, P.J.; Baldocchi, D.D. Spatial and seasonal variability of photosynthetic parameters and their relationship to leaf nitrogen in a deciduous forest. Tree Physiol. 2000, 20, 565–578. [Google Scholar] [CrossRef] [Green Version]
  34. Hanba, Y.T.; Miyazawa, S.-I.; Kogami, H.; Terashima, I. Effects of leaf age on internal CO2 transfer conductance and photosynthesis in tree species having different types of shoot phenology. Funct. Plant Biol. 2001, 28, 1075. [Google Scholar] [CrossRef]
  35. Shin-Ichi, M.; Shigenari, S.; Ichiro, T. Slow leaf development of evergreen broad-leaved tree species in Japanese warm temperate forests. Ann. Bot. 1998, 6, 859–869. [Google Scholar]
  36. Miyazawa, S.I.; Terashima, I. Slow development of leaf photosynthesis in an evergreen broad-leaved tree, castanopsis sieboldii: Relationships between leaf anatomical characteristics and photosynthetic rate. Plant Cell Environ. 2010, 24, 279–291. [Google Scholar] [CrossRef]
  37. Niinemets, Ü.; García-Plazaola, J.I.; Tosens, T.; Flexas, J.; Loreto, F.; Medrano, H. Photosynthesis during leaf development and ageing. In Terrestrial Photosynthesis in a Changing Environment; Cambridge University Press: Cambridge, UK, 2012; pp. 353–372. [Google Scholar]
  38. Tosens, T.; Niinemets, U.; Vislap, V.; Eichelmann, H.; Castro Diez, P. Developmental changes in mesophyll diffusion conductance and photosynthetic capacity under different light and water availabilities in Populus tremula: How structure constrains function. Plant Cell Environ. 2012, 35, 839–856. [Google Scholar] [CrossRef]
  39. Lim, P.O.; Kim, H.J.; GilNam, H. Leaf senescence. Annu. Rev. Plant Biol. 2007, 58, 115–136. [Google Scholar] [CrossRef] [PubMed] [Green Version]
  40. Li, Z.; Zhang, Y.; Zou, D.; Zhao, Y.; Wang, Y.; Zhang, Y.; Xia, X.; Luo, J.; Guo, H.; Zhang, Z. LSD 3.0: A comprehensive resource for the leaf senescence research community. Nucleic Acids Res. 2020, 48, D1069–D1075. [Google Scholar] [CrossRef]
  41. Cho, M.-H.; Park, H.L.; Hahn, T.-R. Engineering leaf carbon metabolism to improve plant productivity. Plant Biotechnol. Rep. 2014, 9, 1–10. [Google Scholar] [CrossRef]
  42. Ebenhoh, O.; Spelberg, S. The importance of the photosynthetic Gibbs effect in the elucidation of the Calvin-Benson-Bassham cycle. Biochem. Soc. Trans. 2018, 46, 131–140. [Google Scholar] [CrossRef] [Green Version]
  43. Hagemann, M.; Bauwe, H. Photorespiration and the potential to improve photosynthesis. Curr. Opin. Chem. Biol. 2016, 35, 109–116. [Google Scholar] [CrossRef] [PubMed]
  44. Zhang, Y.; Fernie, A.R. On the role of the tricarboxylic acid cycle in plant productivity. J. Integr. Plant Biol. 2018, 60, 1199–1216. [Google Scholar] [CrossRef] [PubMed]
  45. Fernie, A.R.; Carrari, F.; Sweetlove, L.J. Respiratory metabolism: Glycolysis, the TCA cycle and mitochondrial electron transport. Curr. Opin. Plant Biol. 2004, 7, 254–261. [Google Scholar] [CrossRef] [PubMed]
  46. Andriotis, V.M.E.; Smith, A.M. The plastidial pentose phosphate pathway is essential for postglobular embryo development in Arabidopsis. Proc. Natl Acad. Sci. USA 2019, 116, 15297–15306. [Google Scholar] [CrossRef] [PubMed] [Green Version]
  47. Khare, S.; Singh, N.B.; Singh, A.; Hussain, I.; Amist, N. Plant secondary metabolites synthesis and their regulations under biotic and abiotic constraints. J. Plant Biol. 2020, 63, 203–216. [Google Scholar] [CrossRef]
  48. Perchlik, M.; Tegeder, M. Leaf amino acid supply affects photosynthetic and plant nitrogen use efficiency under nitrogen stress. Plant Physiol. 2018, 178, 174–188. [Google Scholar] [CrossRef] [Green Version]
  49. Mary, C.W. Fatty acids in chloroplasts and leaves. J. Exp. Bot. 1958, 9, 254–261. [Google Scholar]
  50. Yang, Z.; Ohlrogge, J.B. Turnover of fatty acids during natural senescence of Arabidopsis, brachypodium, and switchgrass and in Arabidopsis β-oxidation mutants. Plant Physiol. 2009, 150, 1981–1989. [Google Scholar] [CrossRef] [Green Version]
  51. Griffin, T.J.; Gygi, S.P.; Ideker, T.; Rist, B.; Eng, J.; Hood, L.; Aebersold, R. Complementary profiling of gene expression at the transcriptome and proteome levels in Saccharomyces cerevisiae. Mol. Cell Proteom. 2002, 1, 323–333. [Google Scholar] [CrossRef] [Green Version]
  52. Lan, P.; Li, W.; Schmidt, W. Complementary proteome and transcriptome profiling in phosphate-deficient Arabidopsis roots reveals multiple levels of gene regulation. Mol. Cell Proteom. 2012, 11, 1156–1166. [Google Scholar] [CrossRef] [PubMed] [Green Version]
  53. Gygi, S.P.; Rochon, Y.; Franza, B.R.; Aebersold, R. Correlation between protein and mRNA abundance in yeast. Mol. Cell Biol. 1999, 19, 1720–1730. [Google Scholar] [CrossRef] [PubMed] [Green Version]
  54. Hajduch, M.; Hearne, L.B.; Miernyk, J.A.; Casteel, J.E.; Joshi, T.; Agrawal, G.K.; Song, Z.; Zhou, M.; Xu, D.; Thelen, J.J. Systems analysis of seed filling in Arabidopsis: Using general linear modeling to assess concordance of transcript and protein expression. Plant Physiol. 2010, 152, 2078–2087. [Google Scholar] [CrossRef] [PubMed] [Green Version]
Figure 1. Overview of proteome during leaf-age progression of Populus triploids. (a) Venn diagram of proteins identified from three leaf ages; the number of specific and overlapped proteins were given. FDR5, FDR10 and FDR25 represented the 5th, 10th and 25th leaves from stem apices, respectively. (b) The clusters of colocalized proteins via principal component analysis. The abundance of each protein identified from each sample was used for the principal component analysis; (c) Venn diagram of differentially accumulated proteins (DAPs) identified from three comparisons. The number of specific and overlapped DAPs were given. (d) Bar chart of up- and down-accumulated DAPs. Red and green in FDR10/5, FDR25/5 and FDR25/10 up- and down-accumulated proteins in FDR10 compared to FDR5, FDR25 compared to FDR5, and FDR25 compared to FDR10, respectively. The numbers for up- and down-accumulated DAPs were shown above each bar.
Forests 11 01154 g001
Figure 2. Enriched biological processes of differentially accumulated proteins (DAPs). Red and white backgrounds represented the enrichment and non-enrichment of ManMan ontology, respectively. The figures represented the level of significance of enrichment of MapMan ontology term by −log10 FDR, where larger number indicated more significant enrichment. PS, Photosynthesis; CHO, Carbohydrate; OPP, Pentose phosphate pathway; TCA, Tricarboxylic acid.
Forests 11 01154 g002
Figure 3. Accumulation patterns of DAPs involved in various metabolic pathways. The DAPs were grouped into functional categories related to primary metabolism and MapMan software was used to visualize changes in abundance. The fold-change of each DAP was represented by square and color. Red and green indicated increase and decrease, respectively. (a) DAPs identified from FDR10 versus FDR5 comparison; (b) DAPs identified from FDR25 versus FDR5 comparison; (c) DAPs identified from FDR25 versus FDR10 comparison.
Forests 11 01154 g003aForests 11 01154 g003b
Figure 4. Interaction networks of DAPs involved in carbon metabolism. For protein-protein interaction, the experimental evidence was represented by purple lines; Gene neighborhood was represented by green lines, while gene co-occurrence database evidence was represented by blue lines; text mining evidence was represented by yellow lines; and co-expression evidence was represented by black lines. The annotation of each protein in the figure was provided in Table S2.
Forests 11 01154 g004
Figure 5. The correlation analysis of transcriptome and proteome for genes displaying protein accumulation difference. Red dots represented genes that simultaneously showed significant difference in protein and transcript levels, black dots represented genes that only displayed differential expression in protein levels. (a) The correlation analysis of transcriptome and proteome for comparison between FDR5 and FDR10. (b) The correlation analysis of transcriptome and proteome for comparison between FDR5 and FDR25. (c) The correlation analysis of transcriptome and proteome for comparison between FDR10 and FDR25.
Forests 11 01154 g005
Table 1. Kyoto Encyclopedia of Genes and Genomes (KEGG) pathway enrichment analysis of DAPs.
Pathway IDPathway DescriptionFalse Discovery Rate
FDR10/5FDR25/5FDR25/5
pop01200Carbon metabolism3.04 × 10−284.63 × 10−362.97 × 10⁻⁵
pop00630Glyoxylate and dicarboxylate metabolism2.93 × 10−264 × 10−226.62 × 10⁻⁵
pop01100Metabolic pathways2.93 × 10−264.2 × 10−422.58 × 10⁻¹⁶
pop01110Biosynthesis of secondary metabolites4.45 × 10−202.52 × 10−240.000001
pop00710Carbon fixation in photosynthetic organisms1.24 × 10−181.96 × 10⁻²¹
pop00010Glycolysis/Gluconeogenesis1.58 × 10−116.89 × 10⁻¹¹
pop00260Glycine, serine and threonine metabolism2.4 × 10−117.06 × 10⁻⁶
pop03010Ribosome2.09 × 10−104.07 × 10−87
pop00030Pentose phosphate pathway1.54 × 10−71.22 × 10⁻⁹
pop01230Biosynthesis of amino acids4.01 × 1071.57 × 10−120.00037
pop00500Starch and sucrose metabolism5.42 × 10−71.72 × 10⁻⁷
pop00520Amino sugar and nucleotide sugar metabolism1.61 × 10−60.00061
pop00051Fructose and mannose metabolism2.84 × 10−60.00012
pop00910Nitrogen metabolism2.15 × 10−54.37 × 10−50.0064
pop00620Pyruvate metabolism2.99 × 10−57.06 × 10⁻⁶
pop00250Alanine, aspartate and glutamate metabolism7.57 × 10−50.000180.012
pop00052Galactose metabolism0.000210.00043
pop00220Arginine biosynthesis0.000270.000330.00048
pop00670One carbon pool by folate0.000290.00019
pop00230Purine metabolism0.000530.028
pop00480Glutathione metabolism0.000640.00062
pop00460Cyanoamino acid metabolism0.000880.0013
pop04146Peroxisome0.0021 0.042
pop03050Proteasome0.00330.00026
pop00280Valine, leucine and isoleucine degradation0.00710.0292
pop00020Citrate cycle (TCA cycle)0.01041.13 × 10−50.0161
pop01040Biosynthesis of unsaturated fatty acids0.01080.0056
pop00240Pyrimidine metabolism0.0151
pop00062Fatty acid elongation0.0187
pop00190Oxidative phosphorylation0.01873.12 × 10−70.0023
pop01212Fatty acid metabolism0.01870.000260.0206
pop04144Endocytosis0.02020.00081
pop00053Ascorbate and aldarate metabolism0.025
pop00380Tryptophan metabolism0.0276
pop00780Biotin metabolism 0.00025
pop012102-Oxocarboxylic acid metabolism 0.000360.0161
pop00195Photosynthesis 0.0025
pop00071Fatty acid degradation 0.0035
pop00061Fatty acid biosynthesis 0.0041
pop00970Aminoacyl-tRNA biosynthesis 0.00770.00013
pop00040Pentose and glucuronate interconversions 0.009
pop00450Selenocompound metabolism 0.01010.00096
pop00270Cysteine and methionine metabolism 0.01090.0152
pop00350Tyrosine metabolism 0.0121
pop00130Ubiquinone and other terpenoid-quinone biosynthesis 0.0157
pop00660C5-Branched dibasic acid metabolism 0.0175
pop00730Thiamine metabolism 0.0239
pop00400Phenylalanine, tyrosine and tryptophan biosynthesis 0.034
pop04145Phagosome 0.0368
pop00740Riboflavin metabolism 0.0161
pop00940Phenylpropanoid biosynthesis 0.0161
pop04070Phosphatidylinositol signaling system 0.0161
pop00562Inositol phosphate metabolism 0.0167
pop00591Linoleic acid metabolism 0.0206
pop00920Sulfur metabolism 0.0444
Publisher’s Note: MDPI stays neutral with regard to jurisdictional claims in published maps and institutional affiliations.

