Article

Monuments Unveiled: Genetic Characterization of Large Old Chestnut (Castanea sativa Mill.) Trees Using Comparative Nuclear and Chloroplast DNA Analysis

1
Istituto di Ricerca sugli Ecosistemi Terrestri-Consiglio Nazionale delle Ricerche, 05010 Porano, Italy
2
Dipartimento di Scienze Agrarie, Alimentari e Forestali, Università degli Studi di Palermo, 90121 Palermo, Italy
3
Dipartimento di Scienze Agrarie e Forestali, Università degli Studi della Tuscia, 01100 Viterbo, Italy
*
Author to whom correspondence should be addressed.
Forests 2020, 11(10), 1118; https://doi.org/10.3390/f11101118
Submission received: 28 September 2020 / Revised: 15 October 2020 / Accepted: 19 October 2020 / Published: 21 October 2020
(This article belongs to the Special Issue Genetic Diversity and Conservation of Forest Tree Species)

Abstract

:
Large old trees are extraordinary organisms. They not only represent a historical, landscape and environmental heritage of inestimable value, but they also witness a long history of environmental changes and human interventions, and constitute an as yet poorly known reserve of genetic variability which can be considered a great resource for management programs of forest species. This is the first genetic study on Italian, large, old chestnut trees (Castanea sativa Mill.). Ninety-nine trees were surveyed and analysed. For each tree, more than one sample from canopy and root suckers was collected to test for the genetic integrity of the individuals. All samples were genotyped using nine nuclear microsatellite markers (nSSRs) and 106 unique genetic profiles were identified. A Bayesian analysis performed with the software STRUCTURE revealed the occurrence of two main gene pools and unveiled the genetic relationships existing among the genotyped individuals, and with the natural chestnut populations living in proximity. A phylogeographic structure of the plastid diversity was also obtained by the use of DNA sequence variation at two marker regions, revealing different origins and probable connections of the old trees with different glacial refugia. Our results contribute to an improved evaluation of the European chestnut genetic resources and provide useful insights into the species’ history and domestication in Italy. The importance of carefully targeted conservation strategies for these invaluable organisms is reaffirmed.

1. Introduction

Forests play a key ecological role in a myriad of flora and fauna terrestrial communities, representing a significant resource of biodiversity in terms of species and habitats, and providing a long list of ecosystem, socio-economic, and cultural services [1]. Nonetheless, forests are today exposed to high levels of extinction threat and require special conservation efforts [2,3]. It is well known that the potential response of forest ecosystems to track climate change and environmental disturbance is driven by the genetic diversity of trees [4,5]. Thus, genetic variability assessment should support ecophysiological characterization studies to identify endangered populations and species, to evaluate adaptive potential, and to define management strategies for their future conservation [6,7].
In this context, large old trees are keystone ecological components and habitat to a large variety of organisms, thereby contributing to maintain high levels of forest biodiversity and resilience [8,9]. Recovering, preserving and studying these extraordinary individuals is important not only for the sense of beauty, wonder and memories they convey (i.e., a concept of “monumentality”), or for their well-known historical, cultural, and social values [10], but also because they feature and drive stand structure, function and evolution across forest biomes [1,11]. In addition, they represent a valuable and unique source of genetic diversity, which can testify distant evolutionary prints, peculiar abilities to cope with environmental changes and/or advantageous productivity traits [9,12,13]. Besides consolidating the territorial identity and collective well-being of local communities, large old trees are often located in less impacted areas, or forest patches, within the otherwise highly vulnerable forest ecosystems of today. Moreover, the genetic characterization of these trees can be crucial to improve our knowledge on the molecular basis of local adaptation, identify selective drivers from different local and temporal forest settings, and contribute to explain the contemporary genetic variation of tree species.
Despite their recognized significance, relatively little is still known about the distribution, abundance, and biology of large old trees at the global scale [11]. In addition, several risk factors may threat their survival, mostly due to increasing climatic stress and anthropic pressure [14]. In many European countries, large old trees are registered and protected [15]. In Italy, the National Ministry of Agricultural, Food and Forestry policies promote search and protection through their census and cataloging. However, only a small number of studies have focused their attention on the genetic variability of these trees. In the Mediterranean area, recent researches achieved the taxonomic identification of large old oriental planes [16], or evaluated the genetic variability of old olive [17,18,19] and chestnut trees [13,20] to reconstruct their domestication history.
Castanea sativa Mill. is the only European species of the genus Castanea, and is largely widespread across the Mediterranean region, from the Black Sea to the Atlantic coast of the Iberian Peninsula. The present distribution of the species is the result of natural colonization processes and human intervention [21,22]. Its natural expansion occurred during the Holocene, spreading from glacial refugia in response to the global temperature increase [23] and the growing anthropic action which became significant for the diffusion of chestnut in the European continent during the Greek and Roman civilizations [24]. Although chestnut was already widely used for timber production and food consumption more than 2000 years ago, its proper cultivation, intended as the management of the species for fruit production, developed in Western Europe, including Italy, in the early Middle Ages [20,24]. Since then, the genetic diversity of the species has been severely affected by several factors, such as selection, the development of new grafting techniques to produce clonal trees of good quality, and the dispersal of local genotypes among different regions [20,25]. Increasing changes in the land use and various phytosanitary problems, such as the ink disease and canker blight, are additional threats to the genetic diversity of European chestnut [26]. From this perspective, large old chestnut trees, likely representing some of the longest-lived members of the species [11], may constitute a significant reservoir of unique genotypes, able to survive through centuries. In a scenario of global changes, the study of large old trees could be very useful to improve our knowledge on the genetic resources of the species, its past routes of colonization and dispersal, and to understand the mechanisms of eco-physiological adaptation. All this information can be used in programs for the conservation and management of genetic resources. Microsatellites (or simple sequence repeats, SSR) are the most appropriate and used marker to assess genetic variation in forest species [27,28]. In addition to standard measures of genetic diversity of species, populations, and individuals, SSRs can provide information on natural processes such as gene flow, genetic drift, migration, or dispersal [29,30]. Likewise, chloroplast DNA (cpDNA) variation across populations can allow inferences on seed origin and main evolutive relationships among lineages [31,32]. For these reasons, the combination of chloroplast and nuclear SSRs markers can provide a more comprehensive approach to study the genetic variability of ancient trees, and reveal useful information for future conservation strategies.
In this study, we performed a new, comprehensive field survey to uncover the occurrence of large old chestnut trees in South-Central Italy, where the oldest and well-known trees registered on the national list currently grow (https://www.politicheagricole.it). Two well-known chestnut trees called “Cento Cavalli” and “Nave”, traditionally considered the oldest European chestnut trees, were included in our dataset. Trees were genotyped using nuclear SSRs and chloroplast DNA marker sequencing, with the main goals of: (1) assessing their genetic identity; (2) to derive temporal indications on the application of the grafting practice; (3) to compare their diversity with the genetic resources of the present germplasm; (4) to provide hypotheses on the origin of ancient germplasm.
Our final objective is to contribute towards knowledge and valorisation of these large old trees, and to highlight germplasm sources of potential interest for both genetic improvement and conservation of European chestnut.

2. Materials and Methods

2.1. Plant Material and DNA Extraction

A database search was conducted in order to select the areas where the majority of large old chestnut trees are located. The trees were identified by accessing the catalogues of the National Ministry of Agricultural, Food and Forestry policies (D.M. 757, 19 April 2019, https://www.politicheagricole.it) and by surveying natural populations in Southern and Central Italy (Tuscany, Lazio, Umbria, Calabria and Sicily) (Supplementary Table S1). We selected individuals with a circumference larger than 5 m, for which an age of 200 to over 500 years can be estimated ([20] Table 1).
In total, ninety-nine individual trees were identified and collected. Buds and leaves from the aerial part and, if preset, from the root suckers were harvested in order to investigate the genetic integrity of each tree. Only for 61 trees we were able to collect both areal and basal part (Table 1). Several discrete stools were sampled to test for clonality from the oldest and largest European chestnut monumental trees, known as “Cento Cavalli” and “Nave”, estimated 3000 and 4000 years old [33]. The final dataset included a total of 169 samples, collected from 99 single individuals. Genomic DNA was extracted by grinding 50 mg of fresh leaf and bud tissues using the DNeasy96 Plant Kit (Qiagen, Hilden, Germany) according to the manufacturer’s protocol.

2.2. Microsatellite Analysis

Ten nuclear microsatellite markers (nSSRs) (CsCAT1, CsCAT2, CsCAT3, CsCAT6, CsCAT14, CsCAT16, EMCs15, EMCs25, EMCs38, QpZAG7) developed in C. sativa [34,35], Quercus petraea, and Q. robur [36] were selected and subsequently screened to evaluate the amplification capacity. Two multiplex reactions were arranged based on the size of the amplification products, with forward primers labelled with the fluorescent dyes 6-FAM, NED, PET and VIC. PCR reactions were performed using the Type-it Microsatellite PCR Kit (QIAgen, Hilden, Germany) in 12.5 μL total volume containing 20 ng of genomic DNA on a GeneAmp 2700 Thermal Cycler (Applied Biosystems, Foster City, CA, USA). Cycling parameters were set as follows: 5 min at 95 °C, 30 cycles for 30 s at 95 °C, 90 s at 57 °C, 30 s at 72 °C, and a final step of 30 min at 60 °C. Amplification products (0.1–1 μL) were added to 9.80 μL of formammide and 0.20 μL of size standard Genescan-500 LIZ to define allele sizes. SSR products were run on an ABI PRISM 3130 XL Genetic Analyzer (Applied Biosystem, Foster City, CA, USA) for separation and sizing. The alleles were scored using GeneMapper v4.0 software (Applied Biosystem, Foster City, CA, USA.

2.3. Chloroplast DNA Analysis

Nucleotide sequence variation analyses of the chloroplast DNA (cpDNA) regions were carried out on a subset of twenty-seven large old trees. This samples subset was selected in order to represent all the geographical areas and the most interesting individuals (based on size, presumed age and relevance for the local communities). Twenty-one additional chestnut individuals from Italy, Spain, and Turkey, selected from the germplasm collection of natural European populations of the Institute of Research on Terrestrial Ecosystems (CNR) were included in the analysis and used for comparison. The full sample list reported in Supplementary Table S4.
We screened five non-coding cpDNA regions: trnH-psbA, trnK-matK, atpI-atpH, trnV-ndhC, and trnS-trnG. PCR conditions were set according to Shaw et al. [37], and Piredda et al. [38]. Based on the amplification efficiency, the quality of the obtained electropherograms and the observed polymorphism, trnH-psbA and trnK-matK were selected and used for the subsequent analyses.
Individual DNAs (10 ng) were amplified with RTG PCR beads (GE Healthcare, Chicago, IL, USA) in a final volume of 25 μL and PCR products were purified with Illustra DNA and Gel Band Purification Kit (GE Healthcare). Forward and reverse sequencing with the amplification primers was performed at Macrogen (https://dna.macrogen-europe.com). DNA sequences were deposited on GenBank under accession numbers LR782134-LR782180 and LR782184-LR782230.

2.4. Data Analysis

2.4.1. Nuclar Microsatellite Diversity

The probability of null alleles (Fnull) for each of the 10 nSSR loci analyzed was tested using the software FreeNA [39]. GenoDive 3.0 [40] was used to identify clonal individuals. This software assigns samples to clonal groups by means of pairwaise genetic distances. A threshold which indicates the maximum genetic distance that is allowed between two individuals to still be clonemates with the same multilocus genotypes must be selected. We tested three different threshold-values (10, 20 and 30), to define the membership of individuals to different clonal groups. Only single, not clonal, genetic profiles were included in the subsequent genetic analysis. Standard genetic diversity indices (observed (Na) and effective (Ne) number of alleles, observed (Ho), expected heterozygosity (He) and unbiased heterozygosity (uHe), and the number of private alleles) were estimated using GenAlEx 6.5 [41] and GenoDive 3.0 [40]. Allelic richness (Ar) and private allelic richness (PAr) were calculated using HP-rare software [42]. The fixation index Fis [43] was computed for each locus across all individuals and for each individual group over all loci using the Arlequin 3.11 software [44].

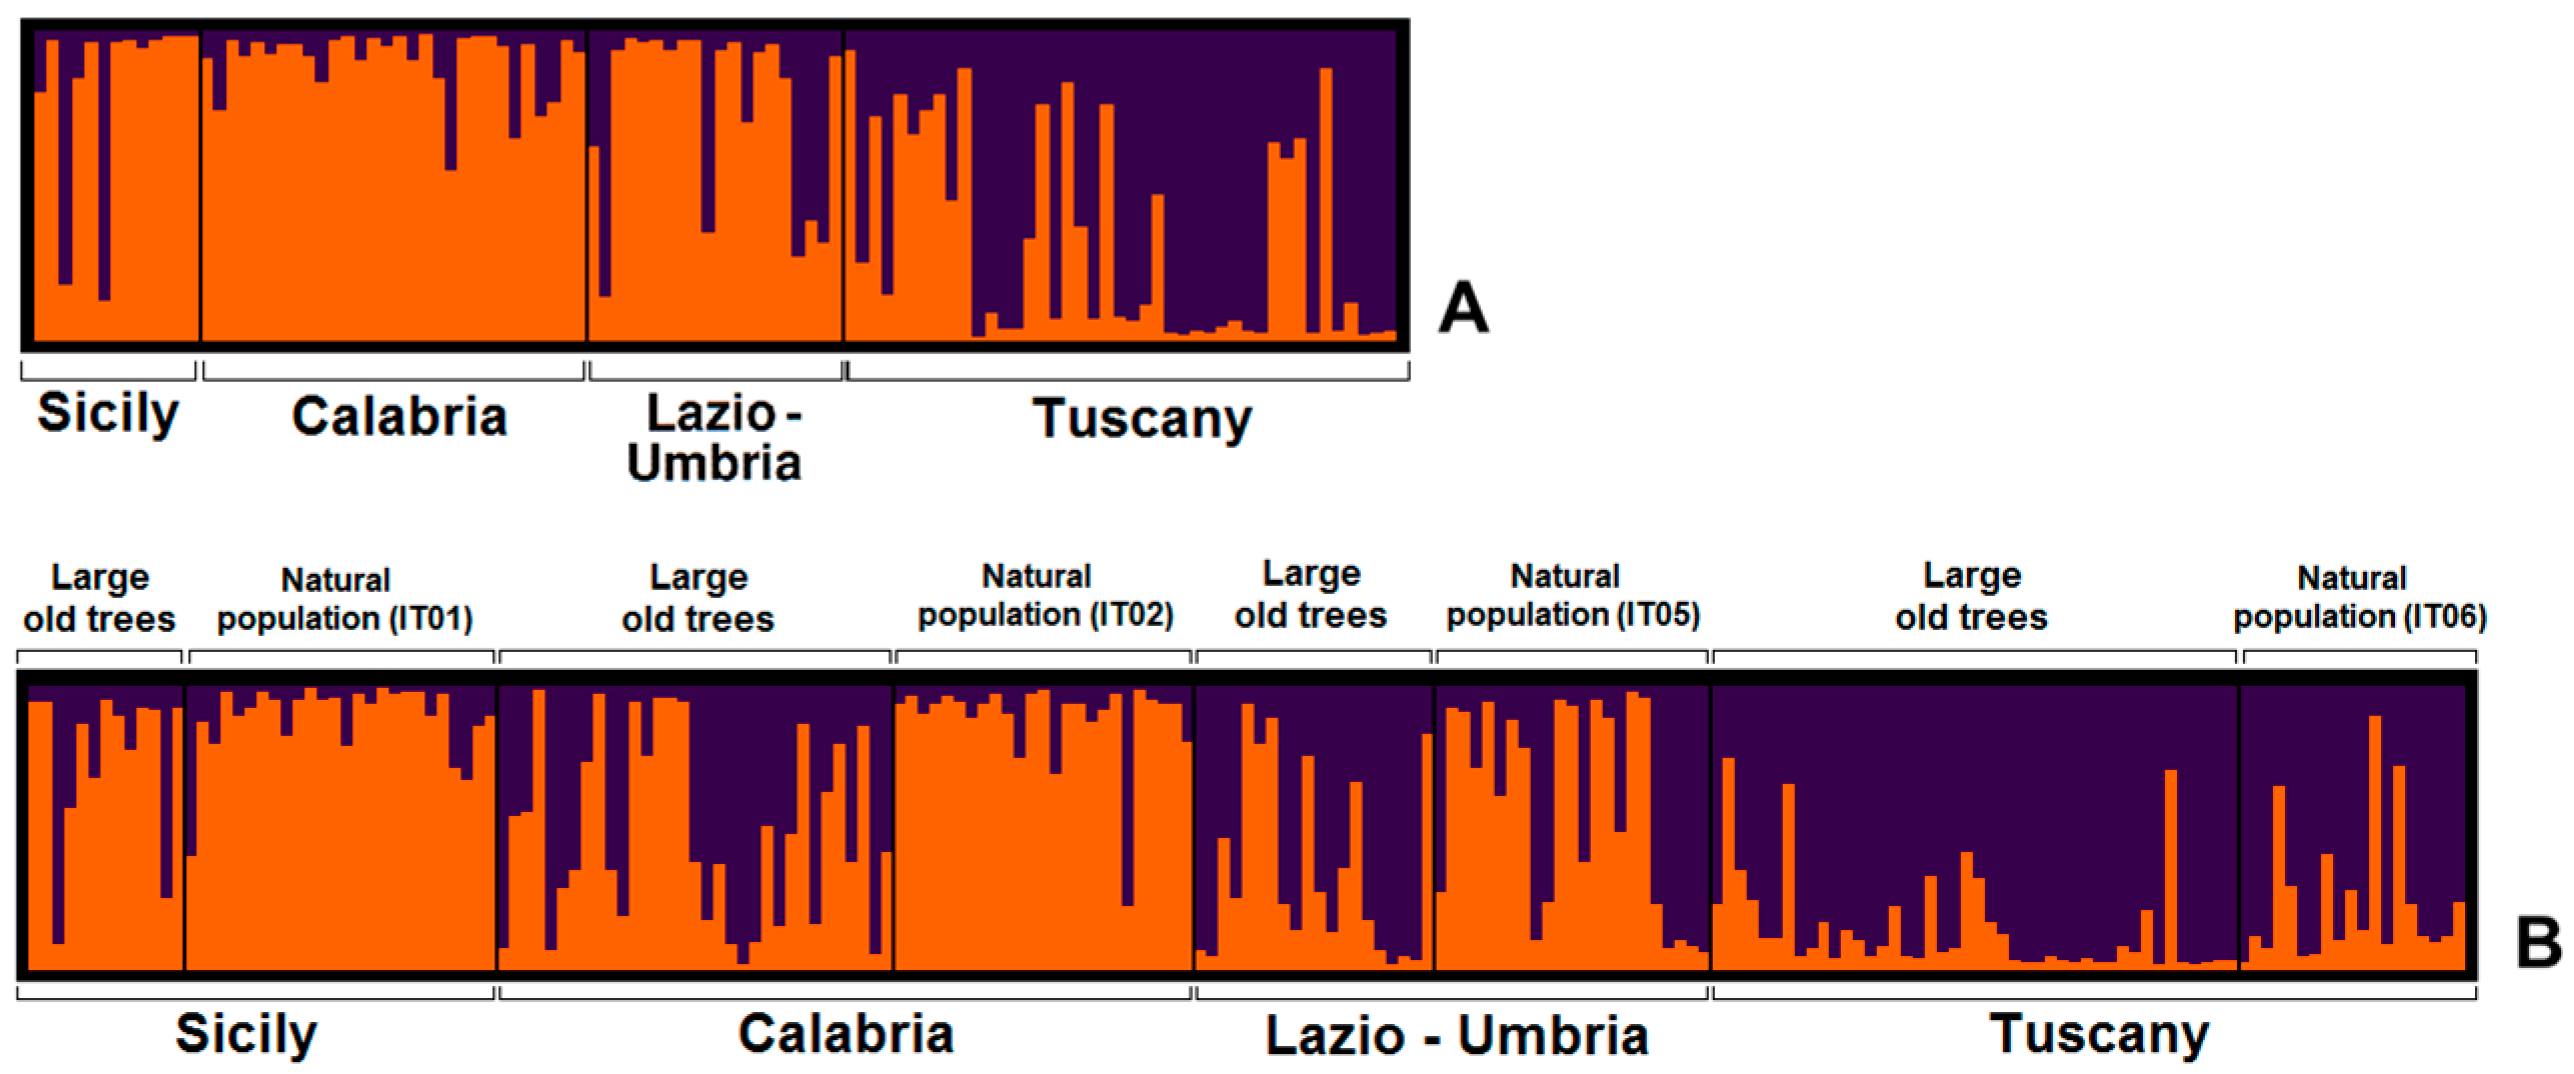
2.4.2. Estimation of Nuclear Gene Pools

The software GenAlEx 6.5 [41] was used to perform principal coordinates analysis (PcoA), based on a Nei’s genetic distance matrix [45]. A Bayesian clustering approach with STRUCTURE V.2.3.4 [46] was also performed, using the admixture model [47,48]. The number of tested cluster (K) ranged from one to the number of provenances plus two. Twenty independent runs were performed for each K value, with a burn in period of 10,000 steps and a MCMC (Markov chain Monte Carlo) with 100,000 iterations. Following the ΔK method by Evanno et al. (2005) [49], the most likely number of K was calculated using STRUCTURE HARVESTER [50]. CLUMPP [51] and DISTRUCT [52] software were used for the graphical representation of STRUCTURE results. The analysis were performed using the SSR genotypes of the large old trees and the SSRs genotypes of some Italian natural chestnut populations (Supplementary Table S1; [53]) included in the database of the Institute of Research on Natural Ecosystems—National Council of Research Italy.

2.4.3. Chloroplast DNA Sequence Analyses

Electropherograms were edited with CHROMAS 2.6.5 (https://technelysium.com.au), and checked visually. The software MEGA 5.2 [54] was used to perform multiple sequence alignments. Haplotype lists and the main diversity parameters of the investigated markers were computed with DNASP 5.1 [55]. Median-joining (MJ) haplotype networks of every single and combined plastid region were inferred with Network 4.6.1.1 (http://www.fluxus-engineering.com/), treating gaps as 5th state. The MJ algorithm was invoked with default parameters (equal weight of transversion/transition).

3. Results

3.1. Genetic Diversity

The analysis carried out with GenoDive on the 169 total samples (canopy and root sucker samples from 99 ancient trees) identified 106 different genotypes. Out of 61 trees from which areal and basal part were collected 33 resulted grafted (Supplementary Table S2). In some cases, especially in circumscribed areas in Tuscany and Umbria regions, the canopy of different plants showed identical (clonal) genotypes.
Interestingly, the genetic analysis of the different stools of the ancient trees known as “Cento Cavalli”, and “Nave” confirmed the genetic uniformity in all of their parts.
Locus EMCs25, which showed a high frequency value of null alleles (0.278), Fst including null alleles (INA) 0.1535 and Fst excluding null alleles (ENA) 0.1162, was excluded from the subsequent analyses. We scored 107 alleles for the nine SSRs loci (Table 2). The number of alleles for each locus (Na) ranged between four (QrZAG7) and twenty-seven (CsCAT3). The effective number of alleles (Ne) ranged from 1.69 (QrZAG7) to 7.43 (CsCAT2). The observed (Ho) and expected (He) heterozygosity ranges were 0.24–0.83 and 0.45–0.90, respectively, and the unbiased heterozygosity values (uHe) were nearly identical to He. Three loci (EMcs15, EMCs38, QrZAG7) showed positive and significant Fis.
The genetic diversity values calculated grouping the trees based on their geographic location (Table 3) showed mean numbers of observed and effective alleles per locus of 7.86 and 4.53, respectively. Lowest values were displayed by the samples from Sicily (6.11, 4.19), and the highest scores by the samples from Tuscany (9.22) and Lazio-Umbria (4.92), respectively. Sicily and Tuscany also showed the lowest and the highest values of observed and expected heterozigosity (0.65, 0.73, and 0.69, 0.74 respectively), whereas the highest values of allelic richness and private allele richness were found in Calabria (Ar = 6.88) and Tuscany (PAr = 1.06). A positive and significant Fis value was observed in Calabria.

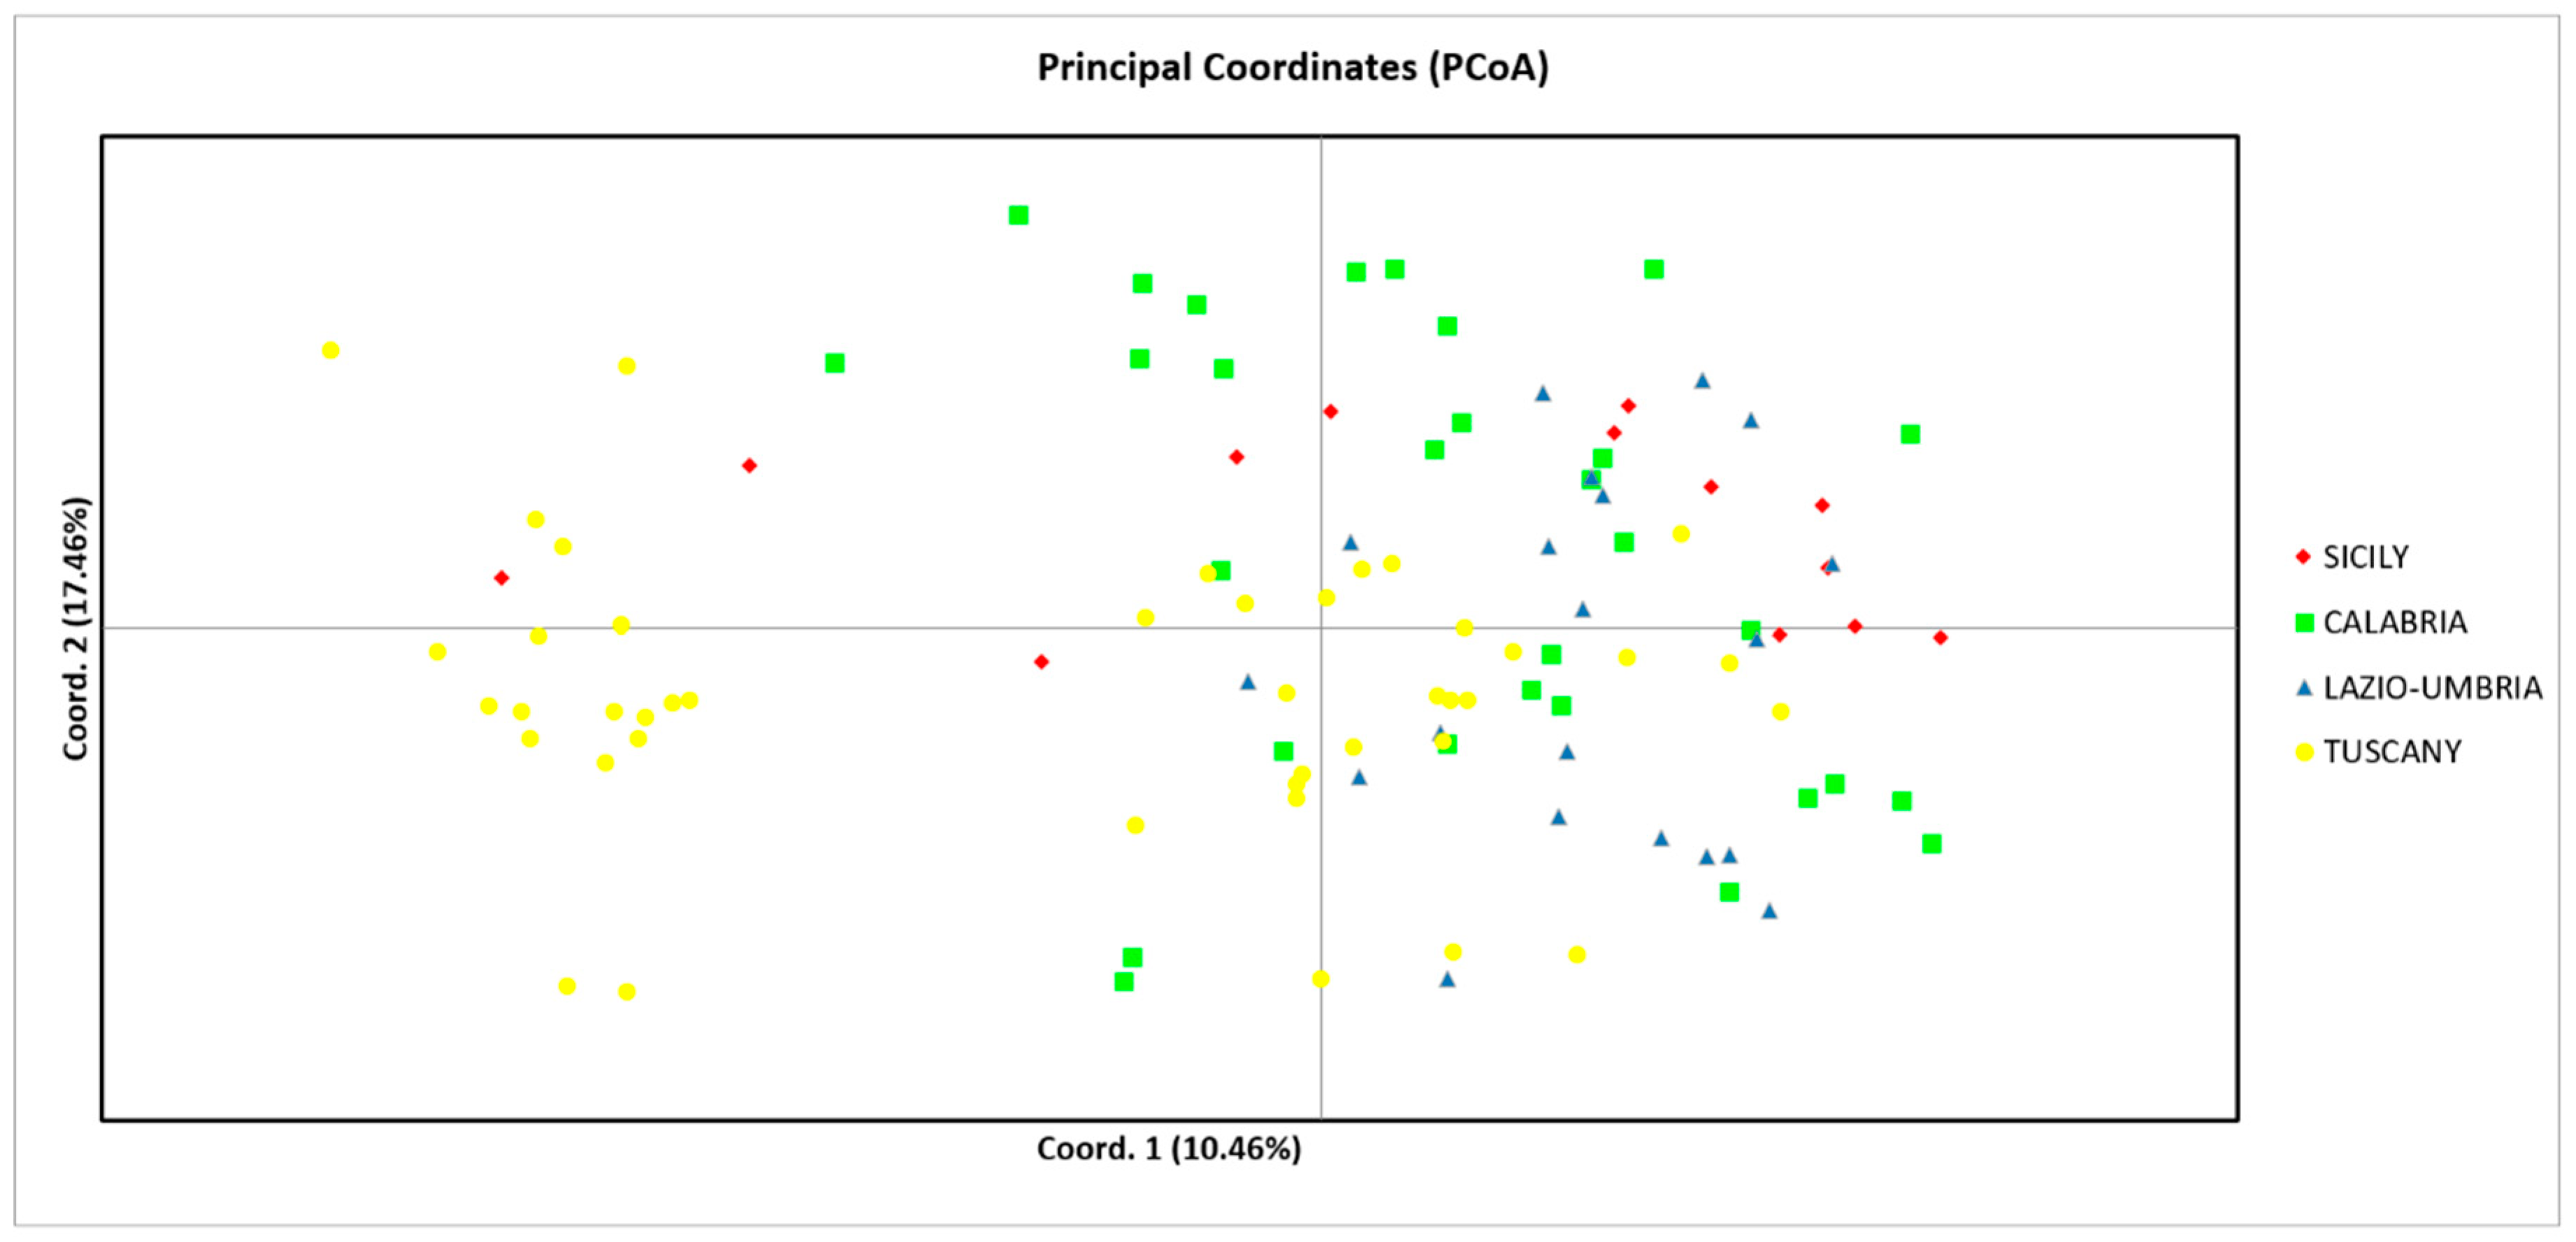
3.2. Nuclear DNA Variation

The principal coordinate analysis (PCoA) of the 106 identified genotypes is presented in Figure 1. Most of the genotypes from Tuscany are separated from the other individuals, and the overall variance observed is 27% (the X axis 10.46% and the Y 17.46%). The STRUCTURE analysis confirmed this separation; the 106 genotypes were divided into two different genetic clusters with a most likely K of 2 (Figure 2A). A geographical pattern of genetic differentiation was observed in most of the trees from Southern (Sicily and Calabria) and Central Italy (Lazio-Umbria), which belong to the cluster I (orange). The second cluster (II) (purple) included the most part of the giant trees from Tuscany (Central Italy). Figure 2B shows the genetic relationships of the investigated ancient trees and the natural chestnut populations growing in their proximity. Two main gene pools were detected; the majority of ancient trees from Tuscany, Lazio-Umbria and Calabria belong to the cluster II (purple), while the giant trees from Sicily and all natural populations, except for the population IT06 (Tuscany), belong to the cluster I (orange). A high genetic relatedness between ancient germplasm and natural populations was observed in Tuscany (purple) and Sicily (orange) regions, while a greater genetic divergence from natural populations was highlighted for the ancient germplasm from Calabria and Lazio-Umbria. These results are congruent with the higher mean of private alleles observed in the large old trees from Calabria and Tuscany than in the populations living in their proximity (Supplementary Table S3).

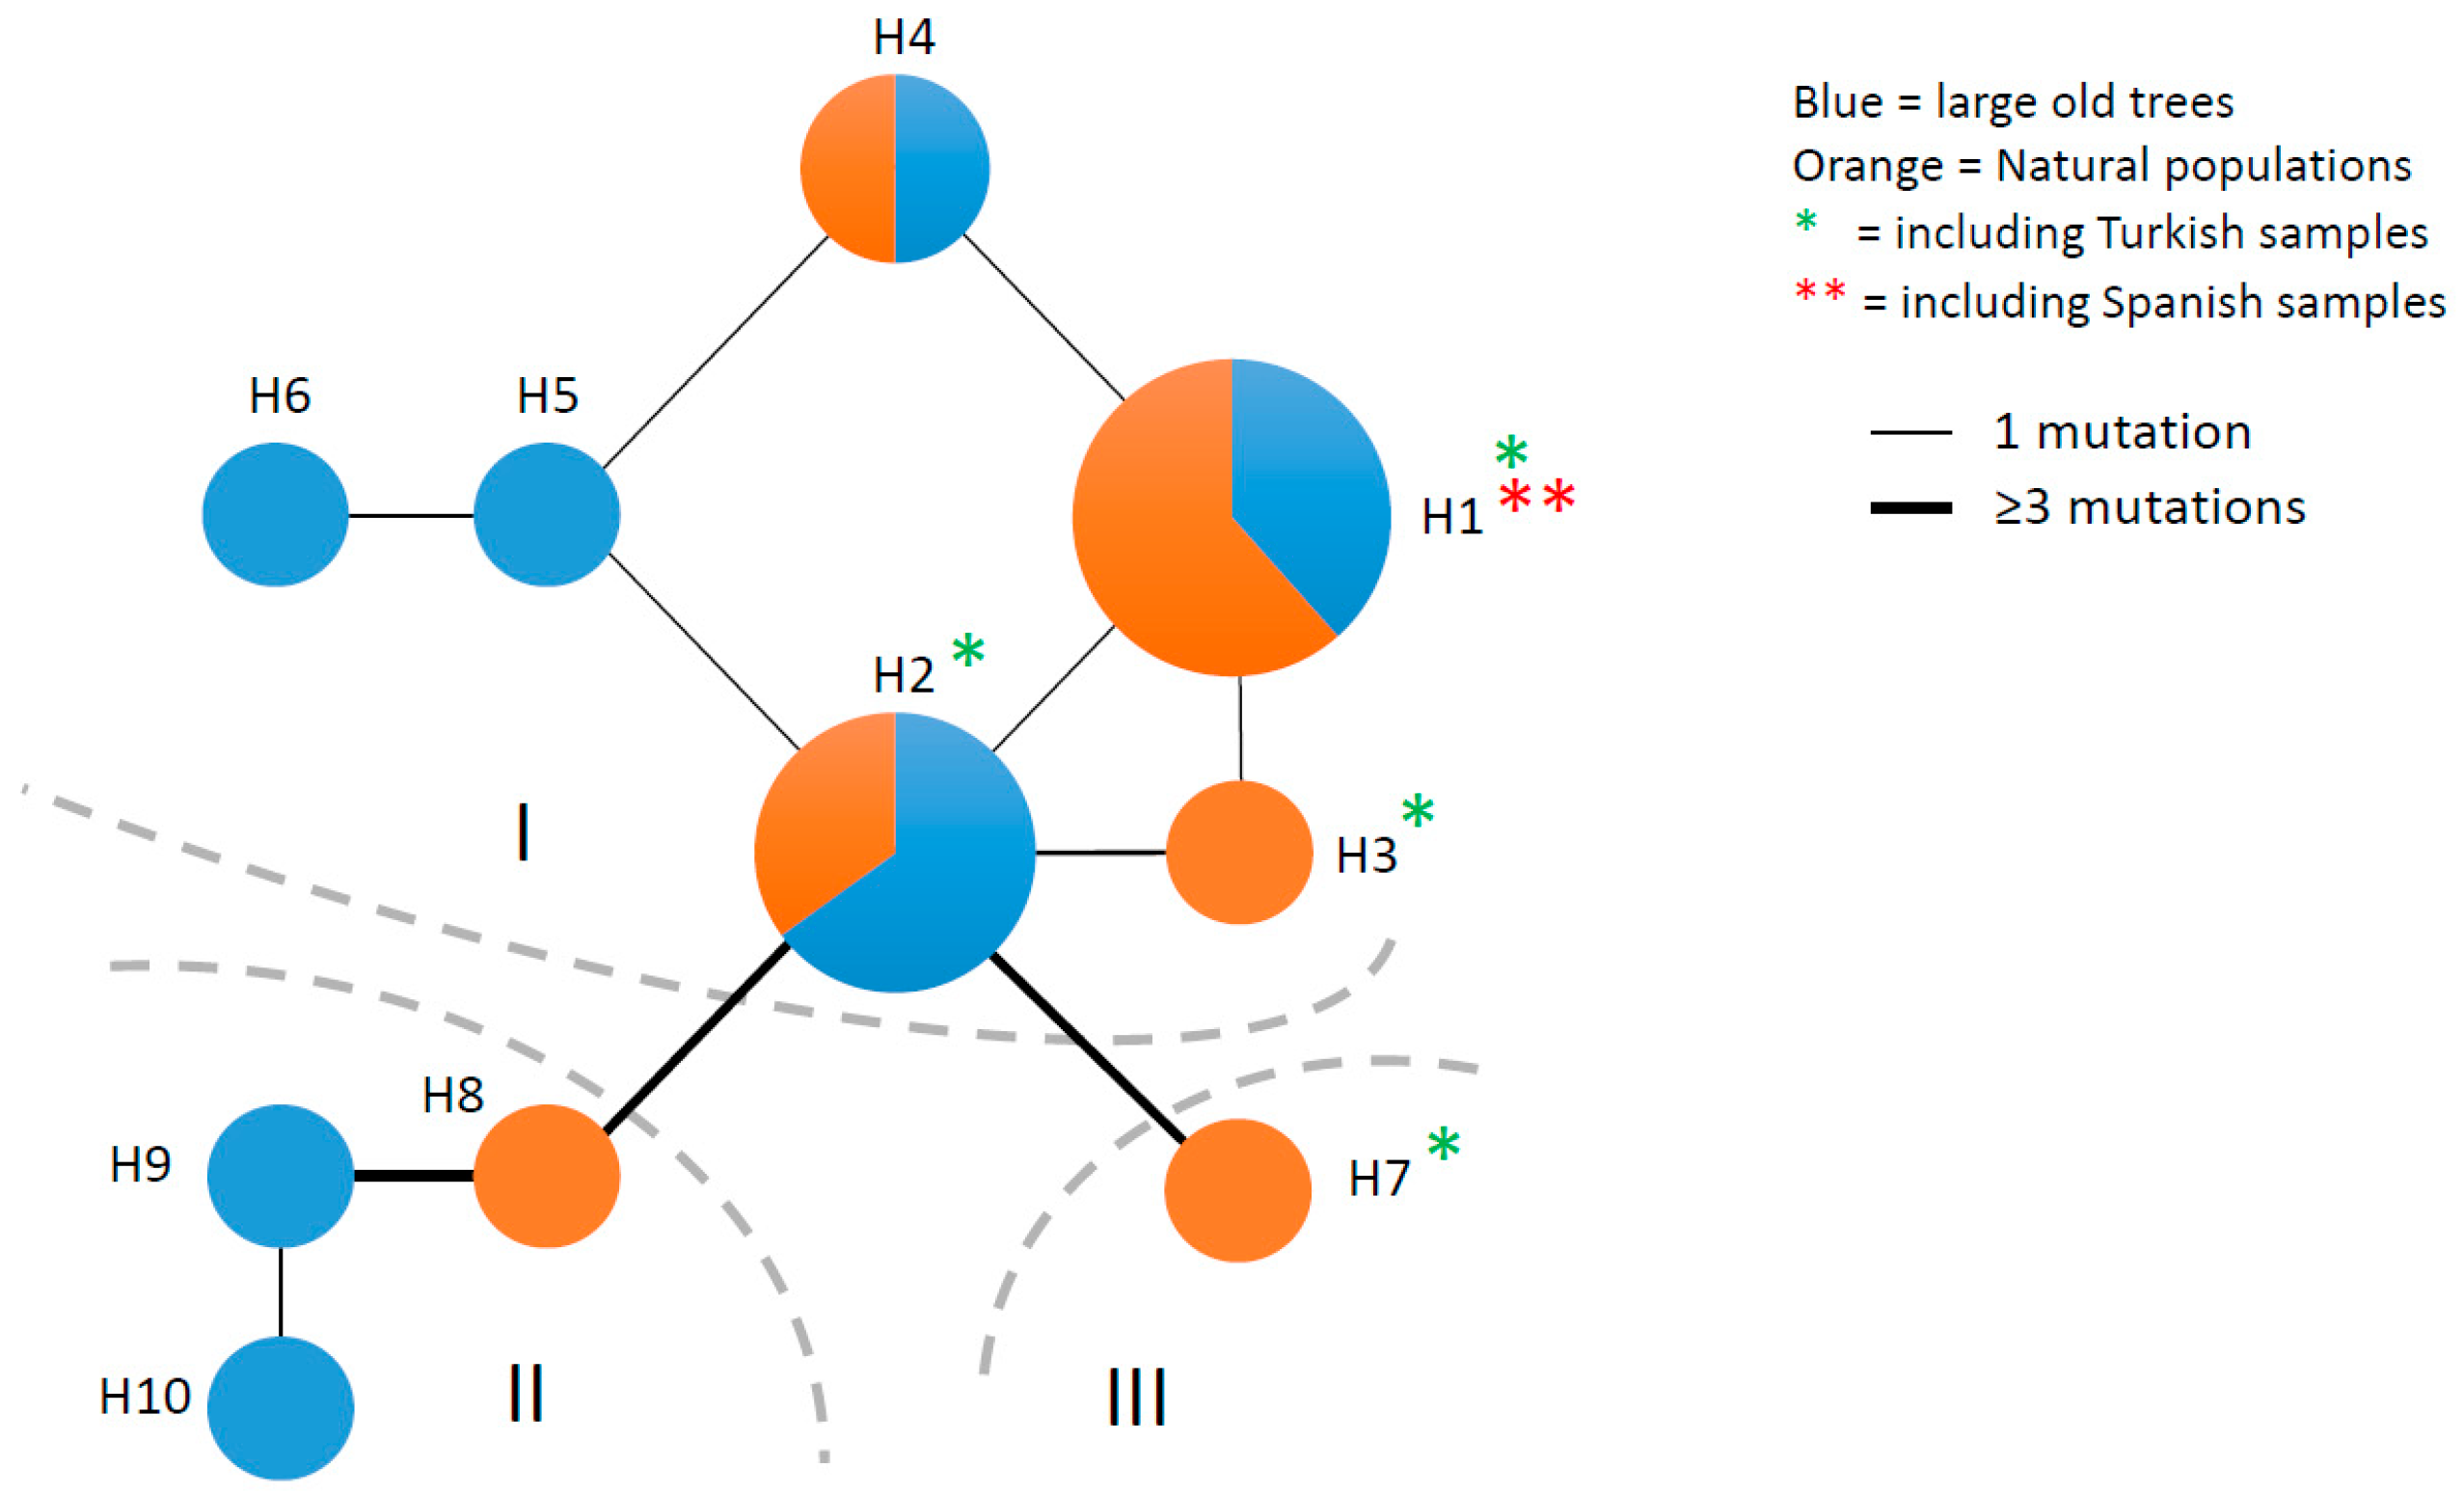
3.3. Chloroplast DNA Variation

In contrast to the other tested plastid markers (trnV-ndhC: poor sequencing efficiency; atpI-atpH, and trnS-trnG: low sample resolution; data not shown), both trnH-psbA and trnK-matK produced unambiguous electropherograms in 100% of samples and displayed sequence polymorphism within the monumental trees of the study area. However, the diversity parameters scored by these two markers were low (Table 4). A 7 bp-long insertion was uniquely found in the trnH-psbA region of six samples: a sample from natural population (IT05) and five large old trees from the different sites ID 6 (Sicily), ID 22 (Sila), ID 36 (Pollino), ID 47 (Lazio-Umbria), ID 66 (Tuscany) (Supplementary Table S4). Interestingly, the highest values of uncorrected-p genetic distance within the dataset were scored by the same six sequences and some samples from natural Turkish populations. In total, the two concatenated plastid regions produced 10 moderately diverse haplotypes. The generated plastid haplotype list showed that haplotypes H1 and H2 were the most common, consisting of 20 and 13 samples respectively, while all other haplotypes included one to four samples each. The majority of large old trees were included in the two most common haplotypes, H1 and H2 (13 and 5 trees respectively), and the remaining individuals (eight individuals) identified five different haplotypes. Interestingly, haplotypes H5, H6, H9, and H10 were uniquely scored by large old trees, whereas haplotype H4 was shared between a large old tree and a natural population. Haplotypes H3, H7, and H8 collected only samples from natural populations (several locations). Finally, the Turkish samples used for comparison were allocated in four haplotypes (H1–H3 and H7) and the samples from Spain were included in a single haplotype (H1) (Supplementary Table S4). The concatenated haplotype network (Figure 3) showed that the produced plastid haplotypes can be divided into three main groups, based on the relative number of mutations, ranging from 1 to 4, separating each haplotype. The first group (I) included haplotypes H1–H6, all separated by single mutations, and grouped samples from Italy, Spain and Turkey. In particular, haplotype H1 included five large old trees and one individual from a natural population from Tuscany, four large old trees and one sample from a natural population from Sicily, two large old trees and one individual from a natural population from Lazio-Umbria, and a member of a natural population from Calabria. This haplotype was also shared with two large old trees from Spain and three individuals from natural populations in Turkey. Haplotype H2 comprised four large old and one natural trees from Lazio-Umbria, one giant tree from Sardinia, and members of natural populations from Calabria, Sicily, Tuscany, and Turkey. Haplotype H3 included only three natural trees, from Sicily, Sardinia, and Turkey. Haplotype H4 grouped one large old tree from Calabria and a natural population from Sicily. Haplotypes H5 and H6 were unique and included only large old trees from Calabria. The third group (III) included haplotypes H8, H9, and H10, appeared exclusive to the Italian samples, and collected the six individuals sharing the 7-bp-long insertion and highest level of uncorrected-p distance within the dataset. Haplotype H8 was highly differentiated, separated by three mutations both from the closest haplotype of group I and from haplotypes 9–10, and was represented by a single individual from a natural population (Lazio). Haplotypes H9 and H10 included only large old trees from Sicily, Calabria, Lazio-Umbria. and Tuscany. The second group (II) included a single haplotype (H7) that identified only one natural population from Turkey and was linked to group I, separated by (at least) four mutations from the haplotypes of Group I, where the other Turkish samples are included. The two most common haplotypes H2 (located at the core of the network), and H1 (spanning a large geographical area and collecting the highest number of long-lived trees) most likely identify two ancestral haplotypes [56].

4. Discussion

Giant trees that have demonstrated long-lasting resilience to prolonged climatic events, such as the medieval warm period, the Little Ice Age, and modern anthropic pressure, constitute a conservation priority and an incredible source of information for eco-physiology, genomics, and productive studies. In this context, it appears of great importance to search, inventory, and evaluate the genetic identity of large old chestnuts across the species range, in order to preserve the capacity of adaptation and long-term survival to climate change, human pressure and new pests of its natural, naturalized, and cultivated stands. The present work represents the first extensive study based on nuclear and chloroplast markers, aimed to describe the individual genetic identity of Italian large old chestnut trees, evaluate their variability, and identify their relationships with the contemporary populations.

4.1. Central and South Italy as Reservoir of Giant Chestnut Trees

We based our survey on the Italian National Catalog of Monumental Trees, but we were able to recover a larger and perhaps unexpected number of plants with extraordinary dimensions. The catalog should be therefore implemented, and specific field campaigns at a finer scale should be launched for a detailed and continuous update [57]. All the giant, long-living chestnuts are obviously located in mountain areas, where the ecological conditions for Castanea sativa, a mesophilous, mid-montane tree species, are most favorable in Italy [58]. The importance of preserving mountain habitats and their natural (long-living, poorly disturbed) patches is therefore reinforced. Especially in mountain habitats, large old trees play an extraordinary range of critical ecological roles including hydrological regimes, soil stability, nutrient cycles, and other ecosystem processes. Large old trees also strongly influence local biodiversity, in terms of abundance, spatial and temporal distribution of individuals of the same and other species, as well as of numerous other organisms [8,9]. Mountain habitats likely played a fundamental role for forest conservation during historical periods of land exploitation. Notable examples of the fundamental importance of mountain systems as a reservoir of old trees, endemic species and genetic diversity can be found at a global scale [59] and in the Mediterranean area as well. For instance, in Italy, pines and beeches of extremely considerable age endure on the Pollino mountain area (Calabria) [60]; the Lebanese mountain system is home of rare endemic oak and fir species [61], while the Basque and other inland Iberian territories host high numbers of long living chestnut trees [20].
Clearly, humans, in particular the local mountain communities, have proven capable of maintaining these “iconic” chestnut trees and associated ecosystems for a long time, showing great respect for nature. However, we cannot exclude that these plants simply survived because located in abandoned or in difficult-to-access sites or, thanks to particularly favorable genetic characteristics, they expressed particular quality features or special abilities to resist to the environmental stresses that occurred in the past centuries. These old plants indeed represent an important source of genetic variability and could be therefore studied under the productive and sanitary points of view.
To our knowledge only a previous genetic study was conducted on old chestnut trees in Italy [13], evidencing an important genetic variability existing within 54 North Italian ancient chestnut cultivars (aged no less than 100 years) by use of nuclear SSR markers. In our study, we included trees living in central and southern Italy with a circumference higher than 5 m. Determining the ages of such trees based on size parameters (i.e., diameter or girth) can be highly challenging [8]. The multi-trunk structure or other problems (e.g., extended cavities) that can be easily shown by these organisms may constitute additional hindering factors. However, ages over (at least) two and three centuries can be consistently estimated for our dataset [20]. All the collected large old trees represent inestimable scientific, landscape, and cultural value. In some cases the tree history is closely related to the history of local human settlements, and many histories and legends are handed down on some trees. Examples of their strict link with local human communities are the proper names given to some trees, such as Volpiglione”, “Prato Fosco”, and “Miraglia”. These plants live in Tuscany, the first two grow wild in the Garfagnana mountain areas while “Miraglia” is in a National park. Based on their circumferences between 5 and 7 m and their height (more than 15 m), they have been speculated to be over 500 years old [62].
In Sicily live the two oldest chestnut trees in the world, “Cento Cavalli” and “Nave”, both located in the eastern slope of the Etna system [20,33]. These chestnuts appear with a complex morphology. They are split into multiple large trunks with an impressive total circumference, reaching 23 m (“Nave”) and 57.9 m (“Cento Cavalli”). This latter is also considered the largest and oldest chestnut tree in the world and it is recognized by UNESCO as a “World heritage messenger of peace”. The genetic analysis of the different stools of these two ancient trees confirmed their genetic uniformity in all of their parts, despite their extraordinary size and the historical debate around their integrity. Indeed, both individuals are formed of a single genotype, the original plant, which has grown over centuries.

4.2. Genetic Identity of Large Old Trees

The genetic analysis of the root suckers and canopy allowed to identify grafted trees and speculate on the cultivation practice. Among the 99 trees analyzed, 33 resulted grafted; the majority of these was collected in Umbria and Tuscany, where the chestnut cultivation has a long tradition and great economic importance. Interestingly, in some restricted areas, more than one tree was grafted with an identical genotype, indicating a widespread genotype selection and cultivation practice. Similar results were obtained by Pereira-Lorenzo et al. [20] who tested 102 Spanish giant chestnut trees and indicated 23 individuals as grafted.
We indicated as grafted “Volpiglione” and “Prato Meleta” chestnuts, located in Tuscany and, based on their trunk diameters, presumed to be 500–600 years old [62]. These results confirm grafting as an ancient practice as indicated by Pereira-Lorenzo et al. [20]. These authors, comparing the germplasm of the ancient chestnuts from Spain, Portugal, and Italy with the current European cultivar database, identified the genetic profile of “Marrone Fiorentino” in some Italian old large trees from Umbria, estimated the tree ages based on the average growth and perimeter, and speculated that the cultivation process could be dated back to the 15th century. These findings also validate other historical researches, which hypothesized that the cultivation of chestnut, with plants selected as the most productive grafts, occurred in Western Europe, including Tuscany, in the Middle Ages [24].
The PcoA and STRUCTURE analyses were congruent in highlighting the genetic divergence of some genotypes from Tuscany, and STRUCTURE clearly identified two separate gene pools: a first one including giant trees from southern (Sicily and Calabria) and central Italy (Lazio-Umbria), and a second pool including most of the trees from Tuscany. This result, and the high values of private allele richness exhibited in Tuscany and Calabria, could be an indication of a long-term separation of the old trees in these areas, which are considered glacial micro-refugia [22], characterized by unique genetic signatures [53], where isolated C. sativa populations were confined during the last glacial maximum.
In general, the distribution of old-living trees can be the result of complex interaction between natural and human influences, acting over multiple spatial and temporal scales [8]. In this view, our results are in agreement with the previous study on European chestnut [53] in which the structure of chestnut populations was attributed both to natural colonization and human mediated transport of plants due to the great economic importance of this species. Comparing the gene pools of chestnuts living in the proximity of the large old trees, it is noteworthy the genetic homogeneity observed in Tuscany and Sicily. These results can be explained considering that the trees have been sampled in remote mountain sites in Sicily (Etna volcanic system) and Tuscany (Garfagnana), in which both isolation and reduced human activities contributed to preserve the germplasm homogeneity through time. The high values of genetic diversity and especially of private alleles exhibited by Tuscany might indicate strong local adaptation. Lazio-Umbria, a traditional crossroad of commerce and agricultural activities, with more accessible, low mountain areas, showed moderate levels of genetic diversity, and heterogeneity between the ancient and contemporary germplasm, pointing towards a pronounced recent cultivation of non-native germplasm, and relegation of ancient trees in few isolated spots. In Calabria, the high values of genetic richness and private alleles observed in the old large trees might imply strong local adaptation to the different mountain systems (Pollino, Sila, Aspromonte), but also recent introduction of non-native germplasm in the close-by areas, given the observed divergence between ancient and contemporary germplasm. Based on these results, we highlight the necessity to preserve and adequately manage the original genetic resources identified in this study, through the protection of the large old trees and their habitats, and the establishment of ex-situ living collections.

4.3. Ancient Phylogeographic Signatures

Nuclear markers are often complemented by cpDNA analyses to efficiently investigate phylogeographical events such as migration and species origin [63]. However, very few studies have been performed at the intra-specific level in Castanea by means of plastid DNA sequence variation [37,64], and none on C. sativa, with the exception of a DNA barcoding study [65]. Based on these works, five non-coding cpDNA regions (trnH-psbA, trnK-matK, atpI-atpH, trnV-ndhC, trnS-trnG) were tested. TrnV-ndhC (effectively used in the North American species C. dentata, C. pumila, and C. ozarkensis) could not be efficiently sequenced, possibly because of some sequence mismatch in the primer regions, whereas atpI-atpH and trnS-trnG only resolved Middle Eastern vs. West Mediterranean samples. TrnH-psbA and trnK/matK turned out to be more informative. These two loci were also recommended as an optimal cpDNA marker combination in terms of universality, sequence quality and discrimination power in complex plant groups [66,67], and trnH-psbA was also suggested as an informative marker for intraspecific and population study [65]. Overall, the detected polymorphism appeared very low. However, it was sufficient to allow the identification of interesting diversity and geographic patterns, and complement previous studies in which the biogeographic history of the species was delineated based on nuSSRs [53]. The low variation of the plastid genome in Fagaceae is well-known, as well as the potential information conveyed on phylogeographic grounds [32].
The long-lived chestnut dataset displayed a high number of haplotypes (7), despite the limited number of individuals (26), and geographic areas (4) investigated. Two additional haplotypes were recorded in samples from Italian natural populations, and one in a Turkish population. There was no geographical structure in the haplotype network confirming the results obtained in a previous research [68], although three closely linked but distinct groups clearly emerged. These groups likely identify different lineages; two lineages occur in Italy, collect all long-lived, ancient chestnut trees, and are further differentiated into three-to-six haplotypes, thus indicating different seed origins.
The sharing of the same ancestral (H1, H2) haplotype by ancient chestnut and Turkish and Italian samples validates the hypothesis of Turkey as a site of origin for the European chestnut, with subsequent westward exchange of genetic material, as a result of natural or human-mediated processes [24,53,68]. On the other hand, the exclusive presence of the unique haplotypes belonging to lineage I (H5 and H6) could suggest local differentiation or isolation, considering that the samples were collected in the southern Apennine mountains (Calabria), a geographic area considered a refugium during the last glaciation [69].
The more differentiated Group III testifies (at least) another germplasm origin, with the possible occurrence of two sub-lineages (haplotype H8, and haplotypes H9 and H10). Lineages I and III are extended all over South-Central Italy, indicating either overlay of two different colonization waves, followed by long-time persistence and local differentiation, or human introduction of highly differentiated germplasm sources in historical times. These results, even if obtained with a restricted number of samples in a limited geographic area, are congruent with those obtained by Mattioni et al. [21,53] using nuclear microsatellite markers. These authors highlighted that the high intra-population diversity and allelic richness found in Italian peninsula could be attributed to mixing colonization routes from glacial refugia and human-mediated colonization.
At this regard, it is worth noting that all the geographic regions we investigated (Tuscany, Lazio-Umbria, Calabria, Sicily) have ancient trees belonging to both lineages I and II, with the former being the most represented. Calabria appeared as the region with the largest haplotype diversity (five trees, four haplotypes), in agreement with the nuclear data showing the highest genetic diversity. However, no H1 and H2 haplotypes were scored by the Calabrian ancient trees. Umbria was the second region displaying highest haplotype diversity (six trees, three haplotypes), and five of its monumental trees scored haplotypes H1 and H2. In agreement with the nuclear data, Sicily and Tuscany appeared more homogeneous, with all their monumental trees setting within haplotype H1, and unique trees within lineage II. However, ancient chestnuts and close natural populations from Sicily and Tuscany showed only partial occurrence of the same plastid haplotypes, contrary to what observed with the nuclear data. This result could be explained with homogenization of the nuclear genome mediated by historical gene flow. Interestingly, the most represented (and likely ancestral) haplotype H1 included the presumed oldest trees of our dataset (“Cento Cavalli” and “Nave”), whereas an interesting unique haplotype (H8) was shown by a natural tree in Lazio. This finding may be interpreted in the light of a yet unrepresentative picture of the genetic variation existing in Italy, or as the maintenance of a specific haplotype in a natural population, vegetatively transmitted by the original source.

5. Conclusions

In this pioneer study, we demonstrate that considerable genetic variability resides in the large old chestnut trees living in south-central Italy, and it has been only partially preserved in contemporary populations, both at the nuclear and the plastid genomes. We highlight that the important evaluation of the genetic diversity of centennial tree germplasm may provide opportunities to: (a) improve our understanding of the history and evolution of the species; (b) increase knowledge and utilization of the species genetic resources: (c) drive future genetic and ecophysiological studies aimed to evaluate adaptive potential and resilience to climate changes. All these points have crucial importance for the conservation of biodiversity at all levels and programs of forest genetic resources management in a scenario of global change. Nuclear SSR and cpDNA analyses may drive deeper metagenomic investigations to reveal genetic traits that allowed natural ageing or human preservation of these ancient trees (e.g., adaptation, pest resistance, or high-quality traits). At the same time, continued individual monitoring, preservation of the habitats where they still live, and germplasm collection for safeguarding their important genotypes, should be ensured.
Future studies should focus on monitoring and sampling long-lived trees in northern Italy, other overlooked regions (e.g., Campania, Molise) and all over the species’ distribution range. A genetic database and a precise age dating based on radiocarbon (14C) of the large old chestnut trees in Europe could be a starting point for future research, management, and conservation actions.

Supplementary Materials

The following are available online at https://www.mdpi.com/1999-4907/11/10/1118/s1, Table S1: List of natural chestnut populations, Table S2: genotypes observed, Table S3: private and common alleles of large old trees and natural populations, Table S4: haplotypes observed.

Author Contributions

Conceptualization: C.M., L.R., and M.C.S.; Methodology: C.M., L.R., and M.C.S.; formal analysis: L.R., C.M., and S.C.; samples collection: M.C., L.L., T.L.M., and C.M.; data curation: L.R., C.M., S.C. and M.C.S.; writing—original draft preparation: C.M., M.C.S., S.C. and L.R.; writing—review: F.V. All authors have read and agreed to the published version of the manuscript.

Funding

This research received no external funding.

Acknowledgments

The authors wish to acknowledge all the people who helped in collecting the samples, especially M. Leonardi (Parco Naturale Dell’Etna), the Sections of Carabinieri Forestali of Sicily, Umbria and Tuscany regions. Thanks are due also to Angela Martin for her critical review of the manuscript.

Conflicts of Interest

The authors declare no conflict of interest.

References

  1. Petit, R.J.; Hampe, A. Some Evolutionary Consequences of Being a Tree. Annu. Rev. Ecol. Evol. Syst. 2006, 37, 187–214. [Google Scholar] [CrossRef] [Green Version]
  2. Clark, J.S.; Bell, D.M.; Hersh, M.H.; Nichols, L. Climate change vulnerability of Forest biodiversity: Climate and competition tracking of demographic rates. Glob. Chang. Biol. 2011, 17, 1834–1849. [Google Scholar] [CrossRef]
  3. Kremer, A.; Potts, B.M.; Delzon, S. Genetic divergence in forest trees: Understanding the consequences of climate change. Funct. Ecol. 2014, 28, 22–36. [Google Scholar] [CrossRef] [Green Version]
  4. Parmesan, C. Ecological and evolutionary responses to recent climate change. Ann. Rev. Ecol. Evol. Syst. 2006, 37, 637–669. [Google Scholar] [CrossRef] [Green Version]
  5. Savolainen, O.; Pyhäjärvi, T.; Knürr, T. Gene Flow and Local Adaptation in Trees. Ann. Rev. Ecol. Evol. Syst. 2007, 38, 595–619. [Google Scholar] [CrossRef]
  6. Florian, J.A.; Aitken, S.N.; Alía, R.; González-Martínez, S.C.; Hänninenk, H.; Kremer, A.; Lefèvre, F.; Lenormand, T.; Yeaman, S.; Whetten, R.; et al. Potential for evolutionary responses to climate change—Evidence from tree populations. Glob. Chang. Biol. 2013, 19, 1645–1661. [Google Scholar]
  7. Pritchard, H.W.; Moat, J.F.; Ferraz, J.B.S.; Marks, T.R.; Camargo, J.L.C.; Nadarajan, J.; Ferraz, I.D.K. Innovative approaches to the preservation of forest trees. For. Ecol. Manag. 2014, 333, 88–98. [Google Scholar] [CrossRef] [Green Version]
  8. Lindenmayer, D.B.; Laurance, W.F. The Unique Challenges of Conserving Large Old Trees. Trends Ecol. Evol. 2016, 31, 416–418. [Google Scholar] [CrossRef]
  9. Lindenmayer, D.B.; Laurance, W.F. The ecology, distribution, conservation and management of large old trees. Biol. Rev. 2017, 92, 1434–1458. [Google Scholar] [CrossRef]
  10. Blicharska, M.; Mikusiński, G. Incorporating social and cultural significance of large old trees in conservation policy. Conserv. Biol. 2014, 28, 1558–1567. [Google Scholar] [CrossRef]
  11. Lutz, J.A.; Furniss, T.J.; Johnson, D.J.; Davies, S.J.; Allen, D.; Alonso, A.; Anderson-Teixeira, K.J.; Andrade, A.; Baltzer, J.; Becker, K.M.L.; et al. Global importance of large diameter trees. Glob. Ecol. Biogeogr. 2018, 27, 849–864. [Google Scholar] [CrossRef] [Green Version]
  12. Bräutigam, K.; Vining, K.J.; Lafon-Placette, C.; Fossdal, C.G.; Mirouze, M.; Marcos, J.G.; Fluch, S.; Fraga, M.F.; Guevara, M.A.; Abarca, D.; et al. Epigenetic regulation of adaptive responses of forest tree species to the environment. Ecol. Evol. 2013, 3, 399–415. [Google Scholar] [CrossRef]
  13. Beghè, D.; Ganino, T.; Dall’Asta, C.; Silvanini, A.; Cirlini, M.; Fabbri, A. Identification and characterization of ancient Italian chestnut using nuclear microsatellite markers. Sci. Hortic. 2013, 164, 50–57. [Google Scholar] [CrossRef]
  14. Allen, C.D.; Breshears, D.D.; McDowell, N.G. On underestimation of global vulnerability to tree mortality and forest die-off from hotter drought in the Anthropocene. Ecosphere 2015, 6, 1–55. [Google Scholar] [CrossRef]
  15. Cannizzaro, S.; Corinto, G.L. The role of monumental trees in defining local identity and in tourism. A case study in the Marches Region. Geoprog. J. (S Humanit. 1) 2014, 1, 29–48. [Google Scholar]
  16. Ciaffi, M.; Alicandri, E.; Vettraino, A.M.; Paolacci, A.R.; Tamantini, M.; Tomao, A.; Agrimi, M.; Kuzminsky, E. Conservation of veteran trees within historical gardens (COVE): A case study applied to Platanus orientalis L. in central Italy. Urban For. Urban Green. 2018, 34, 336–347. [Google Scholar] [CrossRef]
  17. Díez, C.; Trujillo, I.; Barrio, E.; Belaj, A.; Diego, B.; Rallo, L. Centennial olive trees as a reservoir of genetic diversity. Ann. Bot. 2011, 108, 797–807. [Google Scholar] [CrossRef] [PubMed] [Green Version]
  18. Barazani, O.; Westberg, E.; Hanin, N.; Dag, A.; Kerem, Z.; Tugendhaft, Y.; Hmidat, M.; Hijawi, T.; Kadereit, J.V. A comparative analysis of genetic variation in rootstocks and scions of old olive trees—A window into the history of olive cultivation practices and past genetic variation. BMC Plant Biol. 2014, 14, 146. [Google Scholar] [CrossRef] [Green Version]
  19. Anestiadou, K.; Nikoloudakis, N.; Hagidimitriou, M.; Katsiotis, A. Monumental olive trees of Cyprus contributed to the establishment of the contemporary olive germplasm. PLoS ONE 2017, 12, e0187697. [Google Scholar] [CrossRef] [Green Version]
  20. Pereira-Lorenzo, S.; Ramos-Cabrer, A.M.; Barreneche, T.; Mattioni, C.; Villani, F.; Díaz-Hernández, B.; Martín, L.M.; Robles-Loma, A.; Cáceres, Y.; Martín, A. Instant domestication process of European chestnut cultivars. Ann. App. Biol. 2018, 174, 74–85. [Google Scholar] [CrossRef] [Green Version]
  21. Mattioni, C.; Martin, M.A.; Pollegioni, P.; Cherubini, M.; Villani, F. Microsatellite markers reveal a strong geographical structure in European populations of Castanea sativa (Fagaceae): Evidence for multiple glacial refugia. Am. J. Bot. 2013, 100, 951–961. [Google Scholar] [CrossRef] [Green Version]
  22. Krebs, P.; Pezzatti, G.B.; Beffa, G.; Tinner, W.; Conedera, M. Revising the sweet chestnut (Castanea sativa Mill.) refugia history of the last glacial period with extended pollen and macrofossil evidence. Quat. Sci. Rev. 2019, 206, 111–128. [Google Scholar] [CrossRef]
  23. Roces-Díaz, J.V.; Jiménez-Alfaro, B.; Chytrý, M.; Díaz-Varela, E.R.; Álvarez-Álvarez, P. Glacial refugia and mid-Holocene expansion delineate the current distribution of Castanea sativa in Europe. Palaeogeogr. Palaeoclimatol. Palaeocl. 2018, 491, 152–160. [Google Scholar] [CrossRef] [Green Version]
  24. Conedera, M.; Krebs, P.; Tinner, W.; Pradella, M.; Torriani, D. The cultivation of Castanea sativa (Mill.) in Europe, from its origin to its diffusion on a continental scale. Veg. Hist. Archaeobot. 2004, 13, 161–179. [Google Scholar] [CrossRef] [Green Version]
  25. Gross, B.L.; Henk, A.D.; Richards, C.M.; Fazio, G.; Volk, G.M. Genetic diversity in Malus X domestica (Rosaceae) through time in response to domestication. Am. J. Bot. 2014, 101, 1770–1779. [Google Scholar] [CrossRef] [PubMed]
  26. Mellano, M.G.; Beccaro, G.L.; Donno, D.; Torello Marinoni, D.; Boccacci, P.; Canterino, S.; Cerutti, A.K.; Bounous, G. Castanea spp. biodiversity conservation: Collection and characterization of the genetic diversity of an endangered species. Gen. Res. Crop Evol. 2012, 59, 1727–1741. [Google Scholar] [CrossRef]
  27. Kalia, R.K.; Rai, M.K.; Kalia, S.; Singh, R.; Dhawan, A.K. Microsatellite markers: An overview of the recent progress in plants. Euphytica 2010, 177, 309–334. [Google Scholar] [CrossRef]
  28. Mason, A.S. SSR genotyping. In Plant Genotyping; Methods in Molecular Biology Book Series; Humana Press: New York, NY, USA, 2015; Volume 1245, pp. 77–89. [Google Scholar] [CrossRef]
  29. Rojaora Om, P.; Mosseler, A. Challenges and opportunities for conservation of forest genetic resources. Euphytica 2001, 118, 197–212. [Google Scholar] [CrossRef]
  30. Holderegger, R.; Kamm, U.; Gugerli, F. Adaptive vs. neutral genetic diversity: Implications for landscape genetics. Landsc. Ecol. 2006, 21, 797–807. [Google Scholar] [CrossRef] [Green Version]
  31. Dumolin-Lapegue, S.; Demesure, B.; Fineschi, S.; Le, C.V.; Petit, R.J. Phylogeographic structure of white oaks throughout the European continent. Genetics 1997, 146, 1475–1487. [Google Scholar]
  32. Simeone, M.C.; Grimm, G.W.; Papini, A.; Vessella, F.; Cardoni, S.; Tordoni, E.; Piredda, R.; Franc, A.; Denk, T. Plastome data reveal multiple geographic origins of Quercus Group Ilex. PeerJ 2016, 4, e1897. [Google Scholar] [CrossRef] [PubMed] [Green Version]
  33. Lewingtown, A.; Parker, E. Ancient Trees: Trees that Live for 1000 Years; Collins and Brown Eds: London, UK, 2012; ISBN 9781849940580. [Google Scholar]
  34. Buck, E.J.; Hadonou, M.; James, C.J.; Blakesley, D.; Russell, K. Isolation and characterization of polymorphic microsatellites in European chestnut (Castanea sativa Mill.). Mol. Ecol. Notes 2003, 3, 239–241. [Google Scholar] [CrossRef]
  35. Marinoni, D.; Akkak, A.; Bounous, G.; Edwards, K.J.; Botta, R. Development and characterization of microsatellite markers in Castanea sativa (Mill.). Mol. Breed. 2003, 11, 127–136. [Google Scholar] [CrossRef]
  36. Steinkellner, H.; Lexer, C.; Turetschek, E.; Glössl, J. Conservation of (GA) n microsatellite loci between Quercus species. Molr Ecol. 1997, 6, 1189–1194. [Google Scholar] [CrossRef]
  37. Shaw, J.; Craddock, J.H.; Binkley, M.A. Phylogeny and Phylogeography of North American Castanea Mill. (Fagaceae) Using cpDNA Suggests Gene Sharing in the Southern Appalachians (Castanea Mill., Fagaceae). Castanea 2012, 77, 186–211. [Google Scholar] [CrossRef]
  38. Piredda, R.; Simeone, M.C.; Attimonelli, M.; Bellarosa, R.; Schirone, B. Prospects of barcoding the Italian wild dendroflora: Oaks reveal severe limitations to tracking species identity. Mol. Ecol. Resour. 2011, 11, 72–83. [Google Scholar] [CrossRef]
  39. Chapuis, M.P.; Estoup, A. Microsatellite null alleles and estimation of population differentiation. Mol. Biol. Evol. 2007, 24, 621–631. [Google Scholar] [CrossRef] [Green Version]
  40. Meirmans, P.; Tienderen, P. GENOTYPE and GENODIVE: Two programs for the analysis of genetic diversity of asexual organisms. Mol. Ecol. Notes 2004, 4, 792–794. [Google Scholar] [CrossRef]
  41. Peakall, R.; Smouse, P.E. GenAlEx 6.5: Genetic analysis in Excel. Population genetic software for teaching and research—An update. Bioinformatics 2008, 28, 2537–2539. [Google Scholar] [CrossRef] [Green Version]
  42. Kalinowski, S.T. HP-RARE 1.0: A computer program for performing rarefaction on measures of allelic richness. Mol. Ecol. Notes 2005, 5, 187–189. [Google Scholar] [CrossRef]
  43. Weir, B.S.; Cockerham, C.C. Estimating F-statisticsfor the analysis of population structure. Evolution 1984, 38, 1358–1370. [Google Scholar] [PubMed]
  44. Exoffier, L.; Laval, G.; Schneider, S. Arlequin version (3.0): An integrated software package for population genetics data analysis. Evol. Bioinfor. 2005, 1, 47–50. [Google Scholar] [CrossRef] [Green Version]
  45. Nei, M. Analysis of gene diversity in subdivided populations. Proc. Natl. Acad. Sci. USA 1973, 70, 3321–3323. [Google Scholar] [CrossRef] [PubMed] [Green Version]
  46. Pritchard, J.K.; Wen, W. Documentation for STRUCTURE Software Version 2.3.4; Department of Human Genetics, University of Chicago: Chicago, II, USA, 2009. [Google Scholar] [CrossRef]
  47. Falush, D.; Stephens, M.; Pritchard, J.K. Inference of population structure using multilocus genotype data: Dominant markers and null alleles. Mol. Ecol. Notes 2007, 7, 574–578. [Google Scholar] [CrossRef] [PubMed]
  48. Hubisz, M.J.; Falush, D.; Stephens, M.; Pritchard, J.K. Inferring weak population structure with the assistance of sample group information. Mol. Ecol. Resour. 2009, 9, 1322–1332. [Google Scholar] [CrossRef] [Green Version]
  49. Evanno, G.; Regnaut, S.; Goudet, J. Detecting the number of clusters of individuals using the software STRUCTURE: A simulation study. Mol. Ecol. 2005, 14, 2611–2620. [Google Scholar] [CrossRef] [Green Version]
  50. Earl, D.A.; von Holdt, B.M. STRUCTURE HARVESTER: A Website and Program for Visualizing STRUCTURE Output and Implementing the Evanno Method. Conserv. Genet. Resour. 2012, 4, 359–361. [Google Scholar] [CrossRef]
  51. Jakobsson, M.; Rosenberg, N.A. CLUMPP: A cluster matching and permutation program for dealing with label switching and multimodality in analysis of population structure. Bioinformatics 2007, 23, 1801–1806. [Google Scholar] [CrossRef] [Green Version]
  52. Rosenberg, N.A. DISTRUCT: A program for the graphical display of population structure. Mol. Ecol. Notes 2004, 4, 137–138. [Google Scholar] [CrossRef]
  53. Mattioni, C.; Martín, A.; Chiocchini, F.; Cherubini, M.; Gaudet, M.; Pollegioni, P.; Velichkov, I.; Jarman, R.; Chambers, F.; Paule, L.; et al. Landscape genetics structure of European sweet chestnut (Castanea sativa Mill): Indications for conservation priorities. Tree Genet. Genomes 2017, 13, 39–52. [Google Scholar] [CrossRef]
  54. Tamura, K.; Stecher, G.; Peterson, D.; Filipski, A.; Kumar, S. MEGA6: Molecular Evolutionary Genetics Analysis version 6.0. Mol. Biol. Evol. 2013, 30, 2725–2729. [Google Scholar] [CrossRef] [PubMed] [Green Version]
  55. Librado, P.; Rozas, J. DnaSP v5: A software for comprehensive analysis of DNA polymorphism data. Bioinformatics 2009, 25, 1451–1452. [Google Scholar] [CrossRef] [PubMed] [Green Version]
  56. Posada, D.; Crandall, K.A. Selecting the Best-Fit Model of Nucleotide Substitution. Syst. Biol. 2011, 50, 580–601. [Google Scholar] [CrossRef]
  57. Zapponi, L.; Mazza, G.; Farina, A.; Fedrigoli, L.; Mazzocchi, F.; Roversi, P.F.; Peverieri, G.S.; Mason, F. The role of monumental trees for the preservation of saproxylic biodiversity: Re-thinking their management in cultural landscapes. Nat. Conserv. 2017, 19, 231–243. [Google Scholar] [CrossRef] [Green Version]
  58. Gellini, R.; Grossoni, P. Botanica Forestale; CEDAM: Padova, Italy, 1997; ISBN 8813202601. [Google Scholar]
  59. Larson, D.W.; Matthes, U.; Gerrath, J.A.; Larson, N.W.K.; Gerrath, J.M.; Nekola, J.C.; Walker, G.L.; Porembski, S.; Charlto, A. Evidence for the widespread occurrence of ancient forests on cliffs. J. Biogeogr. 2001, 27, 319–321. [Google Scholar] [CrossRef]
  60. Piovesan, G.; Biondi, F.; Baliva, M.; Dinella, A.; Di Fiore, L.; Marchiano, V.; Presutti, S.E.; de Vivo, G.; Schettino, A.; di Filippo, A. Tree growth patterns associated with extreme longevity: Implication for ecology and conservation of primeval trees in Mediterranean mountains. Anthropocene 2019, 26, 100199. [Google Scholar] [CrossRef]
  61. Douaihy, B.; Saliba, C.; Stefan, J.; Simeoni, M.C.; Cardoni, S.; Frahat, P.; Bou Dagher Kharrat, M. Traking diversity and evolutionary pathways of Lebanese oak taxa through plastome analyses. Bot. Lett. 2020, 167, 315–330. [Google Scholar] [CrossRef]
  62. Poli, I. Alberi Monumentali Della Garfagnana; Storia e Mitologia; Pacini Fazzi, M., Ed.; Pacini Fazzi: Lucca, Italy, 2014; ISBN 978-88-6550378-2. [Google Scholar]
  63. Muir, G.; Lowe, A.J.; Fleming, C.C.; Vogl, C. High nuclear genetic diversity, high levels of outcrossing and low differentiation among remnant populations of Quercus petraea at the margin of its range in Ireland. Ann. Bot. 2004, 93, 691–697. [Google Scholar] [CrossRef] [Green Version]
  64. Li, X.; Dane, F. Comparative chloroplast and nuclear DNA analysis of Castanea species in the southern region of the USA. Tree Genet. Genomes 2013, 9, 107–116. [Google Scholar] [CrossRef]
  65. Gismondi, A.; di Marco, G.; Delorenzo, M.; Canini, A. Upgrade of Castanea sativa (Mill.) genetic resources by sequencing of barcode markers. J. Genet. 2015, 94, 519–524. [Google Scholar] [CrossRef]
  66. Lahaye, R.; van der Bank, M.; Bogarin, D.; Warner, J.; Pupulin, F.; Gigot, G.; Maurin, O.; Duthoit, S.; Barraclough, T.G.; Savolainen, V. DNA barcoding the floras of biodiversity hotspots. Proc. Natl. Acad. Sci. USA 2008, 105, 2923–2928. [Google Scholar] [CrossRef] [PubMed] [Green Version]
  67. Newmaster, S.G.; Fazekas, A.J.; Steeves, R.A.; Janovec, J. Testing candidate plant barcode regions in the Myristicaceae. Mol. Ecol. Resour. 2008, 8, 480–490. [Google Scholar] [CrossRef]
  68. Fineschi, S.; Taurchini, D.; Villani, F.; Vendramin, G.G. Chloroplast DNA polymorphism reveals little geographical structure in Castanea sativa Mill. (Fagaceae) throughout southern European countries. Mol. Ecol. 2000, 9, 1495–1503. [Google Scholar] [CrossRef]
  69. Krebs, P.; Conedera, M.; Pradella, M.; Torriani, D.; Felber, M.; Tinner, W. Quaternary refugia of the sweet chestnut (Castanea sativa Mill.): An extended palynological approach. Veg. Hist. Archaeobot. 2004, 13, 145–160. [Google Scholar] [CrossRef] [Green Version]
Figure 1. Principal coordinates analysis (PCoA) of large old chestnut trees from four different region situated in Central and Southern Italy.
Forests 11 01118 g001
Figure 2. Estimated genetic structure (A) the large old trees and (B) large old trees and natural population living in the proximity. The different gene pools are revealed by STRUCTURE analysis, using the admixture model for ΔK = 2. Each individual is represented by vertical lines; groups of individuals are separated by vertical black lines. Different colors in the same line indicate the individuals’ estimated membership percentage in the K clusters (Q values). Orange = cluster I; Purple = cluster II.
Forests 11 01118 g002
Figure 3. Plastid haplotype network of the combined trnH-psbA + trnK-matK regions in 47 chestnut trees (26 giant old trees + 21 ordinary trees from close-by natural populations). H1–H10: haplotypes; I, II and III: haplotype lineages. Haplotype size is proportional to the number of included samples; line thickness is according to the number of mutations separating each haplotype.
Forests 11 01118 g003
Table 1. Large old chestnuts analyzed in this study.
IDTraditional Name *RegionGeographical AreaCollected SamplesLatitudeLongitudeTrunk Circumference (in Meters)
1“Nave”SicilySouthern Italy3 canopy377.544151.31120
2“Cento Cavalli”SicilySouthern Italy4 canopy377.501151.30422
3“Castagno Vespa”SicilySouthern Italy1 canopy376.802150.820
4 SicilySouthern Italy1 canopy375.139140.2527.3
5 SicilySouthern Italy1 canopy385.139150.2604.7
6“Castagno Ruossa”SicilySouthern Italy1 canopy373.860150.1205.7
7 SicilySouthern Italy1 canopy374.438150.4894.0
8 SicilySouthern Italy1 canopy374.432150.5063.5
9 SicilySouthern Italy1 root suckers, 1 top canopy374.438150.4895.5
10 SicilySouthern Italy1 canopy377.625150.9219
11 SicilySouthern Italy1 canopy374.574150.9216.10
12 SicilySouthern Italy1 root suckers, 1 canopy374.591150.6314.5
13 SicilySouthern Italy1 canopy374.521150.6565.7
14 CalabriaSouthern Italy1 root suckers, 1 canopy381.749160.2199.50
15 CalabriaSouthern Italy1 root suckers, 1 canopy381.749160.2215.40
16 CalabriaSouthern Italy1 root suckers, 1 canopy381.741160.2196.90
17 CalabriaSouthern Italy2 canopy381.781160.2636.40
18 CalabriaSouthern Italy1 root suckers, 2 top canopy381.781160.265700
19 CalabriaSouthern Italy1 root suckers, 2 top canopy381.777160.264>5
20 CalabriaSouthern Italy1 root suckers, 1 top canopy384.742163.2936.00
21 CalabriaSouthern Italy1 root suckers, 1 top canopy384.738163.2859.80
22 CalabriaSouthern Italy1 root suckers, 1 top canopy384.745163.3046
23 CalabriaSouthern Italy1 canopy384.744163.3065.8
24 CalabriaSouthern Italy1 canopy384.749163.3046.7
25 CalabriaSouthern Italy1 root suckers, 1 canopy390.410167.2279.3
26 CalabriaSouthern Italy1 canopy390.406167.2366.7
27 CalabriaSouthern Italy1 root suckers, 1 canopy390.412167.2378.5
28 CalabriaSouthern Italy1 root suckers, 1 canopy390.402167.2249.1
29 CalabriaSouthern Italy1 canopy390.377167.2577.9
30 CalabriaSouthern Italy1 root suckers, 1 canopy393.051166.5696.5
31 CalabriaSouthern Italy1 root suckers, 1 canopy391.530163.7038.6
32 CalabriaSouthern Italy1 root sucker, 1 canopy391.530163.7048.3
33 CalabriaSouthern Italy1 root suckers, 1 canopy391.529163.7026.2
34 CalabriaSouthern Italy1 canopy391.945161.1286.7
35 CalabriaSouthern Italy1 root sucker397.257159.0618.5
36 CalabriaSouthern Italy1 root sucker397.256159.06213.3
37 CalabriaSouthern Italy1 root sucker, 1 canopy397.254159.0628.7
38 CalabriaSouthern Italy1 root sucker, 1 canopy397.264158.9545.7
39 LatiumCentral Italy1 root sucker, 1 canopy427.035119.181>5
40 UmbriaCentral Italy1 canopy425.153120.7047.42
41 UmbriaCentral Italy1 canopy423.826122.1226.50
42 UmbriaCentral Italy1 canopy422.724123.5456.30
43 UmbriaCentral Italy1 canopy422.948124.1488.80
44 UmbriaCentral Italy1 root sucker, 1 canopy422.948124.1487.43
45 UmbriaCentral Italy1 root sucker, 1 canopy422.95412.4137.74
46 UmbriaCentral Italy1 root sucker, 1 canopy424.986126.9107.50
47 UmbriaCentral Italy1 root sucker, 1 canopy422.955124.1278.65
48 UmbriaCentral Italy1 canopy422.905124.1528.45
49 UmbriaCentral Italy1 canopy426.512126.9435.3
50 UmbriaCentral Italy1 canopy426.511126.943>5
51 UmbriaCentral Italy1 canopy426.507126.943>5
52 UmbriaCentral Italy1 canopy426.533126.943>5
53 UmbriaCentral Italy1 root sucker, 1 canopy426.598126.9445.8
54 UmbriaCentral Italy1 root sucker, 1 canopy426.493126.9426.0
55 UmbriaCentral Italy1 root sucker, 1 canopy427.342127.9545.3
56 UmbriaCentral Italy1 root sucker, 1 canopy426.286126.9977.7
57 UmbriaCentral Italy1 canopy426.288126.6928.1
58 UmbriaCentral Italy1 canopy426.291127.0109.2
59 UmbriaCentral Italy1 canopy426.294127.0137.2
60 UmbriaCentral Italy1 root sucker, 2 canopy427.393127.9125.20
61 TuscanyCentral Italy1 root sucker, 1 canopy430.301110.9456.2
62 TuscanyCentral Italy1 root sucker, 1 canopy430.276110.9497.0
63 TuscanyCentral Italy1 root sucker, 1 canopy430.282110.9448.0
64 TuscanyCentral Italy1 root sucker, 1 canopy431.660109.9357.20
65 TuscanyCentral Italy1 root sucker, 1 canopy431.664109.9347.8
66“Miraglia”TuscanyCentral Italy1 root sucker, 1 canopy455.715114.4158.5
67 TuscanyCentral Italy1 root sucker, 1 canopy436.007119.7229.6
68 TuscanyCentral Italy1 root sucker43.600119.7147.0
69 TuscanyCentral Italy1 root sucker436.012119.7187.0
70 TuscanyCentral Italy1 root sucker, 1 canopy440.784103.3117.3
71 TuscanyCentral Italy1 canopy440.791103.3145.50
72 TuscanyCentral Italy1 root sucker, 1 canopy440.780103.3108.0
73“Roggio”TuscanyCentral Italy1 root sucker, 1 canopy440.222101.80910.0
74 TuscanyCentral Italy1 root sucker, 1 canopy442.230103.5008.40
75“Prato Maleta”TuscanyCentral Italy1 root sucker, 1 canopy442.244103.5399.6
76 TuscanyCentral Italy1 root sucker, 1 canopy442.237103.5126.5
77 TuscanyCentral Italy1 root sucker, 1 canopy442.240103.50910.0
78 TuscanyCentral Italy1 root sucker, 1 canopy442.246103.5149.0
79 TuscanyCentral Italy2 canopy442.232103.4918.8
80“Prato Fosco”TuscanyCentral Italy1 canopy441.748104.7128.2
81“Volpiglione”TuscanyCentral Italy1 root sucker, 1 canopy441.725104.7338.5
82 TuscanyCentral Italy1 root sucker, 1 canopy441.727104.73110
83 TuscanyCentral Italy1 root sucker, 1 canopy441.773104.6708.2
84“Marchi”TuscanyCentral Italy1 root sucker, 1 canopy441.082105.26210.5
85 TuscanyCentral Italy1 root sucker, 1 canopy441.079105.2628.0
86 TuscanyCentral Italy1 root sucker, 1 canopy441.075101.0537.5
87 TuscanyCentral Italy1 top canopy441.060105.36811.0
88 TuscanyCentral Italy1 root sucker, 1 canopy441.061105.36510.0
89 TuscanyCentral Italy1 root sucker, 1 canopy441.059105.3669.20
90 TuscanyCentral Italy1 root sucker, 1 canopy441.055105.3698.20
91 TuscanyCentral Italy1 canopy441.063105.3699.20
92 TuscanyCentral Italy1 root sucker, 1 top canopy441.068105.3748.20
93 TuscanyCentral Italy1 root sucker, 1 top canopy441.077105.37410.0
94 TuscanyCentral Italy1 root sucker, 1 top canopy441.077105.366
95 TuscanyCentral Italy1 root sucker, 1 top canopy441.078105.2679.40
96 TuscanyCentral Italy1 root sucker, 1 top canopy441.089105.2698.0
97 TuscanyCentral Italy1 root sucker, 1 top canopy441.094105.2707.20
98 TuscanyCentral Italy1 root sucker, 1 top canopy441.061105.2617.30
99 TuscanyCentral Italy1 root sucker, 1 top canopy441.058105.2626.15
* Given the long history of these ancient trees, to some of them have been given a proper name (Traditional name).
Table 2. Genetic diversity indices of the nine genomic microsatellites (SSRs) used in this study.
LocusNaNeHoHeuHeFis
CsCAT193.250.800.750.77−0.134
CsCAT2167.430.830.900.910.069
CsCAT3275.950.780.880.890.082
CsCAT6166.110.820.880.890.042
CsCAT1453.200.680.710.710.029
CsCAT1672.800.670.680.68−0.019
EMCs1582.970.530.700.710.228 **
EMCs38156.080.810.880.890.058 *
QrZAG741.690.240.450.460.422 **
Mean11.884.400.680.750.760.088
Na = number of alleles; Ne = number effective of alleles; Ho = observed heterozygosity; He = expected heterozygosity, uHe = unbiased heterozygosity; Fis = fixation index. * p < 0.05; ** p < 0.01.
Table 3. Genetic diversity of large old trees grouped for collection sites: Sicily, Calabria, Lazio –Umbria, Tuscany.
Sampling SiteN GenotypesNaNeHoHeuHeFisArPar
Sicily136.114.190.650.690.710.0816.110.59
Calabria308.444.560.650.730.740.089 *6.910.91
Lazio-Umbria207.674.920.710.710.73−0.0016.880.75
Tuscany439.224.470.730.740.750.0416.771.06
Total106
Mean 7.864.530.680.710.730.0526.670.82
N = number of genotypes; Na = number of alleles, Ne = effective number of allele; Ho = observed heterozygosity; He = expected heterozygosity; uHe = unbiased heterozygosity; Fis = fixation index; Ar = allelic richness; Par = private allelic richness. * p < 0.05.
Table 4. cpDNA markers main diversity values in the investigated dataset consisting of 47 chestnut individuals.
MarkerLGaps (Min-Max)p (Min-Max)EtaSPiTheta (Per Site)PICsHHd
trnH-psbA5283 (1–7)(0.00–0.01)1460.00090.0026160.6772
trnK-matK6381 (1)(0.00–0.006)540.00090.0014340.3377
Joined markers11664 (1–7)(0.00–0.006)19100.00090.0024100.7428
L = Aligned length (bp), Gaps = total number of recorded gaps (nucleotide range), p = uncorrected p-distance range, Eta = Total number of polymorphic sites, S = Number of polymorphic (segregating) sites; Pi = Nucleotide diversity, Theta = Nucleotide polymorphism (from Eta), PICs = Number of Parsimony Informative Characters, H = Number of identified haplotypes (with gaps included), Hd = haplotype diversity.
Publisher’s Note: MDPI stays neutral with regard to jurisdictional claims in published maps and institutional affiliations.

