Abstract
Widely distributed across Quebec, balsam fir (Abies balsamea (L.) Mill) is highly vulnerable to wind damage. The harsh winter conditions, freezing temperatures, and snow pose an additional risk. It is important to find the mechanical loads experienced by trees during winter to adapt forest management and minimize the risk of damage to this species. Many studies have been carried out on wind and snow loading damage risks in Northern Europe, mostly based on post-storm damage inventories. However, no study has continuously monitored the applied turning moment during a period with snow loading, and no study has investigated wind and snow loading on balsam fir. Therefore, our main objective was to conduct a pioneering study to see how trees bend under wind loading during winter, and to see how snow cover on the canopy contributes to the loading. Two anemometers placed at canopy height and 2/3 canopy height, air and soil temperature sensors, a hunting camera, and strain gauges attached to the trunks of fifteen balsam fir trees, allowed us to measure the wind and snow induced bending moments experienced by the trees together with the meteorological conditions. Data were recorded at a frequency of 5 Hz for more than 2000 h during summer 2018 and winter 2019. Two mixed linear models were used to determine which tree and stand parameters influence the turning moment on the trees and evaluate the effect of winter. The selected model for measurements made during winter found that including the snow thickness on crowns was better than those models that did not consider the effect of snow (ΔAICc > 25), but the effect of snow depth on the bending moment appears to be minor. However, overall, the turning moment experienced by trees during winter was found to be higher than the turning moment experienced at the same wind speed in summer. This is probably a result of increases in the rigidity of the stem and root system during freezing temperatures and the change in wind flow through the forest due to snow on the canopy and on the ground during the winter season.
Keywords:
windthrow; wind damage; snow monitoring; boreal forests; modeling; turning moment; wind loading; balsam fir; season 1. Introduction
In Québec province, Canada, windthrow events in balsam fir (Abies balsamea (L.) Mill) stands can be considered as a significant source of disturbance and economic losses [1], and are known to be linked to forest management [2]. To improve forest management in these stands and mitigate the wind damage risk, the stability and vulnerability of balsam fir trees has been studied as a consequence of different types of thinning [3,4] and an existing British wind risk model: ForestGALES [5,6] has been tested, adapted, and improved to provide a decision support tool for forest managers [3,4,7,8].
During winter, freezing temperatures and snow cover are known to have an additional impact on wind damage. The ForestGALES model allows for the addition of snow in the calculation of the critical wind speed at which a tree will uproot or break. Snow is represented as an additional weight in the crown, changing the moment due to the overhanging crown mass when the tree is bent by the wind, and therefore increasing the turning moment applied to the trunk. However, what happens in a stand during winter is much more complex than this simple representation. In balsam fir forests, winter and snow cover can last for 6 to 7 months and snow can reach more than 200 cm depth. This thick layer of snow and ice produces a change in the wind profile as the snow offers less aerodynamic resistance to wind than ground vegetation and, therefore, the rate of change in wind speed is probably larger at ground level during the winter season [9]. In the canopy, snow accumulates on branches and can form large clumps of snow and ice. The weight of the snow pressing on the branches causes a change in the shape of the crowns and a decrease in the canopy porosity likely to influence the stand wind profile as well. This snow loading of tree crowns combined with freezing temperatures can cause severe damages to trees, such as stem bending or stem breakage, but rarely uprooting, as frozen temperatures increases stem stiffness [10,11], and as the weight of the snow cover on the soil, and/or frozen soil, reinforce the root system [12].
Most of the studies conducted on wind, snow, and conifers are from Northern Europe, and are based on long-term damage surveys. What is known from these studies is that the factors that most influence winter breakage or uprooting are related to tree shape and stand characteristics [13]. More specifically, stem taper [10,14,15], crown characteristics [12], and the number of neighboring trees [16] are the most important factors controlling the stability of trees in winter. In relation to this, the choice of thinning carried out in the stands seems to be crucial in their management with an increase in wind and snow damage risk following thinning in a stand [17,18].
There are to date no studies on the impact of snow intercepted by the canopy on the turning moment experienced by trees during wind loading, or any study of winter impact on wind damage in balsam fir stands, creating a lack of knowledge about winter damages in boreal stands in Northeastern America. This gap in knowledge means that we currently are not able to model what is happening in winter, or to estimate the potential impact of snow on the level of wind damage risk. Therefore, improving knowledge in this area is essential to improve the decision making process for forest management [13]. Our measurements are the first to directly measure wind and snow loading on trees during winter.
The overall hypotheses for the study were:
- (1)
- The additional weight of the snow on the crown will increase the lever arm on the trunk, and trees will experience an increased turning moment at a particular wind speed with an increase of snow thickness in their crowns compared to when there is no snow in the crown.
- (2)
- The large negative temperatures will stiffen the trunk because of freezing, therefore trees will experience a globally lower turning moment at a particular wind speed in winter compared to during the summer because the crowns move less.
The first hypothesis deals specifically with the effect of snow and the second hypothesis with the effect of freezing temperatures.
2. Materials and Methods
This article was written as a continuation of a previous study at the same site for summer only conditions [4]. To reduce the length of the text and avoid redundancy, we refer to Duperat et al. [4] when additional information on methods is required. All data were treated and analyzed within the R program [19] with the help of the Tidyverse packages [20]. The key R packages are mentioned in the relevant paragraphs, the data and R scripts are available and linked to this article.
2.1. Stand and Climate
The study was conducted in the Université Laval Montmorency Experimental Forest (47°16′13.0″ N 71°09′24.1″ W), 80 km north of Québec City in the Laurentian Hills of the Canadian Shield. Average annual temperature, total precipitation, and snowfall precipitation are respectively 0.5 °C, 1583 mm, and 619 cm. Average annual wind speed is 6.9 km/h and wind direction is mainly from the northwest [21]. Typical of a polar subcontinental climate, snow cover persists from mid-October to the end of May. The study area is located in the eastern section of the balsam fir/white birch (Betula papyrifera Marsh.) bio-climatic domain of central Québec [22].
The study stand is a 38-year-old balsam fir dominated stand originating from natural regeneration after clearcutting in 1982. It was treated by pre-commercial thinning in 1992. It is composed of balsam fir, black spruce (Picea mariana (Mill.)), and white birch. Stand mean height is around 8 m and mean diameter at breast height (DBH, in m) measured at 1.3 m is 12 cm. The study is concentrated on a 0.13 ha circular portion of the stand. Tree density is 1450 stems per hectare and the trees are heterogeneously distributed within the stand. There is a lot of regeneration and an intermittent stream crosses the stand near its center, creating a treeless linear gap. The stand is located on a north-facing gentle slope with minor variations in the surface of 1–2 m creating dips and raised areas where the trees can be located. Elevation is around 745 m and soil is a glacial till with a sandy loam texture. The site is mesic and has moderate drainage. The field work for this study was carried out between summer 2017 and winter 2019. The stand studied was selected partly according to logistical constraints, as described in Duperat et al. [4]
2.2. Sample Trees
During the summer of 2017, tree height and DBH were measured on all the trees within the study area. As sample trees, we selected 15 balsam firs showing no visible symptoms of disease or crown discoloration. The sample trees were sufficiently spaced from each other to avoid direct competition between them. Within the possibilities left by the location constraints, the fifteen trees were chosen across the whole range of diameter present in the stand. Height (H, in m), crown width (CrownW, in m), crown depth (CrownD, in m), and DBH were recorded to characterize sample tree morphology. Two types of competitors, commercial (DBH > 9.8 cm) and non-commercial (5 < DBH < 9.8 cm), were counted when positioned within a 4 m radius from the sample tree. Six competition indices, known to be relevant in the context of wind and snow damage [23,24], have been calculated with these parameters [4]. In addition, the ratio of the CBAL competition index to the tree basal area (BA) = CIB was included. All the information concerning morphological criteria, competition indices, and number of close competitors of the sample trees are summarized in Table 1, and the competition indices are detailed in Appendix A. Note that trees a10, a13, and a14 are missing. For the a10 tree and a13 tree, one of their strain transducers broke and we were not able to repair it quickly enough to incorporate the data from these trees into our analyses. For the a14 tree, the sensor wires snapped under pressure from the huge amount of snow on the ground. Analyses were therefore conducted with 12 trees instead of 15. Since all the analysis will be made at the individual tree level, each sample tree is effectively an experimental unit.

Table 1.
Sample trees variables: morphological criteria, competition indices, and number of close competitors.
2.3. Instrumentation
2.3.1. Anemometers and Wind Speed
To measure weather conditions within the stand, a 10-m-high aluminum tower (T35, Aluma Tower Company, Vero Beach, FL, USA) was installed in the forest at the edge of our sampling area. Wind speed and direction were measured at a frequency of 5 Hz by two 05103-L Wind Monitor Young anemometers (Campbell Scientific, Edmonton, AB, Canada), the first one fixed at canopy height, and the second one at 2/3 canopy height. Air temperature and soil temperature were measured with two T107 sensors (Campbell Scientific, Edmonton, AB, Canada) at 30 min intervals. Data from the anemometers and temperature sensors were recorded using a CR5000 datalogger (Campbell Scientific, Edmonton, AB, Canada).
Due to the large amount of data collected, and following the existing literature [23] and our previous study [4], we decided to work with hourly mean wind speed data (ws, m·s−1) (Figure 1).
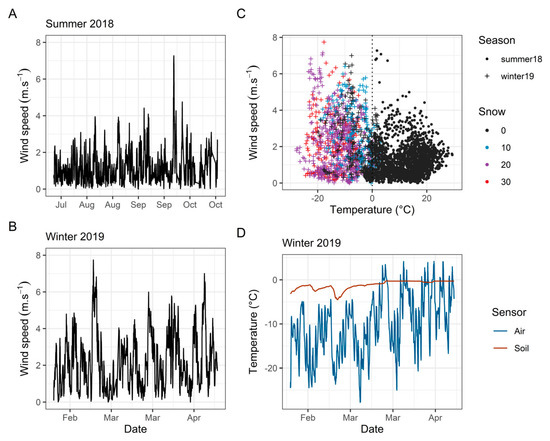
Figure 1.
Stand meteorological overview, with hourly mean wind speed data for summer 2018 (A) and winter 2019 (B), temperature and snow thickness (cm) for both seasons (C), and air and soil temperatures for winter 2019 (D).
2.3.2. Strain Gauges and Turning Moment
Wind loads were recorded on the sample trees during 83 days between July and October 2018 and 56 days between February and April 2019. On each sample tree, two strain transducers were orthogonally fixed on the trunk at two meters height on the north and east sides to minimize the thermal effects of the sun. The stain transducers allow measurement of the strain at the surface of the tree trunk when trees bend and they are described in detail in Duperat et al. [4]. To record the strain transducer signal (STS), we used a CR1000 datalogger (Campbell Scientific, Edmonton, AB, Canada) and two CDM-A116 multiplexors (Campbell Scientific, Edmonton, AB, Canada) connected to the datalogger by a SC-CPI (Campbell Scientific, Edmonton, AB, Canada). Recording frequency was 5 Hz. The whole experiment was powered by 8 solar panels (5 PowerMax Ultra 80-P, Shell, The Hague, The Netherlands and 3 SX80U, Solarex, Frederick, MD, USA) installed facing south in a clearcut located 70 m south from the tower. To convert measured strain to turning moment, the strain transducers mounted on the sample trees had to be individually calibrated by step pulling [29,30]. The method used to correctly carry out the pulling and calibration is fully described in previous studies [4,31]. Tree pulling calibration was carried out in summer 2018 and in winter 2019 to avoid a bias due to the large difference in temperature and tree trunk stiffness between the two seasons.
STS missing values were filled with the previous value, with a maximum of 5 missing values being filled. STS data were then converted into turning moment with the calibration coefficient obtained from the pulling test. Daily drifts caused by thermal variations were removed with a Butterworth highpass filter function from the “signal” package [32,33]. Once the data were cleaned, orthogonal turning moments were combined to produce a single turning moment for each tree. Then, we calculated the most probable extreme value experienced during each hour, by calculating the maximum hourly tuning moment (Mmax, Nm) with the Gumbel method [23,34]. Please refer to our previous article [4] for full details of the steps involved in the STS treatment.
2.3.3. Hunting Camera and Snow
To measure snow presence or absence on the crown, a HyperFire Reconyx HC500 hunting camera (RECONYX Inc., Holmen, WI, USA) was placed facing a number of crowns. The hunting camera took pictures of the crowns at 1 h intervals during the whole winter season. Each hunting camera picture was visually categorized as a function of the snow thickness (Snow) on the crown sample. The analysis leads to 4 different categories of Snow (0, 10, 20, and 30 cm snow depth) depending on the amount of snow on the branches and the presence of big pieces of snow and snow bridges between trees (Figure 1C and Figure 2).
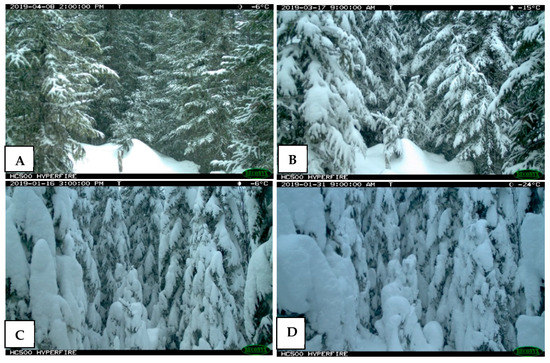
Figure 2.
Evaluation of the snow thickness on the crowns. (A) 0 [0–5 cm] traces of snow on the crowns; (B) 10 [5–15 cm] the snow sticks to the branches, the branches start to bend; (C) 20 [15–25 cm] snow clumps everywhere and the branches are fully bent; and (D) 30 [>25 cm] big snow clumps and bridges between trees.
2.4. Statistical Analysis
2.4.1. Effect of Snow Thickness in the Crowns of Balsam Fir on the Overall Turning Moment
To evaluate the impact of Snow on Mmax, a linear mixed model selection was made by using the ‘nlme’ and ‘AICcmodavg’ packages [35,36]. Only winter data, from February 2019 to April 2019, were used in this analysis. The response variable (Mmax) was log-transformed prior to the analyses to linearize the relation between it and our explanatory variables and to meet the assumptions of homoscedasticity and normality of the residuals. The model selection was made according to 3 steps: determine the best additional variables (Table 1) to the basic model, check the collinearity between the additional variables, and select the best model formulation to consider the relevance of the interaction terms.
Step 1: The variable selection was made by individually adding each available tree variable (all continuous, Table 1) to the fixed covariates: ws (continuous) and Snow (continuous) (Equation (1)). To consider repeated measurements among trees, tree was included as a random intercept in our models. We also included random slopes for ws and Snow as the effect of these two variables on Mmax could potentially vary among trees:
The models were compared using the Akaike information criterion (AICc) [37] and the ‘AICcmodavg’ package [36]. The tree variable of the models having a ΔAICc < 2 were kept for the following step. All the models and associated statistics are displayed in Table 2.
Table 2.
Snow thickness model selection.
Step 2: The retained tree variables from step 1 were: CBAL, DBH, CIB, CrownW, BA, and DBH2H. To verify the collinearity between these variables, they were tested two by two with a Pearson correlation test. As they were all correlated with each other at more than 50%, only one of these variables could be included in the final model. The variable with the smallest AICc was selected: CBAL.
Step 3: The model selection was made by testing all possible combinations of variables, and rational interactions between the fixed covariates: ws (continuous), Snow (continuous), and CBAL (continuous). As in step 1, the models were compared using an AICc comparison. The model with the smallest AICc was kept as best. The tested models and associated statistics are displayed in Table 2. Once the final model was selected, the model assumptions were verified by plotting residuals versus fitted values. We assessed the residuals for temporal dependency with an autocorrelation function.
2.4.2. Seasonal Differences in Wind Loads in Balsam Fir Stands
Wind Profile
Due to the high accumulation of snow in winter leading to a rise in ground level, it was decided to investigate if the anemometers recorded changes in the wind profile between the two seasons. The ‘openair’ package [38] was used to treat the wind speed and wind direction data in summer 2018 and winter 2019. The anemometer wind speed ratio between the top and middle anemometer was compared for each season by using the following linear regression:
Model Selection
A linear mixed model selection was made to assess the seasonal effect on turning moment. We decided to analyze our data following the same method as for the first hypothesis, by using the covariate Season (categorical with two levels), instead of Snow. Both Summer 2018 and Winter 2019 data were used in this analysis. In this case, the retained TreeVariable from step 1 were: C12 and CrownW (Table 3). Only one variable could be retained, as they were all correlated with each other (Pearson correlation coefficient >0.5). The variable with the smallest AICc was selected: C12. The tested models from step 3 and associated statistics are displayed in Table 3. Once the final model was selected, the model assumptions were verified by plotting residuals versus fitted values. We assessed the residuals for temporal dependency with an autocorrelation function.
Table 3.
Season model selection.
3. Results
3.1. Hypothesis 1: Effect of Snow Thickness in the Crowns of Balsam Fir on the Overall Turning Moment
The selected model (Table 2) is a mixed linear model, tree is used as random intercept, ws and Snow are used as random slope and the fixed covariates are ws (continuous), Snow (continuous), and CBAL (continuous). The interaction terms are ws × Snow, ws × CBAL, and Snow × CBAL (Equation (3)):
Model validation indicated no violation of assumptions about homoscedasticity and normality of residuals. The selected model results are displayed in the logarithmic original value in Table 4. The model presents a better AICc than models that do not consider the snow effect (ΔAICc > 104), meaning that the addition of Snow improves the model predictions and help in defining Mmax. However, the snow thickness on the crown, as well as the interaction including this covariate, have little influence on the predicted value of the maximum hourly turning moment.
Table 4.
Snow thickness model results.
3.2. Hypothesis 2: Seasonal Differences in Wind Loads in Balsam Fir Stands
3.2.1. Wind Profile
Wind speed during winter 2019 was stronger and the wind events were more frequent than during summer 2018, with a mean ws at canopy top of 2.21 m·s−1 and a calm percentage of 2%, in comparison to summer 2018 with values of 1.26 m·s−1 and 4.2%, respectively (Figure 3). The wind direction was similar, the main winds coming from the northwest. The linear regression carried out on the ratio between the top and middle anemometer shows an increase of 10% (±0.3, Adj.R2 = 0.883, pvalue < 0.01) of the wind speed ratio during winter, suggesting a clear impact of the snow on the wind profile.
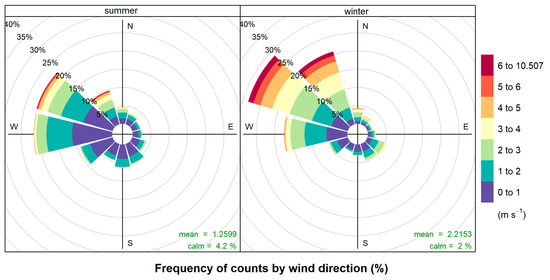
Figure 3.
Wind rose for summer 2018 and winter 2019 based on hourly mean wind speed and direction data.
3.2.2. Season Model Selection.
The selected model (Table 3, Equation (4)) is a mixed linear model, tree is used as random intercept, ws and Season are used as random slope and the fixed covariates are ws (continuous), Season (categorical with two levels), and C12 (continuous). The interaction term is ws x Season:
This model gives a much better AICc than models that do not consider the season effect (ΔAICc > 176), meaning that the addition of the variable Season increases the model quality. The fixed effects are not correlated with each other. The selected model results are displayed in the logarithmic original value in Table 5. Model validation indicated no violation of assumptions about homoscedasticity and normality of residuals. To allow a simpler interpretation of the results, the model’s predictions are displayed in Figure 4 after back transformation of the logarithms (these values are only provided for illustration purposes because this transformation introduces a bias in the values). As expected, the turning moment increases with the decrease in C12, a low C12 representing a tree with little surrounding competition and a high C12 representing a tree under a lot of competition. However, contrary to our hypothesis, the winter season also significantly increases the turning moment experienced by the trees. The turning moment therefore decreases with increasing competition and increases with increasing wind speed.
Table 5.
Season model results.
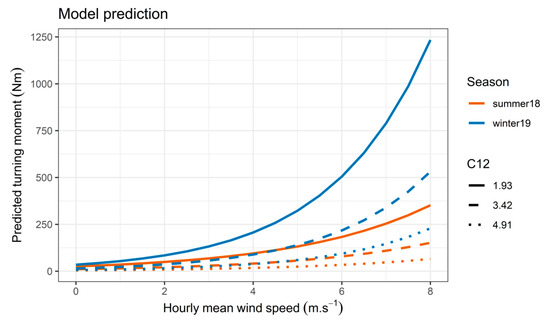
Figure 4.
Predicted turning moment during winter and summer as a function of C12. Turning moment values are only provided for illustration of competition and season because of the bias introduced in the back transformation of the logarithmic values
4. Discussion
Our results show that the turning moment experienced by the trees was highly influenced by season, with a turning moment globally higher in winter, but apparently not strongly influenced by the snow thickness on the crowns. These results go against our hypotheses which were that for a similar wind speed, trees experience a higher turning moment when snow is present on their crown, and globally lower turning moment in winter. The TreeVariables retained by our model selection also diverge between the two models. In the first model, including only the winter dataset, at least 4 TreeVariables could have been selected instead of the competition index CBAL. However, all these variables are interrelated, based on DBH, and relate to the social status of the tree in the forest. In the second model, which combines summer and winter datasets, the distance-dependent competition index C12 appears to be the key variable that links the seasons. There is thus a direct dependency of the maximum hourly turning moment on the local competition, which confirms Hale et al. [23] results, but also shows an influence of close competitors during the winter season.
Regarding the effect of snow thickness on the crown, care is needed with the interpretation of the results. The depth of snow on the crown does not seem to make a difference on the turning moment but the model selection for the winter dataset retained snow as a key variable. However, it is important to note that our way of monitoring the presence of snow on the crowns was not optimal. It was a first attempt to evaluate the effect of snow in the canopy on the turning moment in a practical way. Monitoring the presence of snow on the canopy is complicated by the structure of the canopy itself and the great variability in the interception of snow by the branches, as wind and temperature influence the moisture content of snow and therefore the degree of stickiness to the canopy [12]. Therefore, the accumulation of snow on trees sufficient to cause snow damage depends upon the quantity and type of snow [12] because the same snow thickness could result in two different weights on the branches. As the process of snow interception by trees is complex and involves components of throughfall, adhesion, cohesion, wind removal, sliding, melting, and vapor transport [39], further work is required to evaluate the additional load on trees due to snow.
Continuous monitoring of wind at two different height showed a significant change in the wind profile between summer and winter, with an increase in wind speed at both anemometer heights and reduced calm periods during winter. This is probably due to the presence of snow in winter, which changes the geometrical structure of the stand and therefore the wind profile. This finding supports the fact that deep snow cover also offers less aerodynamic resistance to the wind than ground covered by vegetation and regeneration [9].
The accumulation of a large amount of snow on the ground during the winter season, with depths up to 200 cm, also raises the effective level of the ground, while the trees themselves do not change in height and therefore have the same length of lever arm. As observed during fieldwork, the tree trunks remain free to move because their own radiation prevents snow from sticking to the trunk and creates a snow-free sleeve around the trunk down to the ground. The increase of the turning moment experienced by the trees in winter compared to summer for a similar wind speed could be due to several reasons. It might be due to increased stem stiffness due to freezing in the large negative temperatures or to increased root anchorage as the heavy snow depth during our data collection (130–150 cm depth) put a heavy load on the root system. It is quite possible that the root system in winter is completely locked in place by the snow cover and the frozen soil. The force of the wind on the tree would therefore be mostly applied to the trunk and with very little energy dissipated in the root system. In contrast, in summer, the soil is very wet, and the root system is more flexible, so some of the energy initiated in the trees by the wind is dissipated in the soil. In addition, the higher stiffness of stem and branches during winter decreases the streamlining under wind loads and, combined with a reduced crown porosity, the drag coefficient will be higher in winter. These are probably the two main reasons for the increase of the turning moment during winter.
An increase in the turning moment experienced by the trees, means an increased risk of stem breakage during winter season. With climate change, the relative importance of snow seasons against snow free seasons is likely to change, with an increase of unfrozen soil days during the windiest periods [40]. If the soil remains unfrozen and without deep snow cover during these windiest periods, this could lead to an increase in overturning during early and late winter, when strong winds are more frequent. It will be important in the near future to have reliable predictions of the future winter climate in Quebec. It will also be useful to study the root anchorage of trees during the pre-winter and winter periods by carrying out destructive tree winching at different temperatures and with different snow cover on the ground, to evaluate if the changes we observed in this study are actually related to changes in root anchorage.
5. Conclusions
Wind loading on trees is higher in winter and linked to local competition. It also appears to be strongly related to freezing conditions as differences in snow thickness in the tree crown do not seem to have a major impact on wind loading. However, a single estimate of snow load was applied to all trees and a more precise measurement of the snow load should be examined. The interaction of winter conditions with many factors normally considered in wind damage modeling should also be examined, including the impact of below freezing temperatures on green wood mechanical properties, changes in wind profile, changes in crown shape and porosity, and changes in root/soil stiffness.
Author Contributions
All authors designed the experiment. M.D. installed the field experiment, collected and analyzed data, and wrote the paper, with significant contributions from J.-C.R. and B.G. All authors have read and agreed to the published version of the manuscript.
Funding
This research was funded by Natural Sciences and Engineering Research Council of Canada, grant number RGPIN-2016-05119, and by the Canadian Wood Fibre Centre, grant CWFC1820-009.
Acknowledgments
The authors thank François Larochelle for technical support and help conducting field work, James Gardiner for help filtering the strain gauge data, François Rousseu from Sherbrooke University for his incredible help with some aspects of the statistics, the 15 students who worked punctually on the fieldwork, but especially Emma Côté for helping with the calibration process, Université Laval Montmorency Experimental Forest for all the proximity services, Julie Bouliane for her help in the logistical organization, André Desrochers for lending us his snowmobiles, Benjamin Bouchard, Pierre-Erik Isabelle, Maxime Beaudoin-Galaise for introducing us to the snow interception, Sylvain Jutras for providing us with a working lab and support equipment, as well as the anonymous Reviewers and the Editors for their time and help in improving this paper.
Conflicts of Interest
The authors declare no conflict of interest. The funders had no role in the design of the study; in the collection, analyses, or interpretation of data; in the writing of the manuscript, or in the decision to publish the results.
Appendix A. Competition Indices
Table A1.
Competition indices types and formula.
Table A1.
Competition indices types and formula.
| Index Type | Index Formula | References/Definition |
|---|---|---|
| Distance-independent | [25] | |
| [27] | ||
| [27] | ||
| Distance-dependent (DBH) | [28] | |
| [26] | ||
| [26] | ||
| CIB |
Where BA (m2) is the individual tree basal area; y = 1 for competitor with diameter larger than the subject tree, otherwise y = 0; d is DBH; Dcs (m) is distance between subject (s) and competitor (c).
References
- Meunier, S. Comparaison de la Résistance au Renversement du Sapin Baumier et de l’épinette Blanche sur site Mésique en Sapinière Boréale. Ph.D. Thesis, Université Laval, Québec, QC, Canada, 2002. [Google Scholar]
- Ruel, J.-C. Understanding windthrow: Silvicultural implications. For. Chron. 1995, 71, 434–445. [Google Scholar] [CrossRef]
- Achim, A.; Ruel, J.-C.; Gardiner, B.A.; Laflamme, G.; Meunier, S. Modelling the vulnerability of balsam fir forests to wind damage. For. Ecol. Manag. 2005, 204, 37–52. [Google Scholar] [CrossRef]
- Duperat, M.; Ruel, J.-C.; Gardiner, B. Testing an individual tree wind damage risk model in a naturally regenerated balsam fir stand: Potential impact of thinning on the level of risk. For. Int. J. For. Res. 2020, 10. [Google Scholar] [CrossRef]
- Gardiner, B.; Suárez, J.; Achim, A.; Hale, S.; Nicoll, B.F. A PC-based wind risk model for British Forests (User’s Guide). For. Comm. Edinb. 2004, 1, 23–36. [Google Scholar]
- Hale, S.; Nicoll, B.; Gardiner, B. Forest GALES—A Wind Risk Decision Sleupport Tool for Forest Management in Britain; User Manual; Version 2; Forestry Commission: Edinburgh, UK, 2015; p. 58. [Google Scholar]
- Anyomi, K.A.; Mitchell, S.J.; Ruel, J.-C. Windthrow modelling in old-growth and multi-layered boreal forests. Ecol. Model. 2016, 327, 105–114. [Google Scholar] [CrossRef]
- Ruel, J.-C.; Meunier, S.; Quine, C.P.; Suarez, J. Estimating windthrow risk in balsam fir stands with the Forest Gales model. For. Chron. 2000, 76, 329–337. [Google Scholar] [CrossRef]
- Lundqvist, L. Stem diameter growth of scots pine trees after increased mechanical load in the crown during dormancy and (or) growth. Ann. Bot. 1996, 77, 59–62. [Google Scholar] [CrossRef]
- Peltola, H.; Kellomäki, S.; Hassinen, A.; Granander, M. Mechanical stability of Scots pine, Norway spruce and birch: An analysis of tree-pulling experiments in Finland. For. Ecol. Manag. 2000, 135, 143–153. [Google Scholar] [CrossRef]
- Silins, U.; Lieffers, V.J.; Bach, L. The effect of temperature on mechanical properties of standing lodgepole pine trees. Trees 2000, 14, 424–428. [Google Scholar] [CrossRef]
- Nykänen, M.-L.; Peltola, H.; Quine, C.; Kellomäki, S.; Broadgate, M. Factors affecting snow damage of trees with particular reference to European conditions. Finn. Soc. For. Sci. Finn. For. Res. Inst. 1997, 2, 32–48. [Google Scholar] [CrossRef]
- Díaz-Yáñez, O.; Mola-Yudego, B.; González-Olabarria, J.R.; Pukkala, T. How does forest composition and structure affect the stability against wind and snow? For. Ecol. Manag. 2017, 401, 215–222. [Google Scholar] [CrossRef]
- Peltola, H.; Kellomäki, S.; Väisänen, H. A mechanistic model for assessing the risk of wind and snow damage to single trees and stands of Scots pine, Norway spruce, and birch. J. For. Res. 1999, 29, 15. [Google Scholar] [CrossRef]
- Valinger, E.; Fridman, J. Modelling probability of snow and wind damage in Scots pine stands using tree characteristics. For. Ecol. Manag. 1997, 97, 215–222. [Google Scholar] [CrossRef]
- Valinger, E.; Lundqvist, L.; Bondesson, L. Assessing the Risk of Snow and Wind Damage from Tree Physical Characteristics. Forestry 1993, 66, 249–260. [Google Scholar] [CrossRef]
- Valinger, E. Wind and snow damage in a thinning and fertilization experiment in Picea abies in southern Sweden. Forestry 1996, 69, 25–34. [Google Scholar] [CrossRef]
- Wallentin, C.; Nilsson, U. Storm and snow damage in a Norway spruce thinning experiment in southern Sweden. Forestry 2014, 87, 229–238. [Google Scholar] [CrossRef]
- R Core Team. R A Language and Environment for Statistical Computing; R Foundation for Statistical Computing: Vienna, Austria, 2018. [Google Scholar]
- Wickham, H. Tidyverse: Easily Install and Load the “Tidyverse”. R Package Version 1.2.1. 2017. Available online: https://CRAN.R-project.org/package=tidyverse (accessed on 5 February 2019).
- Normales Climatiques Canadiennes. Available online: http://climat.meteo.gc.ca/climate_normals/ (accessed on 9 April 2019).
- Robitaille, A.; Saucier, J.P. Paysages Régionaux du Québec Méridional; Publication du Québec; Direction de la Gestion des Stocks Forestiers et Direction des relations Publiques, Ministère des Ressources Naturelles du Québec: Québec, QC, Canada, 1998. [Google Scholar]
- Hale, S.E.; Gardiner, B.A.; Wellpott, A.; Nicoll, B.C.; Achim, A. Wind loading of trees: Influence of tree size and competition. Eur. J. For. Res. 2012, 131, 203–217. [Google Scholar] [CrossRef]
- Seidl, R.; Rammer, W.; Blennow, K. Simulating wind disturbance impacts on forest landscapes: Tree-level heterogeneity matters. Environ. Model. Softw. 2014, 51, 1–11. [Google Scholar] [CrossRef]
- Biging, G.S.; Dobbertin, M. Evaluation of Competition Indices in Individual Tree Growth Models. For. Sci. 1995, 41, 360–377. [Google Scholar]
- Rouvinen, S.; Kuuluvainen, T. Structure and asymmetry of tree crowns in relation to local competition in a natural mature Scots pine forest. Can. J. For. Res. 1997, 2, 890–902. [Google Scholar] [CrossRef]
- Kiernan, D.H.; Bevilacqua, E.; Nyland, R.D. Individual-tree diameter growth model for sugar maple trees in uneven-aged northern hardwood stands under selection system. For. Ecol. Manag. 2008, 256, 1579–1586. [Google Scholar] [CrossRef]
- Hegyi, F. A simulation model for managing jack-pine stands. Growth Models Tree Stand Simul. 1974, 30, 74–90. [Google Scholar]
- Blackburn, G.R.A. The Growth and Mechanical Response of Trees to Wind Loading. Ph.D. Thesis, University of Manchester, Manchester, UK, 1997. [Google Scholar]
- Gardiner, B.A.; Stacey, G.R.; Belcher, R.E.; Wood, C.J. Field and wind tunnel assessments of the implications of respacing and thinning for tree stability. Forestry 1997, 70, 233–252. [Google Scholar] [CrossRef]
- Wellpott, A. The stability of Continuous Cover Forests. Ph.D. Thesis, University of Edinburgh, Edinburgh, UK, 2008. [Google Scholar]
- Butterworth, S. On the Theory of Filter Amplifiers. Exp. Wirel. 1930, 5, 536–541. [Google Scholar]
- Signal Developers. Signal: Signal Processing. 2014. Available online: https://CRAN.R-project.org/package=signal (accessed on 10 February 2019).
- Cook, N. The Designer’s Guide to Wind Loading of Building Structures; Butterworths: London, UK, 1985. [Google Scholar]
- Pinheiro, J.; Bates, D.; DebRoy, S.; Sarkar, D.; R Core Team. Nlme: Linear and Nonlinear Mixed Effects Models. 2018. R package version 3.1-149. Available online: https://CRAN.R-project.org/package=nlme (accessed on 7 February 2019).
- Mazerolle, M. AICcmodavg: Model Selection and Multimodel Inference Based on (Q)AIC(c). 2019. R package version 2.3-1. Available online: https://cran.r-project.org/package=AICcmodavg (accessed on 10 November 2019).
- Sakamoto, Y.; Ishiguro, M.; Kitagawa, G. Akaike information criterion statistics. Dordr. Neth. D. Reidel 1986, 81, 90–98. [Google Scholar]
- Carslaw, D.C.; Ropkins, K. openair—An R package for air quality data analysis. Environ. Model. Softw. 2012, 27, 52–61. [Google Scholar] [CrossRef]
- Keller, H.M. Snow Cover in Forest Stands; Proc. Davos IUFRO-Sem. Mountain Forests and Avalanches, 17–29, 1978.
- Saad, C.; Boulanger, Y.; Beaudet, M.; Gachon, P.; Ruel, J.-C.; Gauthier, S. Potential impact of climate change on the risk of windthrow in eastern Canada’s forests. Clim. Chang. 2017, 143, 487–501. [Google Scholar] [CrossRef]
© 2020 by the authors. Licensee MDPI, Basel, Switzerland. This article is an open access article distributed under the terms and conditions of the Creative Commons Attribution (CC BY) license (http://creativecommons.org/licenses/by/4.0/).