Abstract
Currently particulate matter (PM) is one of the major threats to public health and safety in urban areas such as Seoul, South Korea. The limited amount of air-quality monitoring systems may not provide sufficient data or coverage, in particular on the spots of urban forest. Considering urban forest as a possible contributor to mitigate PM in an urban area, this study investigated the relationship between the size and topography of urban forests near the air-quality monitoring stations and PM measurements from those stations. The average of PM measurements during the study period of August 2017 to July 2019 was computed into three different domains by using three concentric buffers from 25 monitoring stations distributed across Seoul. To estimate PM concentrations, multiple linear regression models were developed by using satellite-borne multi-spectral band data retrieved from Moderate Resolution Imaging Spectroradiometer onboard Terra (MODIS) and Landsat 8 in conjunction with meteorological data sets. Overall, PM10 and PM2.5 measurements significantly varied with season and tended to be lower with large urban forests than small ones by 5.3% for PM10 and 4.8% for PM2.5. Overall, PM10 and PM2.5 measurements were lower at the domains encompassing high urban forests in elevation than those of relatively flattened forests by 9.1% for PM10 and 3.9% for PM2.5. According to the findings from this study, the topographical difference among urban forests could exert a more significant influence on PM mitigation. The result from correlation analysis between the PM estimates from Landsat 8-based models and ground-based PM measurements was considered reliable based on Pearson’s coefficients of 0.21 to 0.74 for PM10 and −0.33 to 0.74 for PM2.5. It was considered that using a satellite imagery-derived PM model could be effective to manage urban forest over a large area which in general implies the limitation of data collection.
1. Introduction
There have been growing concerns about reducing ambient air pollutants, including particulate matter (PM) whose threats to public health and safety are anticipated to be increasing globally and regionally over time [1,2,3,4]. As one of the major elements in an urban environment, urban forest is expected to provide fundamental and natural solutions to such anthropogenic issues. There have been increasing efforts to identify the role of urban forest in mitigating air pollutants across urban areas: for example, directly removing atmospheric particles and absorbing various gaseous pollutants by leaves, waxes, and chemical composition of trees; changing local microclimates and trapping pollutants by various tree configurations; transpiring, lowering temperature, and reducing ozone production; and indirectly reducing pollutants by reducing building energy use [5,6,7]. Since urban forest is the assemblage of woody plants within varied coordination of horizontal and vertical structures and external environmental factors, the mitigation performance might vary with vegetation composition, meteorological environment, ventilation-friendly forest structure, and topographical settings [5,8,9,10,11].
Although ambient air quality has been systemically monitored by the network of air-quality monitoring stations in many industrialized regions, the limited number and locations of monitoring sites have been an obstacle to secure adequate sampling coverage on a local scale such as monitoring and managing urban forest [12,13]. To overcome such limitation, there have been satellite-based approaches to remotely and extensively collect the atmospheric information of the areas where even monitoring stations are not located in proximity. NASA has been providing a variety of aerosol information by operating a coordinated series of satellites, including Terra and Landsat series [14,15]. The imageries retrieved from Moderate Resolution Imaging Spectroradiometer onboard Terra (hereafter MODIS) have been often used for estimating PM concentrations over a vast area; its 10 km and 3 km aerosol products include Aerosol Optical Depth (AOD) that was converted to MODIS air-quality products including PM estimates by a suite of algorithms [14,15,16,17]. Recently, there have been more frequent approaches to survey small urban areas by using finer-resolution sensor-derived products; the imageries retrieved from Operational Land Imager (OLI) onboard Landsat 8 (hereafter Landsat 8) have been used in some aerosol studies in urban settings [18,19,20,21,22]. However, it is still necessary to develop a site-specific manual for using the fine-resolution imagery when necessary.
As for developing an effective way to investigate urban forest characteristics regarding PM mitigation, there have been few relevant studies conducted focusing on Seoul. This study was aimed at (i) analyzing the spatio-temporal changes in PM10 and PM2.5 measurements, (ii) identifying relationships between characteristics of urban forest and PM measurements, and (iii) examining a potential for using Landsat 8 imagery-based PM mapping on urban forest.
2. Materials and Methods
2.1. Study Area
The study area, Seoul, is the most populated metropolis in South Korea consisting of 25 districts and approximately 9.7 million people in an area of 600 km2. It has been faced with the on-going problem of increasing non-point air pollutant emissions such as traffic congestion [23,24]. In terms of land use, the study area consists of densely distributed urban surfaces and features that take a major portion of city coverage and sporadically distributed flat and hilly urban forests across the city, which are described in Figure 1 [25,26].
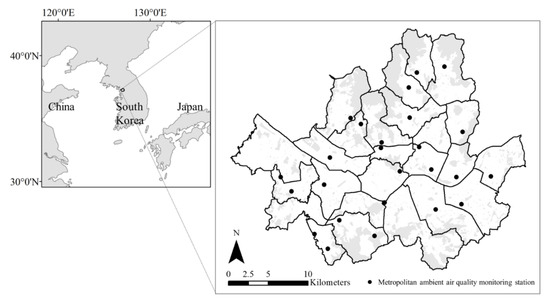
Figure 1.
Locations of 25 ambient air-quality monitoring stations (in dots) and distributions of urban forest (in shaded areas) across the study area of Seoul, South Korea.
The study area consists of 25 districts, and ambient air quality along the districts is monitored by the metropolitan ambient air-quality network [27] that offers calibrated concentrations of PM10 and PM2.5 (hereafter PM measurements) with hourly mean values per monitoring site (Figure 1).
2.2. Data Collection
2.2.1. Urban Forest Buffer
Geographical information of urban forest located within Seoul was obtained from the Seoul metropolitan government (http://data.seoul.go.kr/). To investigate the relationship between urban forest and PM measurement in the vicinity of them, the sizes of urban forest in proximity of each of the monitoring stations were computed. To do so, the influence area of urban forests was defined in landscape metrics based on the approach developed by Choi et al. [28]; at each sample site, domains were designed by the three given distances from the location of each monitoring station: 1 km, 500 m, and 300 m in radius, which form circular areas called “buffer” in this study.
2.2.2. Satellite Imagery Data
To survey the areas that the monitoring stations are not close to, remotely sensed data were used for obtaining regional atmospheric information. From pre-testing MODIS imagery compared with Landsat 8 imagery, Landsat 8 imagery with a finer spatial resolution was selected for this study. Standard Landsat 8 Level 1 product in 30 m resolution (LC08_L1XX) from the imagery retrieved on 1 November 2018 and 19 December 2018 was downloaded from USGS online archive (https://earthexplorer.usgs.gov/). The acquisition time of Landsat 8 images over the study area was approximately 02:00 UTC (11:00 a.m. in local time). Multi-spectral band data, from band 2 to band 7, extracted from the Landsat 8 images, were pre-processed with simple dark-object subtraction and radiometric and atmospheric correction to estimate AOD values based on the algorithms used in earlier aerosol studies [18,19,29,30,31]. From pre-testing the entire multi-spectral band data collected for the Landsat 8 images, band 7 for PM10 models and band 4 for PM2.5 models were excluded due to lack of sensitivity of their AOD values to the changes in PM concentration. The software ENVI version 5.1 (Exelis Visual Information Solutions, Boulder, CO, USA) and ArcMap version 10.2 (Environmental Systems Research Institute, Redlands, CA, USA) were used for image processing.
2.2.3. PM and Meteorological Data
Hourly mean ground-based PM10 and PM2.5 concentrations (hereafter PM measurements) across the study area were collected from August 2017 to July 2019 through the website of AirKorea (https://www.airkorea.or.kr/eng) (Figure 1). The hourly measurements of temperature (°C), wind speed (m/s), wind direction (0~360°), and relative humidity (%) from August 2017 to July 2019 were obtained from 25 automatic weather stations located across the study area to examine meteorological influences on PM, which were downloaded from the data archive offered by the Korea Meteorological Administration (https://data.kma.go.kr).
2.3. Data Analysis
2.3.1. Satellite Imagery-Based PM-Estimation Modeling
To improve the PM model accuracy compared to previous MODIS-based models, single-day models derived from Landsat 8 imagery were examined. The modeling approach suggested by earlier studies was applied to the process of this study [18,19,22]. In a single day, Landsat 8 scenes contained 25 monitoring sites as sample sites of PM measurements. The multi-spectral band information from Landsat 8 and meteorological data were used to develop single-day models for PM10 and PM2.5 estimates. The correlation analysis was conducted between PM10 or PM2.5 measurements and AOD values. Multiple linear regression models were developed by using the AOD values at 0.55 μm and meteorological data sets as the major inputs and independent variables, and PM measurements as the ground-truth and dependent variable. The model-derived PM10 and PM2.5 concentrations (hereafter PM10 and PM2.5 estimates) at the pixels that spatially overlap with the monitoring sites were computed and cross-validated with PM10 and PM2.5 measurements. To validate a developed model, some samples were selected as training data and the others as validation data from the PM10 or PM2.5 measurements. This numerical modeling was performed by using the software SPSS Statistics 25 (IBM, Armonk, New York, NY, USA). The PM estimates across the study area were classified by different PM concentration intervals and visualized with the pixel values smoothed by using 3-by-3 windows derived from “block statistics” in ArcMap 10.2 (ESRI, Boulder, CO, USA).
2.3.2. Comparison between Urban Forest and PM Measurement
To investigate relationships between urban forest and changes in PM, two variables of urban forest characters were tested: size in area; and topography. First, to examine the correlation between urban forest size and PM measurements, quarterly mean values of PM10 and PM2.5 were computed for each of the monitoring stations from 2017 to 2018. The total areas for individual urban forest within buffers of 1 km, 500 m and 300 m in radius from the location of each monitoring station were computed. Secondly, to examine the relationship between the topographical setting near each monitoring site and PM measurements, the maximum elevation of relevant urban forests within the 1 km buffer was computed from a digital terrain map over the study area. Quarterly mean values of PM10 or PM2.5 measurements were compared with the maximum elevation of each coupled urban forest.
2.3.3. Comparison between Urban Forest Size and PM Estimates
To examine the relationship between urban forest sizes and changes in PM, mean data numbers of Landsat-derived PM estimates were computed within the 1 km buffer of each monitoring station, and were compared to the total area of urban forests within the same buffer. All geographical computation in this study was conducted by using ArcMap 10.2 (ESRI, Boulder, CO, USA).
3. Results
3.1. Urban Forest Characteristics and PM Measurements
To examine the relationship between urban forest size and PM measurements, six sites encompassing the largest forest area, called L1 to L6 within their own domain, and the other six with the smallest forest area, called S1 to S6, were selected, and such two groups were compared to each other (Table 1).

Table 1.
Names of 25 administrative districts and urban forest sizes in the relevant district computed inside the buffers of 1 km, 500 m, and 300 m in radius from the air-quality monitoring stations of each district across Seoul; six domains with the largest forests (L1~L6) and the other six with the smallest forests (S1~S6) are sorted in size order.
There was a noticeable difference in urban forest sizes between two groups; however, such difference tended to be reduced as the forest sizes in both groups were reduced with the decreases in buffer distances (Table 1). The distribution of urban forests within the buffer of each sample site is graphically delineated in the order of the total area of urban forest patches (Figure 2).

Figure 2.
Urban forest distributions within three buffers of 1 km, 500 m, and 300 m in radius from the 25 air-quality monitoring stations in Seoul. Top six domains with the largest urban forest in area within the buffers are called L1 to L6 in order of total area, and the other six at the bottom with the smallest urban forest area are called S1 to S6 in this study.
As for L1 to L6, large-sized forest patches dominated the domains and tended to cut across the given three buffers whereas small and fragmented forest patches were spotted sporadically close by the monitoring stations (Figure 2). As for S1 to S6, while small and fragmented forest patches dominated the domains, no large forest patches were observed across the buffers (Figure 2). As the buffer distances decreased, the small fragments of forest patches became more dominant in the urban areas accompanied with the reduced coverages of the large forests (Figure 2). The correlations between total urban forest sizes of each domain and quarterly mean PM10 or PM2.5 measurements were examined. PM measurements for two groups by urban forest size are plotted in time series and compared to each other by buffer (Figure 3).
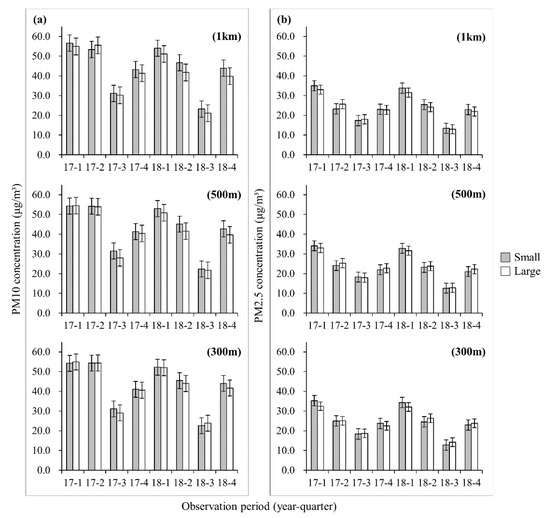
Figure 3.
Quarterly mean measurements and standard errors of PM10 (a) and PM2.5 (b) computed from six domains called “Large” with the largest urban forest size and the other six called “Small” with the smallest forest size within three buffers of 1 km, 500 m and 300 m in radius from 25 air-quality monitoring stations in Seoul during the period of 2017 to 2018. Each quarter is defined as January to March, April to June, July to September, and October to December.
In Figure 3, the overall patterns in the seasonal changes in PM10 and PM2.5 measurements resembled each other under different conditions of PM type, time, urban forest size and buffer. Overall PM10 measurements at the “Large” sites by season showed the tendency of lower PM compared to those of “Small” ones (Figure 3a). Also, there was a trend that as the domains defined as buffer by size increased, the number of seasons showing the distinct gap of PM10 measurements between groups by urban forest size was grown (Figure 3a). As for PM2.5 in 1 km buffer, the “Large” sites tended to have lower PM than those of “Small” ones (Figure 3b). Such trends of both PM10 and PM2.5 could be derived from the location of the monitoring stations that are designed for setting up at high population areas with relatively smaller urban forest (Figure 3). Considering temporal changes, mean PM10 measurements repeatedly showed a sudden decrease at the third quarter (July to September), and then a rapid increase at the fourth quarter (October to December) regardless of urban forest size and buffer. On the other hand, PM2.5 showed smooth seasonal fluctuations with the peak at the first quarter and the bottom at the third quarter during the study period (Figure 3b).
There is no consistency with time in the relationship between “Large” or “Small” group for both PM types: for example, unlike the overall pattern mentioned above the time of 17-1 at 300 m and 500 m buffers indicated higher PM10 at “Large” sites than “Small”; and the time of 17-2 at 500 m and 1 km buffers did the same for PM2.5. Therefore, it was considered that the size of urban forest is not the key factor in terms of PM mitigation of urban forest. Also, in Korea, winter to early summer (17-1, 17-2, 18-1, 18-2 in Figure 3) is in general the peak of high concentration of both PM10 and PM2.5. However, such periods are not warm enough yet for trees, and therefore trees or urban forest are most vulnerable to environmental impact at those times. Accordingly, even “Large” urban forest might not present its ability to the full in relation to PM mitigation.
To investigate the changes in PM measurements in relation to the presence of hilly urban forests in the domain, the monitoring sites were ranked based on the maximum surface elevation within the 1 km buffer, and two distinct groups were extracted: one with the highest eight urban forests and the other with the lowest eight (Figure 4).
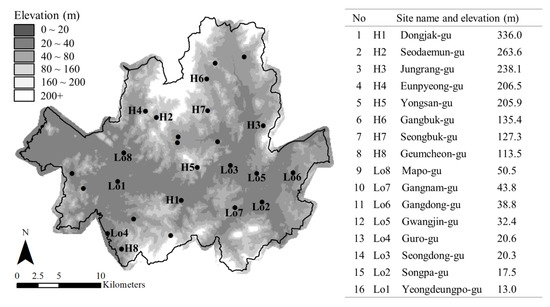
Figure 4.
Locations of 25 air-quality monitoring stations across Seoul (in dots). Eight sites with the highest maximum elevation within 1 km buffer (H1~H8) and the other eight with the lowest elevation (Lo1~Lo8).
The selected sites for the two elevation-based groups were widely spread over the entire study area. However, the sites with higher urban forests were mainly located on the axis of north to south in the middle of Seoul and the sites with lower forests were distributed along the axis of east to west due to the topographic characteristics of Seoul (Figure 4). Quarterly mean PM10 and PM2.5 measurements are plotted by urban forest elevation group in Figure 5.
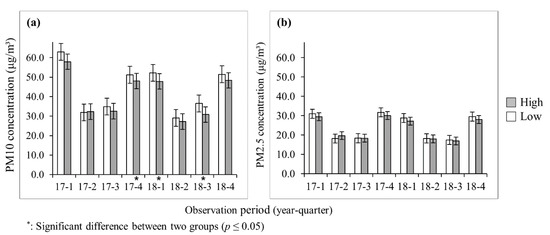
Figure 5.
Quarterly mean measurements and standard errors of PM10 (a) and PM2.5 (b) computed from two groups of the high elevation sites called “High” and low elevation sites called “Low” during the period of 2017 to 2018.
Overall PM measurements were slightly lower in the “High” group showing the same seasonal patterns between two different elevation groups (Figure 5). Such trend was consistent through the study period. Although there were no different temporal changes in both PM measurements, difference in PM10 between “High” and “Low” groups was bigger than those of PM2.5 (Figure 5). This result indicated the high possibility that residents who live in a certain area close to urban forest higher than 100 m could benefit from PM mitigation, in particular for PM10. As for the seasonal patterns of PM measurements, overall trends in 2017 were similar to those of 2018, showing the high seasons in the first and fourth quarters and the low seasons in the second and third quarters. It is anticipated that such patterns were originated from the general fluctuation of PM distribution in Korean peninsula on a long-term scale and repeated every year. Interestingly, the second quarter in 2017 (17-2 in Figure 5) presented a different condition, indicating higher PM10 and PM2.5 measurements at the “High” sites than “Low” ones. A range of factors could be involved in this event from weather conditions via characters of forest to domestic and/or international emission sources. Among those factors, precipitation which strongly affects periodic physiological changes in vegetation could provide a meaningful clue: while it was the transitional period of the year from spring to summer (17-2; April, May, June), the precipitation on that period was about 72% less than the same period in 2018, which might exert a negative influence on trees’ activity during a vital season. Accordingly, there was a possibility that urban forest could not respond to PM environment compared to a wet condition. However, additional data collection dealing with the micro-climate within urban forest are required to systematically analyze such relationship.
3.2. Urban Forest Size and PM Estimates
To model PM10 and PM2.5 estimates over urban forest areas which are out of the air-quality monitoring system, multiple linear regression models were developed by using Landsat 8-derived AOD, ground-based PM10 or PM2.5 measurement data, and meteorological factors including wind speed (WS), wind direction (WD), relative humidity (RH), and temperature (T) as major inputs. To identify the most effective band combinations for developing PM models in this study, two Landsat 8 image acquisition dates during the same quarter in 2018 were examined. The outcome is summarized with the resulting models and their reliability and selected parameters in Table 2.

Table 2.
Multiple linear regression models for estimating PM10 and PM2.5 concentrations based on Landsat 8-derived AOD and meteorological factors, and the estimated coefficients of the models.
Although the PM10 models for the selected study periods showed the range of r2 values from 0.18 to 0.62, the PM2.5 models showed the range of r2 values from 0.40 to 0.82 (Table 2). In this study, the average of r2 values of the PM10 models was lower than that of the PM2.5 models. The outcomes from the correlation analyses among the PM measurements from the monitoring stations, Landsat 8-derived PM estimates, and urban forest sizes in area are depicted in Figure 6, Figure 7, Figure 8 and Figure 9.
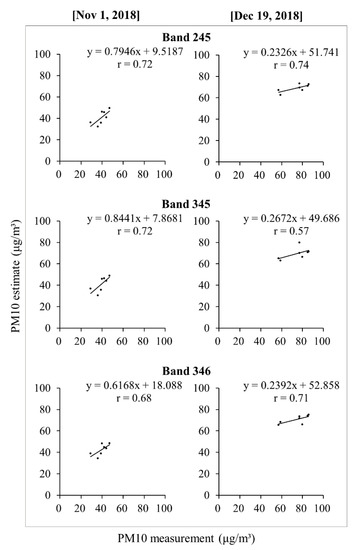
Figure 6.
Correlations between mean PM10 measurements from the air-quality monitoring stations and three Landsat 8-derived PM10 models derived from three different bands within the buffer of 1 km in radius.
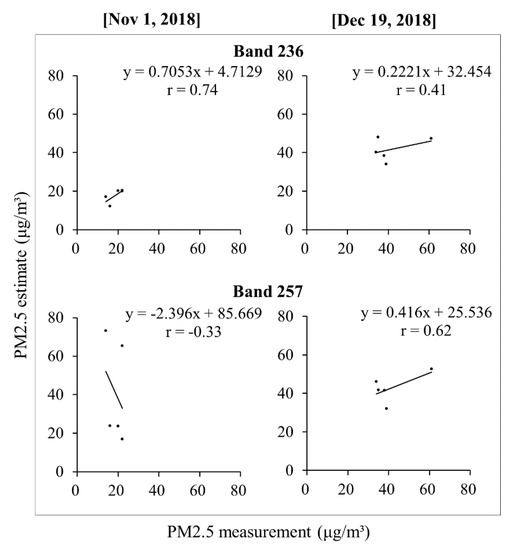
Figure 7.
Correlations between mean PM2.5 measurements from the air-quality monitoring stations and two Landsat 8-derived PM2.5 models derived from three different bands within the buffer of 1 km in radius.
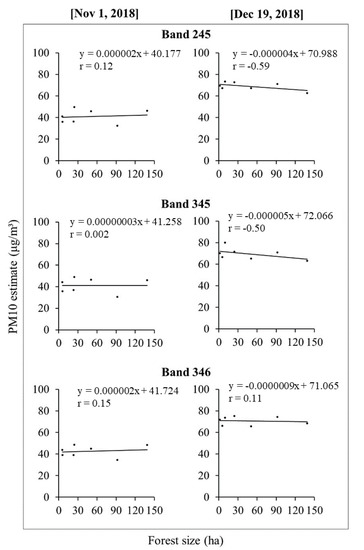
Figure 8.
Correlations between urban forest size in area and the mean estimates of Landsat 8-derived PM10 in different band combinations for 1 km buffers from the air-quality monitoring stations.
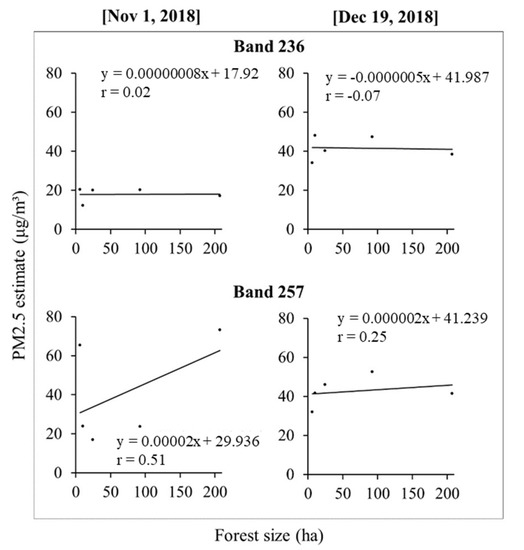
Figure 9.
Correlations between urban forest size in area and the mean estimates of Landsat 8-derived PM2.5 in different band combinations for 1 km buffers from the air-quality monitoring stations.
As for the correlations between the PM measurements at the monitoring stations and modeled PM estimates at the pixel levels, the overall PM10 estimates showed better correspondences to PM10 measurements with the range of r values from 0.57 to 0.74 (Figure 6) than those of PM2.5 from −0.33 to 0.74 (Figure 7). As for PM2.5, there was a noticeable difference in the correlation coefficients between two dates, whereas the correlations between PM10 estimates and measurements were evenly fair regardless of the date. Therefore, it was considered that using Landsat 8 imagery was more consistently effective to estimate PM10.
The results from the correlations analyses between the sizes of urban forests located within 1 km buffers of each domain and mean values of Landsat-derived PM estimates within the buffer in Figure 8 and Figure 9 showed that there were no noticeable relationships. However, there were some cases that showed negative correlations, which were also shown previously on a landscape scale in Figure 3. The combinations of bands 2, 4, and 5 and bands 3, 4, and 5 in December showed a decrease in PM10 followed by the increases in the urban forest sizes with r value of −0.59 (band 2, 4, and 5) and −0.50 (band 3, 4, and 5) (Figure 8). It was considered that there could be certain combinations of multi-spectral bands of Landsat 8 that could be used for developing a more effective model.
The multiple regression models for PM estimation developed in this study were used for graphically rendering PM distribution maps (Figure 10 and Figure 11) for the visualization purpose of the modeled PM. PM10 and PM2.5 estimates were shown along the pixels across the study area, and the estimates were categorized into distinctive color codes by concentration level.
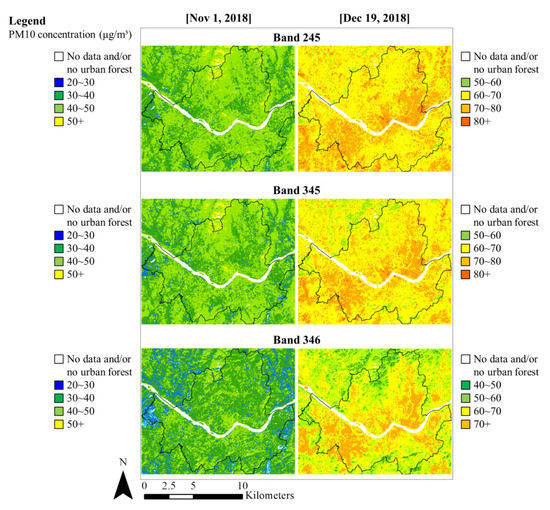
Figure 10.
PM10 concentration maps in Seoul based on the Landsat 8-derived PM10 estimates in different band combinations; the line in black indicates the city boundary of Seoul.
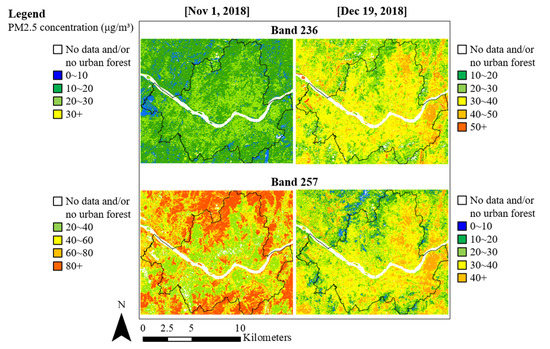
Figure 11.
PM2.5 concentration maps in Seoul based on the Landsat 8-derived PM2.5 estimates in different band combinations; the line in black indicates the city boundary of Seoul.
Followed by the model reliabilities for PM10 estimates which were evenly fair in Figure 7, the concentration maps of PM10 estimates also showed a similar distribution of pixel values regardless of the band combination (Figure 10). As for PM2.5, the PM distributions from the combination of bands 2, 3, and 6 and bands 2, 5, and 7 in November did not correspond to each other (Figure 11), which was probably due to the relatively lower model reliability shown in the band combination of 2, 5, and 7 on November 1st in Figure 8. However, on December 19th, the maps of PM2.5 estimates in a similar pattern to each other as the model reliabilities were secured in a consistent manner (Figure 11).
4. Discussion
The relationship between urban forests and the changes in PM concentrations was investigated by using both ground-truth and remotely sensed data in this study. With the hypothesis that PM measurements would be lower with the presence of large urban forests nearby, the correlation analyses between urban forest sizes and PM measurements were conducted. The result showed reduced PM10 and PM2.5 measurements in the areas where larger urban forests were in proximity. This tendency, however, was shown in an inconsistent manner with varied buffer distances, which led to a question about a threshold distance of urban forests that can be effective to reduce PM (Figure 2 and Figure 3). This result corresponds to the potential that urban forest patches might play in mitigating PM pollution shown in Cavanagh et al. [5]’s study; while PM measurements increased as the distance increased from inner forests to outer forest edges, a similar question about the threshold distance was suggested due to the study areas limited to the forest patches. Considering the result from our study with expanded buffer distances including the areas outside the urban forests, a follow-up investigation was considered to be meaningful.
Overall PM measurements tended to be consistently lower in the areas where the elevation within a 1 km buffer was higher than 100 m; it was considered that high urban forests led the PM measurements to be reduced. This tendency falls onto the finding that a change in surface elevation gradient can be the factor that can aerodynamically contribute to the dispersion of air pollutants stagnated across urban areas [9]. The topographical effect measured by elevation difference could be combined with vegetation characteristics of urban forest such as species, height and coverage of trees. Such synergy could have an influence on PM mitigation which is similar to the previous study [32].
Using Landsat 8 imagery with a fine spatial resolution resulted in overall good modeling performance in estimating PM10 and PM2.5 in this study (Figure 6 and Figure 7). The findings from the pre-test of comparing MODIS and Landsat 8 imagery fall onto the same line with Remer et al. [15]’s and Munchak et al. [17]’s studies that present the aerosol detection ability varies with sensor resolutions; the sensors with coarser spatial resolution can miss the aerosol information that those with finer resolution can detect. However, the outcome in this study also suggested the need for improvement in the model reliabilities particularly for PM2.5, which showed day-to-day variations in the use of different combinations of multi-spectral band information (Table 2; Figure 7). A similar challenge was discussed in van Donkelaar et al. [33]’s study, in terms of the need for better techniques or methodologies to normalize the over- and under-estimated pixel values from satellite imagery-derived models caused by different sample, data calibration, sensor resolution, and spatio-temporal and exo-planetary setting of the imagery retrieved. Also, the limitation with regard to the biased data output was suggested in Remer et al. [15]’s and Munchak et al. [17]’s studies presenting that the sensors with finer spatial resolution are more vulnerable to slight differences in multi-spectral band information retrieved and are more likely to produce the isolated pixels of which pixel values are discontinuous compared to neighboring pixels. Such biased outcome, the under- and overestimated AOD values in this study, turned out to be the discontinuous pixels in the scenes (Figure 12).
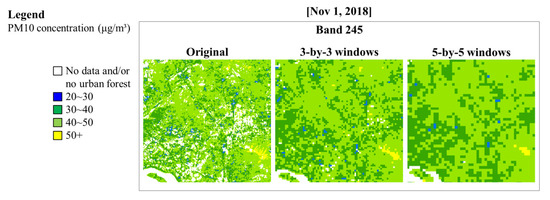
Figure 12.
Three different subsets of a Landsat 8-derived PM10 estimate map from bands 2, 4, and 5, showing three different displays by different window systems.
Although the optimal smoothing technique was chosen for the study area and applied to the original maps to minimize the number of isolated and/or discontinuous pixels, there is still an uncertainty in how accurately the post-processed pixels would represent the in situ PM measurements. Accordingly, the performance of the models developed in this study could be improved with handling these known issues and being equipped with better understanding of physical properties of aerosols.
For more accurate interpretation of satellite imagery-derived aerosol information, additional environmental factors including meteorological factors are needed with the accumulation of such data sets. Besides meteorological parameters used in this study, which includes the limitation due to their availability for the study area, there could be other environmental factors extensively investigated as model parameters such as planetary boundary layer depth, Ångström exponents, elevation, modified relative humidity, barometric pressure, mixing layer height, etc. [34,35,36,37]. Based on the correlation between the physical properties of AOD and PM concentration, the empirical models in this study could be useful to develop an effective approach to estimating and anticipating PM concentrations over an extensive area. It was considered that there was the possibility the Landsat 8-derived PM-estimation models developed in this study could be used for providing visual end-products that represent the PM distributions across the target area.
5. Conclusions
This study investigated the PM mitigation effect of urban forest on its surrounding areas and the potential for a fine-spatial-resolution imagery-based approach to PM modeling. In this study, the overall patterns of the seasonal changes in PM10 and PM2.5 measurements respectively were consistent with the changes over the study period. In general, large urban forests showed more positive influence on its neighboring area in terms of PM mitigation than the aggregation of small and fragmented urban forests. Based on the correlation analysis, within a given area the existence of high urban forest which is higher than 100 m in elevation more consistently indicated the potential for the positive effects on PM mitigation, particularly for PM10. In the further study, however, it is necessary to identify the most relevant factor from this finding. By examining Landsat 8 imagery-based PM-estimation modeling approaches, it was found that, regarding the urban forest of Seoul, the fine spatial resolution was suitable to model PM estimation, particularly for PM10. By improving the reliability of PM modeling based on remotely sensed data, it is expected to identify more relevant factors to PM mitigation with regard to urban forest, and investigate the mitigation mechanisms of urban forest in detail albeit lack of ground-based measurements.
Author Contributions
Conceptualization, P.S.-H.L.; methodology, P.S.-H.L. and J.P.; software, P.S.-H.L. and J.P.; validation, P.S.-H.L. and J.P.; formal analysis, P.S.-H.L. and J.P.; investigation, P.S.-H.L. and J.P.; resources, P.S.-H.L. and J.P.; data curation, P.S.-H.L. and J.P.; writing—original draft preparation, P.S.-H.L. and J.P.; writing—review and editing, P.S.-H.L.; visualization, P.S.-H.L. and J.P.; supervision, P.S.-H.L.; project administration, P.S.-H.L.; funding acquisition, P.S.-H.L. All authors have read and agreed to the published version of the manuscript.
Funding
This research received no external funding.
Conflicts of Interest
The authors declare no conflict of interest.
References
- IPCC. Climate Change 2014: Mitigation of Climate Change. In Contribution of Working Group III to the Fifth Assessment Report of the Intergovernmental Panel on Climate Change; Cambridge University Press: Cambridge, UK; New York, NY, USA, 2014. [Google Scholar]
- WHO (World Health Organization). 2016 Ambient Air Pollution: A Global Assessment of Exposure and Burden of Disease. 2019. Available online: https://apps.who.int/iris/handle/10665/250141 (accessed on 10 September 2019).
- Kim, S.K.; Lee, E. Spatial injustice of particulate matter: The case of California. Int. J. Urban Sci. 2019, 23, 484–497. [Google Scholar] [CrossRef]
- Nam, K.-M.; Li, M.; Wang, Y.; Wong, K.K.H. Spatio-temporal boundary effects on pollution-health costs estimation: The case of PM2.5 pollution in Hong Kong. Int. J. Urban Sci. 2019, 23, 498–518. [Google Scholar] [CrossRef]
- Cavanagh, J.; Zawar-Reza, P.; Wilson, J. Spatial attenuation of ambient particulate matters air pollution within an urbanised native forest patch. Urban For. Urban Green. 2009, 8, 21–30. [Google Scholar] [CrossRef]
- Dzierzanowski, K.; Popek, R.; Gawrońska, H.; Sæbø, A.; Gawronski, S. Deposition of particulate matter of different size fractions on leaf surfaces and in waxes of urban forest species. Int. J. Phytoremediat. 2011, 13, 1037–1046. [Google Scholar] [CrossRef] [PubMed]
- Nowak, D.J.; Hirabayashi, S.; Doyle, M.; McGovern, M.; Pasher, J. Air pollution removal by urban forests in Canada and its effect on air quality and human health. Urban For. Urban Green. 2018, 29, 40–48. [Google Scholar] [CrossRef]
- Salmond, J.; Williams, D.; Laing, G.; Kingham, S.; Dirks, K.; Longley, I.; Henshaw, G.S. The influence of vegetation on the horizontal and vertical distribution of pollutants in a street canyon. Sci. Total Environ. 2013, 443, 287–298. [Google Scholar] [CrossRef] [PubMed]
- Suder, A.; Szymanowski, M. Determination of ventilation channels in urban area: A case study of Wrocaw. Pure Appl. Geophys. 2014, 171, 965–975. (In Poland) [Google Scholar] [CrossRef]
- Lee, P.S.; Mackey, B. Development of a bird habitat resource classification scheme based on vegetation structure analysis. Curr. Sci. 2018, 115, 2307–2315. [Google Scholar] [CrossRef]
- Lee, P.S.; Jeong, C. Influence of vegetation cover in Seoul forest on PM10 concentration in Seoul, South Korea. Asia Life Sci. 2019, 18, 1–11. [Google Scholar]
- Kumar, N.; Chu, A.; Foster, A. An empirical relationship between PM2.5 and aerosol optical depth in Delhi metropolitan. Atmos. Environ. 2007, 41, 4492–4503. [Google Scholar] [CrossRef]
- Tian, J.; Chen, D. Spectral, spatial, and temporal sensitivity of correlating MODIS aerosol optical depth with ground-based fine particulate matter (PM2.5) across southern Ontario. Can. J. Remote Sens. 2010, 36, 119–128. [Google Scholar] [CrossRef]
- Levy, R.; Mattoo, S.; Munchak, L.; Remer, L.; Sayer, A.; Hsu, N. The collection 6 MODIS aerosol products over land and ocean. Atmos. Meas. 2013, 6, 2989–3034. [Google Scholar] [CrossRef]
- Remer, L.A.; Mattoo, S.; Levy, R.C.; Munchak, L.A. MODIS 3 km aerosol product: Algorithm and global perspective. Atmos. Meas. 2013, 6, 69–112. [Google Scholar] [CrossRef]
- Remer, L.A.; Kleidman, R.G.; Levy, R.C.; Kaufman, Y.J.; Tanré, D.; Mattoo, S.; Martins, J.V.; Ichoku, C.; Koren, I.; Yu, H.; et al. Global aerosol climatology from the MODIS satellite sensors. J. Geophys. Res. Atmos. 2008, 113, 1–18. [Google Scholar] [CrossRef]
- Munchak, L.; Levy, R.; Mattoo, S.; Remer, L.; Holben, B.; Schafer, J.; Hostetler, C.; Ferrare, R. MODIS 3 km aerosol product: Applications over land in an urban/suburban region. Atmos. Meas. Tech. 2013, 6, 1747–1759. [Google Scholar] [CrossRef]
- Nadzri, O.; Mat Jafri, M.Z.; Lim, H.S. Estimating particulate matter concentration over arid region using satellite remote sensing: A case study in Makkah, Saudi Arabia. Mod. Appl. Sci. 2010, 4, 131–142. [Google Scholar] [CrossRef]
- Saleh, S.A.H.; Hasan, G. Estimation of PM10 concentration using ground measurements and Landsat 8 OLI satellite image. J. Geophys. Remote Sens. 2014, 3, 2169. [Google Scholar] [CrossRef]
- Sun, L.; Wei, J.; Bilal, M.; Tian, X.; Jia, C.; Guo, Y.; Mi, X. Aerosol optical depth retrieval over bright areas using Landsat 8 OLI images. Remote Sens. 2016, 23, 23. [Google Scholar] [CrossRef]
- Yun, G.; Zuo, S.; Dai, S.; Song, X.; Xu, C.; Liao, Y.; Zhao, P.; Chang, W.; Chen, Q.; Li, Y.; et al. Individual and interactive influences of anthropogenic and ecological factors on forest PM2.5 concentrations at an urban scale. Remote Sens. 2018, 10, 521. [Google Scholar] [CrossRef]
- Lee, -S.; Park, -J. Correlation between urban forest and satellite-borne imagery-based ambient particulate matter across Seoul, South Korea. J. Agri. Life Environ. Sci. 2019, 53, 1–11. [Google Scholar] [CrossRef]
- NIER (National Institute of Environmental Research). 2015 Megacity Air Pollution Studies—Seoul (MAPS-Seoul). Available online: https://espo.nasa.gov/sites/default/files/document-s/MAPS-Seoul_White%20Paper_26%20Feb%202015_Final.pdf (accessed on 20 August 2019).
- KOSIS (Korean Statistical Information Service). 2018 Administrative Division Statistics. Available online: http://kosis.kr/statHtml/statHtml.do?orgId=101&tblId=DT_1ZGA17&conn_p-ath=I2 (accessed on 12 September 2019).
- Wybe, K. The nature of urban Seoul: Potential vegetation derived from the soil map. Int. J. Urban Sci. 2013, 17, 95–108. [Google Scholar] [CrossRef]
- Seoul Metropolitan Government. 2019 Seoul City Green Space Geospatial Information (Datum: ITRF2000). Available online: http://data.seoul.go.kr/dataList/datasetView.do?infId=OA-13163&srvType=S&serviceKind=1¤tPageNo=1 (accessed on 22 August 2019).
- AirKorea. 2019 Ambient Air Quality Data Archive. 2019. Available online: https://www.airkorea.or.kr/web/last_amb_hour_data (accessed on 6 August 2019).
- Choi, J.; Lee, S.; Ji, S.; Jeong, J.; Lee, P.S. Landscape analysis to assess the impact of development projects on forests. Sustainability 2016, 8, 1012. [Google Scholar] [CrossRef]
- Moran, M.S.; Jackson, R.D. Evaluation of simplified procedures for retrieval of land surface reflectance factors from satellite sensor output. Remote Sens. Environ. 1992, 41, 169–184. [Google Scholar] [CrossRef]
- Chavez, J.P. Image-based atmospheric corrections—Revisited and improved. Photogramm. Eng. Rem. Sens. 1996, 62, 1025–1036. [Google Scholar]
- Sobrino, J.; Jimenez-Munoz, J.; Paolini, L. Land surface temperature retrieval from LANDSAT TM 5. Remote Sens. Environ. 2004, 90, 434–440. [Google Scholar] [CrossRef]
- Pypker, T.G.; Unsworth, M.H.; Lamb, B.; Allwine, E.; Edurg, S.; Sulzman, E.; Mix, A.C.; Bond, B.J. Cold air drainage in a forested valley: Investigating the feasibility of monitoring ecosystem metabolism. Agric. For. Meteorol. 2007, 145, 149–166. [Google Scholar] [CrossRef]
- Van Donkelaar, A.; Martin, R.V.; Brauer, M.; Boys, B.L. Use of satellite observations for long-term exposure assessment of global concentrations of fine particulate matter. Environ. Health Perspect. 2015, 123, 135–143. [Google Scholar] [CrossRef]
- Chudnovsky, A.; Koutrakis, P.; Kloog, I.; Melly, S.; Nordio, F.; Lyapustin, A.; Wang, Y.; Schwartz, J. Fine particulate matter predictions using high resolution Aerosol Optical Depth (AOD) retrievals. Atmos. Environ. 2014, 89, 189–198. [Google Scholar] [CrossRef]
- Seo, S.; Kim, J.; Lee, H.; Jeong, U.; Kim, W.; Holben, B.; Kim, S.W.; Song, C.; Lim, J. Estimation of PM10 concentrations over Seoul using multiple empirical models with AERONET and MODIS data collected during the DRAGON-Asia campaign. Atmos. Chem. Phys. 2015, 15, 319–334. [Google Scholar] [CrossRef]
- Chew, B.N.; Campbell, J.; Hyer, E.; Salinas, S.; Reid, J.; Welton, E.; Holben, B.; Liew, S.C. Relationship between aerosol optical depth and particulate matter over Singapore: Effects of aerosol vertical distributions. Aerosol Air Qual. Res. 2016, 16, 2818–2830. [Google Scholar] [CrossRef]
- Chen, W.; Fan, A.; Yan, L. Performance of MODIS C6 aerosol product during frequent haze-fog events: A case study of Beijing. Remote Sens. 2017, 9, 496. [Google Scholar] [CrossRef]
© 2020 by the authors. Licensee MDPI, Basel, Switzerland. This article is an open access article distributed under the terms and conditions of the Creative Commons Attribution (CC BY) license (http://creativecommons.org/licenses/by/4.0/).