Article

Sparse Pinus Tabuliformis Stands Have Higher Canopy Transpiration Than Dense Stands Three Decades After Thinning

1
College of Soil and Water Conservation, Beijing Forestry University, Key Laboratory of Soil and Water Conservation, the State Forestry and Grassland Administration, Beijing 100083, China
2
Badaling Forest Farm, Beijing 102112, China
3
Gongqing Forest Farm, Beijing 101300, China
4
Department of Geography, University of North Carolina at Chapel Hill, Chapel Hill, NC 27599, USA
*
Author to whom correspondence should be addressed.
Forests 2020, 11(1), 70; https://doi.org/10.3390/f11010070
Submission received: 12 December 2019 / Revised: 1 January 2020 / Accepted: 2 January 2020 / Published: 6 January 2020
(This article belongs to the Section Forest Ecophysiology and Biology)

Abstract

:
Hydrological effects of forest thinning have been studied at small watershed scales using the paired watershed approach since the 1920s. However, how forest transpiration, a critical component of evapotranspiration, changes decades after thinning is not well understood despite its importance for modifying drought resilience of forest ecosystem under climate change. In a semi-arid mountainous area of northern China, we measured growing season sap flow of Pinus tabuliformis, a widely planted afforestation species, in 44-year-old monoculture plantation stands with low (983 stems ha−1), medium (1688 stems ha−1), and high (2160 stems ha−1) density. Three decades after thinning, diameters at breast height (DBH) were larger in sparse stands than in dense stands. While its relation with sapwood area was density independent, the accompanying high sapwood area at the tree level for sparse stands resulted the highest stand sapwood area in the medium density stand (33.26 m2 ha−1), rather than in the high density stand (29.84 m2 ha−1). Similar to short-term studies, sparse stands demonstrated higher sensitivity to climatic fluctuations and drought depressions than dense ones. Nevertheless, stand density had no effect on the isohydric strategy of Pinus tabuliformis. Contrary to the positive relation between stand density and stand canopy transpiration soon after thinning, sparse stands exhibited higher growing season canopy transpiration than dense stands three decades later. In the dry year 2014, these density differences were relatively most pronounced, with July-September transpiration totals of 56.7 mm, 31.1 mm, and 22.1 mm in the low, medium, and high density stands, respectively. Our findings highlighted that stand density was not an appropriate indicator of thinned forest transpiration over long time scales. Interactions between soil droughts and thinning on forest transpiration need to be further clarified, especially in longer periods of time.

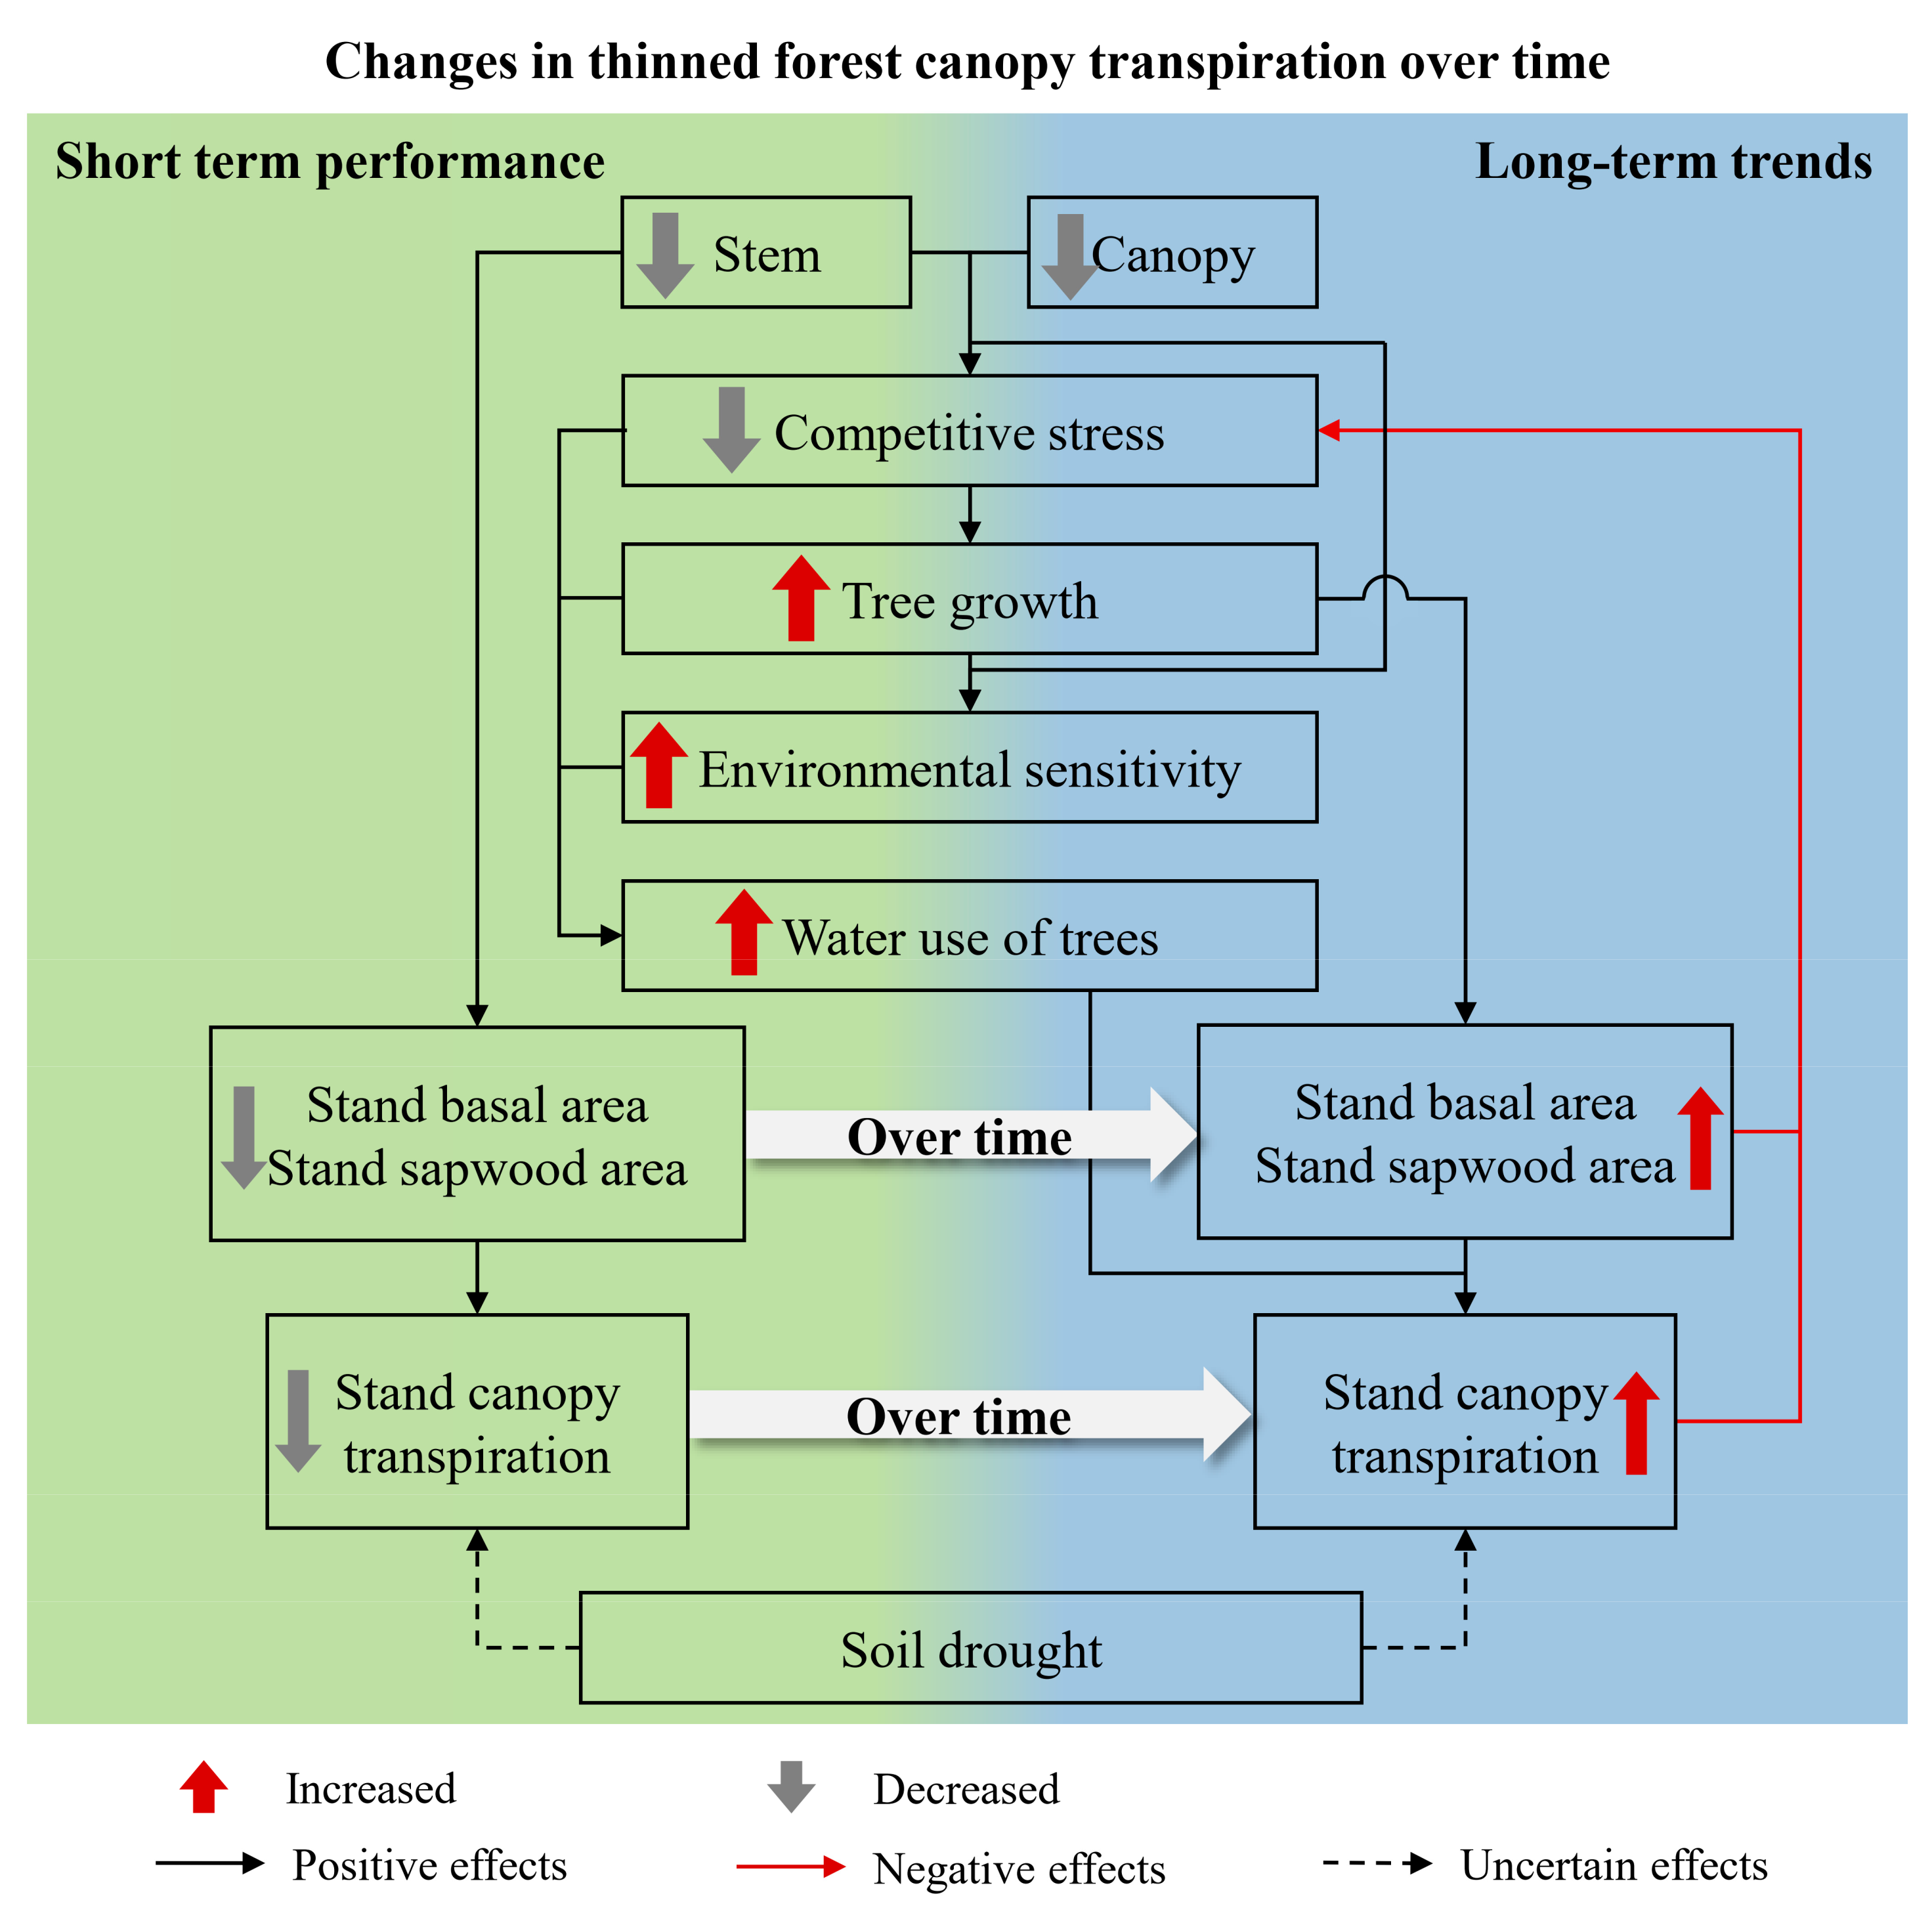
Graphical Abstract

1. Introduction

Forest thinning is widely used as a practical tool in forest watershed management [1,2]. A result of this practice is increased water yield because of decreased forest interception and transpiration, even though soil evaporation tends to increase [2,3,4]. However, because of vegetation regeneration, forest succession, and ecosystem development, these changes in the water cycle recover over time [4,5,6], although the time needed to revert to pre-thinning or controlled levels can vary substantially [5,7,8]. Besides, while forest thinning moderates drought stress [9], its impacts on forest evapotranspiration is limited when water availability is sufficient [10]. To better understand and predict temporal patterns of hydrological processes after thinning and to improve corresponding forest watershed managements in the context of expanding drought areas under climate changes [11], it is crucial to acknowledge dynamic changes of forest transpiration. Indeed, transpiration makes up a major portion (61% ± 15%) of evapotranspiration across different types of ecosystems [12]. Unfortunately, long-term studies into the dynamics of canopy transpiration after thinning have been rare to date, especially those that also consider possible modifications by soil water availability.
To evaluate and understand canopy transpiration after thinning over the long term, exploring changes in relationships between tree growth and forest density is critical, since tree biometrics, e.g., diameter at breast height (DBH), directly influence canopy transpiration [13,14,15]. The first years after thinning, reductions in stand canopy transpiration [16,17] are caused by fewer trees and the accordingly reduced sapwood area at the stand level, i.e., the effective area for tree xylem transporting water from roots to canopies [18]. The increased growth rate of retained trees, for example measured through the growth rate of DBH [19,20,21] can last for ten years or more [22]. Gebhardt et al. [23] found that, as a result of high DBH growth rates in thinned stands, basal area differences between thinned and non-thinned stands decreased over for the course of a three-year observation period just after thinning. However, given growing tree ages and forest development, how these changes would evolve in the longer term is still unclear.
Additionally, clarifying the biophysical controls of canopy transpiration under different densities is also crucial for better understanding and projecting transpiration changes for thinned forest in the long run. Soon after thinning, increased canopy transpiration at the tree level as found across a range of species and ecosystems is essentially due to enhancements in sap flux density [16,23,24], since crown structures [25], tree sizes [24], and sapwood area [16] of retained trees do not grow substantially shortly after thinning. Altered stand energy and water cycles and reduced competitive stress can lead to enhanced sap flux density through increased light transmittance of canopies [26,27], higher diurnal variations in temperature and vapor pressure deficit [28,29,30], and improved soil water availability [23,24,31]. However, it has not yet been verified whether environmental controls on water use would differ from short-term effects and whether physiological controls would be dependent on stand density decades after thinning.
While lower canopy transpiration for thinned stands can last for at least ten years [19,32], it has been suggested that forest canopy transpiration can be predicted from stand density, i.e., the lower the density for thinned stands, the lower canopy transpiration [33]. However, within three years after forest thinning, both a recovery trend of canopy transpiration for thinned stands and a reduced difference in canopy transpiration between stands differing in density has been observed [23,24]. It is also worth noting that short-term thinning effects on canopy transpiration can be ‘overwhelmed’ by specific soil water conditions. When soil water availability is sufficiently high, sap flux density and transpiration at the tree level of thinned stands can be similar to or even lower than that of unthinned stands [17,33]. When soil droughts occur, the lower stand canopy transpiration for thinned stands can be diminished, and as droughts sustain, thinned stands can end up transpiring more water [34]. So far, it is not well understood whether, decades later, interacting biotic and abiotic processes would alter the positive relationship of stand canopy transpiration with stand density and whether soil water conditions would still modify density differences in canopy transpiration.
To better understand long-term thinning effects on forest transpiration for dynamic regional water balance projections and for sound forest water management strategy development, we examined canopy transpiration under different densities resulting from thinning treatments established three decades ago in a semi-arid region. This study measured sap flow of Pinus tabuliformis, a widely planted afforestation species, in monoculture plantation stands with different current densities (983, 1688, and 2160 stems ha−1, respectively) in a mountainous area of northern China during the growing seasons of a wet (2012) and a dry (2014) year. Soil water content and meteorological variables were also measured synchronously. The objectives of this study were to test hypotheses that three decades after thinning, (1) sparse stands have higher DBH and lower stand sapwood area than dense ones, (2) sparse stands are more sensitive to environmental fluctuations and have stricter physiological controls in water use than dense ones, (3) sparse stands no longer have lower stand canopy transpiration than dense ones, and soil droughts modify density effects in canopy transpiration.

2. Materials and Methods

2.1. Site Description and Stand Selection

The study was conducted in Badaling Forest Park (40°20’ N, 116°01’ E), which is a mountainous area in Beijing, northern China, lying at an elevation of circa (c.) 780 m above sea level (a. s. l.) According to the long-term meteorological observation (1981–2010) from the closest weather station (Yanqing Weather Station, 40°27’ N, 115°58’ E), this region has a temperate semi-arid climate [35]. The mean annual precipitation is 430 mm, with 58% falling from July to September. The mean annual air temperature is 9.7 °C, and the mean value from July to September is 21.6 °C. Covered with a c. 3-cm humus horizon, the 30–50 cm cinnamon soil (luvisols) consisting of limestone, marble, conglomerate, granite, and syenite-aplite. Dominated by Pinus tabuliformis, 64% of this park is covered by plantation forests. Other species include Acer truncatum, Larix principis-rupprechtii, Platycladus orientalis, Pinus armandii, Picea asperata, Populus davidiana, Armeniaca sibirica, Cotinus coggygria, and Robinia pseudoacacia. Understory species include Ziziphus jujuba var. spinosa and Vitex negundo. The forest in the park was planted dating back to the 1950s–1970s at 1.0 × 2.0 m spacing (5000 stems ha−1). Several thinning practices were implemented 10 to 20 years later, resulting in stands with different densities in the park.
On one NE-facing slope (21–24°) at an elevation of c. 650 m a.s.l., we selected three pure Chinese pine (Pinus tabuliformis) stands with different densities, representing low (LD), medium (MD), and high (HD) density stands (Table 1). All of them were planted in 1968 at 5000 stems ha−1. In 1981, when the stands were 13 years old, thinning treatments with different intensities were implemented by removing c. 80%, 65%, and 55% of the stems. Three decades later, when the present study was performed (2012 and 2014), the density of LD, MD, and HD was 983, 1688, and 2160 stems ha−1, respectively. The current density of each stand remained the same in the two studied years. Soils in these stands are all dominated by cinnamon soil with a 50-cm depth and are covered by sporadic Vitex negundo understories. This study was performed during two growing seasons (from July to September), i.e., from the day of year (DOY) 183 to 274 in 2012 and from DOY 182 to 273 in 2014. The forest stand survey was made at the beginning of each growing season. For the HD stand in 2012, we only measured soil water content for another experiment. Forest stand survey and sap flow measurement in the HD stand only conducted in 2014.

2.2. Meteorology and Soil Water Content

Precipitation (mm), air temperature (°C), relatively humidity (%), and solar radiation (Rs, W m−2) were recorded continuously from July to September in 2012 and 2014 with an Onset HOBO U30 automatic weather station (Onset Computer Corp., Bourne, MA, USA) located in an open field about 200 m away from each studied stand. These variables were measured every 30 s and recorded as the mean or the total values over a 30-min interval. To represent the atmospheric water demand, vapor pressure deficit (VPD, kPa) was calculated by using air temperature and relatively humidity in a classical formula [36]. Daily total solar radiation (Rs) was also expressed as a unit of MJ m−2 d−1.
Soil volumetric water content was measured half-hourly at depths of 20 cm and 40 cm in each stand using the Hydra Probe Ⅱ (Stevens Water Monitoring System, Inc., Portland, OR, USA) from July to September in 2012 and 2014. The sensors were inserted horizontally into the soil. Data were scanned every 10 s and recorded by CR1000 data loggers (Campbell Scientific Inc., Logan, UT, USA) every 30 s. Sensors in the LD stand had to be reinstalled on DOY 253 of 2012 because of possible interference with soil cores taken too close. Relative extractable water (REW, unitless) for each stand was calculated with the averaged soil water content of 20 cm and 40 cm soil depths (θ, m3 m−3):
R E W = θ θ m i n θ m a x θ m i n ,
where θmax and θmin represent the saturated (maximum measured θ) and minimum θ during the studied period [37]. Soil water conditions were divided into three periods based on the REW, defined as the severe water stress period (SS) when REW ≤ 0.1, the moderate water stress period (MS) when 0.1 < REW ≤ 0.4, and the non-stressed period (W) when REW > 0.4 [37,38,39].

2.3. Sapwood Area Estimates

Sapwood area (As, cm2) at the tree level was determined by its species-specific relation [40] with DBH (cm) [41,42]. In each stand, 15–16 trees were sampled to cover the whole range of DBH classes [43]. Wood samples from each sampled tree were taken at breast height using a 5-mm increment corer. The sapwood area was identified as the area turning red after treating the increment cores with a safranin-O solution [44]. We used the stand sapwood area (SA, m2 ha−1), i.e., total sapwood area per unit of ground area, to compare the sapwood area magnitude at the stand level between stands with different densities.

2.4. Sap Flow Measurements and Transpiration Calculation

Sap flow measurements were conducted from July to September in 2012 and 2014 for LD and MD, and in 2014 for HD. With comparable sample sizes and a methodology similar to previous studies, eight sap flow sampled trees were chosen to be representative of DBH class distributions for each plot [41,45,46]. Specifically, trees were only selected when they had symmetrical stems and no branch or bark deformities within 15 cm above or below breast height (1.3 m).
Sap flux densities were measured by Granier-type thermal dissipation sensors at breast height. Sensors were inserted on the north aspect of the stem [47,48], since circumferential variations in sap flux density have been shown not to generate significant errors in the whole tree sap flow measurement for Pinus tabuliformis in the mountains of Beijing [49]. To shield sensor units from solar radiation and rainfall, they were wrapped in aluminum foil. Data were taken every 10 seconds, and the averaged values were recorded by CR1000 data loggers (Campbell Scientific Inc., Logan, UT, USA) at a 30-min interval. Based on the energy conservation principle, sap flux density (J, g cm−2 s−1) can be calculated based on the temperature difference (ΔT, °C) between the heated and reference probes following a commonly-used equation [50]:
J = 0.0119 · Δ T m Δ T Δ T 1.231 ,
where ΔTm (°C) represents the ΔT when sap flux density is zero. To determine the ΔTm, the physically-based approach was applied [51,52]. Calculation of sap flux density was performed using Baseliner Software (version 3.0.7; Ram Oren, Duke University, Durham, NC, USA) [52].
Considering the radial variation of sap flux density, the generalized Gaussian function in describing the radial profile of gymnosperm sap flux density [53] was applied to calculate the mean sap flux density (Jtree, g cm−2 s−1) for each sampled tree by the measured sap flux density (J) and the corresponding relative sapwood depth (i.e., the ratio of the measuring depth to the sapwood depth) (see details in Litvak et al. [54] and Wang et al. [55]). The validity of this function for Pinus tabuliformis could be justified by observations of Sun et al. [56] and Wang et al. [47], and we assumed that possible estimation uncertainties generated by unknown thinning effects on radial profiles were minor. In this study, we assumed the amount of sap flow measured at breast height was equal to canopy transpiration [57]. Daily transpiration at the tree level (Etree, kg d−1) was calculated as follows:
E t r e e = 1 1000 j = 1 48 J t r e e , j · 1800 · A s ,
where Jtree,j represents the jth Jtree value over a one-day period, and As represents the sapwood area of the tree. There were 48 values for each day because of the 30-min recording interval.
Further, sap flux density at the stand level (Jz, g cm−2 s−1) was calculated as follows [42]:
J z = 1 A s s t a n d i = 1 n J t r e e , i · A s , i ,
where Jtree,i and As,i represent the averaged Jtree and the total sapwood area of the ith DBH class, respectively, and As-stand represents the total sapwood area for all trees. Finally, daily canopy transpiration at the stand level (Ec, kg d−1) was calculated as follows [41,42]:
E c = 1 1000 j = 1 48 J z , j · 1800 · A s s t a n d ,
where Jz,j (g cm−2 s−1) represents the jth Jz value over a one-day period. The daily Jz and daily Ec were also expressed as a unit of m3 m−2 d−1 and mm d−1, respectively.

2.5. Canopy Conductance Estimates

Considering the coniferous canopy is well-coupled with the atmosphere [58], the canopy conductance (Gc, mm s−1) of each stand was calculated using the simplified Penman-Monteith equation [59]:
G c = λ γ E c ρ C p V P D ,
where γ is the psychrometric constant (kPa °C−1), λ is the latent heat of water vaporization (MJ kg−1), ρ is the air density (kg m−3), and Cp is the specific heat of the air (MJ kg−1 °C−1). Sap flow data could be noisy on rainy days [60], and the Gc calculation is imprecise under low VPD [61]; therefore, half-hourly data on rainy days (i.e., 76 rainy days for the two growing seasons together) and associated with instantaneous humid air conditions (when half-hourly VPD < 0.6 kPa) were excluded. Averaged half-hourly daytime values (when Rs > 5 W m−2) were considered as the daily Gc.
Following the boundary line analysis described by Schäfer et al. [62], we used half-hourly daytime data and employed the following simplified equation to analyze physiological controls of Gc [63]:
G c = m · l n V P D + G c r e f ,
where Gcref (mm s−1) is the Gc when VPD = 1 kPa, which can be used as surrogate for the maximum Gc, and -m (mm s−1 lnkPa−1) is the slope of Gc versus lnVPD (i.e., −dGc/dlnVPD), where the dGc/dlnVPD represents the sensitivity of Gc to VPD and implies the closure rate of canopy stomatal [62,64,65]. The ratio of dGc/dlnVPD to Gcref is 0.6 across a wide range of species [66] and environmental conditions [65].

2.6. Data Analysis

Repeated measures ANOVA was used to evaluate density effects on DBH, sap flux density, and canopy transpiration, treating measured sampled trees in each stand as statistical samples of each density treatment. Effects of within-subjects, i.e., repeated measures or DOY, were all insignificant (p > 0.05) in this study. Pearson correlation analysis and partial correlation analysis were used to test relationships between two variables. Functional relationships between two significantly correlated variables were built by linear or nonlinear regression analysis. Density differences in relationships were analyzed by ANCOVA. Considering sap flow data could be noisy on these days [60], all statistical analyses used values after removing rainy day data and were carried out with SPSS (version 19, Chicago, IL, USA). Significance was reported at the 0.05 level. Curve fittings were run through Sigmaplot (version 12.5, Systat Software, San Jose, CA, USA).

3. Results

3.1. Climatic and Soil Water Variations

During the studied growing seasons, mean daily Rs in 2012 was 12.21 ± 0.53 (SE) MJ·m−2·d−1 and was higher than the 10.09 ± 0.46 MJ·m−2·d−1 in 2014 (Figure 1). Mean daily temperature was lower in 2012 (18.97 ± 0.39 °C) than in 2014 (19.94 ± 0.40 °C). Mean daily VPD of 0.44 ± 0.04 kPa in 2012 was lower than the 0.65 ± 0.05 kPa in 2014 (Figure 1). Concurrent total precipitation in 2012 and 2014 was 307 mm and 163 mm, which was 22% higher and 35% lower than the long-term average value, respectively. The higher precipitation in 2012 was largely due to a number of heavy precipitation events (Figure 1). Similar to precipitation, the θ of each stand was higher in 2012 than in 2014 (Figure 1). The MD stand had the lowest mean daily θ in both years, 0.16 m3 m−3 in 2012 and 0.10 m3·m−3 in 2014, whereas the HD stand had the highest, though the difference with the LD stand was small, 0.29 m3 m−3 vs. 0.28 m3 m−3 in 2012; 0.14 m3 m−3 vs. 0.13 m3·m−3 in 2014 (Figure 1).

3.2. DBH and Sapwood Area

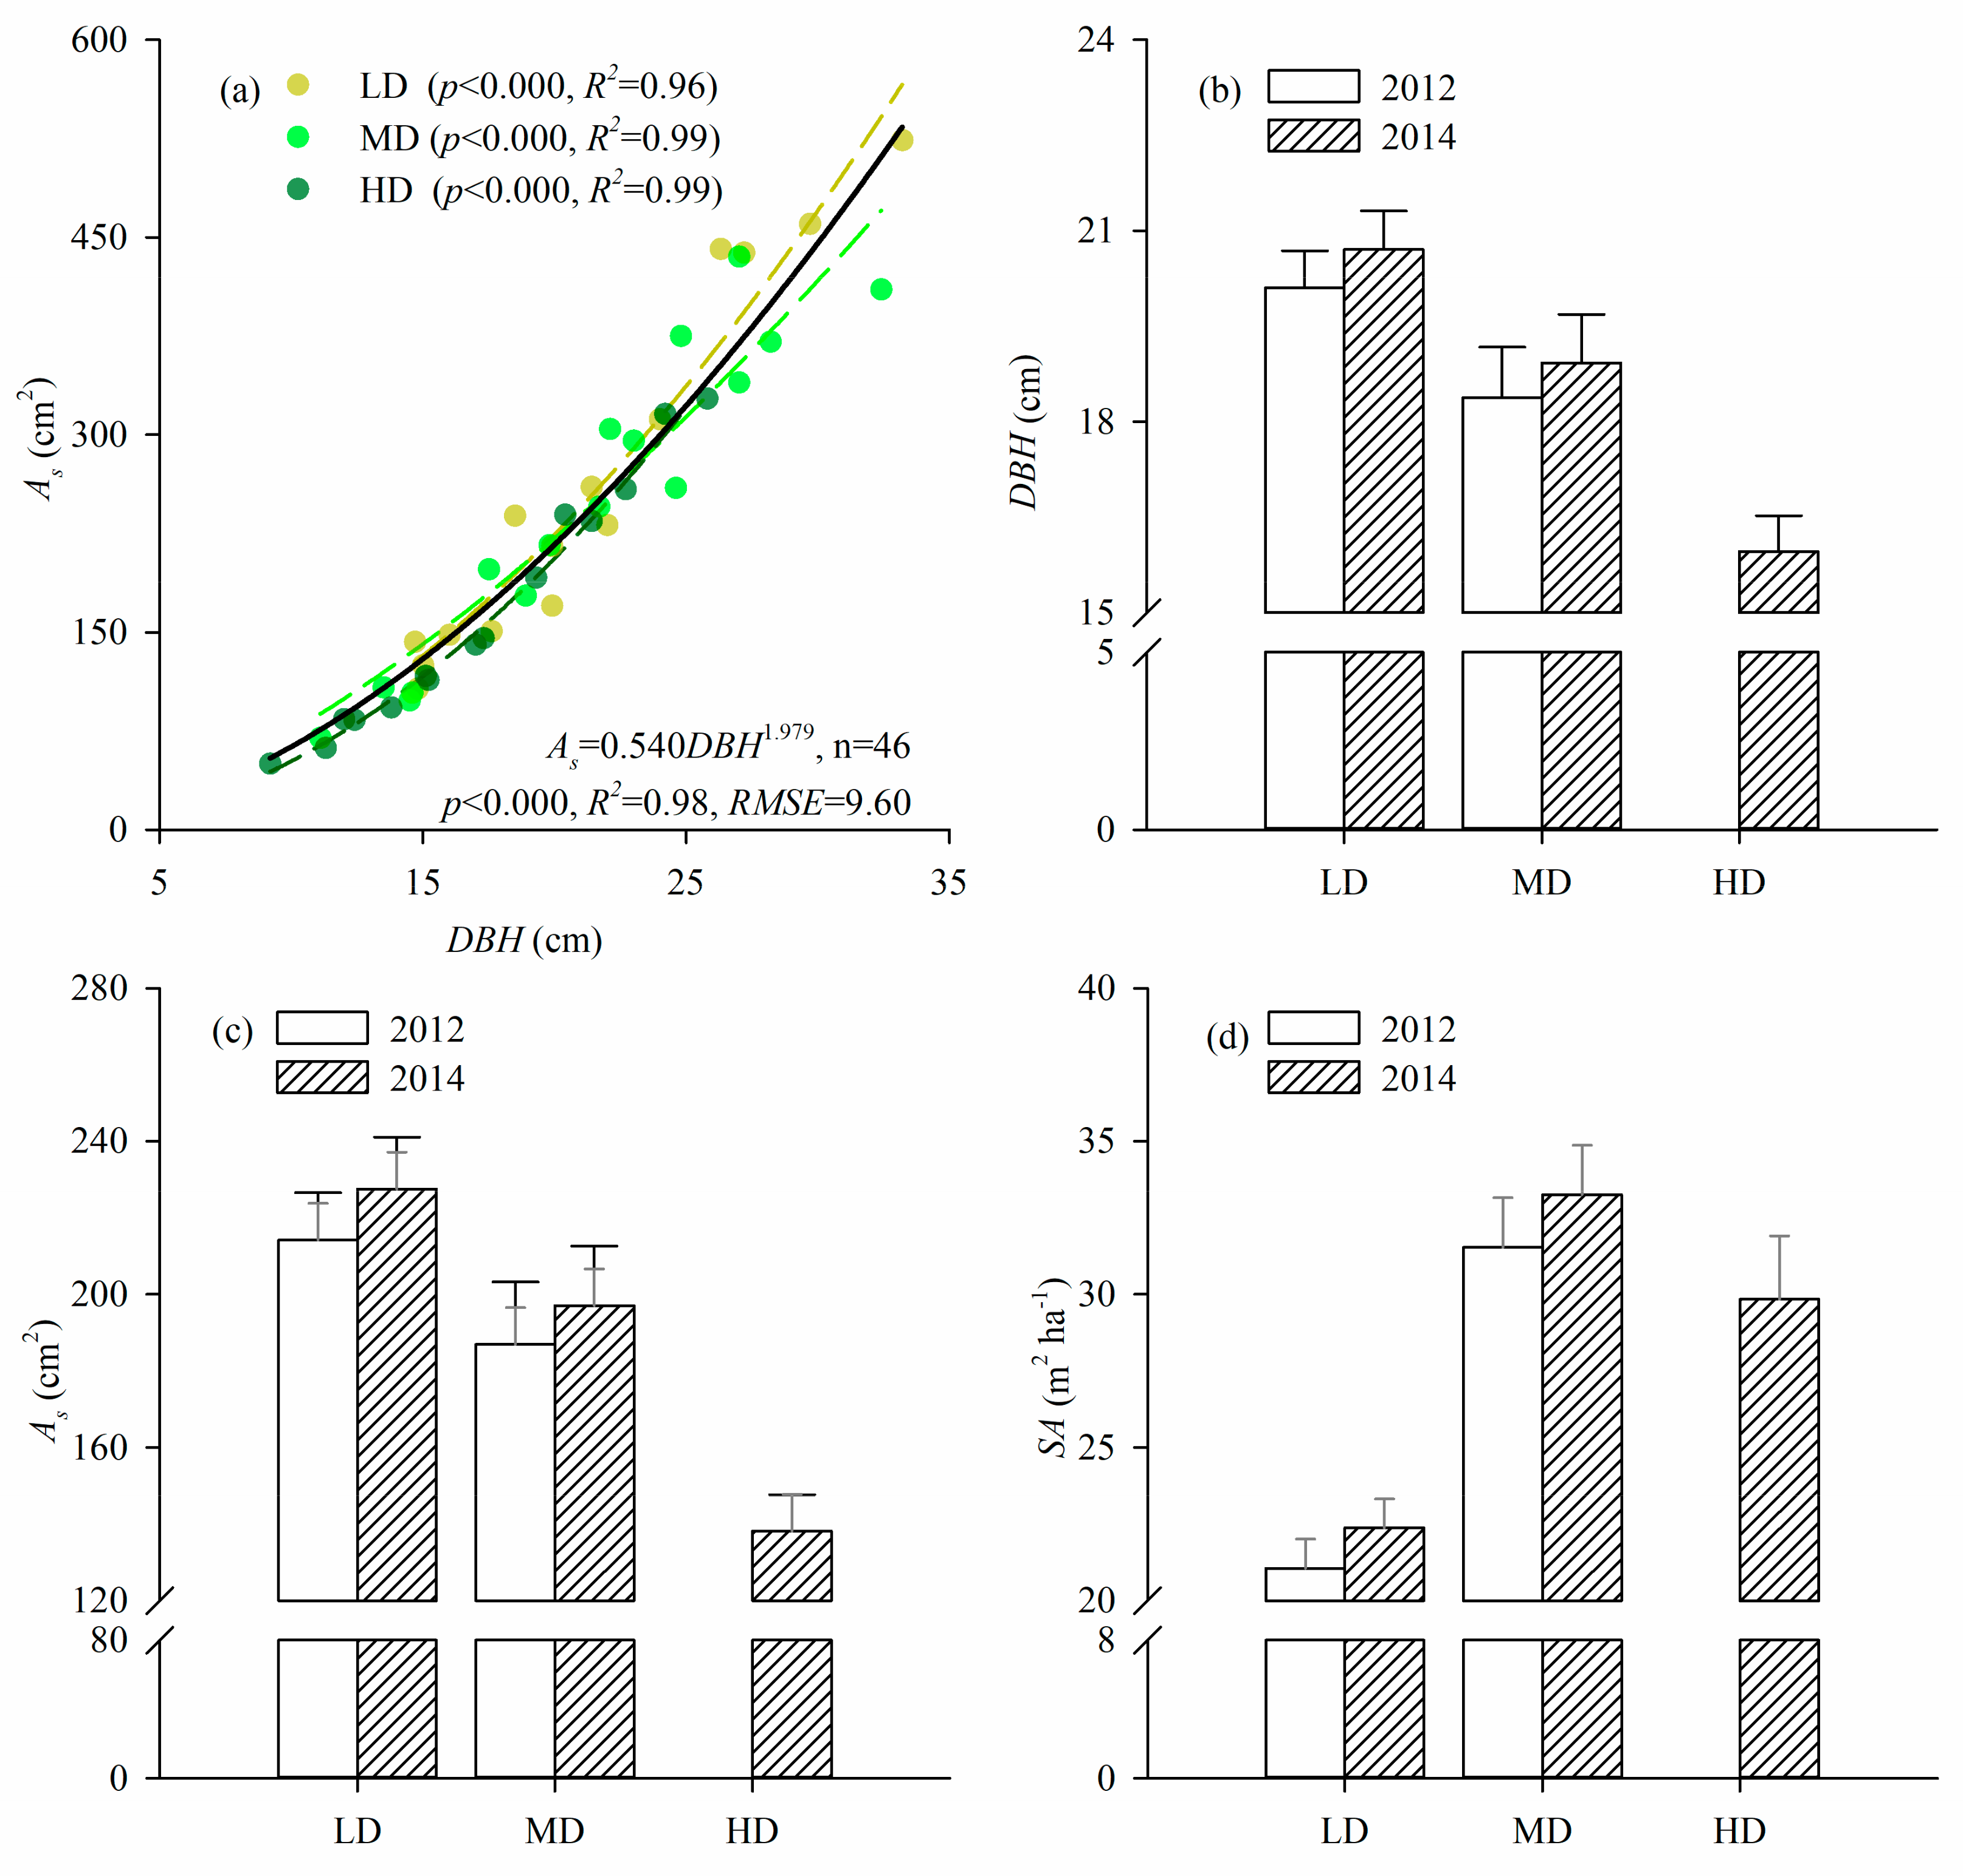
Significant power-function relations between DBH and sapwood area were independent of stand density (Figure 2a and Table 2). Three decades after thinning treatments, sparse stands (both LD and MD) had significantly larger DBH than dense stands (Figure 2b and Table 2), and the growth of DBH during the study period was also higher for the LD stand (0.61 cm) than for the MD stand (0.55 cm). While sapwood area at the tree level was also larger for sparse than for dense stands (Figure 2c), the LD stand had the lowest sapwood area at the stand level (SA) compared to denser stands. Interestingly, the highest SA was not found in the HD stand but in the MD stand (Figure 2d). The SA of the MD stand in 2014 was 33.3 m2 ha−1, which was 49% larger than the 22.4 m2 ha−1 of LD and 11% larger than the 29.8 m2 ha−1 HD.

3.3. Biophysical Controls

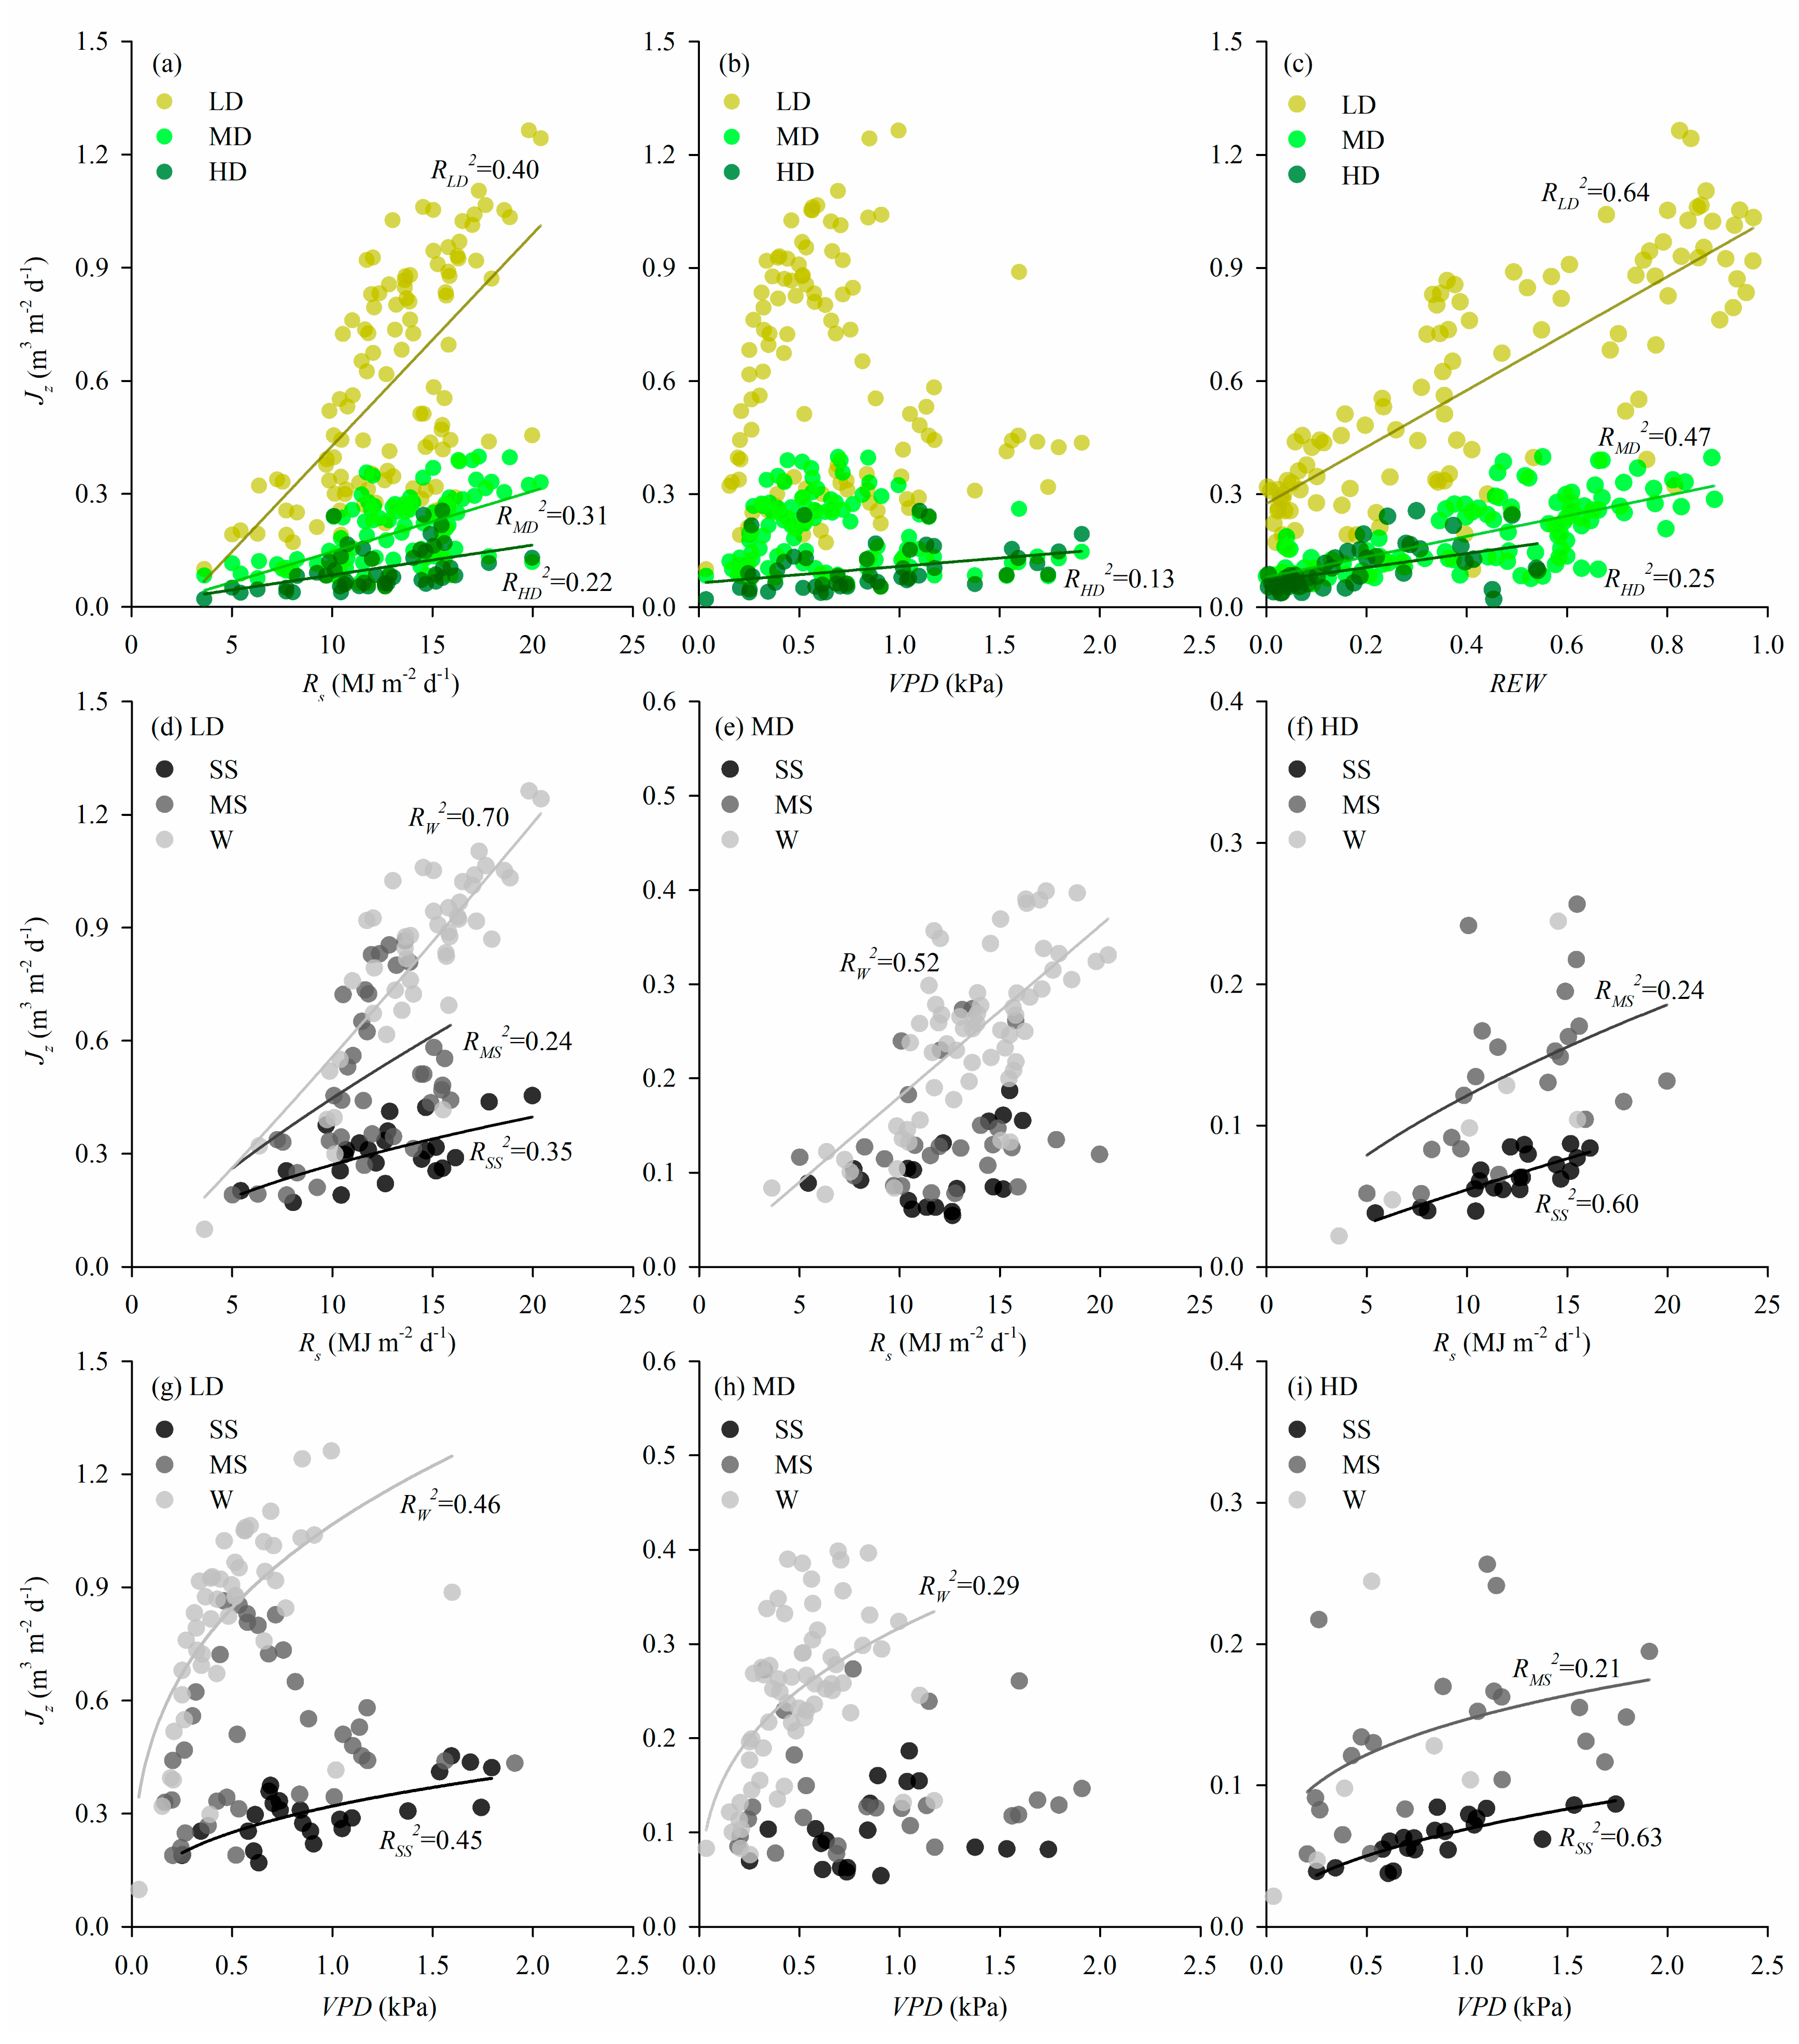
During the growing seasons of the wet year, 2012, and the dry year, 2014, Jz was significantly positive related with Rs for stands with different densities (Table 3 and Figure 3a). The significant positive correlation between Jz and VPD only occurred in the HD stand (Table 3 and Figure 3b), where its θ was higher than the other two. As soil water stress became more severe, i.e., when REW decreased, Jz was significantly suppressed under all three densities (Table 3 and Figure 3c). After excluding the significant influence of REW, Jz responses to VPD for the LD and MD stands became significant in a positive way, and correlation coefficients for Jz relations with Rs and VPD in the HD stand became larger (Table 3), implying REW modulated climatic controls on Jz, particularly VPD controls in the LD and MD stands. As soils got drier, Jz responses to Rs (Figure 3d,e,f) and VPD (Figure 3g,h,i) were less sensitive. In general, compared with dense stands, slopes of Jz for responses to Rs, VPD, and REW were larger for sparse stands, i.e., water use in sparse stands showed higher sensitivity to environmental conditions (Figure 3). Specifically, stand density differences in Rs controls and soil water stress depressions on Jz were significant (Table 3).
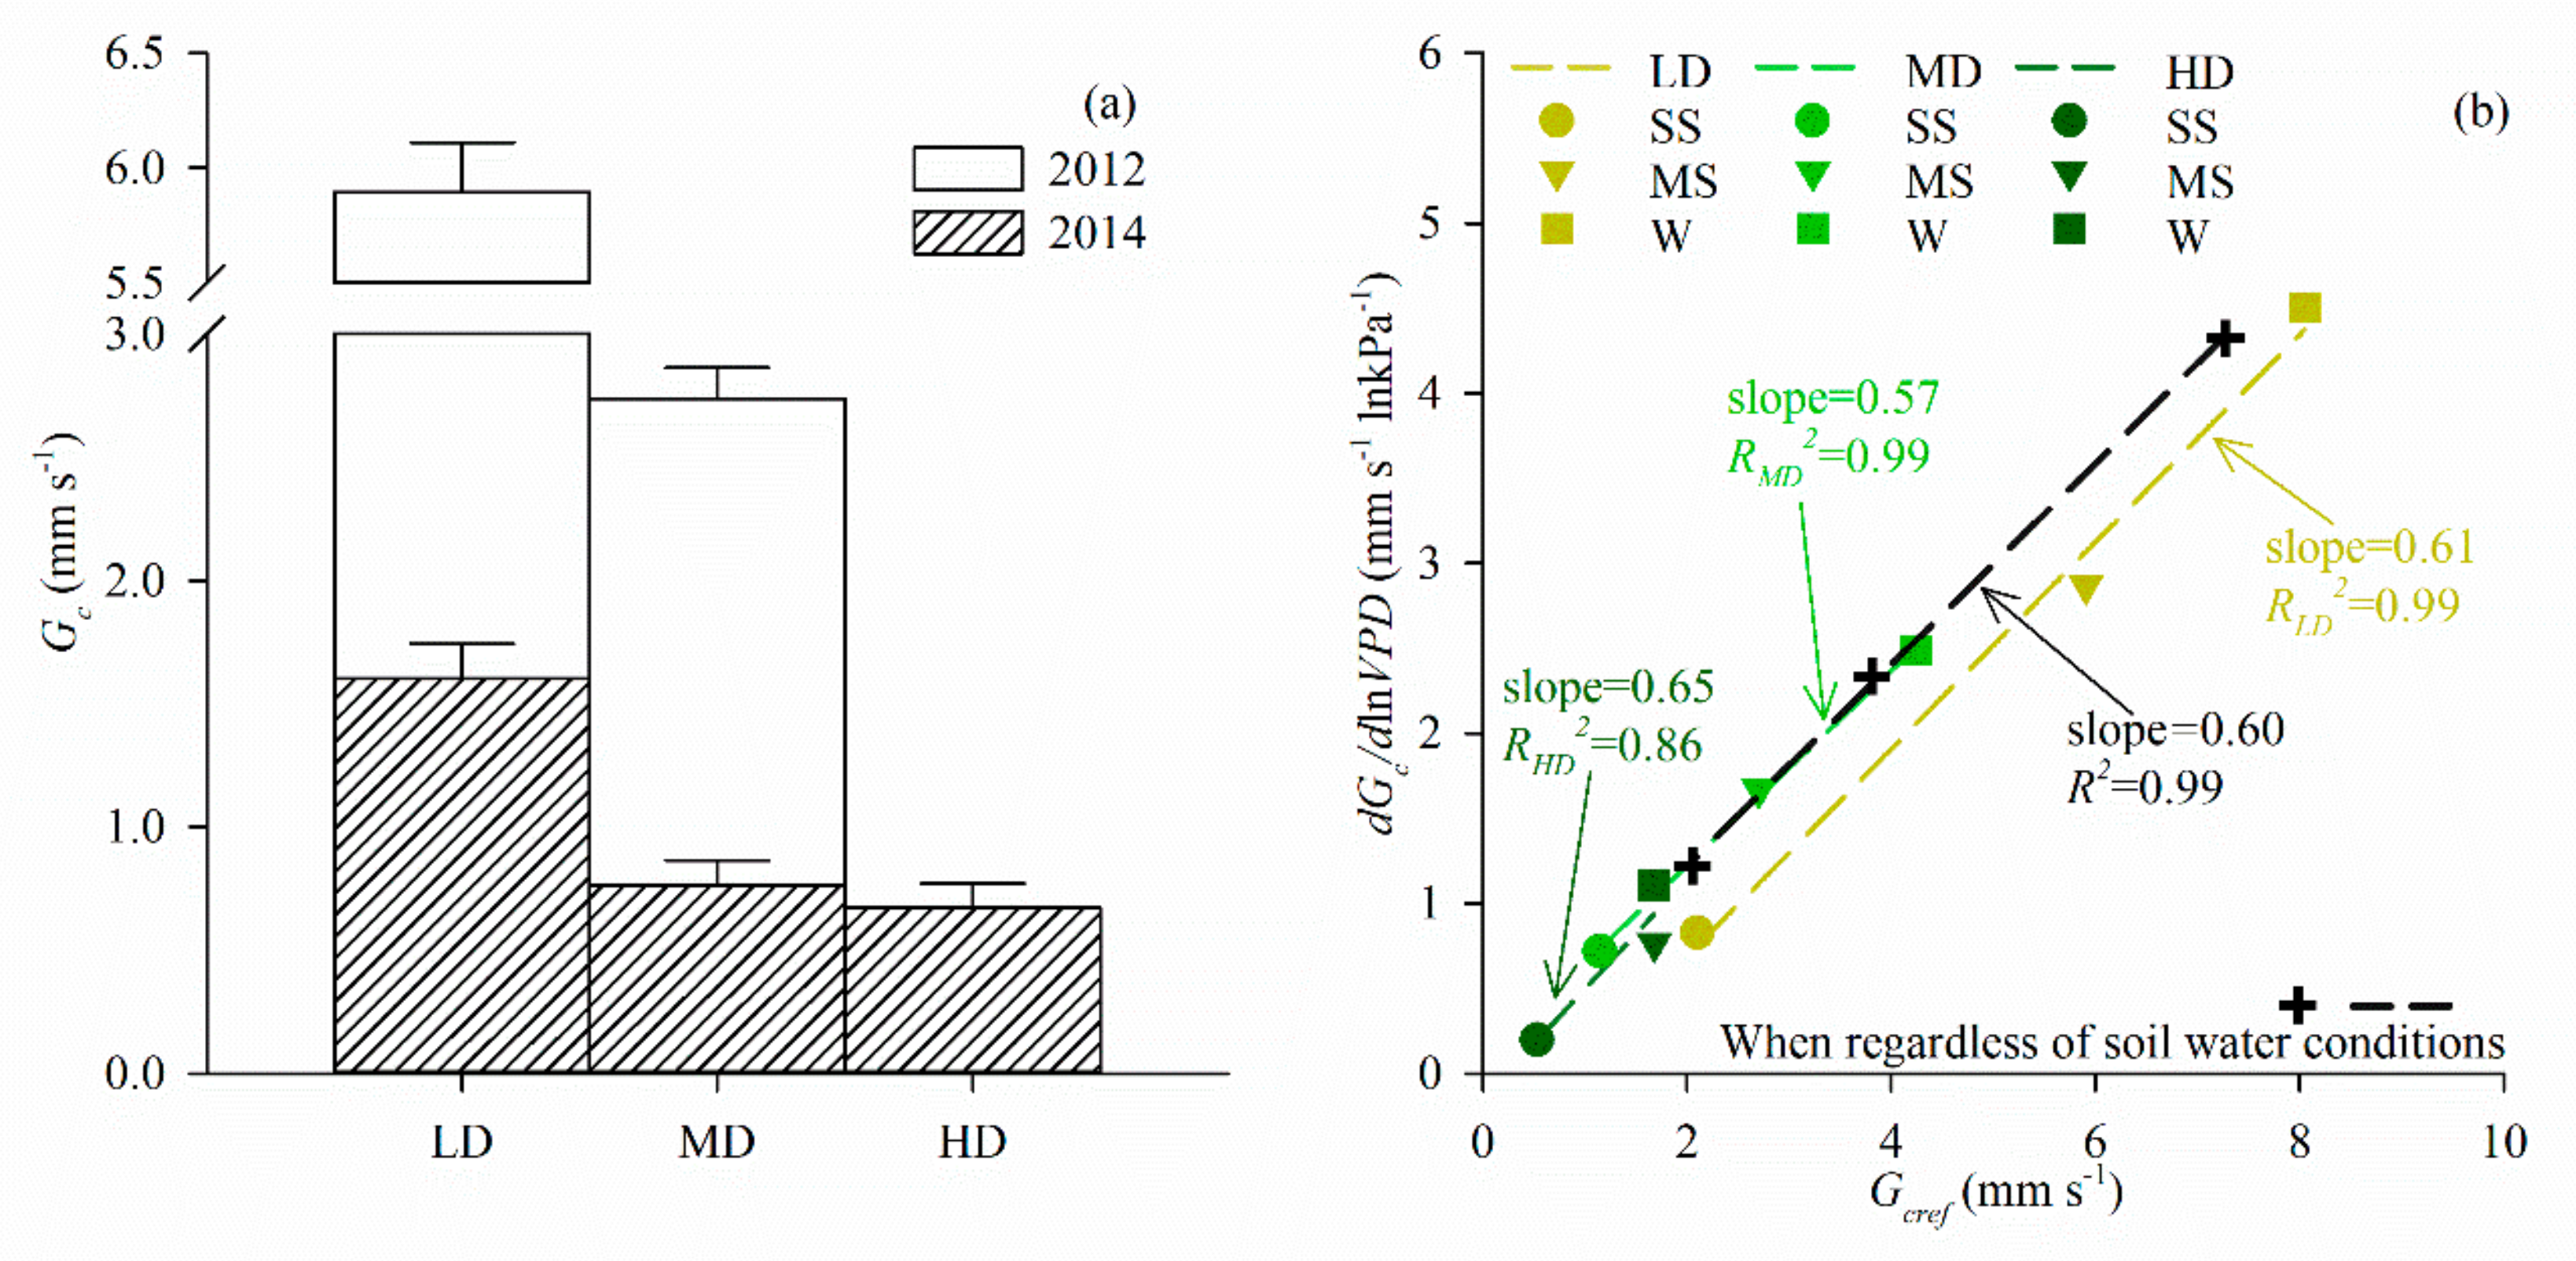
While all stands had lower canopy conductance in the dry year 2014 compared to the wet year 2012, canopy conductance for sparse stands was higher than for dense stands in both years (Figure 4a). The regulation of Gc by VPD significantly followed logarithmic functions regardless of stand density and soil water conditions (p < 0.000, R2 = 0.74 ± 0.03, n = 12). While dGc/dlnVPD and Gcref were nominally larger for sparse stands and for less stressed soil water conditions (Figure 4b), relationships between dGc/dlnVPD and Gcref, i.e., physiological control strategy, were statistically the same among densities (Table 3) and soil water conditions (F = 2.436, p = 0.183).

3.4. Sap Flux Density and Canopy Transpiration

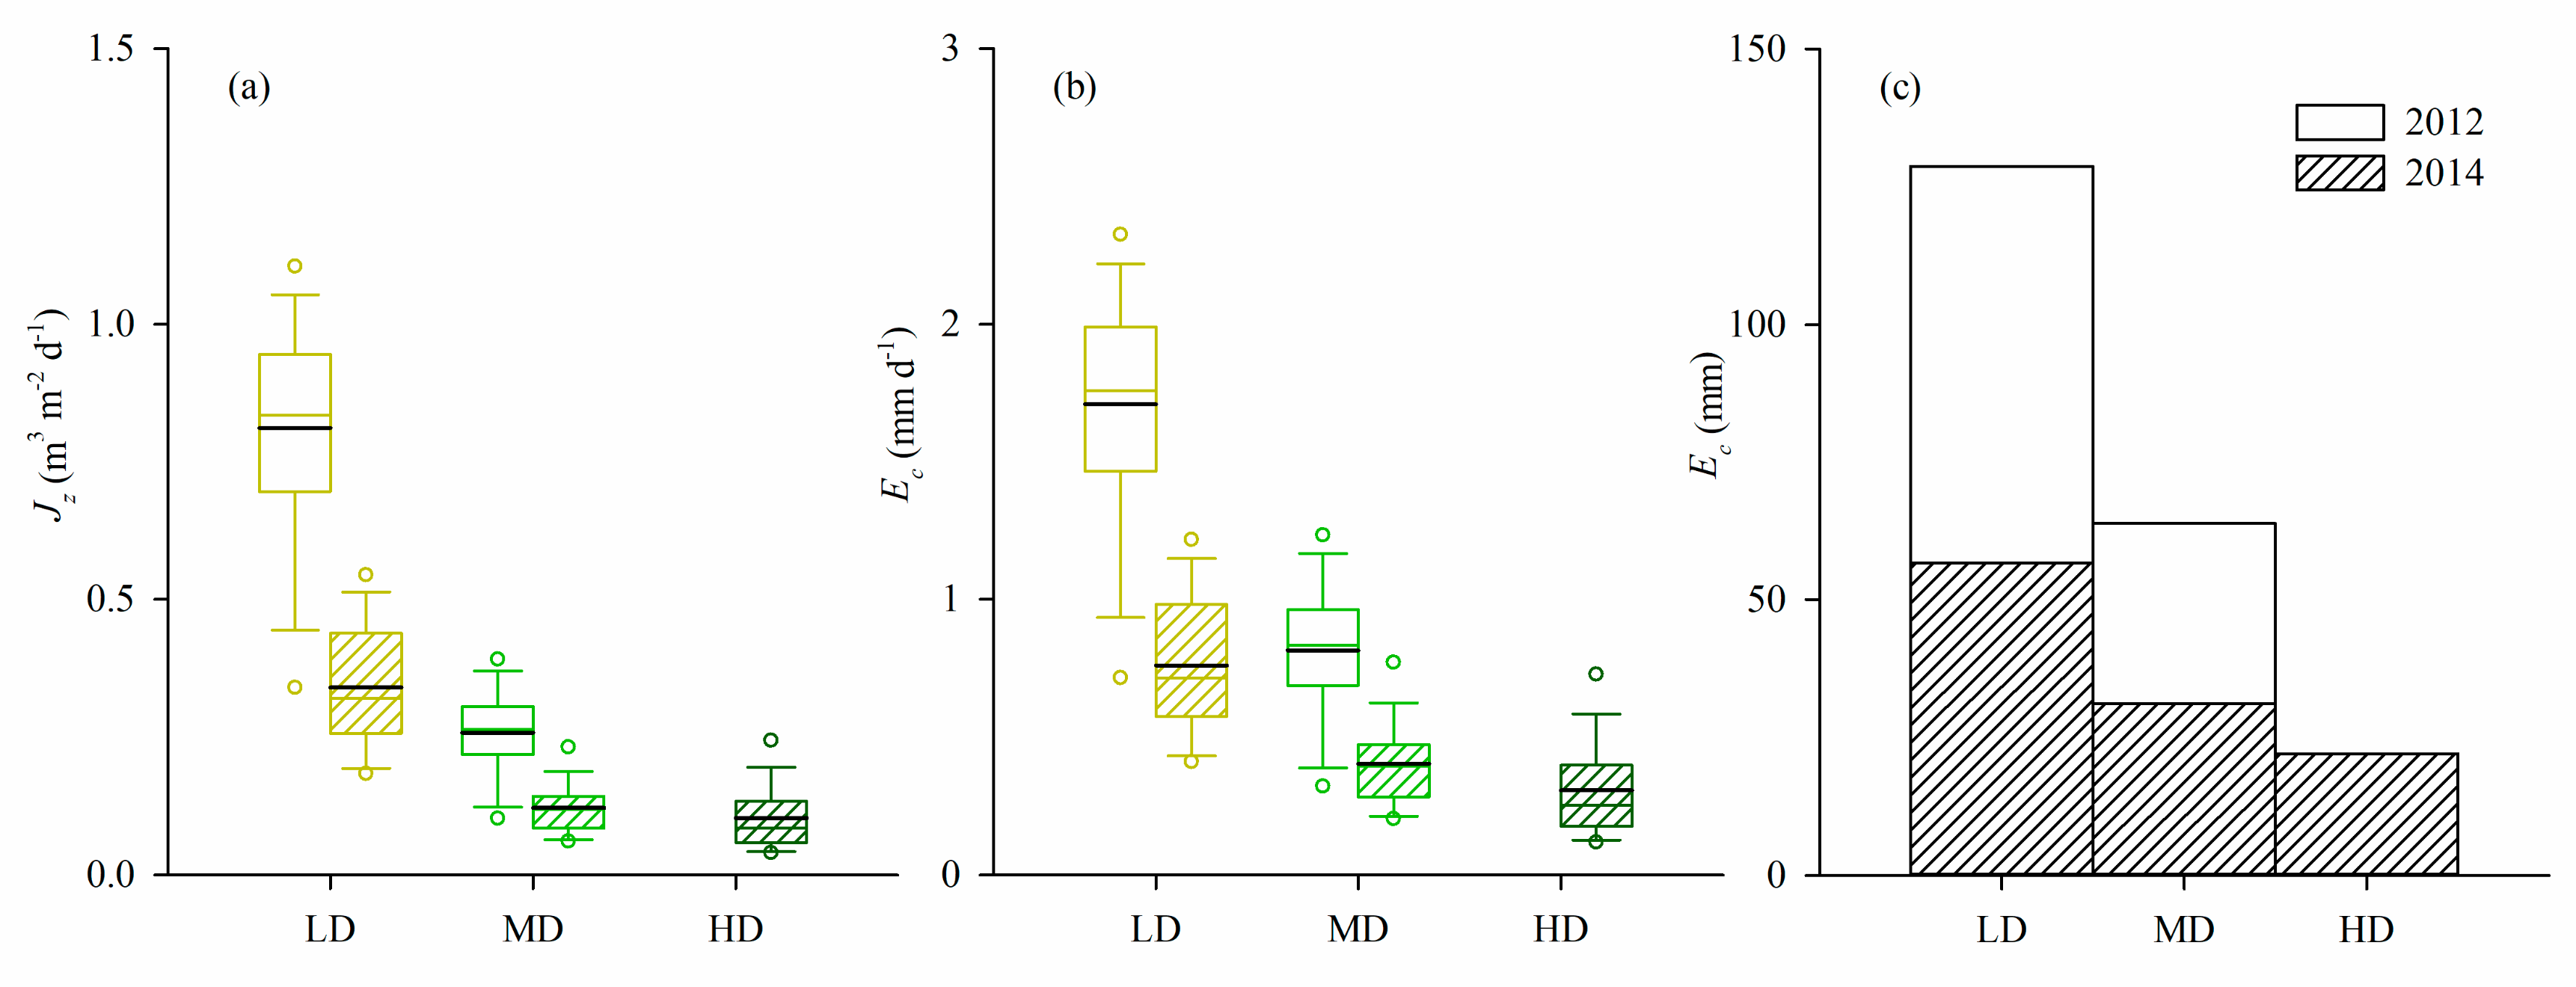
Three decades after thinning, sparse stands exhibited generally higher growing season (from July through September) sap flux density and canopy transpiration at the stand level than dense ones (Figure 5). Total growing season stand canopy transpiration was 128.8 mm and 56.7 mm for the LD and MD stands in 2012, and 56.7 mm, 31.1mm, and 22.1mm for the LD, MD, HD stands in 2014. However, the density differences in sap flux density and canopy transpiration only turned out to be significant in the dry year (2014), with LD having significantly higher sap flux density and canopy transpiration than the MD and HD stands (Table 4).

4. Discussion

4.1. DBH and Sapwood Area

Three decades after thinning, we observed higher growth rates of DBH in the low density stand compared to the medium density stand. This indicates that, driven by altered energy and water conditions and competition for resources [24,67], positive effects of reduced stand densities after thinning on tree growth [19,20,21] were still present in the longer term (Figure 6). The different growth rates resulted in higher DBH for sparse stands compared to dense stands three decades after thinning, i.e., the low and medium density stands had significantly larger DBH than the high density stand in our study.
Relations between DBH and sapwood area for Pinus tabuliformis were found to be independent of stand density [68], which implies that this species-specific relation [40] would not be affected by density differences. Accompanied with higher DBH, sparse stands had larger sapwood area at the individual level. As for the stand level, because of faster growth rates of DBH, the thinning-reduced stand total basal area and sapwood area in sparse stands [16,17] can recover more quickly and attain a level that is close to dense stands over time (Figure 6) [23,69,70]. The positive relation between stand sapwood area and density was modified due to larger sapwood area at the tree level three decades after thinning, i.e., stand sapwood area of the medium density stand had overtaken that of the high density stand.
Stand sapwood area was highest in the medium density stand, highlighting that it demonstrates a recovery trend after thinning. Our findings do not imply that stand sapwood area in the low density stand would overtake the medium density stand in the future. Although DBH is a good indicator for comparing the sapwood area of even-aged trees despite density differences [19,71], altered heartwood transformation with tree age [72] and decreased sapwood thickness with stand density [73] could complicate predictions of temporal patterns of stand sapwood area under different stand densities on a long time scale [19]. Considering the crucial role stand sapwood area plays in transporting water from roots to canopies through xylem [18] and in affecting forest transpiration [40], further studies on establishing temporal growth patterns of DBH and sapwood area after thinning are needed to better understand and predict the dynamics of thinned forest transpiration in the longer term.

4.2. Biophysical Controls

In this semi-arid site, soil water conditions significantly modulated the relationships between climatic variables and tree water use. This was particularly apparent for VPD controls, i.e., significant positive correlations between sap flow density and VPD were obscured by the concurrent regulations by soil water conditions for stands with relatively low soil water content (i.e., the low and medium density stands). Soil water stress modifies water potentials within continuous vessels/tracheids systems, triggers stomata closure, reducing canopy conductance and sap flux density, as well as the sensitivity to changes in VPD [39,41,74]. After removing stems and canopies through thinning, more light-exposed canopies [75] and water stress subjected sun-exposed needles [76] generally lead to higher sensitivities of tree water use to environmental conditions i.e., solar radiation and to water potential related factors (Figure 6) [3,16,24]. Meanwhile, trees with larger DBH are usually more sensitive to water stress than smaller ones, since their larger crowns expose them to higher evaporative demands and make them more vulnerable to hydraulic stress [77]. Therefore, because thinning leads to larger individual trees [78], sparse stands still elicited higher sensitivity to climatic variation and drought depression of water use than dense stands, as well as faster stomatal closure when VPD was high.
Additionally, physiological control strategies of Pinus tabuliformis were not affected by soil water conditions and stand density three decades after thinning. This indicates that in this semi-arid region, even if there was relief of soil water stress due to relatively high precipitation in the wet year (2012), or possible relief from competitive stress due to thinning, Pinus tabuliformis would still maintain a tight physiological control strategy, i.e., an isohydric strategy, to avoid possible hydraulic failure.

4.3. Influence of Stand Density and Soil Drought on Canopy Transpiration

In line with short-term thinning effects on stand canopy transpiration [23], high sap flux density and canopy transpiration at the tree level in sparse stands [16,23,24] facilitated a recovery in canopy transpiration at the stand level. These effects could even overwhelm effects of the stand sapwood area on stand canopy transpiration in the long run (Figure 6). For instance, we found that the highest sap flux density in the low density stand resulted in the highest stand canopy transpiration in spite of also having the lowest stand sapwood area three decades after thinning. Moreover, though stand sapwood area in our study was no longer the main source generating variations in thinned forest canopy transpiration as indicated by previous studies [16,17,79], its recovery could also facilitate the recovery of stand canopy transpiration (Figure 6). Specifically, higher stand sapwood area in the medium density stand compared to the high density stand exacerbated water use differences at the stand level. Clearly, effects of higher sap flux density and recovery of stand sapwood area following thinning both contributed to a recovery trend in stand canopy transpiration and reversed the positive relationship between stand canopy transpiration and stand density, i.e., stand canopy transpiration in sparse stands ultimately became higher than in dense stands decades after thinning. Therefore, over longer time scales, stand density was no longer an appropriate indicator of thinned forest transpiration, and watershed management should pay attention to the tradeoff between water use, wood productivity, and ecological function for forest ecosystems long-term following thinning practices.
Soil water stress can be reduced by thinning, thereby promoting tree water use, and soil droughts amplify this effect in the short-term, i.e., thinned stands exhibited similar or higher stand canopy transpiration than unthinned stands [34], and in the longer term, canopy transpiration for the low density stand was relatively higher in comparison to the unthinned stand in the dry year (2014), rather than in the wet year (2012). Meanwhile, due to canopy recovery and forest succession following thinning, ecosystem water use (i.e., evapotranspiration) recovers over time [4,5,6]. Feedbacks between forest development and stand water cycling in the long run could revert some of the initial consequences of thinning practices, especially the relief of drought stress [9,67,80], and also complicate forest water use predictions as the increase in stand canopy transpiration is expected to level off in the longer run (Figure 6). Therefore, to further clarify and predict dynamic changes in regional hydrological processes after thinning practices in the context of accelerated expansion of drylands under climate changes [11], long-term observations focused on thinned forest transpiration and studies on interactions between soil drought and thinning on forest transpiration on different time scales are imperative.

5. Conclusions

Three decades after thinning, diameters at breast height were larger in sparse than in dense stands. While its relation with sapwood area was density independent, the accompanying high sapwood area at the tree level for sparse stands resulted in the highest stand sapwood area in the medium density stand, rather than in the high density stand. In line with short-term thinning studies, sparse stands demonstrated higher sensitivity in their responses to climatic conditions and droughts than dense ones. Stand density nevertheless had no effect on the general isohydric strategy of Pinus tabuliformis. Contrary to the positive relation between stand density and stand canopy transpiration observed shortly after thinning, we found that sparse stands exhibited higher canopy transpiration than dense stands three decades later. This density effect on canopy transpiration was most pronounced in the dry year. Our findings highlight that stand density may not be an appropriate indicator of thinned forest transpiration over long time scales and that interactions between soil droughts and thinning on forest transpiration need to be further clarified, especially in the longer term.

Author Contributions

Conceptualization, Z.C. and Z.Z.; methodology, Z.C., Z.Z. and L.C.; software, Z.C. and H.X.; formal analysis, Z.C.; investigation, Z.C., J.L., Z.X. and H.X.; resources, Z.Z., Y.C. and H.Z.; data curation, Z.C., J.L. and Z.X.; writing—original draft preparation, Z.C.; writing—review and editing, Z.C., Z.Z., L.C. and C.S.; visualization, Z.C.; supervision, Z.Z. and L.C.; project administration, Z.Z., L.C. and Y.C.; funding acquisition, Z.Z. and Y.C. All authors have read and agreed to the published version of the manuscript.

Funding

This research was funded by National Natural Science Foundation of China, grant number 41140011, National Science-technology Support Plan Projects, grant number 2015BAD07B06-4, and Graduate Training and Development Program of Beijing Municipal Commission of Education, grant number BLCXY201506.

Acknowledgments

The Beijing Badaling Forest Farm supported the field experiment. We thank two anonymous referees for their insightful comments.

Conflicts of Interest

The authors declare no conflict of interest. The funders had no role in the design of the study; in the collection, analyses, or interpretation of data; in the writing of the manuscript, or in the decision to publish the results.

References

  1. Moreno, H.A.; Gupta, H.V.; White, D.D.; Sampson, D.A. Modeling the distributed effects of forest thinning on the long-term water balance and streamflow extremes for a semi-arid basin in the southwestern US. Hydrol. Earth Syst. Sci. 2016, 20, 1241–1267. [Google Scholar] [CrossRef] [Green Version]
  2. Dung, B.X.; Gomi, T.; Miyata, S.; Sidle, R.C.; Kosugi, K.; Onda, Y. Runoff responses to forest thinning at plot and catchment scales in a headwater catchment draining Japanese cypress forest. J. Hydrol. 2012, 444–445, 51–62. [Google Scholar] [CrossRef]
  3. Boggs, J.; Sun, G.; Domec, J.C.; McNulty, S.; Treasure, E. Clearcutting upland forest alters transpiration of residual trees in the riparian buffer zone. Hydrol. Process. 2015, 29, 4979–4992. [Google Scholar] [CrossRef]
  4. Tague, C.L.; Moritz, M.; Hanan, E. The changing water cycle: The eco-hydrologic impacts of forest density reduction in Mediterranean (seasonally dry) regions. Wiley Interdiscip. Rev. Water 2019, 6, e1350. [Google Scholar] [CrossRef]
  5. Elliott, K.J.; Caldwell, P.V.; Brantley, S.T.; Miniat, C.F.; Vose, J.M.; Swank, W.T. Water yield following forest-grass-forest transitions. Hydrol. Earth Syst. Sci. 2017, 21, 981–997. [Google Scholar] [CrossRef] [Green Version]
  6. Hawthorne, S.N.D.; Lane, P.N.J.; Bren, L.J.; Sims, N.C. The long term effects of thinning treatments on vegetation structure and water yield. For. Ecol. Manag. 2013, 310, 983–993. [Google Scholar] [CrossRef]
  7. Swank, W.T.; Knoepp, J.D.; Vose, J.M.; Laseter, S.N.; Webster, J.R. Response and Recovery of Water Yield and Timing, Stream Sediment, Abiotic Parameters, and Stream Chemistry Following Logging. In Long-Term Response of a Forest Watershed Ecosystem; Oxford University Press: Oxford, UK, 2014; pp. 36–56. ISBN 9780190267933. [Google Scholar]
  8. Bren, L.; Lane, P.; Hepworth, G. Longer-term water use of native eucalyptus forest after logging and regeneration: The Coranderrk experiment. J. Hydrol. 2010, 384, 52–64. [Google Scholar] [CrossRef]
  9. Calev, A.; Zoref, C.; Tzukerman, M.; Moshe, Y.; Zangy, E.; Osem, Y. High-intensity thinning treatments in mature Pinus halepensis plantations experiencing prolonged drought. Eur. J. For. Res. 2016, 135, 551–563. [Google Scholar] [CrossRef]
  10. Liu, X.; Sun, G.; Mitra, B.; Noormets, A.; Gavazzi, M.J.; Domec, J.C.; Hallema, D.W.; Li, J.; Fang, Y.; King, J.S.; et al. Drought and thinning have limited impacts on evapotranspiration in a managed pine plantation on the southeastern United States coastal plain. Agric. For. Meteorol. 2018, 262, 14–23. [Google Scholar] [CrossRef]
  11. Huang, J.; Yu, H.; Guan, X.; Wang, G.; Guo, R. Accelerated dryland expansion under climate change. Nat. Clim. Chang. 2016, 6, 166–171. [Google Scholar] [CrossRef]
  12. Schlesinger, W.H.; Jasechko, S. Transpiration in the global water cycle. Agric. For. Meteorol. 2014, 189–190, 115–117. [Google Scholar] [CrossRef]
  13. Dierick, D.; Hölscher, D. Species-specific tree water use characteristics in reforestation stands in the Philippines. Agric. For. Meteorol. 2009, 149, 1317–1326. [Google Scholar] [CrossRef]
  14. Tfwala, C.M.; Van Rensburg, L.D.; Schall, R.; Zietsman, P.C.; Dlamini, P. Whole tree water use: Effects of tree morphology and environmental factors. Ecol. Ind. 2019, 102, 366–373. [Google Scholar] [CrossRef]
  15. Tsuruta, K.; Komatsu, H.; Kume, T.; Otsuki, K.; Kosugi, Y.; Kosugi, K. Relationship between stem diameter and transpiration for Japanese cypress trees: Implications for estimating canopy transpiration. Ecohydrology 2019, 12, e2097. [Google Scholar] [CrossRef]
  16. Sun, X.; Onda, Y.; Otsuki, K.; Kato, H.; Hirata, A.; Gomi, T. The effect of strip thinning on tree transpiration in a Japanese cypress (Chamaecyparis obtusa Endl.) plantation. Agric. For. Meteorol. 2014, 197, 123–135. [Google Scholar] [CrossRef] [Green Version]
  17. Tateishi, M.; Xiang, Y.; Saito, T.; Otsuki, K.; Kasahara, T. Changes in canopy transpiration of Japanese cypress and Japanese cedar plantations because of selective thinning. Hydrol. Process. 2015, 29, 5088–5097. [Google Scholar] [CrossRef]
  18. Gartner, B.L.; Meinzer, F.C. Structure-Function Relationships in Sapwood Water Transport and Storage. In Vascular Transport in Plants; Academic Press: San Diego, CA, USA, 2005; pp. 307–331. ISBN 978-0-12-088457-5. [Google Scholar]
  19. Komatsu, H.; Kume, T. Changes in the sapwood area of Japanese cedar and cypress plantations after thinning. J. For. Res. 2014, 20, 43–51. [Google Scholar] [CrossRef]
  20. Olivar, J.; Bogino, S.; Rathgeber, C.; Bonnesoeur, V.; Bravo, F. Thinning has a positive effect on growth dynamics and growth-climate relationships in Aleppo pine (Pinus halepensis) trees of different crown classes. Ann. For. Sci. 2014, 71, 395–404. [Google Scholar] [CrossRef]
  21. Tsamir, M.; Gottlieb, S.; Preisler, Y.; Rotenberg, E.; Tatarinov, F.; Yakir, D.; Tague, C.; Klein, T. Stand density effects on carbon and water fluxes in a semi-arid forest, from leaf to stand-scale. For. Ecol. Manag. 2019, 453, 117573. [Google Scholar] [CrossRef]
  22. Del Campo, A.D.; Fernandes, T.J.G.; Molina, A.J. Hydrology-oriented (adaptive) silviculture in a semiarid pine plantation: How much can be modified the water cycle through forest management? Eur. J. For. Res. 2014, 133, 879–894. [Google Scholar] [CrossRef]
  23. Gebhardt, T.; Häberle, K.H.; Matyssek, R.; Schulz, C.; Ammer, C. The more, the better? Water relations of Norway spruce stands after progressive thinning. Agric. For. Meteorol. 2014, 197, 235–243. [Google Scholar] [CrossRef]
  24. Bréda, N.; Granier, A.; Aussenac, G. Effects of thinning on soil and tree water relations, transpiration and growth in an oak forest (Quercus petraea (Matt.) Liebl.). Tree Physiol. 1995, 15, 295–306. [Google Scholar] [CrossRef] [PubMed]
  25. Medhurst, J.L.; Beadle, C.L. Crown structure and leaf area index development in thinned and unthinned Eucalyptus nitens plantations. Tree Physiol. 2001, 21, 989–999. [Google Scholar] [CrossRef] [PubMed] [Green Version]
  26. Heithecker, T.D.; Halpern, C.B. Variation in microclimate associated with dispersed-retention harvests in coniferous forests of western Washington. For. Ecol. Manag. 2006, 226, 60–71. [Google Scholar] [CrossRef]
  27. Hale, S.E. The effect of thinning intensity on the below-canopy light environment in a Sitka spruce plantation. For. Ecol. Manag. 2003, 179, 341–349. [Google Scholar] [CrossRef]
  28. Anderson, P.D.; Larson, D.J.; Chan, S.S. Riparian buffer and density management influences on microclimate of young headwater forests of western Oregon. For. Sci. 2007, 53, 254–269. [Google Scholar]
  29. Rambo, T.R.; North, M.P. Canopy microclimate response to pattern and density of thinning in a Sierra Nevada forest. For. Ecol. Manag. 2009, 257, 435–442. [Google Scholar] [CrossRef]
  30. Ma, S.; Concilio, A.; Oakley, B.; North, M.; Chen, J. Spatial variability in microclimate in a mixed-conifer forest before and after thinning and burning treatments. For. Ecol. Manag. 2010, 259, 904–915. [Google Scholar] [CrossRef]
  31. Del Campo, A.D.; González-Sanchis, M.; Molina, A.J.; García-Prats, A.; Ceacero, C.J.; Bautista, I. Effectiveness of water-oriented thinning in two semiarid forests: The redistribution of increased net rainfall into soil water, drainage and runoff. For. Ecol. Manag. 2019, 438, 163–175. [Google Scholar] [CrossRef]
  32. Whitehead, D.; Jarvis, P.G.; Waring, R.H. Stomatal conductance, transpiration, and resistance to water uptake in a Pinus sylvestris spacing experiment. Can. J. For. Res. 1984, 14, 692–700. [Google Scholar] [CrossRef]
  33. Alsheimer, M.; Köstner, B.; Falge, E.; Tenhunen, J.D. Temporal and spatial variation in transpiration of Norway spruce stands within a forested catchment of the Fichtelgebirge, Germany. Ann. Sci. For. 1998, 55, 103–123. [Google Scholar] [CrossRef] [Green Version]
  34. Lagergren, F.; Lankreijer, H.; Kučera, J.; Cienciala, E.; Mölder, M.; Lindroth, A. Thinning effects on pine-spruce forest transpiration in central Sweden. For. Ecol. Manag. 2008, 255, 2312–2323. [Google Scholar] [CrossRef]
  35. Peel, M.C.; Finlayson, B.L.; McMahon, T.A. Updated world map of the Köppen-Geiger climate classification. Hydrol. Earth Syst. Sci. 2007, 11, 1633–1644. [Google Scholar] [CrossRef] [Green Version]
  36. Campbell, G.S.; Norman, J.M. An Introduction to Environmental Biophysics; Springer Science & Business Media: New York, NY, USA, 1998; ISBN 978-0-387-94937-6. [Google Scholar]
  37. Chen, L.; Zhang, Z.; Zha, T.; Mo, K.; Zhang, Y.; Fang, X. Soil water affects transpiration response to rainfall and vapor pressure deficit in poplar plantation. New For. 2014, 45, 235–250. [Google Scholar] [CrossRef]
  38. Bréda, N.; Huc, R.; Granier, A.; Dreyer, E. Temperate forest trees and stands under severe drought: A review of ecophysiological responses, adaptation processes and long-term consequences. Ann. For. Sci. 2006, 63, 625–644. [Google Scholar] [CrossRef] [Green Version]
  39. Granier, A.; Loustau, D.; Bréda, N. A generic model of forest canopy conductance dependent on climate, soil water availability and leaf area index. Ann. For. Sci. 2000, 57, 755–765. [Google Scholar] [CrossRef]
  40. Wullschleger, S.D.; Hanson, P.; Todd, D. Transpiration from a multi-species deciduous forest as estimated by xylem sap flow techniques. For. Ecol. Manag. 2001, 143, 205–213. [Google Scholar] [CrossRef]
  41. Jonard, F.; André, F.; Ponette, Q.; Vincke, C.; Jonard, M. Sap flux density and stomatal conductance of European beech and common oak trees in pure and mixed stands during the summer drought of 2003. J. Hydrol. 2011, 409, 371–381. [Google Scholar] [CrossRef]
  42. Bai, Y.; Li, X.; Liu, S.; Wang, P. Modelling diurnal and seasonal hysteresis phenomena of canopy conductance in an oasis forest ecosystem. Agric. For. Meteorol. 2017, 246, 98–110. [Google Scholar] [CrossRef]
  43. Oren, R.; Sperry, J.S.; Ewers, B.E.; Pataki, D.E.; Phillips, N.; Megonigal, J.P. Sensitivity of mean canopy stomatal conductance to vapor pressure deficit in a flooded Taxodium distichum L. forest: Hydraulic and non-hydraulic effects. Oecologia 2001, 126, 21–29. [Google Scholar] [CrossRef]
  44. Spicer, R.; Gartner, B.L. The effects of cambial age and position within the stem on specific conductivity in Douglas-fir (Pseudotsuga menziesii) sapwood. Trees—Struct. Funct. 2001, 15, 222–229. [Google Scholar] [CrossRef]
  45. Ghimire, C.P.; Lubczynski, M.W.; Bruijnzeel, L.A.; Chavarro-Rincón, D. Transpiration and canopy conductance of two contrasting forest types in the Lesser Himalaya of Central Nepal. Agric. For. Meteorol. 2014, 197, 76–90. [Google Scholar] [CrossRef]
  46. Reyes-Acosta, J.L.; Lubczynski, M.W. Optimization of dry-season sap flow measurements in an oak semi-arid open woodland in Spain. Ecohydrology 2014, 7, 258–277. [Google Scholar] [CrossRef]
  47. Wang, H.; Ouyang, Z.; Zheng, H.; Wang, X.; Ni, Y.; Yu-Fen, R.E.N. Characteristics of spatial variations in xylem sap flow in urban greening tree species Pinus tabulaeformis, Cedrus deodara and Robinia pseudoacacia in Beijing, China. Chin. J. Plant Ecol. 2010, 34, 924–937. [Google Scholar]
  48. Moon, M.; Kim, T.; Park, J.; Cho, S.; Ryu, D.; Kim, H.S. Variation in sap flux density and its effect on stand transpiration estimates of Korean pine stands. J. For. Res. 2014, 20, 85–93. [Google Scholar] [CrossRef]
  49. Wang, R. Research on Water Consumption and Irrigation Regime of Main Landscape Tree Species in Beijing City; Beijing Forestry University: Beijing, China, 2006. [Google Scholar]
  50. Granier, A. Evaluation of transpiration in a Douglas-fir stand by means of sap flow measurements. Tree Physiol. 1987, 3, 309–320. [Google Scholar] [CrossRef]
  51. Rabbel, I.; Diekkrüger, B.; Voigt, H.; Neuwirth, B. Comparing ΔTmax determination approaches for Granier-based sapflow estimations. Sensors 2016, 16, 2042. [Google Scholar] [CrossRef] [Green Version]
  52. Oishi, A.C.; Hawthorne, D.A.; Oren, R. Baseliner: An open-source, interactive tool for processing sap flux data from thermal dissipation probes. SoftwareX 2016, 5, 139–143. [Google Scholar] [CrossRef] [Green Version]
  53. Pataki, D.E.; McCarthy, H.R.; Litvak, E.; Pincetl, S. Transpiration of urban forests in the Los Angeles metropolitan area. Ecol. Appl. 2011, 21, 661–677. [Google Scholar] [CrossRef] [Green Version]
  54. Litvak, E.; McCarthy, H.R.; Pataki, D.E. Transpiration sensitivity of urban trees in a semi-arid climate is constrained by xylem vulnerability to cavitation. Tree Physiol. 2012, 32, 373–388. [Google Scholar] [CrossRef] [Green Version]
  55. Wang, H.; Zhou, W.; Wang, X.; Gao, F.; Zheng, H.; Tong, L.; Ouyang, Z. Ozone uptake by adult urban trees based on sap flow measurement. Environ. Pollut. 2012, 162, 275–286. [Google Scholar] [CrossRef] [PubMed]
  56. Sun, P.; Ma, L.; Wang, X.; Zhai, M. Temporal and spacial variation of sap flow of Chinese pine (Pinus tabulaeformis). J. Beijing For. Univ. 2010, 22, 1–6. [Google Scholar]
  57. Morikawa, Y.; Hattori, S.; Kiyono, Y. Transpiration of a 31-year-old Chamaecyparis obtusa Endl. stand before and after thinning. Tree Physiol. 1986, 2, 105–114. [Google Scholar] [CrossRef] [PubMed]
  58. Komatsu, H. Values of the decoupling factor observed on forest canopies. J. Jpn. Soc. Hydrol. Water Resour. 2003, 16, 423–438. [Google Scholar] [CrossRef] [Green Version]
  59. Monteith, J.; Unsworth, M. Principles of Environmental Physics: Plants, Animals, and the Atmosphere; Academic Press: London, UK, 2013; ISBN 9780123869104. [Google Scholar]
  60. Kumagai, T.; Tateishi, M.; Shimizu, T.; Otsuki, K. Transpiration and canopy conductance at two slope positions in a Japanese cedar forest watershed. Agric. For. Meteorol. 2008, 148, 1444–1455. [Google Scholar] [CrossRef]
  61. Ewers, B.E.; Oren, R. Analysis of assumptions and errors in the calculation of stomatal conductance from sap-flow measurements. Tree Physiol. 2000, 20, 579–589. [Google Scholar] [CrossRef] [Green Version]
  62. Schäfer, K.V.R.; Oren, R.; Tenhunen, J.D. The effect of tree height on crown level stomatal conductance. Plant Cell Environ. 2000, 23, 365–375. [Google Scholar] [CrossRef]
  63. Granier, A.; Biron, P.; Kiistner, B.; Gay, L.W.; Najjar, G. Comparisons of Xylem Sap Flow and Water Vapour Flux at the Stand Level and Derivation of Canopy Conductance for Scots Pine. Theor. Appl. Clim. 1996, 53, 115–122. [Google Scholar] [CrossRef]
  64. Domec, J.C.; King, J.S.; Ward, E.; Christopher Oishi, A.; Palmroth, S.; Radecki, A.; Bell, D.M.; Miao, G.; Gavazzi, M.; Johnson, D.M.; et al. Conversion of natural forests to managed forest plantations decreases tree resistance to prolonged droughts. For. Ecol. Manag. 2015, 355, 58–71. [Google Scholar] [CrossRef] [Green Version]
  65. Ewers, B.E.; Oren, R.; Johnsen, K.H.; Landsberg, J.J. Estimating maximum mean canopy stomatal conductance for use in models. Can. J. For. Res. 2001, 31, 198–207. [Google Scholar] [CrossRef]
  66. Oren, R.; Sperry, J.; Katul, G.; Pataki, D.; Ewers, B.; Phillips, N.; Schäfer, K. Survey and synthesis of intra-and interspecific variation in stomatal sensitivity to vapour pressure deficit. Plant Cell Environ. 1999, 22, 1515–1526. [Google Scholar] [CrossRef] [Green Version]
  67. Cabon, A.; Mouillot, F.; Lempereur, M.; Ourcival, J.M.; Simioni, G.; Limousin, J.M. Thinning increases tree growth by delaying drought-induced growth cessation in a Mediterranean evergreen oak coppice. For. Ecol. Manag. 2018, 409, 333–342. [Google Scholar] [CrossRef]
  68. Chang, J.; Li, X.; Liu, S.; Lv, J.; Ren, Q. Variations in amount and ring number of sapwood and heartwood of Pinus tabulaeformis. Sci. Silvae Sin. 2009, 45, 76–82. [Google Scholar]
  69. Giuggiola, A.; Bugmann, H.; Zingg, A.; Dobbertin, M.; Rigling, A. Reduction of stand density increases drought resistance in xeric Scots pine forests. For. Ecol. Manag. 2013, 310, 827–835. [Google Scholar] [CrossRef]
  70. Elkin, C.; Giuggiola, A.; Rigling, A.; Bugmann, H. Short- and long-term efficacy of forest thinning to mitigate drought impacts in mountain forests in the European Alps. Ecol. Appl. 2015, 25, 1083–1098. [Google Scholar] [CrossRef]
  71. Medhurst, J.L.; Battaglia, M.; Beadle, C.L. Measured and predicted changes in tree and stand water use following high-intensity thinning of an 8-year-old Eucalyptus nitens plantation. Tree Physiol. 2002, 22, 775–784. [Google Scholar] [CrossRef] [Green Version]
  72. Climent, J.; Chambel, M.R.; Pérez, E.; Gil, L.; Pardos, J. Relationship between heartwood radius and early radial growth, tree age, and climate in Pinus canariensis. Can. J. For. Res. 2002, 32, 103–111. [Google Scholar] [CrossRef]
  73. Benyon, R.G.; Lane, P.N.J.; Jaskierniak, D.; Kuczera, G.; Haydon, S.R. Use of a forest sapwood area index to explain long-term variability in mean annual evapotranspiration and streamflow in moist eucalypt forests. Water Resour. Res. 2015, 51, 5318–5331. [Google Scholar] [CrossRef]
  74. Granier, A.; Bréda, N. Modelling canopy conductance and stand transpiration of an oak forest from sap flow measurements. Ann. Sci. For. 1996, 53, 537–546. [Google Scholar] [CrossRef] [Green Version]
  75. Forrester, D.I.; Bertram, C.A.; Murphy, S. Impact of competition from coppicing stumps on the growth of retained trees differs in thinned Eucalyptus globulus and Eucalyptus tricarpa plantations in southeastern Australia. Can. J. For. Res. 2012, 42, 841–848. [Google Scholar] [CrossRef]
  76. Gebauer, R.; Volaík, D.; Urban, J.; Børja, I.; Nagy, N.E.; Eldhuset, T.D.; Krokene, P. Effect of thinning on anatomical adaptations of Norway spruce needles. Tree Physiol. 2011, 31, 1103–1113. [Google Scholar] [CrossRef] [PubMed] [Green Version]
  77. Bennett, A.C.; McDowell, N.G.; Allen, C.D.; Anderson-Teixeira, K.J. Larger trees suffer most during drought in forests worldwide. Nat. Plants 2015, 1, 15139. [Google Scholar] [CrossRef] [PubMed]
  78. Mäkinen, H.; Isomäki, A. Thinning intensity and long-term changes in increment and stem form of Scots pine trees. For. Ecol. Manag. 2004, 203, 21–34. [Google Scholar] [CrossRef]
  79. Zimmermann, R.; Schulze, E.D.; Wirth, C.; Schulze, E.E.; Mcdonald, K.C.; Vygodskaya, N.N.; Ziegler, W. Canopy transpiration in a chronosequence of Central Siberian pine forests. Glob. Chang. Biol. 2000, 6, 25–37. [Google Scholar] [CrossRef] [Green Version]
  80. Sohn, J.A.; Saha, S.; Bauhus, J. Potential of forest thinning to mitigate drought stress: A meta-analysis. For. Ecol. Manag. 2016, 380, 261–273. [Google Scholar] [CrossRef]
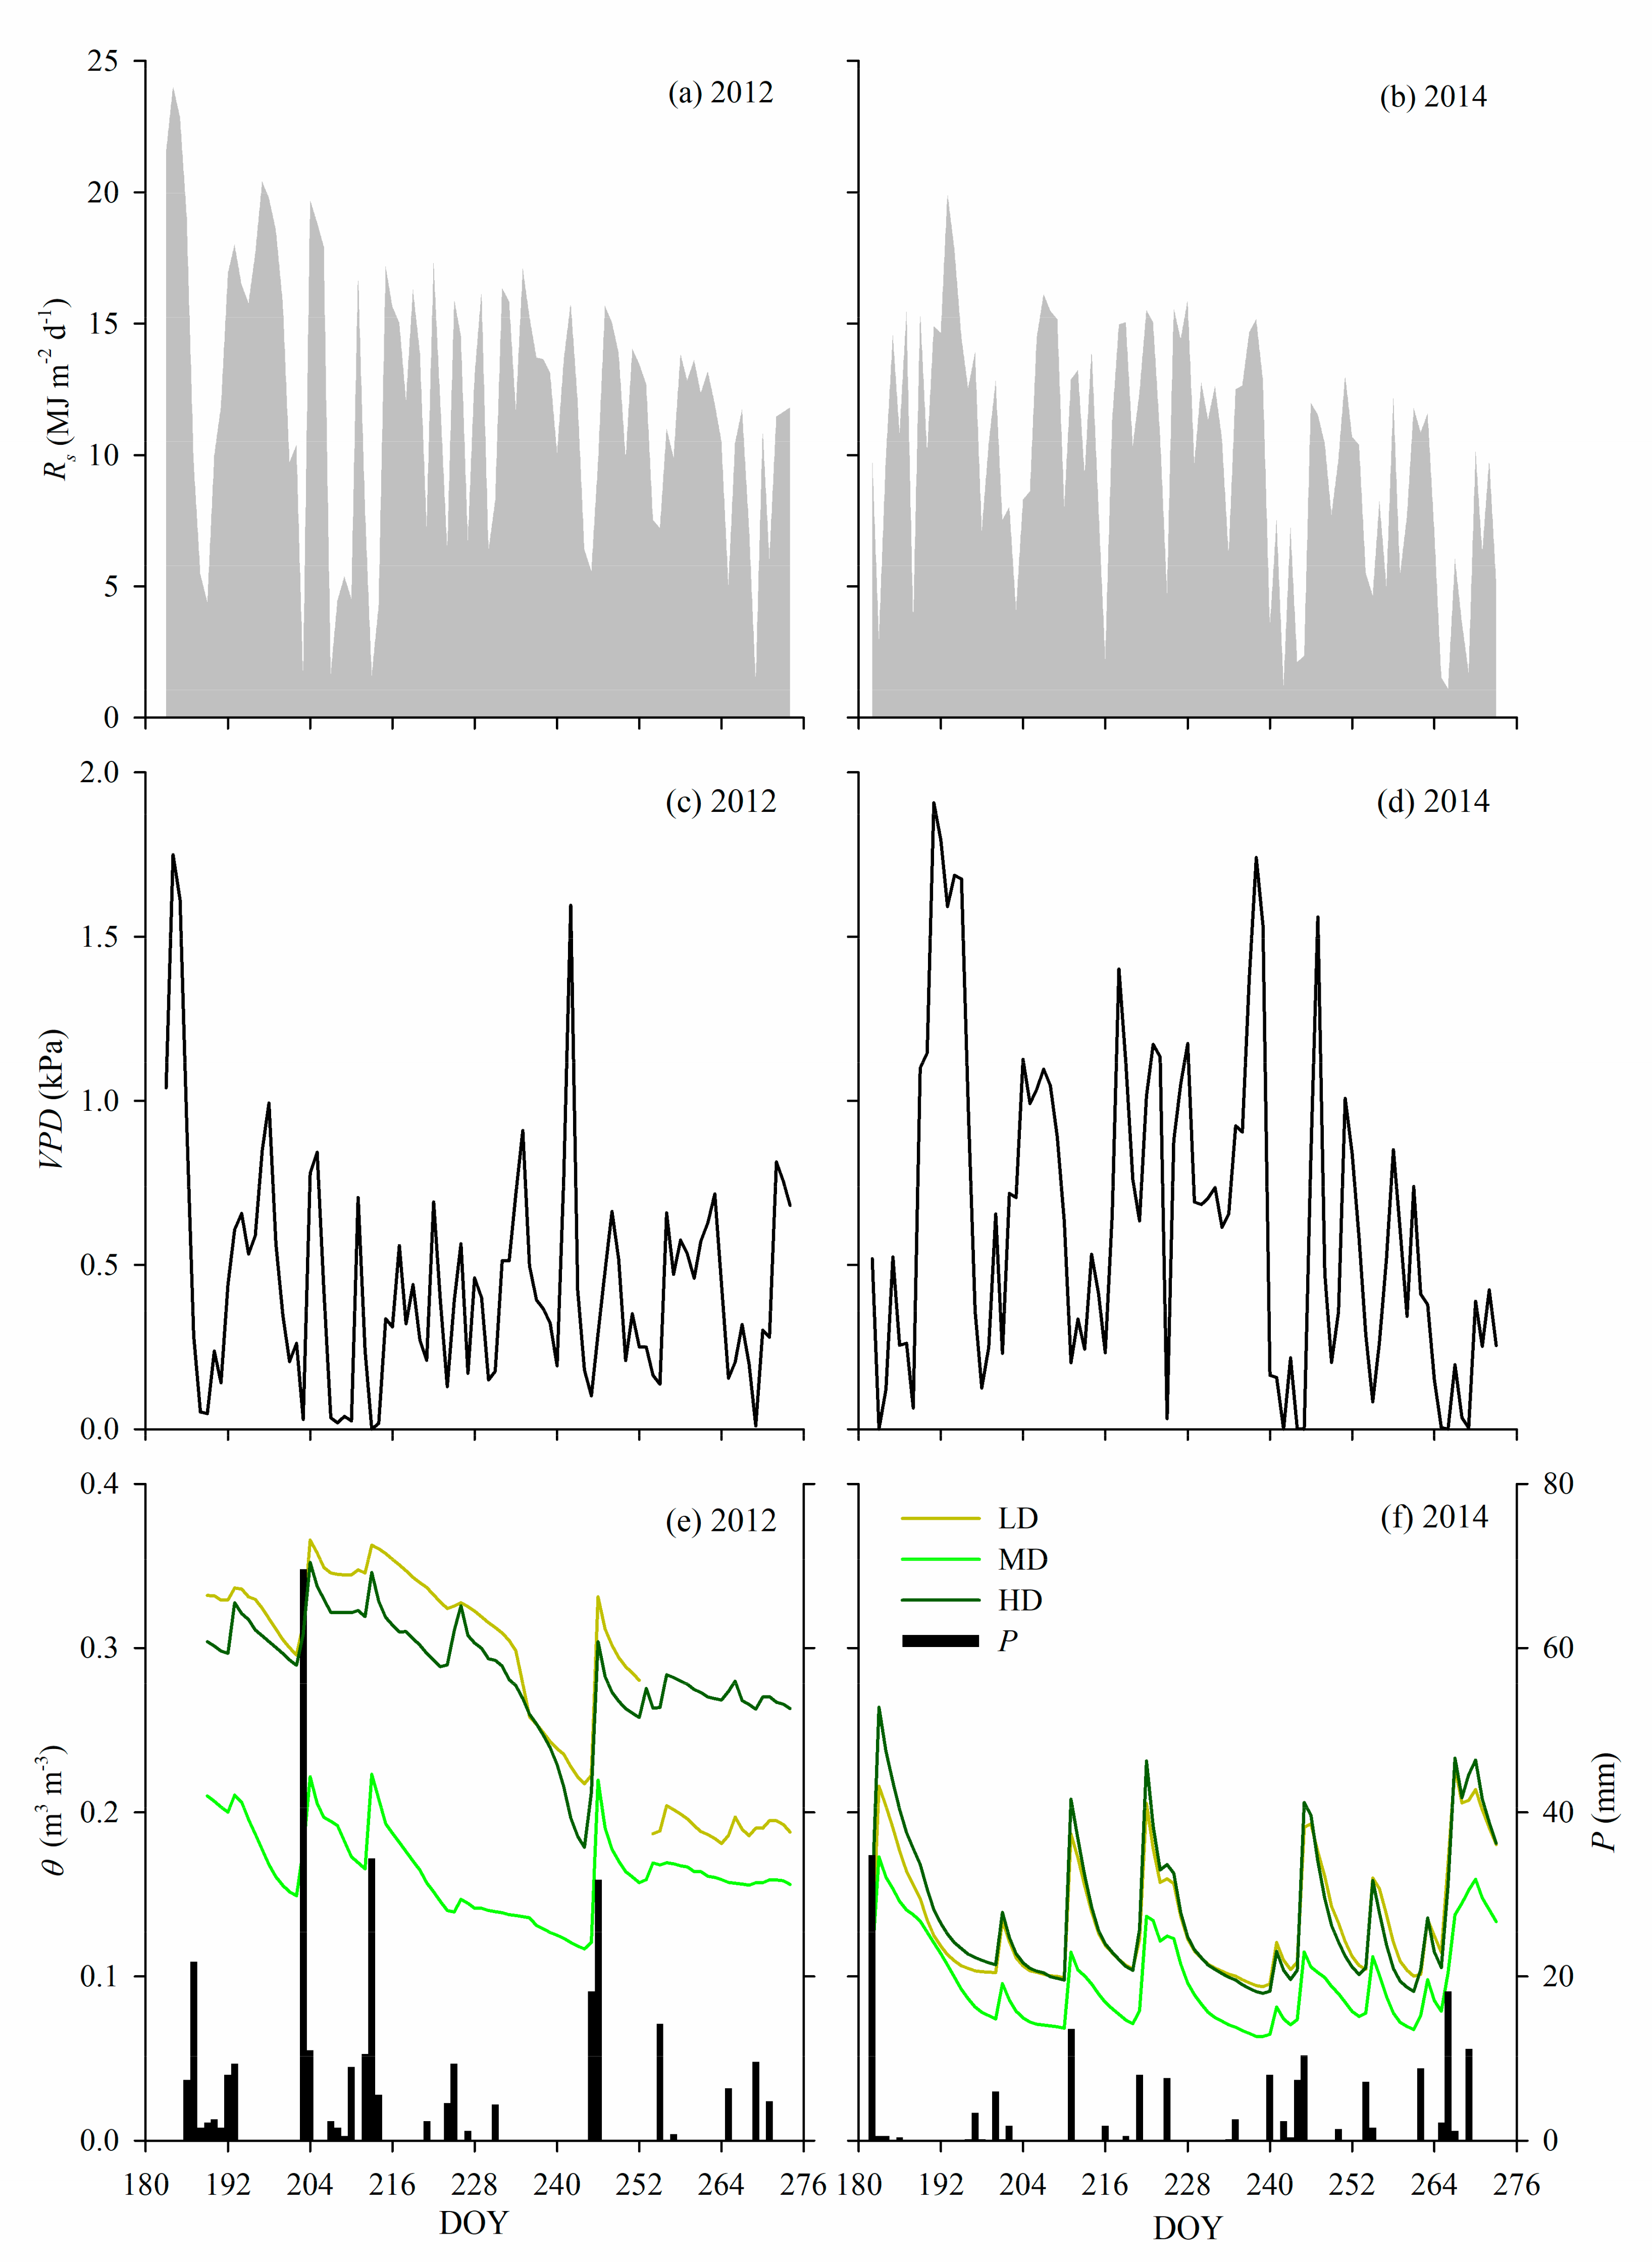
Figure 1. Daily variations of (a,b) solar radiation (Rs, MJ m−2 d−1), (c,d) vapor pressure deficit (VPD, kPa), (e,f) precipitation (P, mm), and soil water content (θ, m3 m−3) for each stand in both study years. LD, MD, and HD refer to stands with a density of 983, 1688, and 2160 stems ha−1, respectively. θ is the average of measurements at the depths of 20 cm and 40 cm for each stand. The θ disturbance in the LD stand in 2012 was caused by a change in positioning of the sensors (see text).
Forests 11 00070 g001
Figure 2. (a) Relationships of sapwood area (As, cm2) with diameters at breast height (DBH, cm), mean (b) DBH, and (c) As at the tree and (d) at the stand level (SA, m2 ha−1) for each stand in both study years. LD, MD, and HD refer to stands with a density of 983, 1688, and 2160 stems ha−1, respectively. In (a), dashed lines are fitted curves for each stand, while the solid line and the accompanying function represent fitting for all densities together. Black error bars in (b,c) are standard errors, and grey error bars in (c,d) represent the estimation error associated with the root mean square error (RMSE) of sapwood area estimates.
Forests 11 00070 g002
Figure 3. Responses of stand sap flux density (Jz, m3 m−2 d−1) to (a) solar radiation (Rs, MJ m−2 d−1), (b) vapor pressure deficit (VPD, kPa), and (c) relative extractable water (REW, unitless), and responses of Jz to (df) Rs and (gi) VPD under different soil water conditions for each stand. LD, MD, and HD refer to stands with a density of 983, 1688, and 2160 stems ha−1, respectively. SS, MS, and W refer to periods when REW ≤ 0.1, 0.1 < REW ≤ 0.4, and REW > 0.4, respectively. All symbols are daily values with rainy day data being removed, and lines are fitted curves for significantly correlated variables. Determination coefficients (R2) with subscripted LD, MD, and HD represent stands with different densities, and those with subscripted SS, MS, and W represent periods with differing soil water conditions.
Forests 11 00070 g003
Figure 4. (a) Mean daily canopy conductance (Gc, mm s−1) for each stand and (b) physiological controls across densities and soil water conditions. Error bars in (a) represent standard errors. Physiological control strategies are indicated by relationships between the sensitivity of Gc to vapor pressure deficit (i.e., dGc/dlnVPD, mm s−1 lnkPa−1) and the Gc at VPD = 1 kPa (i.e., Gcref, mm s−1). LD, MD, and HD refer to stands with a density of 983, 1688, and 2160 stems ha−1, respectively. SS, MS, and W refer to periods when relative extractable water (REW) 0.1, 0.1 < REW ≤ 0.4, and REW > 0.4, respectively. The nine colored symbols in (b) were derived from nine significant fitted curves of Gc=−m·lnVPD + Gcref for three different densities under three different soil water conditions, and three black symbols were derived from three significant fitted curves for three different densities regardless of soil water conditions, respectively. Three colored lines and one black line in (b) are the corresponding fitted curves. Determination coefficients (R2) with subscripted LD, MD, and HD represent stands with different densities.
Forests 11 00070 g004
Figure 5. Stand daily (a) sap flux density (Jz, m3 m−2 d−1) and (b) canopy transpiration (Ec, mm d−1), and (c) total canopy transpiration (Ec, mm) for each stand. LD, MD, and HD refer to stands with a density of 983, 1688, and 2160 stems ha−1, respectively. In (a,b), boxes represent the 25th and 75th percentiles, whiskers represent the 10th and 90th percentiles, circles represent the 5th and 95th percentiles, and the black and colored lines in each box represent the mean and the median. Daily values after removing rainy day data were used in box plots.
Forests 11 00070 g005
Figure 6. A framework of changes in thinned forest canopy transpiration over time.
Forests 11 00070 g006
Table 1. Characteristics of each stand. LD = low density; MD = medium density; HD = high density.
Stand NameLDMDHD
Elevation (m)c. 650c. 650c. 650
AspectNENENE
Slope (°)232421
Planting year196819681968
Planting density (stems ha−1)500050005000
Thinning year198119811981
Thinning intensity (% of stems removed)806555
Current density (stems ha−1) 198316882160
1 The current density was measured in 2012 and 2014. It was lower than the density just after thinning treatments in 1981 as a result of the removal of dead or unhealthy trees during the past 31 years.
Table 2. Density effects on diameter at breast height (DBH) and density differences in relationships of sapwood area (As) with DBH.
FpPaired Comparison 1FpPaired Comparison 1
20122014
DBHDensity3.2580.074LD a, MD a16.806<0.001LD a, MD a, HD b
With interactionWithout interaction
As2Density0.2270.798LD a, MD a, HD a1.3410.272LD a, MD a, HD a
DBH859.663<0.001 913.341<0.001
Density*DBH0.2060.815
1 LD, MD, and HD refer to stands with a density of 983, 1688, and 2160 stems ha−1, respectively. Uppercase letters indicate statistical differences. 2 Since relationships of As with DBH followed a power function, linearized data were used.
Table 3. Environmental control of solar radiation (Rs), vapor pressure deficit (VPD), and relative extractable water (REW) on sap flux density (Jz) 1 for each stand, and the effect of stand density on environmental responses and physiological controls.
RsVPDREW
Environmental controlsrprprp
JzLD0.647<0.001/0.5700.793<0.001
MD0.564<0.001/0.2670.680<0.001
HD0.4690.0010.3550.0120.495<0.001
Climatic controls 2rprp
JzLD0.629<0.0010.497<0.001
MD0.525<0.0010.2290.018
HD0.581<0.0010.556<0.001
Density differences in environmental responses 3Fp Fp
JzDensity1.3280.267 28.564<0.001
Environmental variable75.862<0.001 86.545<0.001
Density*Environmental variable26.731<0.001 35.111<0.001
Density differences in physiological controls 4Fp
dGc/dlnVPDDensity4.7790.069
Gcref329.812<0.001
1 LD, MD, and HD refer to stands with a density of 983, 1688, and 2160 stems ha−1, respectively. 2 Partial correlation was conducted after excluding the influence of REW. 3 The density difference in Jz response to VPD was not analyzed since correlations between Jz and VPD were insignificant for the LD and MD stands. 4 Physiological control strategy are indicated by relationships between the sensitivity of canopy conductance to vapor pressure deficit (i.e., dGc/dlnVPD) and the canopy conductance when vapor pressure deficit is 1 kPa (i.e., Gcref). The density difference was evaluated after excluding the insignificant interaction of density*Gcref (F = 0.088, p = 0.918).
Table 4. Stand density effects on sap flux density and canopy transpiration 1.
2012 2014
FpPaired Comparison 2FpPaired Comparison 2
Sap flux density 33.8990.074LD a, MD a9.5080.003LD a, MD b, HD b
Canopy transpiration 41.8940.199LD a, MD a16.893<0.001LD a, MD b, HD b
1 Density effects were evaluated considering covariant effects of DBH to exclude possible DBH-related influences. 2 LD, MD, and HD refer to stands with a density of 983, 1688, and 2160 stems ha−1, respectively. Upper lowercases indicate statistical differences. 3 The density effect on sap flux density was evaluated after excluding the insignificant interaction of density*DBH in 2012 (F = 4.431, p = 0.062) and in 2014 (F = 0.362, p = 0.704).4 The density effect on canopy transpiration was evaluated based on estimated marginal means, since the interaction of density*DBH was significant in 2012 (F = 7.734, p = 0.019) and in 2014 (F = 11.532, p = 0.002).