Article

Strategies for Modeling Regeneration Density in Relation to Distance from Adult Trees

by
Daniel Moreno-Fernández
1,*,
Alicia Ledo
2,
Isabel Cañellas
1 and
Fernando Montes
1
1
INIA-CIFOR, Ctra. A Coruña km 7.5, E-28040 Madrid, Spain
2
Freelance scientist, 28011 Madrid, Spain
*
Author to whom correspondence should be addressed.
Forests 2020, 11(1), 120; https://doi.org/10.3390/f11010120
Submission received: 26 November 2019 / Revised: 11 January 2020 / Accepted: 14 January 2020 / Published: 19 January 2020
(This article belongs to the Special Issue Silviculture for Restoration and Regeneration)

Abstract

:
Research Highlights: We proposed new methodologies for the spatial analysis of regeneration processes and compared with existing approaches. Background and Objectives: Identifying the spatial relationship between adult trees and new cohorts is fundamental to understanding the dynamics of regeneration and therefore helps us to optimize the stand density and natural regeneration when undertaking regeneration fellings. Most of the statistical approaches analyzing the spatial dependence between adult trees and new individuals (seedlings or saplings) require a complete census and mapping of all individuals. However, approaches considering individuals grouped into sampling points or subplots (i.e., density data) are limited. In this study, we reviewed and compared approaches (intertype point pattern analyses and a generalized additive model) to describe the spatial relationship between adult trees and density regeneration in a Pinus sylvestris L. monospecific stand in Spain. We also proposed a new approach (intertype mark variance function) to disentangle the effect of the tree-size on sapling density and the effect of the spatial pattern. Materials and Methods: To this end, we used a half-hectare plot in which all the individuals of P. sylvestris have been mapped and measured. Results: Our results indicated that sapling distribution was related to distance from the adult trees, thus displaying distance-dependence patterns, but it was not related to the size of the adult trees. The intertype mark correlation function was an useful tool to distinguish the effect of the marks (sapling density and tree size) from the effect of the spatial pattern of the classes (trees cohorts in our case). Conclusions: The largest number of saplings was found with increased distance between adult trees (>11 m), and the generalized additive model may be useful to explain spatial relationships between adult trees and regenerating cohorts when other measured biotic variables (e.g., soil stoniness, etc.) and repeated measurements are available.

1. Introduction

The establishment of new individuals following regeneration fellings is a vital stage of stand development as the persistence of the forest cover is at stake [1]. The occurrence and survival of the new individuals is hindered by several factors, such as low seed production, post-dispersal predation, summer drought, limited nutrient availability, flooding, frost, fire, competition with grass and shrubs, lack of or excess light, or damage from browsing, pests and pathogens [1,2,3,4,5]. Furthermore, the impact of these factors on the regeneration process can be modified under climate change conditions [6,7]. Therefore, a greater understanding of the relationship between the regeneration process and environmental conditions is crucial for current and future forest management [7]. In this regard, silvicultural operations can modulate light and water availability to the new individuals, i.e., seedlings and saplings, through reducing stem density over the regeneration period [8].
Many studies have focused on analyzing the spatial relationship between adult trees and new cohorts in seedling sampling units, using different variables to quantify the effect of adult trees on key drivers, such as influence indexes (see the indexes proposed by Kuuluvainen and Pukkala [9] and Woods et al. [10] or indices characterizing the amount of available light [11]). Where complete census data and mapping of all individuals is available, point pattern techniques can be employed to analyze the spatial distribution of seedlings and interactions with adult trees [12,13,14]. The spatial pattern of seedlings reflects the processes at work during establishment and development and can be analyzed through Ripley’s K function and related functions [15] as well as point pattern models [16]. The bivariate point pattern analysis functions allow the interactions (attraction or repulsion) between adult trees and different cohorts to be analyzed [17]. However, the use of point pattern analysis techniques for individuals grouped into sampling points or subplots (i.e., density data) is limited. This limitation can be overcome by randomly distributing seedlings within the regeneration sampling unit prior to point process analyses [2]. Montes and Cañellas [18] proposed a modification of the bivariate function by Lotwick et al. [19] to analyse the spatial interaction between a point pattern and a continuous variable measured at sampling points, and demonstrated its use for analyzing the spatial relationship between the adult trees and the recruitment, which was evaluated through sapling density data in quadrats. In order to investigate the spatio-temporal relationship between the size of the adult trees and regeneration density, Moreno-Fernández et al. [20] proposed a generalized additive model to study the dynamics of saplings under the group shelterwood cutting method. This approach enables the effect of size and position of adult trees on sapling density to be characterized.
Growing from the Iberian Peninsula almost to the Pacific Ocean and from the Arctic Circle in Scandinavia to the Mediterranean basin, Pinus sylvestris L. is the most widespread tree species in the world [21,22]. The environmental conditions vary considerably across the huge distribution of this species and therefore its ecological and functional traits, such as shade tolerance, growth or drought tolerance, exhibit great variations [22,23,24]. Due to site conditions in the south-western distribution area of P. sylvestris, different variants of the shelterwood system are generally used to achieve natural regeneration in these latitudes [21,25,26]. However, establishment of regeneration in the southernmost populations of P. sylvestris can be problematic due to site-specific conditions, such as summer drought, low seed production, masting behaviour and damage caused by browsing of wild and domestic cattle [11,27], threatening the persistence of this species. Several studies have focused on identifying factors associated with the regeneration process of P. sylvestris in the Mediterranean basin [26,28] while others have attempted to describe the spatial distribution of P. sylvestris seedlings and saplings and their spatial relationship with adult trees where the group shelterwood cutting method is used [18,20]. The spatial dynamics of P. sylvestris ingrowth under other regeneration methods, however, have not been described to date.
The main goal of this work was to examine statistical approaches to explain the relationships between recruitment and adult overstory trees during the establishment stage under the uniform shelterwood regeneration system in a P. sylvestris stand in the Central Mountain Range of Spain. Our specific goals were (i) to review and test methodologies capable of explaining the spatial pattern between two cohorts of trees; (ii) to adapt a statistical approach (proposed by Ledo et al. [29]) to describe the spatial distribution of saplings with respect to the size and position of adult trees; and (iii) to propose an approach for disentangling the effect of the marks (e.g., tree size or sapling density) and the effect of spatial pattern of the cohorts. We analyzed the sensitivity of the approaches in terms of detecting the ranges of spatial dependence between both cohorts and we examined the strengths and weaknesses of the methodologies employed in this work.

2. Materials and Methods

2.1. Study Site

The study was conducted at Navafría forest (41° 00′ N, 3° 48′ W), in the Central Mountain Range (Spain). The forest grows on acid soils and is mainly north-facing. The altitude of the forest ranges from approximately 1200 to 2200 m above sea level. The annual rainfall is about 1000 mm and the mean temperature is around 9.8 °C. The main species of the forest is P. sylvestris but Quercus pyrenaica Willd. is also present at lower altitudes. The rotation period for P. sylvestris is 100-years. At Navafría, the regeneration of P. sylvestris is achieved through the uniform shelterwood method with three fellings (a preparatory cutting, an establishment cutting and a final cutting) over a 20-year regeneration period. At the beginning of the regeneration period, the density is around 200-300 trees per hectare [25,30] and the occurrence of seedlings is promoted when the density is around 100 trees per hectare after the establishment cutting [29]. Soil preparation operations, subsoil and blade scarification are commonly carried out to favor the establishment of the regeneration after the establishment cutting [25,31].
In 2001, a half-hectare square plot was installed in a monospecific, even-aged stand of P. sylvestris in Navafría forest in order to study the structure and dynamics of this species. The plot was installed at the beginning of the regeneration period when the preparatory felling, which usually takes place about 5-10 years before the establishment felling, had already been carried out. The silvicultural operations in the plot are carried out by the forest service following the forest management plan of Navafría forest; thereby the plot is representative of the uniform shelterwood application to P. sylvestris stands in Central Spain. In this plot, we labelled and measured the diameter at breast height and the height of all the stems with a height ≥ 1.30 m. We distinguished two cohorts, mother trees (individuals with dbh ≥ 10 cm) and saplings (individuals with a height ≥ 1.30 m and dbh < 10 cm). The mother trees were individually mapped whereas the saplings were grouped into a 2 × 2 m quadrat grid. These measurements were repeated in 2006, 2010 and 2014 (Table 1).
The second felling under the uniform shelterwood system, the establishment felling, was undertaken between the first (2001) and the second inventory (2006), and soil preparation was carried out in 2010, with seedling establishment taking place between 2010 and 2014. For the purposes of this study, we only considered the 2014 inventory, when both saplings and mother trees were present (Figure 1).

2.2. Spatial Pattern of Pinus Sylvestris Saplings and Adult Trees

We used two local quadrat variance methods for the two dimensional data to tackle the spatial distribution of the P. sylvestris sapling density: the four-term local quadrat variance (4TLQV) and the nine-term local quadrat variance (9TLQV) [32]. These methods calculate the variance at different spatial scales estimating the variability among neighbor blocks. The block size is progressively increased by combining the number of quadrats. Thus, the block is the search window [33]. The squared differences in the number of saplings between each group of four and nine neighbor blocks were averaged for the whole study area for the 4TLQV and 9TLQV, respectively [18,32].
The spatial distribution of adult trees was studied using the L ^ ( d ) transformation of Ripley’s function K(d). L ^ ( d ) linearizes the K(d) function and gives 0 as the value under the random distribution of mother trees [15].
L ^ ( d ) = K ^ ( d ) π d
λ K ( d ) = i = 1 N k = 1 N ω i j ( d ) N , i k , ω i j ( d ) = 1   if   d i j d 0   if   d i j > d
where λ is the density of mother trees per unit area, dij is the distance between the i and the j adult tree. dij(d) was replaced by ωij(d) in order to account for the edge effect. ωij(d) is 0 if adult trees i and j are farther than distance d from each other, and otherwise, ωij(d) is the inverse of the fraction of a circumference centered on i (with the radius being the distance from i to j) which falls within the plot [15,34]. We simulated 999 patterns of the complete spatial randomness null model in order to build 95 % quantile bounds to test statistically the random distribution of adult trees.

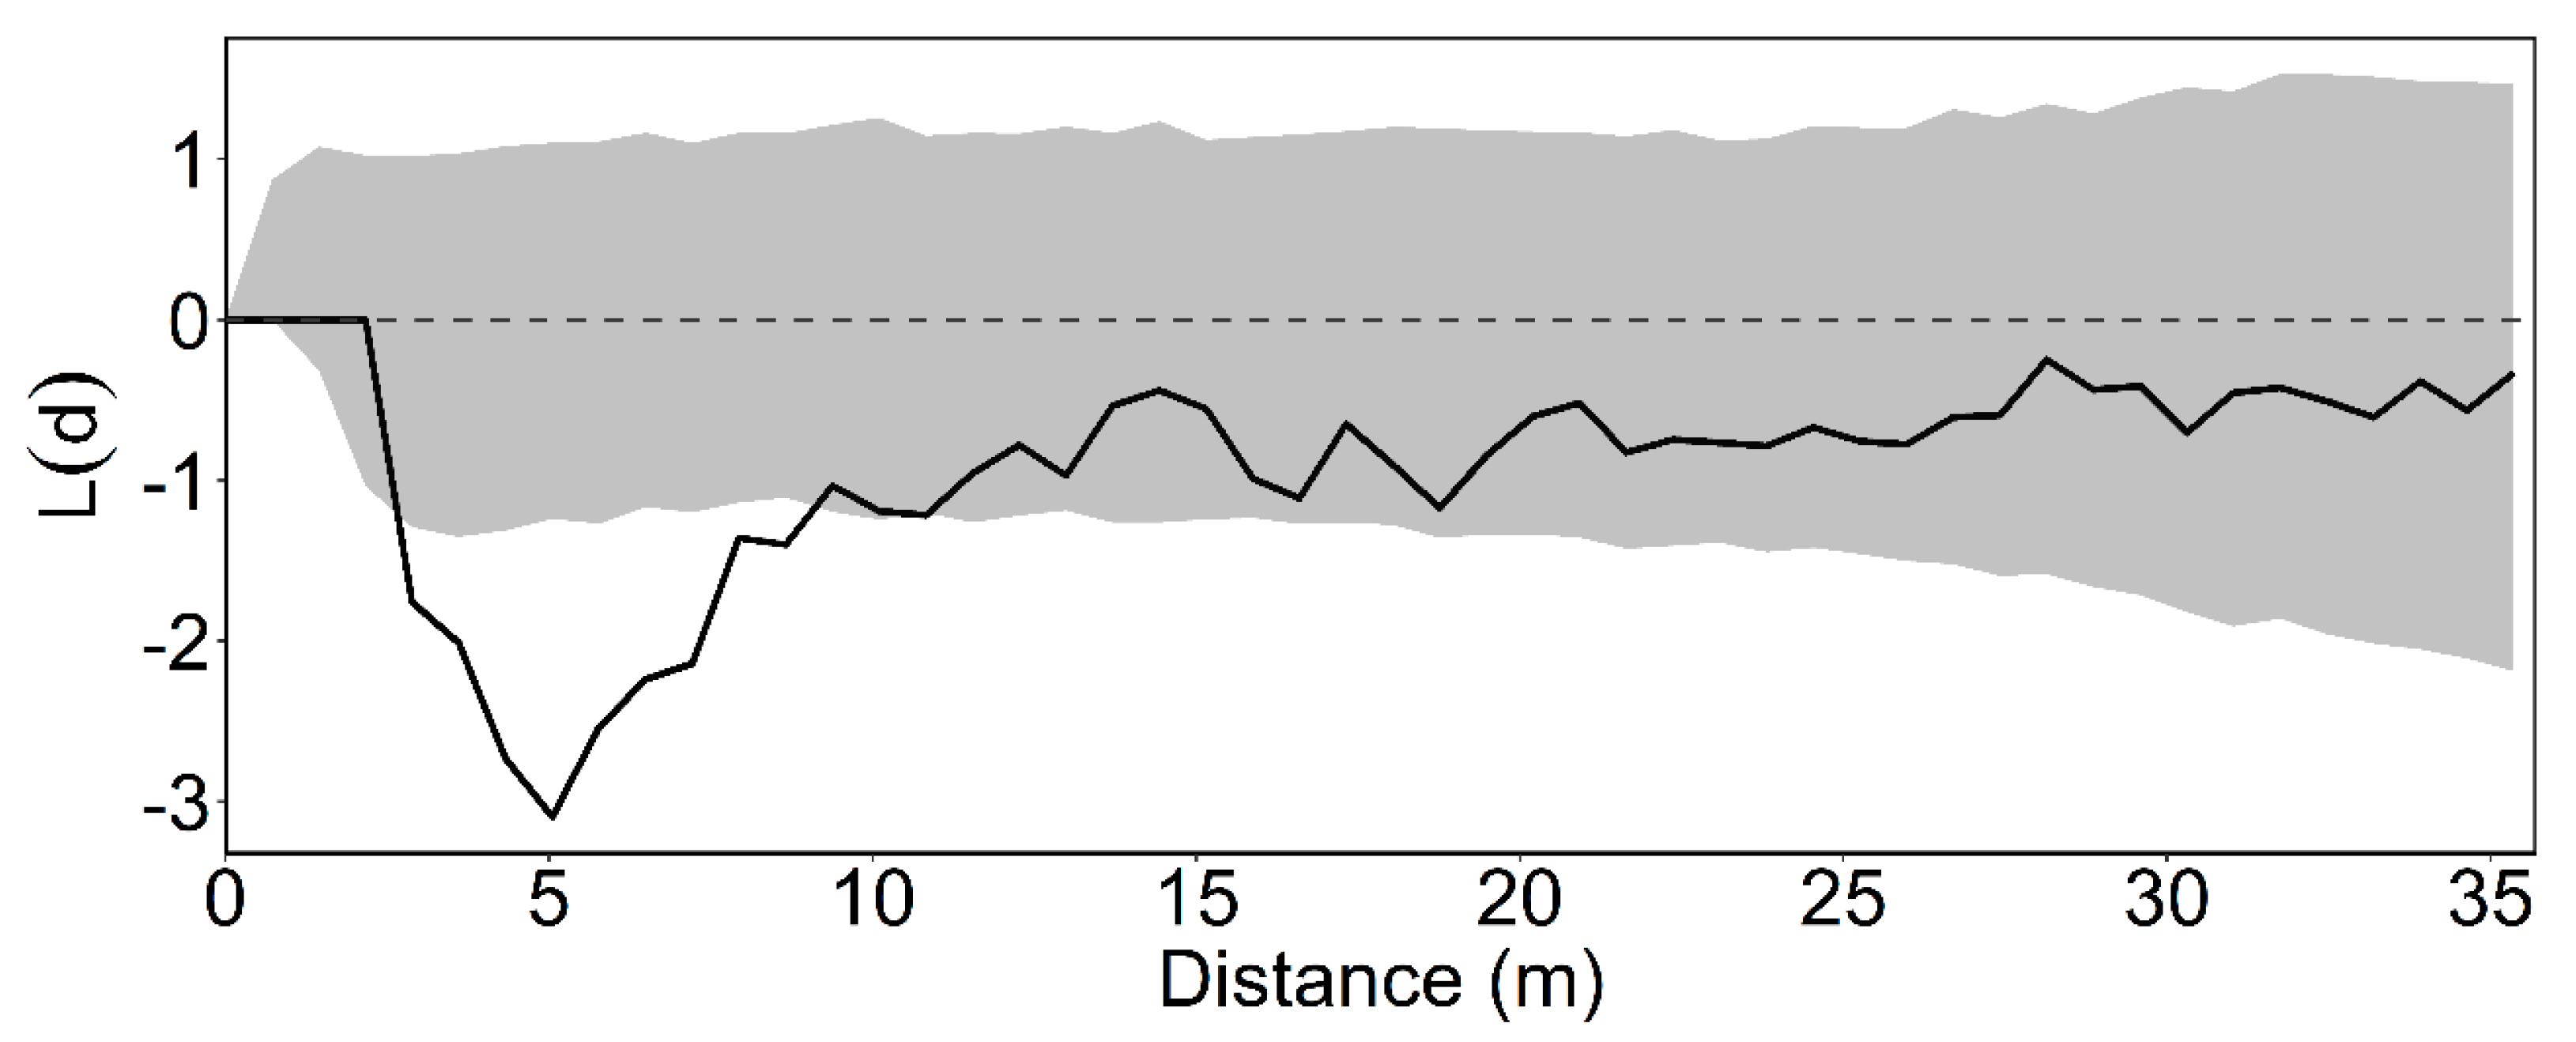
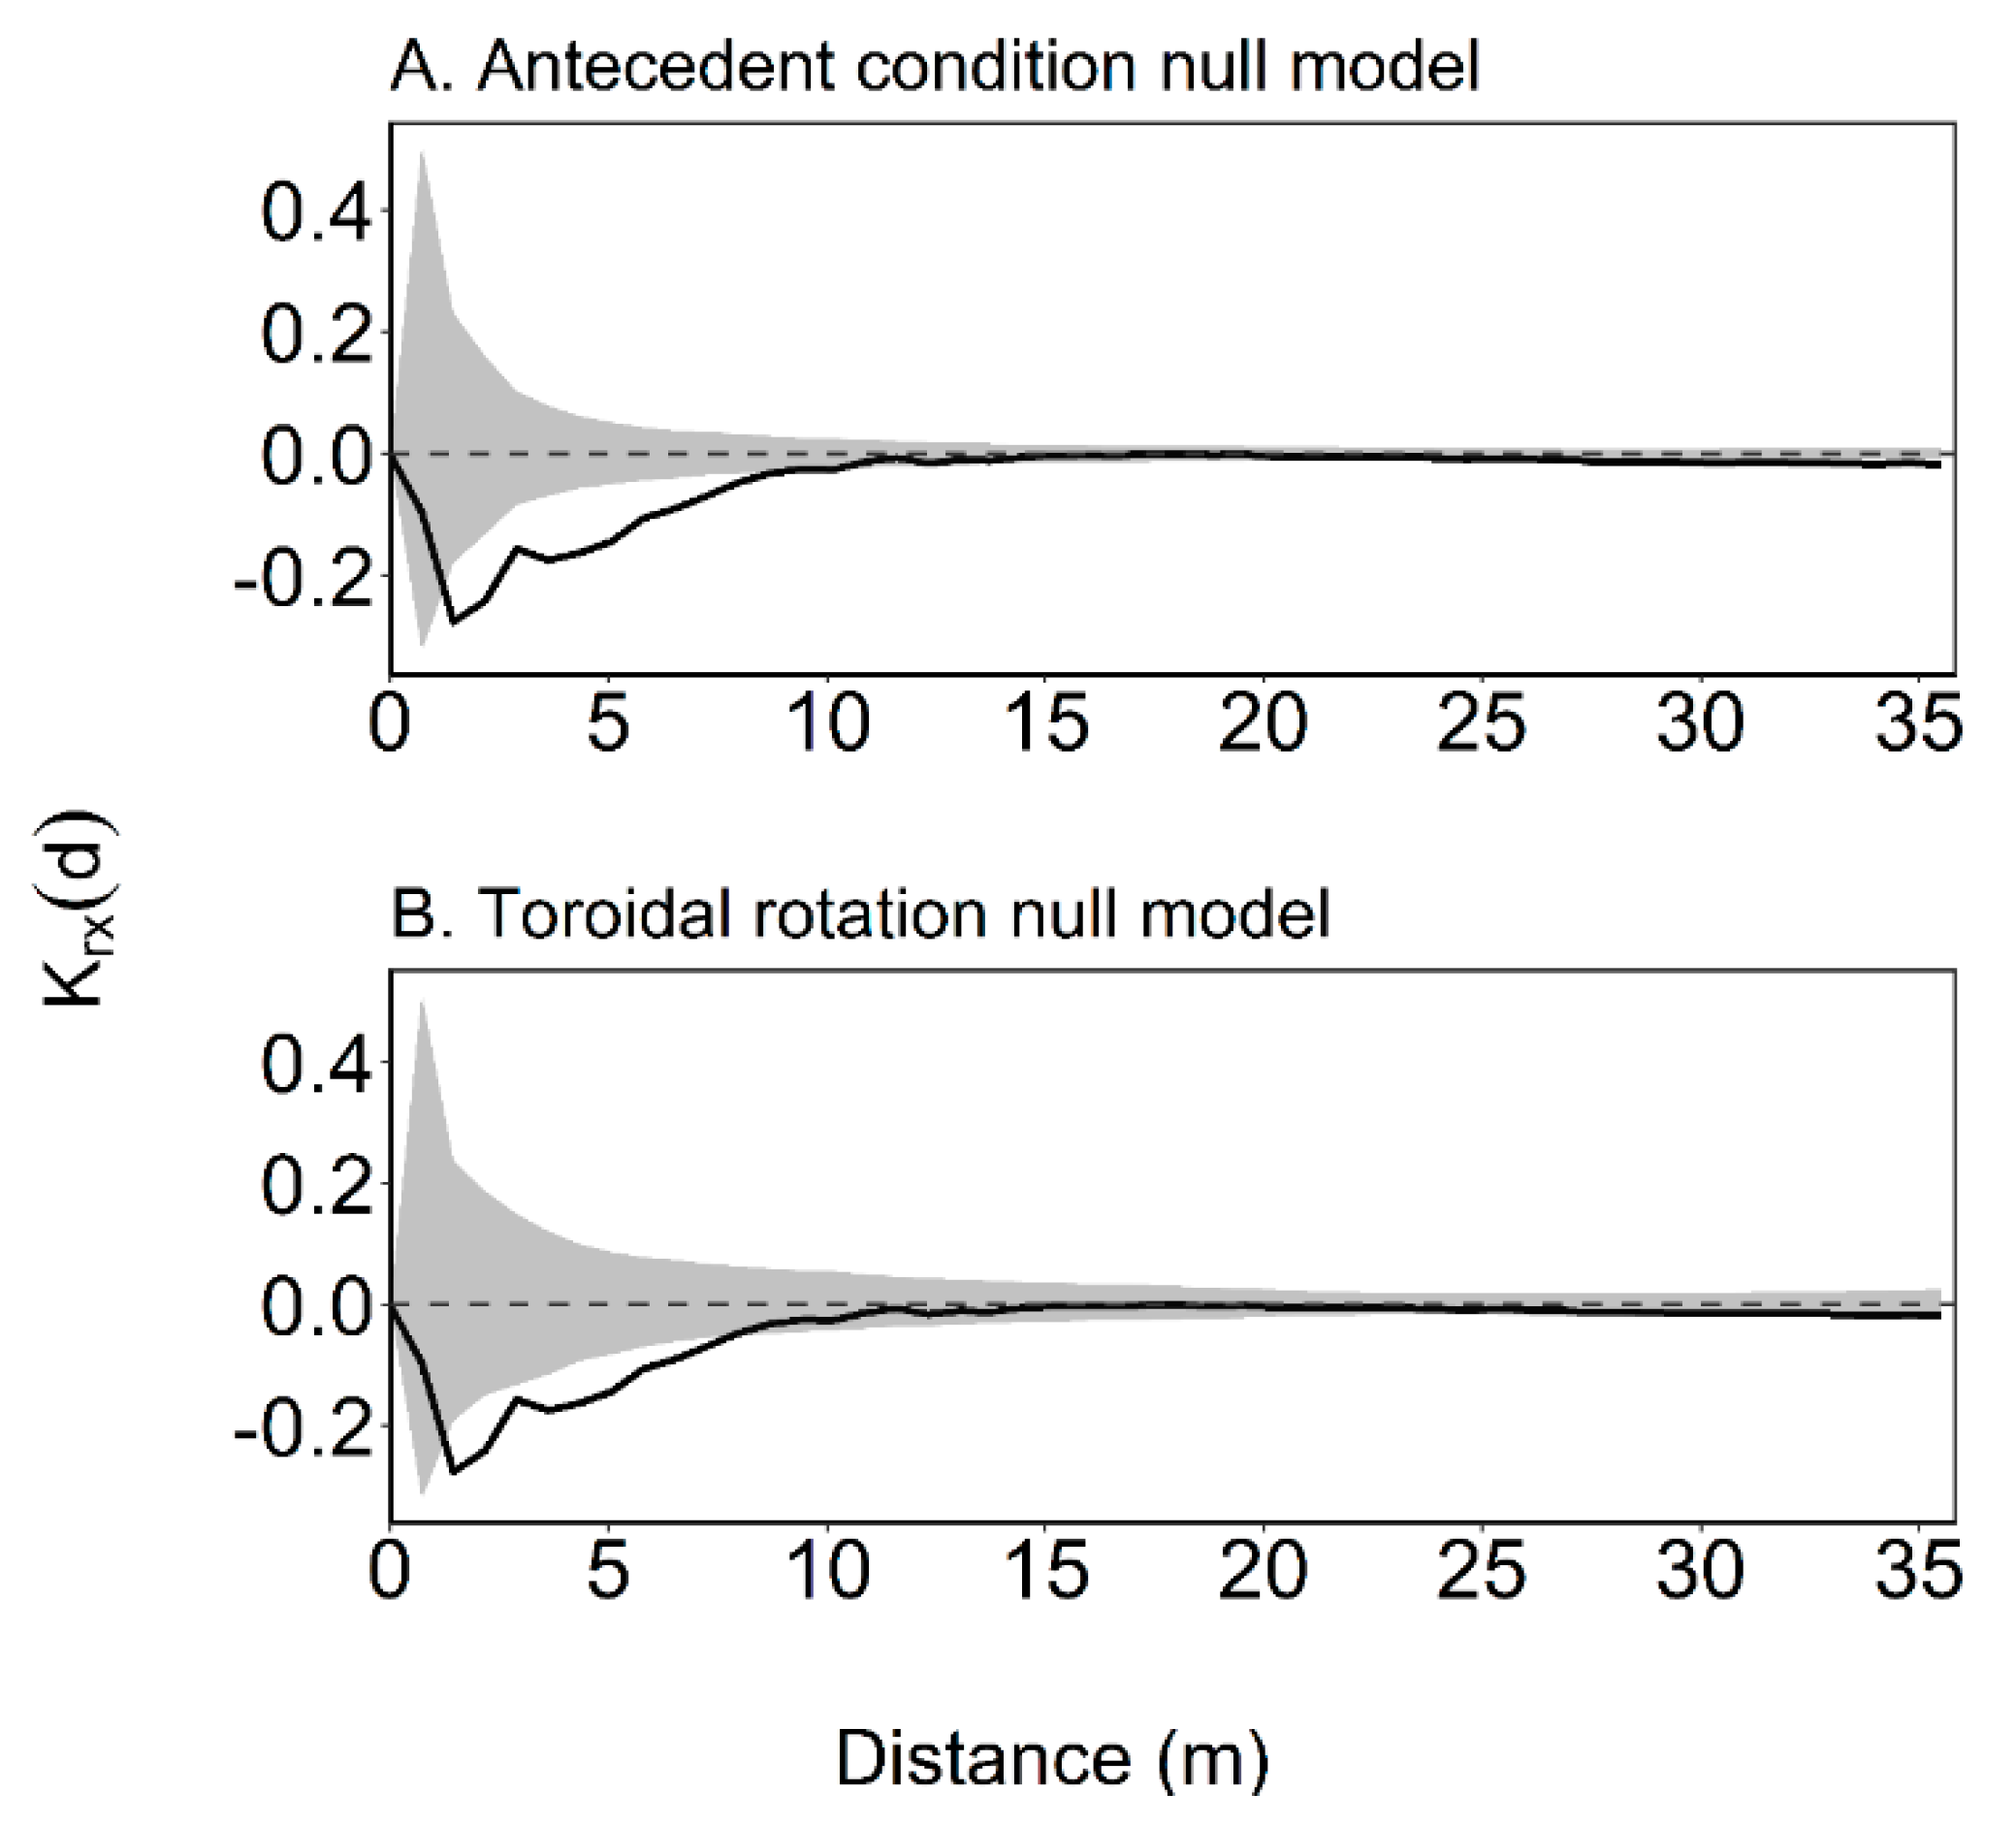
2.3. Intertype Krx(d) Function
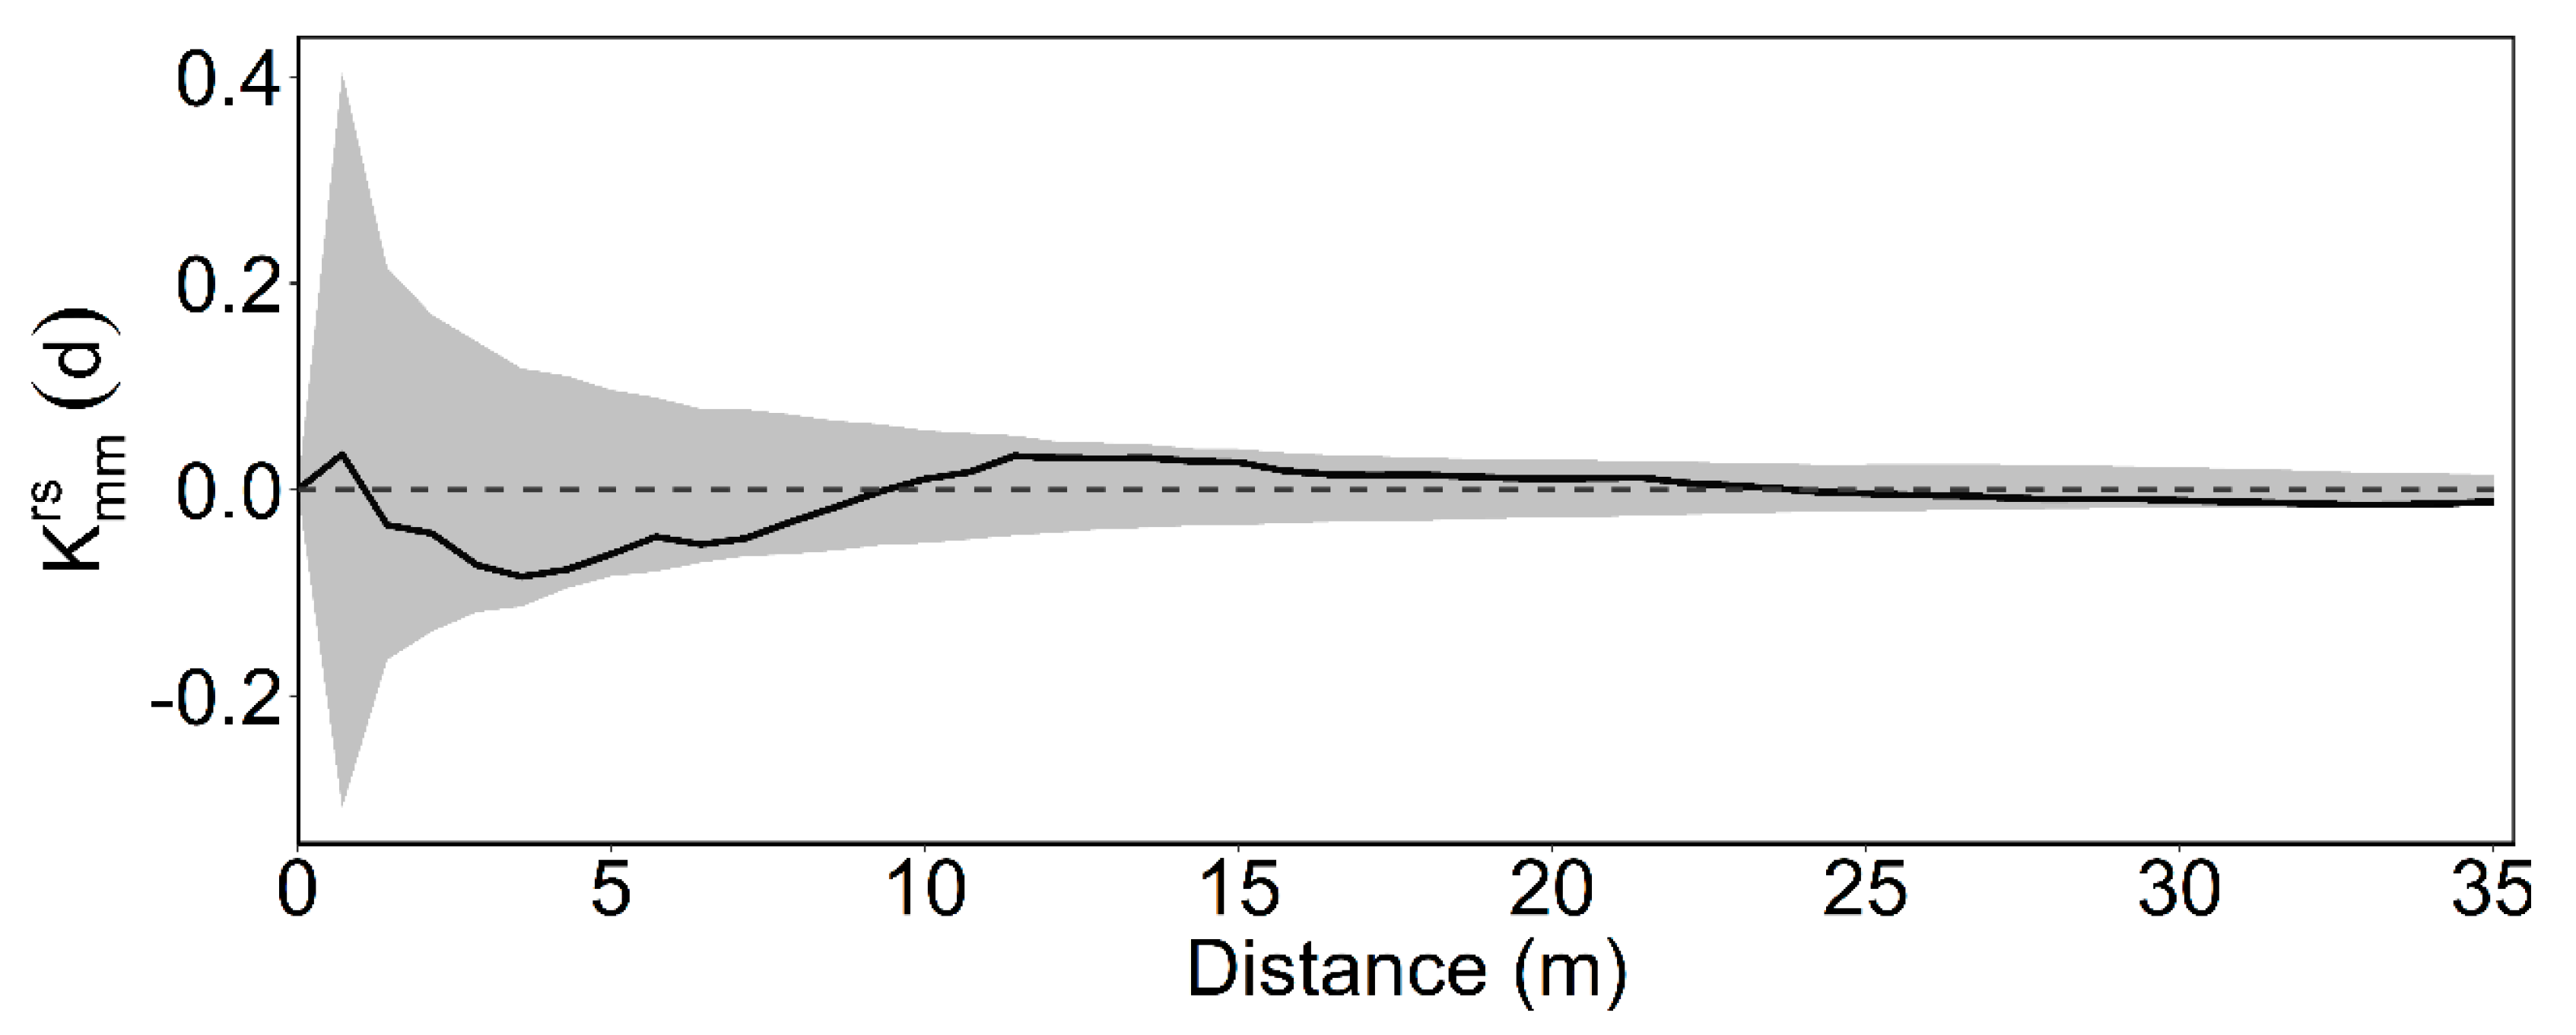
We used the intertype Krx(d) function proposed by Montes and Cañellas [18] to study the spatial dependence of sapling density on the spatial distribution of adult trees. This function modifies the interclass K12(d) function [32] allowing positive, negative or independent spatial associations between a point pattern of the adult trees and the sapling density measured at sampling points (or quadrat centers) and the scale at which it occurs to be identified [13]. Montes and Cañellas [18] expressed the Krx(d) function as:
K r x ( d ) = ( i = 1 N j = 1 n ω i j ( d ) [ ( x j x ¯ s x ] + i = 1 n j = 1 N ω j i ( d ) [ ( x j x ¯ s x ] ) i = 1 N j = 1 n ω i j ( d ) + i = 1 n j = 1 N ω j i ( d )
s x 2 = j = 1 n ( x j x ¯ ) 2 n
where N is the number of adult trees, n is the number of quadrats where the saplings were measured, xj is the number of saplings in the quadrat j and x ¯ is the mean sapling density in the study area. ωij is calculated as in the K (d) function.
Finally, we simulated 999 patterns of the antecedent condition null model and 999 patterns of the toroidal shift null model to build 95 % quantile bounds to test statistically the spatial dependence between adult trees and saplings [35].

2.4. Intertype Mark Correlation K ^ m m r s ( d ) Function

The intertype mark correlation K ^ m m r s ( d ) function [36] is a conditional mean function that incorporates the mark covariance as a test function, and can be defined as the expected covariance of the normalized mark values between pairs of points of different cohorts within a given distance:
K ^ m m r s ( d ) = ( i = 1 n r j = 1 n s ω i j ( d ) ( m i m ¯ r ) s r ( m j m ¯ s ) s s + i = 1 n r j = 1 n s ω j i ( d ) ( m i m ¯ r ) s r ( m j m ¯ s ) s s ) i = 1 n r j = 1 n s ω i j ( d ) + i = 1 n r j = 1 n s ω j i ( d )
where nr and ns are the number of points in class r and class s (adult trees and saplings); sr and ss are the standard deviations of the marks in class r and class s respectively; m ¯ r and m ¯ s are the mean of the marks in class r and class s respectively and ω is calculated as in the K (d) function. As the function is normalized by the sum of the unweighted ωij(d), its value for a distance d depends only on the covariance between the marks of points belonging to different classes located at a distance < d.
In our case, the first class corresponds to the adult tree pattern and the dbh of each tree is used as a mark. The second class corresponds to the center of the quadrats where sapling density has been measured, the sapling density being the variable used as the mark.
The toroidal shift null model was used to test independence between the diameter of the adult trees and the sapling density for each distance, keeping the spatial distribution of the marks of both the adult trees and the quadrats fixed but shifting one pattern with respect to the other by a random vector for each simulation. If the diameter of the adult trees and the sapling density are independently distributed, the empirical function would be within the quantile bounds, whereas values for the K ^ m m r s ( d ) empirical function below the lower bound indicate negative correlation and values for the K ^ m m r s ( d ) empirical function over the upper bound indicate a positive correlation.

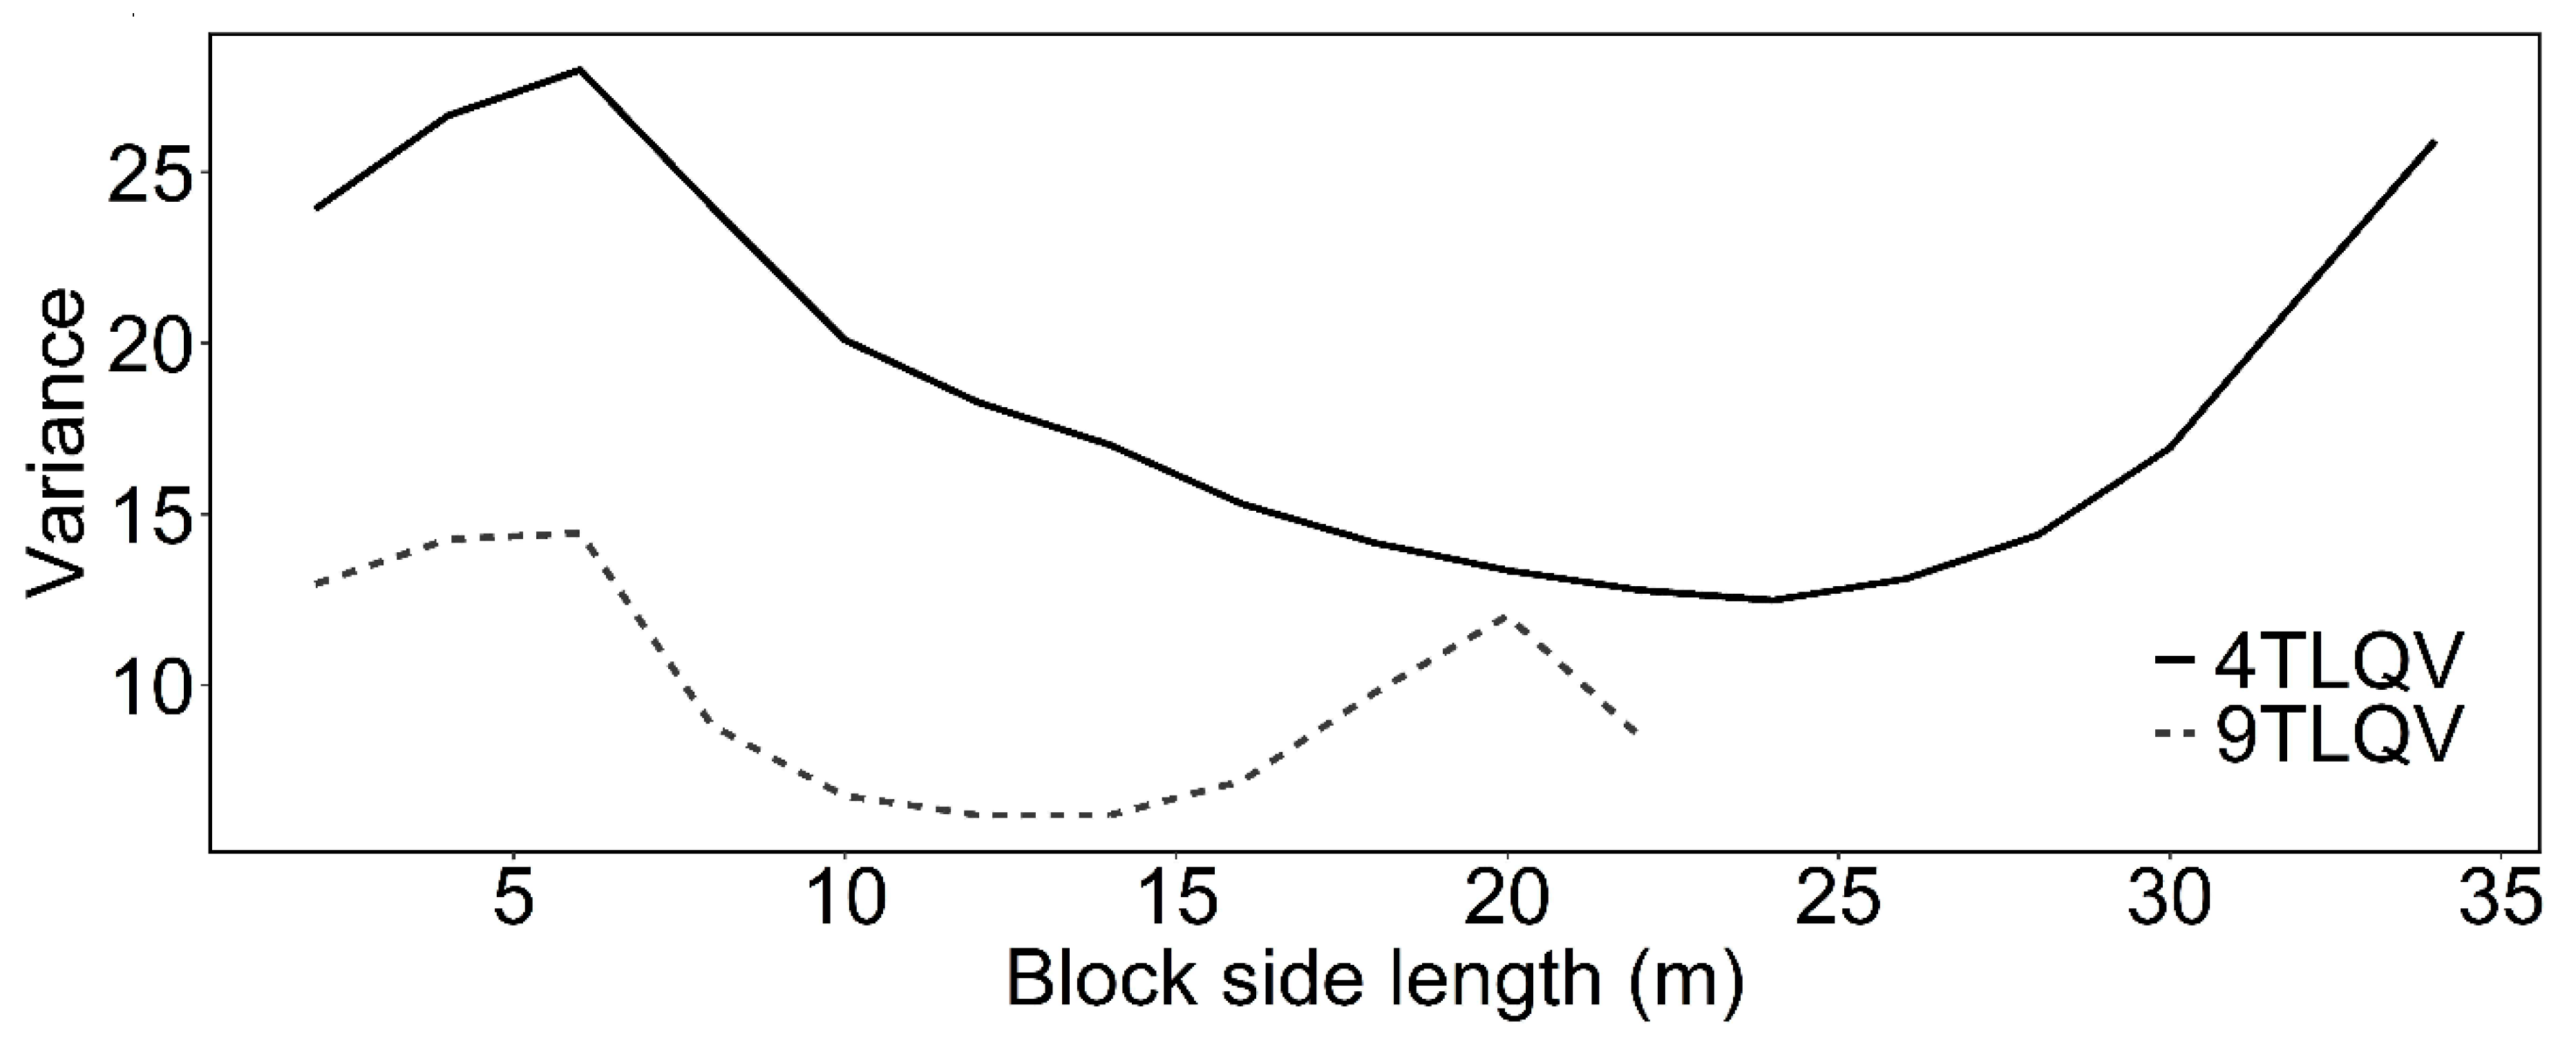
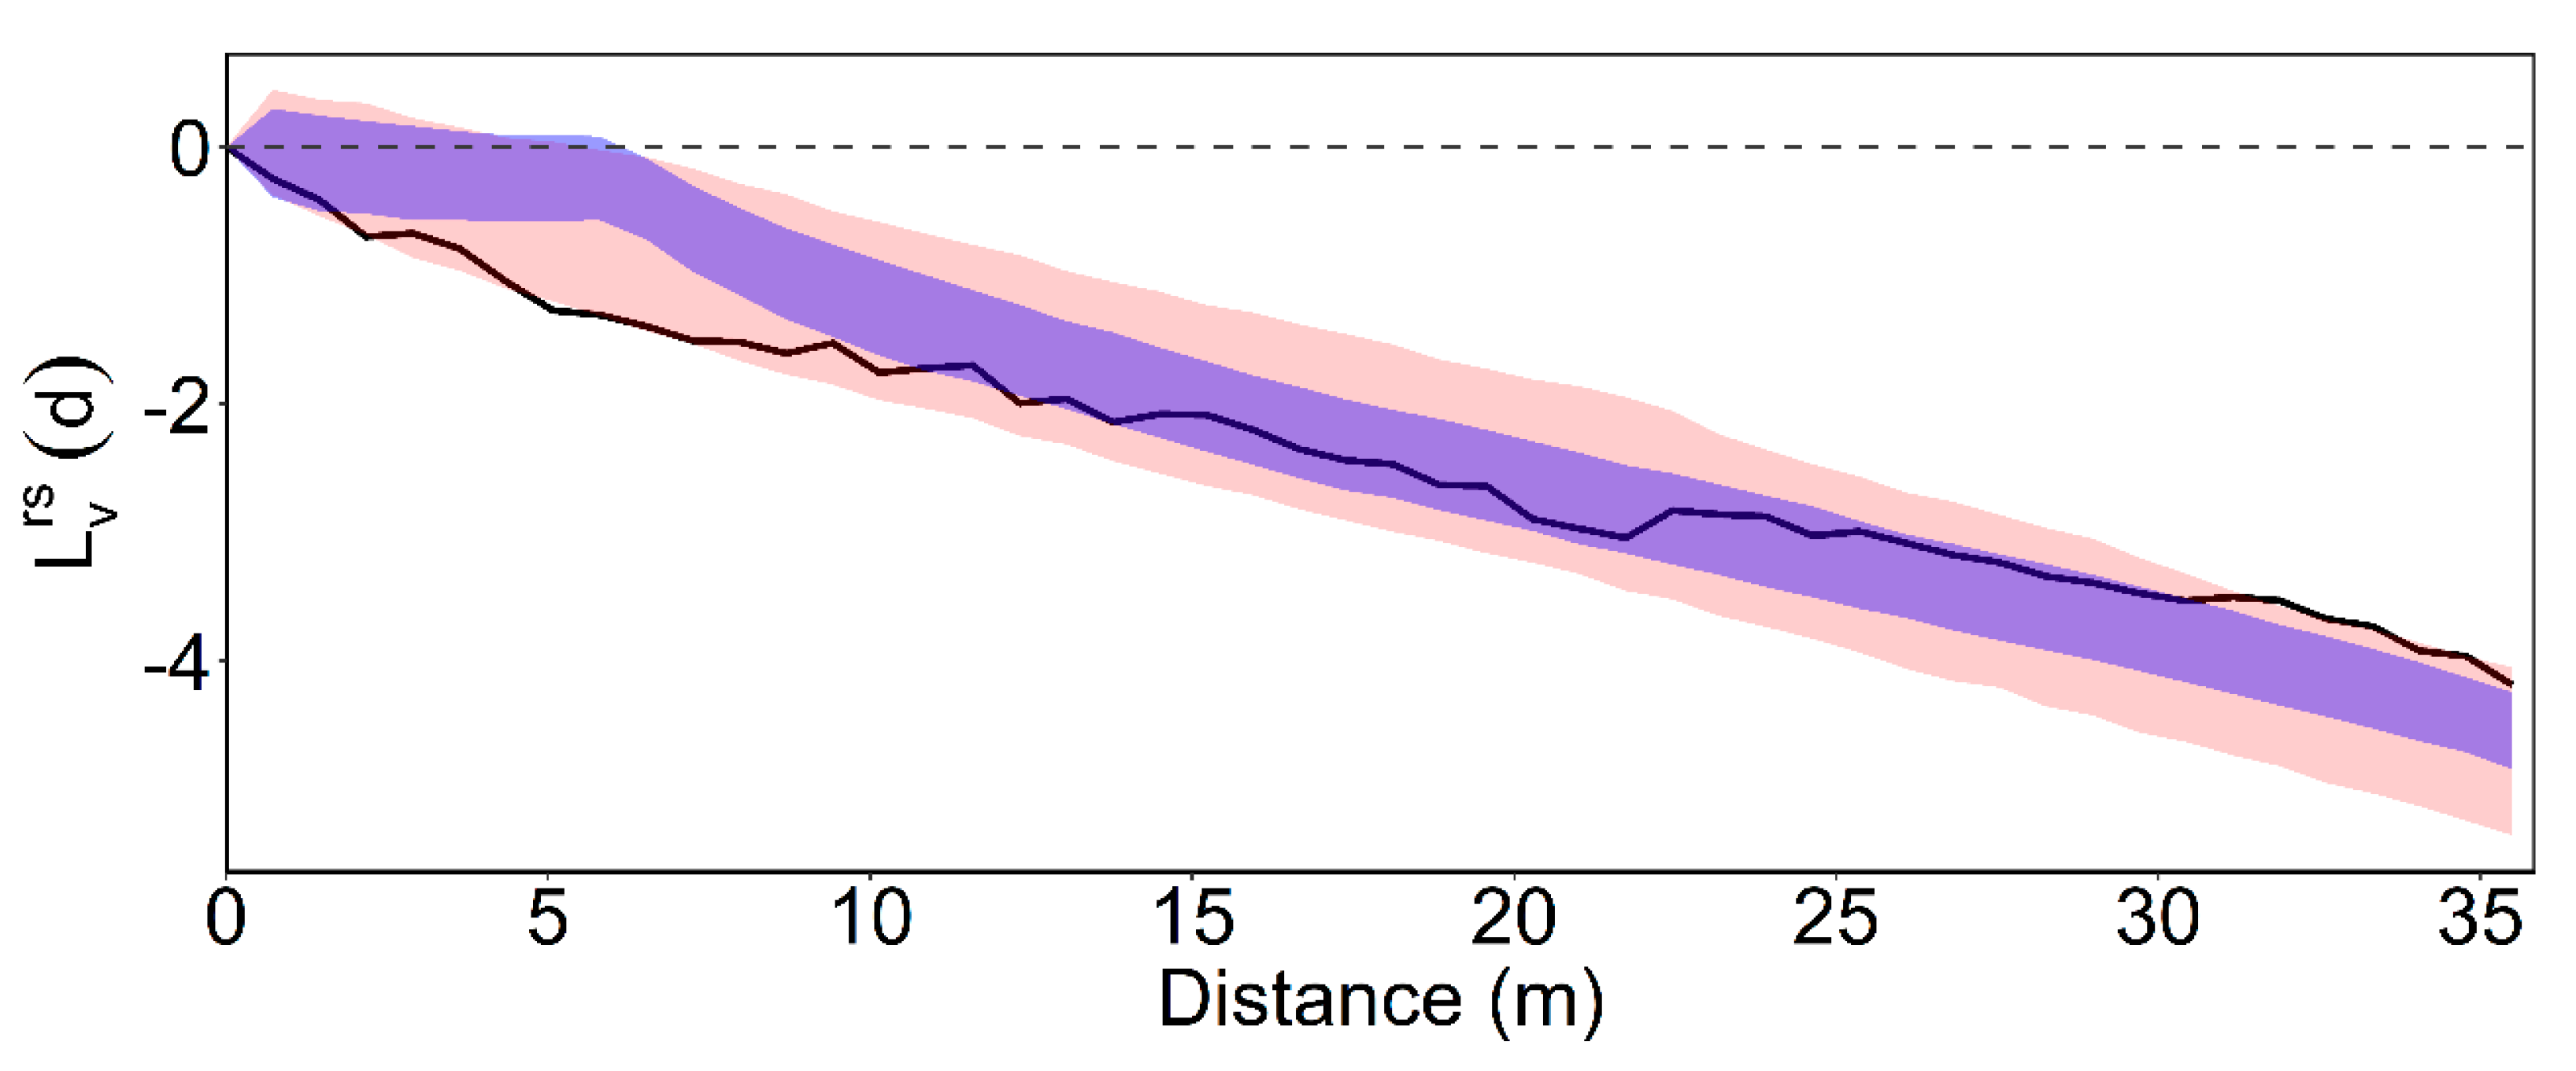
2.5. Disentangling the Spatial Pattern from the Mark Correlation: Intertype Mark Variance L ^ v r s ( d ) Function

In this section, we propose an approach to disentangling the spatial relationship between the marks of the classes (dbh for adult trees and density for saplings) and the spatial pattern of the two cohorts. The approach proposed here expands that of Montes et al. [37] for univariate data to bivariate data:
L ^ v r s ( d ) = 1 ( n r + n s ) 2 π ( i = 1 n r j = 1 n s ω i j n r ( ( m i m ¯ r s r ) ( m i m ¯ s s s ) ) 2 + i = 1 n r j = 1 n s ω i j n s ( ( m i m ¯ r s r ) ( m i m ¯ s s s ) ) 2 ) d
All the variables have been defined above. The value of the function depends both on the correlation of the marks and the number of individuals within a distance d around those individuals of different classes. The value of the function for the real plot distribution is compared with two different null models, one fixing the position of the points to detect correlation of the marks and the other fixing the spatial arrangement of the marks through a moving window algorithm to isolate the spatial attraction/repulsion. Values for the L ^ v r s ( d ) function outside the quantile bounds from the toroidal shift null model, preserving the mark associated with each adult tree when shifting their pattern, indicate spatial dependence of the marks of the classes, analogous to the case of K ^ m m r s ( d ) , whereas values for the L ^ v r s ( d ) function outside the quantile bounds from the toroidal shift null model combined with the moving window algorithm to reassign the mark associated with the adult trees, maintaining the relative distribution of the marks (dbh) of the adult trees with respect the quadrat densities, indicate spatial dependence of the classes, analogous to the case of Krx(d).
The local quadrat variance, the L(d) function and the intertype analyses were done using a Microsoft® VisualBasic® application developed by the authors (available by contacting the authors).

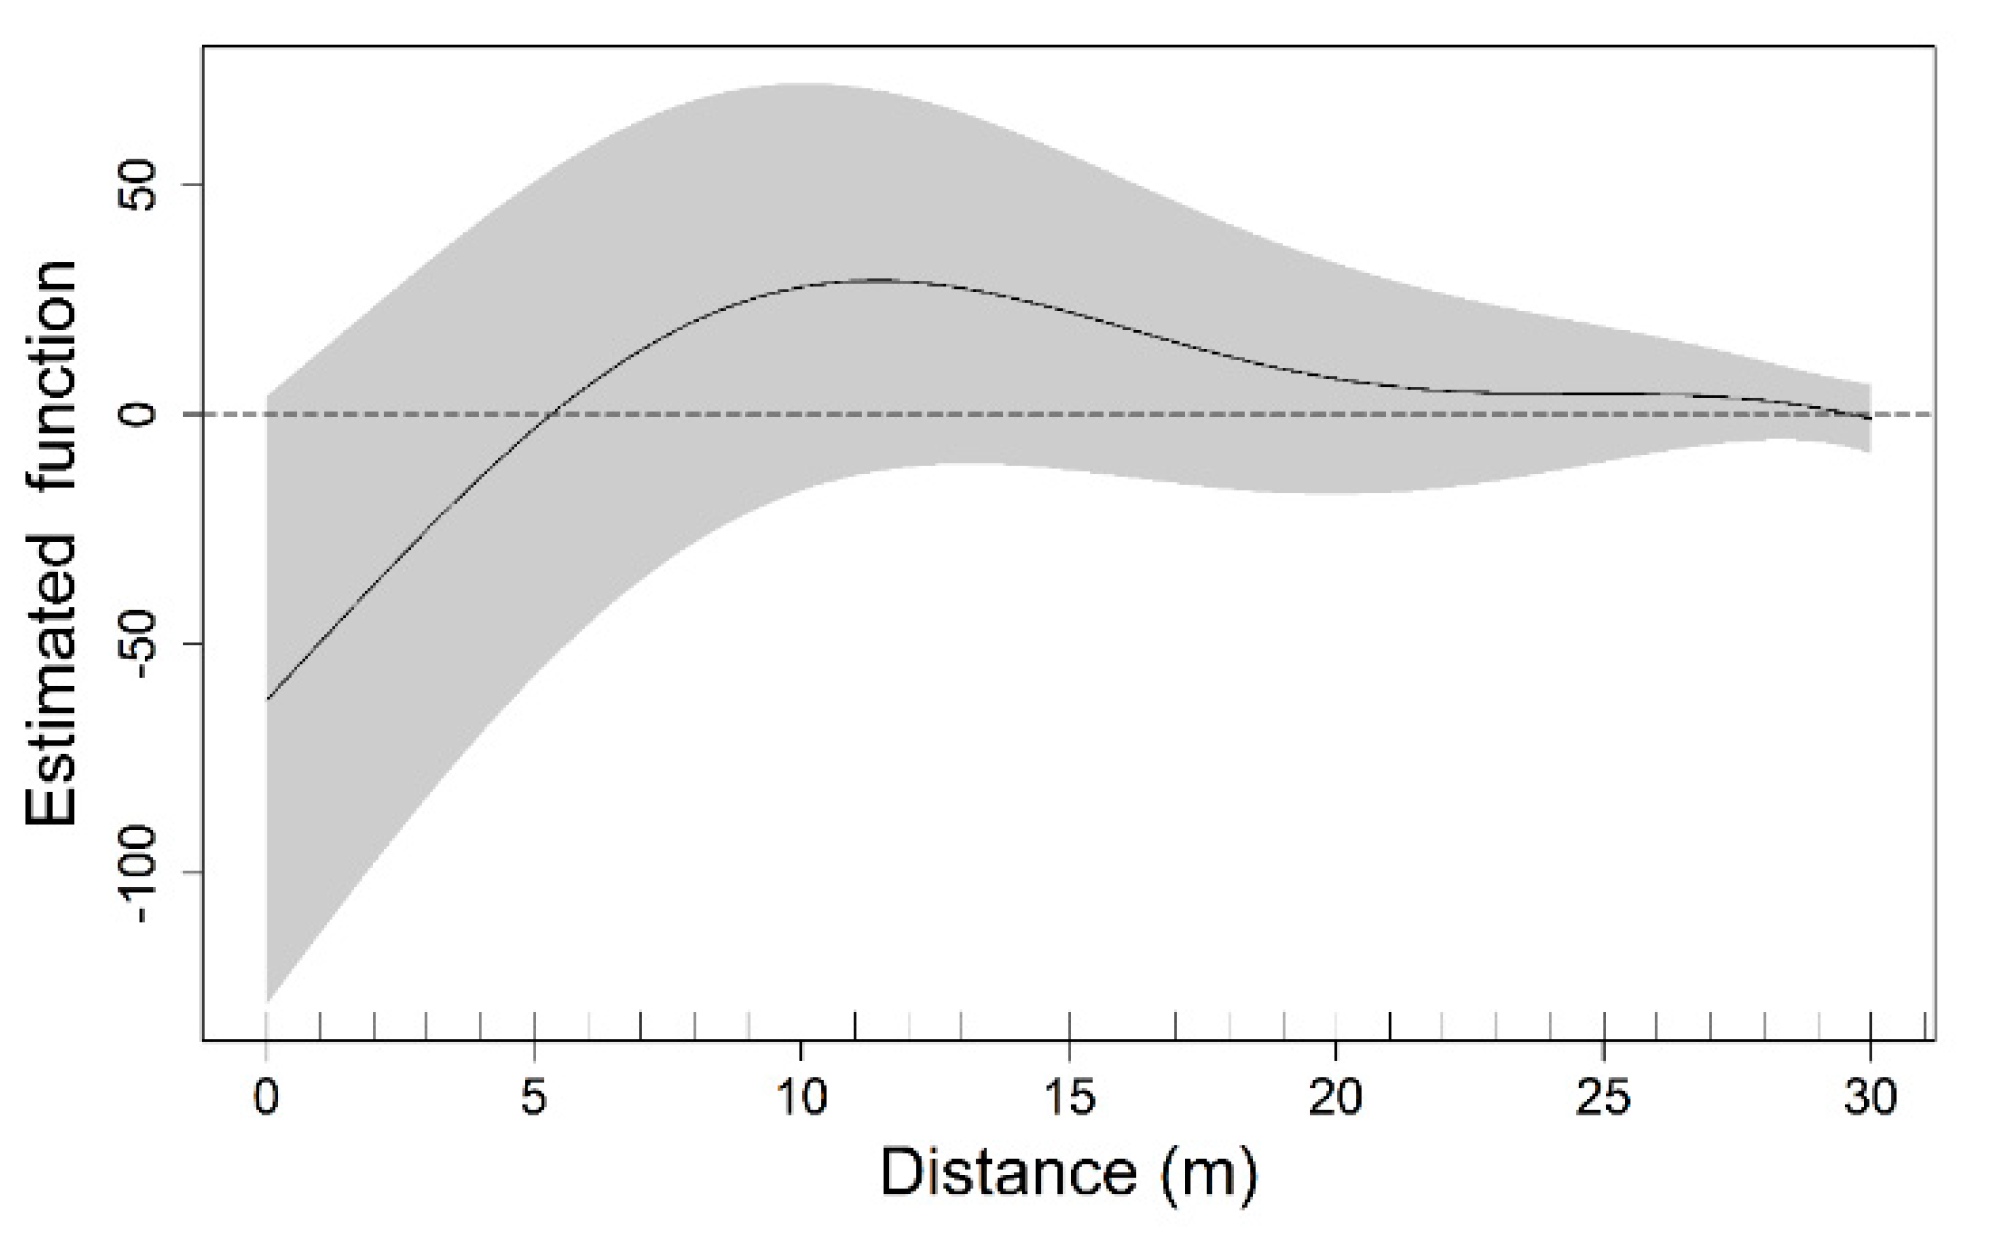
2.6. Functional Predictor within a Generalized Additive Model Framework

We modeled the expected number of saplings E(Nsj) = µj in the quadrat j employing a functional predictor [38] in a generalized additive model (GAM) framework [39,40]. In the functional prediction, the effect of every adult tree on the number of saplings per quadrat is weighted according to the distance between adult trees and saplings. This approach has been satisfactorily used to model forest ingrowth [20]. We proposed the following model:
log ( μ j ) = α + i = 1 N ( f 1 ( D j i ) d b h i A r e a I n 30 j ) + f 2 ( X j , Y j )
with Nsij following a negative binomial distribution as the variance exceeds the mean [41]. α refers to the intercept of the model, Dji is a matrix which contains the distances (in m) from the adult tree (I = 1, …, N) to the j sapling quadrat, and dbhi is the matrix of the dbh of the adult tree (I = 1, …, N) which dimensions are j files and i columns. The dbh was set to 0 when the i adult tree was more than 30 from the j quadrat. i = 1 N ( f 1 ( D j i ) d b h i / A r e a I n 30 j ) is the functional predictor term where f1(Dji) is the smooth coefficient of dbhi. AreaIn30 is the area (in m2) of the 30 m radius circle within the plot and was entered to correct the edge effect. Thus, this implies accepting the assumption that the surrounding trees outside the plot show a similar distribution to those within the plot. More details of the edge correction can be found in Moreno-Fernández et al. [20]. We select 30 m as it is approximately the double of the mean height of adult trees. Additionally, previous simulations revealed that the estimated smooth coefficient function stabilizes around zero at 30 m. The function f2(Xj, Yj) is a spatial smooth term of the j quadrat to account for the spatial trend, spatial correlation of the number of saplings and any spatial trend caused by other unmeasured environmental variables.
The selection of the variables was carried out using a stepwise selection process, using Akaike’s Information Criterion (AIC) for the evaluation. Finally, we checked whether the assumption of spatial independence was met by plotting a semivariogram per inventory with envelopes from 99 permutations under the assumption of no spatial correlation [42]. These statistical analyses were conducted using “mgcv” [38] and “geoR” [43] in R version 3.6.0 [44].

3. Results

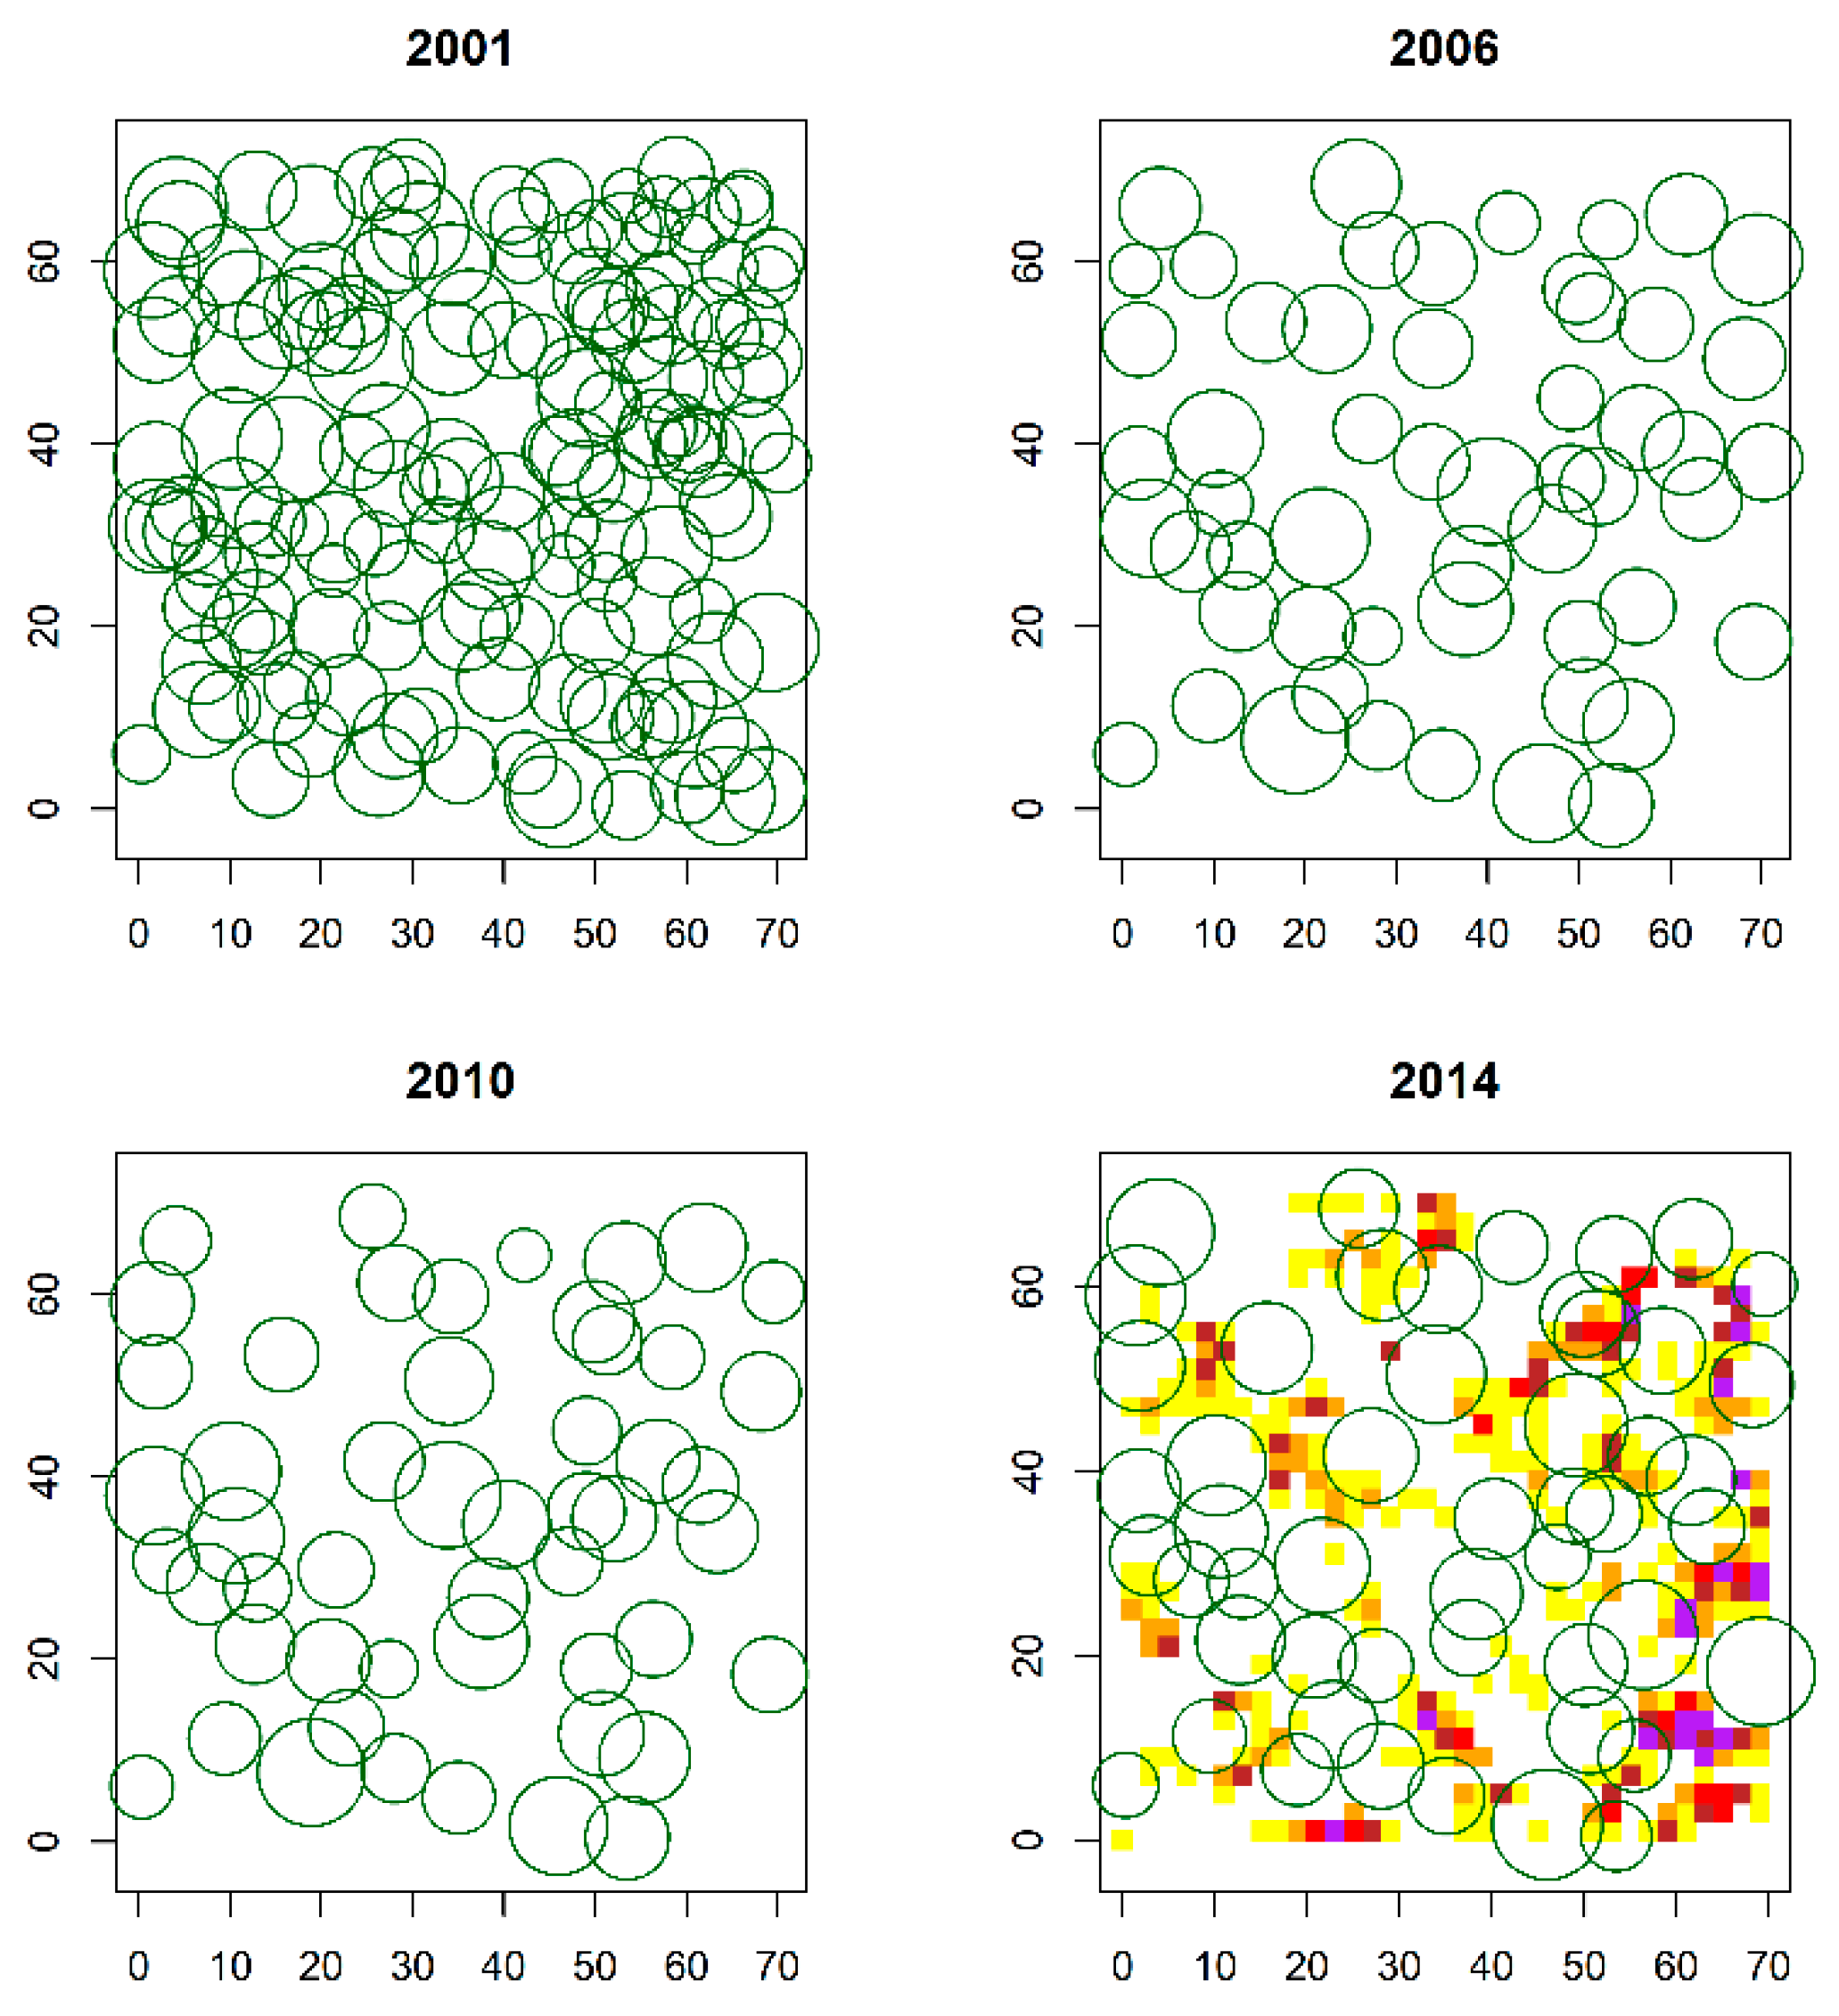
3.1. Spatial Pattern of P. Sylvestris Saplings and Adult Trees over the Regeneration Fellings of the Uniform Shelterwood System

The occurrence of the P. sylvestris saplings took place between 2010 and 2014 (Table 1). In 2014, the saplings were distributed in clumps over the whole plot (except below the adult trees) (Figure 1). The spatial structure of P. sylvestris saplings in clumps, as revealed by the map (Figure 1), is statistically confirmed by the variance-block length graph (Figure 2). This graph shows that both the 4TLQV and 9TLQV peaked at 5 m, suggesting spatial aggregation of saplings at scales of 5 m.
There is evidence of spatial regularity of adult trees at distances between 3 to 9 m as the L(d) function lies below the lower quantile bound (Figure 3). Beyond this range, the function is within the quantile bounds, suggesting a random distribution of adult trees farther than 9 m.

3.2. Intertype Functions

The intertype Krx(d) function for the spatial structure of saplings and adult trees revealed a negative influence of the adult trees on the sapling density when the distance between the individuals of both cohorts is shorter than 11 m as the Krx(d) function is below zero (Figure 4). Beyond this distance, the function remains close to zero indicating an independent spatial pattern between the two cohorts. However, the Krx(d) function is only outside the 95% quantile bounds at distances between 1.5 and 8.5 m in the case of the antecedent null model (p = 0.032), suggesting a statistically significant negative influence of adult trees on saplings when the former are located closer than 8.5 m from the saplings in the study area (p = 0.045). In the case of the toroidal shift, the Krx(d) function is outside the 95% quantile bounds between 1.5 and 7.5 m.
The intertype mark correlation K ^ m m r s ( d ) function for the dbh of the adult trees and the sapling density is within the 95% quantile bounds across the studied distances (Figure 5, p = 0.536). This indicates that sapling density is independently spatially distributed with respect to the size of the adult trees.
The intertype mark variance L ^ v r s ( d ) function is within the 95% quantile bounds of the toroidal null model without mark reassignation across the studied distances (red bounds in Figure 6, p = 0.304). This confirms the results of the intertype mark correlation K ^ m m r s ( d ) , the sapling density is not statistically related to the diameter of the adult trees. However, the intertype mark variance L ^ v r s ( d ) function lies below the 95% quantile bounds of the toroidal null model using the moving window algorithm with a 5 m window size to reassign the dbh of the trees at distances between 2 and 10 m (purple bounds in Figure 5, p = 0.001). All of this indicates that the sapling density is negatively related to the position of the adult trees at short distances, although this relationship is independant of the dbh of the adult trees.

3.3. Functional Predictor within a Generalized Additive Model Framework

The variable selection process revealed that the model with the lowest AIC was that containing the functional predictor i = 1 N ( f 1 ( D j i ) d b h i / A r e a I n 30 j ) and the spatial smoother f 2 ( X j , Y j ) . The largest reduction in AIC is due to the inclusion of the spatial term in the model (Table 2). This suggests that the spatial distribution of the P. sylvestris saplings is primarily associated with the unmeasured variables such as microsite conditions (i.e., low stoniness) and the spatial pattern of previous stages of development and secondly to the size and position of adult trees under the studied conditions. The final model explained 47.4 % of the deviance and both the functional predictor and the spatial component had a significant effect on the number of saplings (p < 0.0001). In the case of the functional predictor, Figure 7 reveals a negative association between the diameter of adult trees and saplings when the distance between both cohorts is 0–6 m. Beyond this range, the coefficient turns positive, reaching the maximum at 11 m. This means that the largest number of saplings are expected to be found when the distance between adult trees and saplings is 11 m. The confidence intervals are, however, quite wide and contain the zero, indicating that the effect of adult trees on saplings is not so strong. The basis dimension of the functional predictor (10.0) is larger than the efficient degrees of freedom (4.8), ensuring that the underlying process, in this case, the sapling distribution, is represented reasonably well.
The spatial component accounted for the remaining spatial trend of the saplings and, together with the functional predictor, removed the spatial autocorrelation of the residuals (data not shown).

4. Discussion

4.1. Pinus sylvestris Sapling Distribution over the Fellings of the Uniform Shelterwood Method

In this study, we presented the first attempt at describing the spatial dependence of the number of saplings of P. sylvestris (sapling density) and adult trees during regeneration fellings under the uniform shelterwood method. In previous studies, this dependence has been studied in a monospecific pine forest which is regenerated through the group shelterwood method. Moreno-Fernández et al. [20] found stronger spatial relationships between the size of adult trees and saplings than that revealed by the GAM used in the present study; the number of saplings decreases significantly when the distance from adult trees is less than 7-8 m. In contrast, Montes et al. [18] detected weaker spatial dependence between both cohorts during shelterwood fellings. The intertype mark variance L ^ v r s ( d ) and the intertype mark correlation K ^ m m r s ( d ) revealed that the dbh of the adult trees does not play a determinant role in the recruitment processes in this forest. This is not surprising as the forest has an even-aged structure with homogeneous distribution of adult tree dbh. The selection of trees that are maintained during the regeneration fellings may be based both on their spatial distribution to attain openings large enough and on the stem production characteristics (large dbh, straight stem without branches) of the individuals that are able to provide the seed for the new generation. However, the density of mother trees affects significantly the recruitment establishment in their proximity, pointing to the management of the tree density as the key factor be controlled during the regeneration process. The spatial repulsion between saplings and adult trees at shorter distances suggests that adult trees must be removed when the new individuals grow into saplings, but an excessive density reduction during the preparatory cuttings may favor the establishment of a dense herb layer that may hinder seedling establishment [45].
The clustered pattern of the new individuals of P. sylvestris has already been reported for seedlings and saplings of this species as the younger individuals perform better in microsites with more favorable conditions [11,46]. Similar findings have been reported for other pine species, e.g., Pinus uncinata Ramond ex DC [12]. Carrer et al. [47] employed bivariate point pattern analyses to describe the spatial dependence between Pinus cembra L., Picea abies (L.) H. Karst. and Larix decidua Mill. recruits and the adult trees at different altitudes in the Alps. Overall, they report similar findings to ours, that is, the repulsion between adult trees and recruits at short distances except in the case of P. cembra at higher altitudes where the relationship becomes positive. Batllori et al. [12] also found spatial repulsion between P. uncinata saplings and adult trees of this species in the Pyrenees. Malone et al. [48], however, found attraction between adult trees and seedlings of conifers at very short distances (<0.5 m) and repulsion at distances beyond 1 m in a dry conifer forest located in Colorado (USA). Ledo et al. [13] used the Krx(d) function to analyze the spatial dependence between adult trees and new cohorts in multispecies forests under tropical conditions. Under the conditions present in the aforementioned studies, the spatial association between classes varies depending on the species [13] and spatial scale [48].
It is worth to note that our results come from a single plot so that they must be interpreted with caution. However, the spatial association between adult trees and sapling density of P. sylvestris over the uniform shelterwood regeneration fellings are in accordance with other studies carried out in P. sylvestris stands in Central Spain [18,20].

4.2. Method Comparison

In this work, we used two types of techniques to describe the spatial dependence of sapling density and adult trees: three intertype correlation functions and a functional predictor within a GAM framework. The intertype Krx(d) function allows a spatial relationship between sapling density and the spatial pattern of the adult trees to be detected [18]. The antecedent conditions show a greater range of spatial repulsion between the adult trees and the saplings, but under the regular pattern of the adult trees, this null model performs in a very similar way to the toroidal shift null model. The intertype mark correlation K ^ m m r s ( d ) evaluates the spatial correlation between the mark of the adult trees (tree dbh in our study) and the sapling density [13], and the toroidal shift null model seems the most appropriate in this case because this model preserves the intra-class pattern of the dbh of the adult trees and the sapling density in the quadrats, removing the spatial association between both processes through random shifting. The new point pattern function proposed, the intertype mark variance L ^ v r s ( d ) function, which combines the information reported by intertype Krx(d) function and the intertype mark correlation K ^ m m r s ( d ) function in a single function, disentangles the effect of the size and the spatial pattern of adult trees on the regeneration density, in a similar way to the univariate Lm(d) function proposed by Montes et al. [37]. The similarity between the range of spatial repulsion and mark correlation detected by the L ^ v r s ( d ) and the ranges of spatial repulsion and mark correlation detected by Krx(d) and the K ^ m m r s ( d ) respectively indicates that the toroidal shift preserving the dbh associated with each adult tree is appropriate to assess the mark correlation, whereas the toroidal shift null model combined with the moving window algorithm to reassign the dbh to the adult trees is appropriate in this case for analyzing the spatial association between adult tree closeness and sapling density.
The linear functional predictor within the GAM is an analogous approach to the K ^ m m r s ( d ) function, incorporating the product between the dbh and the distance between the sapling quadrat and the adult tree. In fact, both approaches detected negative, although non significant, spatial dependence between sapling density and adult trees. It is likely that the functional predictor of the GAM, n = 1 N ( f 1 ( D j i ) d b h i / A r e a I n 30 j ) , is confounded with the spatial smoother, f 2 ( X j , Y j ) , as both terms deal with the spatial structure of the sapling density [20]. The spatial smoother, however, accounts for the spatial correlation of the residuals and allows the effect of unmeasured variables to be considered [49]. The main advantages of the GAM over the point pattern methods used here are: (i) variables defined in several forms may be incorporated in the GAM, such as smooth terms, variables with linear effects, tensor products of several variables, with varying coefficients or as functional predictors; and (ii) the GAM can incorporate several temporal and spatio-temporal structures which are of great interest where there is data with repeated measurements [40,50,51].
Therefore, it seems reasonable to use the intertype functions for data without repeated measurements, as well as when there is no information on other predictor variables (e.g., stoniness, soil humidity or shrub cover) or where the effect of other variables on the spatial dependence between cohorts is not of interest. Further studies focusing on other types of data, e.g., data dealing with spatial dependence of species or variables characterizing niche suitability are necessary to further our knowledge with regard to the performance of the approaches used here. In a future step, growth dynamics of both saplings and remaining adult trees (as in Montoro et al. [52]) after the regeneration fellings may be incorporated through space–time modeling approaches to provide a deeper insight of the regeneration process and stand response under the uniform shelterwood method.

5. Conclusions

In our study, we found that regeneration fellings under the uniform shelterwood system resulted in an even-aged stand (i.e., homogeneous distribution of adult trees by dbh) and sapling density is not expected to change according to adult tree size. Taking into consideration the dbh of adult trees to explain the spatial distribution of saplings is of particular interest when the size of the adult trees is more heterogeneous than we had in this study. However, as our findings resulted from a single plot, replications may provide further information on the spatial association between adult trees and saplings in P. sylvestris stands in the studied area. In addition, similar studies may be carried out across the range of the species to modulate the shelterwood system for the different areas under the forecasted climate change.
We found the intertype mark variance L ^ v r s ( d ) function to be a useful approach to disentangle the spatial effect of the marks of the classes (sapling density and adult trees size) and the effect of the spatial pattern of the classes. However, to determine whether there are other measured variables (e.g., stoniness, shrub cover) driving the underlying process (regeneration in our study case) and where repeated measurements are available, the GAM may be highly effective. Finally, comparisons among approaches must be extended to other types of data, such as multispecies data.

Author Contributions

Methodology, F.M., A.L. and D.M.-F.; software, F.M.; formal analysis, D.M.-F. and F.M.; resources, I.C. and F.M.; writing—original draft preparation, D.M.-F; writing—review and editing, F.M., A.L. and I.C.; supervision, I.C.; funding acquisition, I.C. and F.M. All authors have read and agreed to the published version of the manuscript.

Funding

This research was funded by Ministry of Science, Innovation and Universities, grant number AGL2016-76769-C2-1-R and Ministry of Agriculture, grant number EG28-042-C2.

Acknowledgments

The authors thank Ángel Bachiller and Estrella Viscasillas for the fieldwork and Adam Collins for revising and editing the English grammar. We also thank the reviewers and the academic editor who provided good comments to improve the paper.

Conflicts of Interest

The authors declare no conflict of interest.

References

  1. Lucas-Borja, M.E. Climate change and forest natural regeneration in mediterranean mountain areas. For. Res. 2014, 3, 2–3. [Google Scholar] [CrossRef] [Green Version]
  2. Simon, A.; Katzensteiner, K.; Gratzer, G. Drivers of forest regeneration patterns in drought prone mixed-species forests in the northern calcareous alps. For. Ecol. Manag. 2019, 453, 117589. [Google Scholar] [CrossRef]
  3. Petersson, L.K.; Milberg, P.; Bergstedt, J.; Dahlgren, J.; Felton, A.M.; Götmark, F.; Salk, C.; Löf, M. Changing land use and increasing abundance of deer cause natural regeneration failure of oaks: Six decades of landscape-scale evidence. For. Ecol. Manag. 2019, 444, 299–307. [Google Scholar] [CrossRef]
  4. Munck, I.A.; Morin, R.S.; Ostrofsky, W.D.; Searles, W.; Smith, D.R.; Stanosz, G.R. Impact of Sirococcus shoot blight (Sirococcus tsugae) and other damaging agents on eastern hemlock (Tsuga canadensis) regeneration in Northeastern USA. For. Ecol. Manag. 2018, 429, 449–456. [Google Scholar] [CrossRef]
  5. Lavoie, J.; Montoro Girona, M.; Morin, H. Vulnerability of conifer regeneration to spruce budworm outbreaks in the eastern canadian boreal forest. Forests 2019, 10, 850. [Google Scholar] [CrossRef] [Green Version]
  6. Clark, J.S.; Iverson, L.; Woodall, C.W.; Allen, C.D.; Bell, D.M.; Bragg, D.C.; D’Amato, A.W.; Davis, F.W.; Hersh, M.H.; Ibanez, I.; et al. The impacts of increasing drought on forest dynamics, structure, and biodiversity in the United States. Glob. Chang. Biol. 2016, 22, 2329–2352. [Google Scholar] [CrossRef] [Green Version]
  7. Hansen, W.D.; Braziunas, K.H.; Rammer, W.; Seidl, R.; Turner, M.G. It takes a few to tango: Changing climate and fire regimes can cause regeneration failure of two subalpine conifers. Ecology 2018, 99, 966–977. [Google Scholar] [CrossRef]
  8. Montoro Girona, M.; Lussier, J.M.; Morin, H.; Thiffault, N. Conifer regeneration after experimental shelterwood and seed-tree treatments in boreal forests: Finding silvicultural alternatives. Front. Plant Sci. 2018, 9. [Google Scholar] [CrossRef]
  9. Kuuluvainen, T.; Pukkala, T. Simulation of within-tree and between-tree shading of direct-radiation in a forest canopy: Effect of crown shape and sun elevation. Ecol. Modell. 1989, 49, 89–100. [Google Scholar] [CrossRef]
  10. Woods, K.D.; Acer, K. Patterns of tree replacement: Canopy effects on understory pattern in hemlock-northern hardwood forests. Vegetatio 1984, 56, 87–107. [Google Scholar]
  11. Pardos, M.; Montes, F.; Aranda, I.; Cañellas, I. Influence of environmental conditions on germinant survival and diversity of scots pine (Pinus sylvestris L.) in central Spain. Eur. J. For. Res. 2007, 126, 37–47. [Google Scholar] [CrossRef]
  12. Batllori, E.; Camarero, J.J.; Gutiérrez, E. Current regeneration patterns at the tree line in the Pyrenees indicate similar recruitment processes irrespective of the past disturbance regime. J. Biogeogr. 2010, 37, 1938–1950. [Google Scholar] [CrossRef]
  13. Ledo, A.; Cayuela, L.; Manso, R.; Condés, S. Recruitment patterns and potential mechanisms of community assembly in an Andean Cloud Forest. J. Veg. Sci. 2015, 26, 876–888. [Google Scholar] [CrossRef]
  14. LeMay, V.; Pommerening, A.; Marshall, P. Spatio-temporal structure of multi-storied, multi-aged interior douglas fir (Pseudotsuga menziesii var. glauca) stands. J. Ecol. 2009, 97, 1062–1074. [Google Scholar] [CrossRef]
  15. Ripley, B. Modelling spatial patterns (with discussion). J. R. Stat. Soc. 1977, 39, 172–212. [Google Scholar]
  16. Stoyan, D.; Stoyan, H. Non-homogeneous gibbs process models for forestry—A case study. Biom. J. 1998, 40, 521–531. [Google Scholar] [CrossRef]
  17. Pommerening, A.; Stoyan, D. Edge-correction needs in estimating indices of spatial forest structure. Can. J. For. Res. 2006, 36, 1723–1739. [Google Scholar] [CrossRef] [Green Version]
  18. Lotwick, H.W.; Silverman, B.W. Methods for analysing spatial processes of several types of points. J. R. Stat. Soc. Ser. B 1982, 44, 406–413. [Google Scholar] [CrossRef]
  19. Goreaud, F.; Pélissier, R. Avoiding misinterpretation of biotic interactions with the intertype K12-function: Population independence vs. random labelling hypotheses. J. Veg. Sci. 2003, 14, 681–692. [Google Scholar] [CrossRef]
  20. Montes, F.; Cañellas, I. The spatial relationship between post-crop remaining trees and the establishment of saplings in Pinus sylvestris stands in Spain. Appl. Veg. Sci. 2007, 10, 151. [Google Scholar] [CrossRef]
  21. Moreno-Fernández, D.; Augustin, N.H.; Montes, F.; Cañellas, I.; Sánchez-González, M. Modeling sapling distribution over time using a functional predictor in a generalized additive model. Ann. For. Sci. 2018, 75, 9. [Google Scholar] [CrossRef] [Green Version]
  22. Mason, W.; Alía, R. Current and future status of scots pine (Pinus sylvestris L.) forests in Europe. For. Syst. 2000, 9, 317–335. [Google Scholar]
  23. Martínez-Vilalta, J.; Cochard, H.; Mencuccini, M.; Sterck, F.; Herrero, A.; Korhonen, J.F.J.; Llorens, P.; Nikinmaa, E.; Nolè, A.; Poyatos, R.; et al. Hydraulic adjustment of scots pine across Europe. New Phytol. 2009, 184, 353–364. [Google Scholar] [CrossRef] [PubMed]
  24. Sterck, F.J.; Martínez-Vilalta, J.; Mencuccini, M.; Cochard, H.; Gerrits, P.; Zweifel, R.; Herrero, A.; Korhonen, J.F.J.; Llorens, P.; Nikinmaa, E.; et al. Understanding trait interactions and their impacts on growth in scots pine branches across Europe. Funct. Ecol. 2012, 26, 541–549. [Google Scholar] [CrossRef] [Green Version]
  25. Taeger, S.; Zang, C.; Liesebach, M.; Schneck, V.; Menzel, A. Impact of climate and drought events on the growth of scots pine (Pinus sylvestris L.) provenances. For. Ecol. Manag. 2013, 307, 30–42. [Google Scholar] [CrossRef]
  26. Barbeito, I.; LeMay, V.; Calama, R.; Cañellas, I. Regeneration of Mediterranean Pinus sylvestris under two alternative shelterwood systems within a multiscale framework. Can. J. For. Res. 2011, 41, 341–351. [Google Scholar] [CrossRef]
  27. Coban, S.; Colak, A.H.; Rotherham, I.D. Interactions between canopy cover density and regeneration cores of older saplings in scots pine (Pinus sylvestris L.) stands. For. Syst. 2016, 25. [Google Scholar] [CrossRef] [Green Version]
  28. Herrero, A.; Zamora, R.; Castro, J.; Hódar, J.A. Limits of pine forest distribution at the treeline: Herbivory matters. Plant Ecol. 2012, 213, 459–469. [Google Scholar] [CrossRef]
  29. Ledo, A.; Condés, S.; Montes, F. Intertype mark correlation function: A new tool for the analysis of species interactions. Ecol. Modell. 2011, 222, 580–587. [Google Scholar] [CrossRef]
  30. Tíscar, P.A.; Candel-Pérez, D.; Estrany, J.; Balandier, P.; Gómez, R.; Lucas-Borja, M.E. Regeneration of three pine species in a Mediterranean forest: A study to test predictions from species distribution models under changing climates. Sci. Total Environ. 2017, 584, 78–87. [Google Scholar] [CrossRef]
  31. Montero, G.; del Río, M.; Roig, S.; Rojo, A. Selvicultura de Pinus sylvestris L. In Compendio de Selvicultura Aplicada en España2; Serrada, R., Montero, G., Reque, J., Eds.; INIA & Ministerio de Educación y Ciencia: Torrejón de Ardoz (Madrid), Spain, 2008; pp. 503–534. [Google Scholar]
  32. García López, J. Short description of the Navafría pine forest and its management history. In Mountain Silviculture; Montero, G., Elena Roselló, R., Eds.; Sistemas y Recursos Forestales: Madrid, Spain, 1994. [Google Scholar]
  33. Moreno-Fernández, D.; Cañellas, I.; Barbeito, I.; Sánchez-González, M.; Ledo, A. Alternative approaches to assessing the natural regeneration of Scots pine in a mediterranean forest. Ann. For. Sci. 2015, 72, 569–583. [Google Scholar] [CrossRef] [Green Version]
  34. Dale, M. Spatial Pattern Analysis in Plant Ecology; Cambridge University Press: Cambridge, UK, 1999. [Google Scholar]
  35. Fortin, M.-J.; Dale, M.R.T.; ver Hoef, J. Spatial analysis in ecology. In Encyclopedia of Environmetrics; El-Shaarawi, A., Piegorsch, W., Eds.; John Wiley & Sons, Ltd.: Chichester, UK, 2002; pp. 2051–2058. [Google Scholar]
  36. Goreaud, F.; Pélissier, R. On explicit formulas of edge effect correction for Ripley’s K -function. J. Veg. Sci. 1999, 10, 433–438. [Google Scholar] [CrossRef]
  37. Montes, F.; Barbeito, I.; Rubio, A.; Cañellas, I. Evaluating height structure in Scots pine forests using marked point processes. Can. J. For. Res. 2008, 38, 1924–1934. [Google Scholar] [CrossRef]
  38. Wood, S.N. Fast stable restricted maximum likelihood and marginal likelihood estimation of semiparametric generalized linear models. J. R. Stat. Soc. Ser. B Stat. Methodol. 2011, 73, 3–36. [Google Scholar] [CrossRef] [Green Version]
  39. Hastie, T.; Tibshirani, R. Generalized additive models. Stat. Sci. 1989, 10, 297–318. [Google Scholar] [CrossRef]
  40. Wood, S.N. Generalized Additive Models: An Introduction with R; Chapman and Hall/CRC: Chapman, CA, USA, 2017; ISBN 9781498728331. [Google Scholar]
  41. Venables, W.; Ripley, R. Modern Applied Statistics with S, 4th ed.; Springer: New York, NY, USA, 2002. [Google Scholar]
  42. Augustin, N.H.; Musio, M.; von Wilpert, K.; Kublin, E.; Wood, S.N.; Schumacher, M. Modeling spatiotemporal forest health monitoring data. J. Am. Stat. Assoc. 2009, 104, 899–911. [Google Scholar] [CrossRef] [Green Version]
  43. Ribeiro, P.J.; Diggle, P.J. GeoR: Analysis of Geostatistical Data. 2016. Available online: http://www.leg.ufpr.br/geoR (accessed on 23 September 2019).
  44. R Core Team. R: A Language and Environment for Statistical Computing 2019; R Core Team: Vienna, Austria, 2019. [Google Scholar]
  45. Pardos, M.; Montes, F.; Cañellas, I. Spatial dynamics of natural regeneration in two differently managed pinus sylvestris stands before and after silvicultural intervention using replicated spatial point patterns. For. Sci. 2008, 54, 260–272. [Google Scholar]
  46. Beghin, R.; Lingua, E.; Garbarino, M.; Lonati, M.; Bovio, G.; Motta, R.; Marzano, R. Pinus sylvestris forest regeneration under different post-fire restoration practices in the northwestern Italian Alps. Ecol. Eng. 2010, 36, 1365–1372. [Google Scholar] [CrossRef]
  47. Carrer, M.; Soraruf, L.; Lingua, E. Convergent space-time tree regeneration patterns along an elevation gradient at high altitude in the Alps. For. Ecol. Manag. 2013, 304, 1–9. [Google Scholar] [CrossRef]
  48. Malone, S.L.; Fornwalt, P.J.; Battaglia, M.A.; Chambers, M.E.; Iniguez, J.M.; Sieg, C.H. Mixed-severity fire fosters heterogeneous spatial patterns of conifer regeneration in a dry conifer forest. Forests 2018, 9, 45. [Google Scholar] [CrossRef] [Green Version]
  49. Augustin, N.H.; Trenkel, V.M.; Wood, S.N.; Lorance, P. Space-time modelling of blue ling for fisheries stock management. Environmetrics 2013, 24, 109–119. [Google Scholar] [CrossRef] [Green Version]
  50. Eickenscheidt, N.; Augustin, N.H.; Wellbrock, N. Spatio-temporal modelling of forest monitoring data: Modelling German tree defoliation data collected between 1989 and 2015 for trend estimation and survey grid examination using GAMMs. IForest Biogeosciences For. 2019, 12, 338. [Google Scholar] [CrossRef]
  51. Augustin, N.H.; Mattocks, C.; Faraway, J.J.; Greven, S.; Ness, A.R. Modelling a response as a function of high-frequency count data: The association between physical activity and fat mass. Stat. Methods Med. Res. 2015, 26, 2210–2226. [Google Scholar] [CrossRef] [PubMed] [Green Version]
  52. Montoro Girona, M.; Morin, H.; Lussier, J.-M.; Walsh, D. Radial growth response of black spruce stands ten years after experimental shelterwoods and seed-tree cuttings in boreal forest. Forests 2016, 7, 240. [Google Scholar] [CrossRef] [Green Version]
Figure 1. Location of adult trees (dbh≥10cm; green circumferences proportional to tree diameter) in the half-hectare plot, and the number of saplings per 2 × 2 m quadrat (yellow: 0–5 saplings; orange: 6–10 saplings; brown: 11–15 saplings; red: 16–20 saplings; purple: >21 saplings).
Forests 11 00120 g001
Figure 2. Variance-block length graph for the four-term local quadrat variance (4TLQV) and the nine-term local quadrat variance (9TLQV) for saplings (stems with height ≥ 1.30 m and dbh < 10 cm).
Forests 11 00120 g002
Figure 3. L(d) function (continuous line) for the pattern of the adult trees (stems with dbh ≥ 10 cm) and the 95% quantile bounds corresponding to the null model. Values of L(d) below the 95% quantile bounds indicate the spatial regularity of adult trees and values of L(d) above the 95% quantile bounds indicate clustering of adult trees.
Forests 11 00120 g003
Figure 4. Intertype Krx(d) function (continuous lines) between adult trees (stems with dbh ≥ 10 cm) and sapling density (stems with height ≥ 1.30 m and dbh < 10 cm) and the 95% quantile bounds corresponding to the null models (A: antecedent null model, B: toroidal shift null model). Positive values of the intertype function indicate a positive influence between sapling density and adult trees and negative values of the intertype function suggests the negative influence of adult trees on sapling density.
Forests 11 00120 g004
Figure 5. Intertype mark correlation K ^ m m r s ( d ) function (continuous line) between the diameter at breast height of the adult trees (stems with dbh ≥ 10 cm) and the sapling density (stems with height ≥ 1.30 m and dbh < 10 cm) and the 95% quantile bounds corresponding to the null model.
Forests 11 00120 g005
Figure 6. Intertype mark variance L ^ v r s ( d ) function (continuous line) between the diameter at breast height of the adult trees (stems with dbh ≥ 10 cm) and the sapling density (stems with height ≥ 1.30 m and dbh < 10 cm) and the 95% quantile bounds corresponding to the toroidal shift null model (red bounds) and to the toroidal shift null model using the moving window approach (purple bounds).
Forests 11 00120 g006
Figure 7. Estimated smooth coefficient function (continuous lines) of the diameter at breast height of adult trees over the distance between adult trees (stems with dbh ≥ 10 cm) and saplings (stems with height ≥ 1.30 m and dbh < 10 cm) and 95% confidence intervals (shaded area). Negative values of the function indicate the negative influence of the diameter at breast height of adult trees on the number of saplings.
Forests 11 00120 g007
Table 1. Number of stems per hectare (N), mean diameter (D), basal area (G) and mean height (H) of the adult trees and the saplings (subindices mt and s, respectively) during the four inventories.
Feature2001200620102014
Adult trees (stems with dbh ≥ 10 cm)
Nmt (trees ha−1)306108102100
Dmt (cm)42.5 (6.7)44.1 (6.1)45.6 (6.1)46.2 (6.4)
Gmt (m2 ha−1)44.216.816.917.1
Hmt (m)22.1 (2.0)21.6 (2.0)22.2 (1.9)22.7 (2.1)
Saplings (stems with height ≥ 1.30 m and dbh < 10 cm)
Ns (saplings ha−1)0004684
Ds (cm)0000.8 (0.3)
Gs (m2 ha−1)0000.3
Hs (m)0001.5 (0.2)
Table 2. Summary of the variable selection process according to Akaike’s Information Criterion (AIC) and the percentage of deviance explained.
Variables Included in the Model during the Selection ProcessAICPercentage of Deviance Explained (%)
α3327.30
α + i = 1 N ( f 1 ( D i j ) d b h i A r e a I n 30 j ) 3294.95.8
α + i = 1 N ( f 1 ( D i j ) d b h i A r e a I n 30 j ) + f 2 ( X j , Y j ) 3013.047.4
In bold, the selected model.

