Article

The Effect of Tree Crown Allometry on Community Dynamics in Mixed-Species Stands versus Monocultures. A Review and Perspectives for Modeling and Silvicultural Regulation

Centre of Life and Food Sciences Weihenstephan, Technical University of Munich, Hans-Carl-von-Carlowitz-Platz 2, 85354 Freising, Germany
Forests 2019, 10(9), 810; https://doi.org/10.3390/f10090810
Submission received: 14 August 2019 / Revised: 10 September 2019 / Accepted: 11 September 2019 / Published: 17 September 2019
(This article belongs to the Special Issue Modelling Mixing Effects in Forest Stands)

Abstract

:
Many recent studies have shown that the structure, density, and productivity of mixed-species stands can differ from the weighted mean of monospecific stands of the respective species. The tree and stand properties emerging by inter-specific neighborhood should be considered in models for understanding and practical management. A promising approach for this is a more realistic representation of the individual tree allometry in models and management concepts, as tree allometry determines many structural and functional aspects at the tree and stand level. Therefore, this paper is focused on the crown allometry in mixed and mono-specific stands. Firstly, we review species-specific differences in the crown allometry in monospecific stands. Secondly, we show how species-specific differences and complementarities in crown allometry can emerge in mixed-species stands. Thirdly, the consequences of allometric complementarity for the canopy packing density will be analyzed. Fourthly, we trace the crown allometry from the tree level to the stand density and show the relevance for the self-thinning in mixed versus monospecific stands. Fifth, the consequence of the findings for modeling and regulating tree and stand growth will be discussed. The review deals mainly with widespread even-aged, mono-layered stands, but the main results apply for more heterogeneous stands analogously.

1. Introduction

The Relevance of Crown Size for Tree Growth and Stand Dynamics

The structure and the size of tree crowns are highly relevant for a tree’s fitness. They determine the tree’s access to resources, the availability and occupation of space, the size growth, and also the seed production and dispersal. In fully stocked stands, crown size growth causes competition for space and leads to social differentiation, growth reduction of suppressed trees, mortality and self-thinning [1]. The structure and the size of the crown are also practically and economically relevant. Wide crowns mean high mechanical stability [2], due to low slenderness (h/d ratios), but low wood quality, due to the number and thickness of branches [3]. Expansive crown growth of oak Quercus trees, e.g., may accelerate tree number reduction and standing stock, whereas slim crowns of spruce Picea or fir Abies may increase the canopy density, stand density, and standing stock. In this way, the individual tree crown allometry determines the structure and dynamics at the stand level [4].
Many recent studies showed that in mixed-species stands trees can have wider and longer crowns [5,6,7], higher mechanical stability [8], but also inferior wood quality [3]. In mono-specific stands, wider crowns are associated with more rigorous self-thinning and lower tree numbers per unit area [9]. However, in mixed stands, the wider crown can be coupled with higher stand density. Empirical studies showed higher crown packing for mixed stands compared with monocultures [10], and simulation studies substantiated such findings [11]. In this review paper, we try to solve this apparent contradiction between larger crowns but reduced self-thinning and increased density in mixed-species stands compared with monocultures. The review is mainly based on tree species from Central Europe, but the methods used and the principles revealed can be applied for other species in monocultures and mixed-species stands analogously.
In this article
(i.)
We first review the crown allometry of primary tree species in mono-specific forest stands.
(ii.)
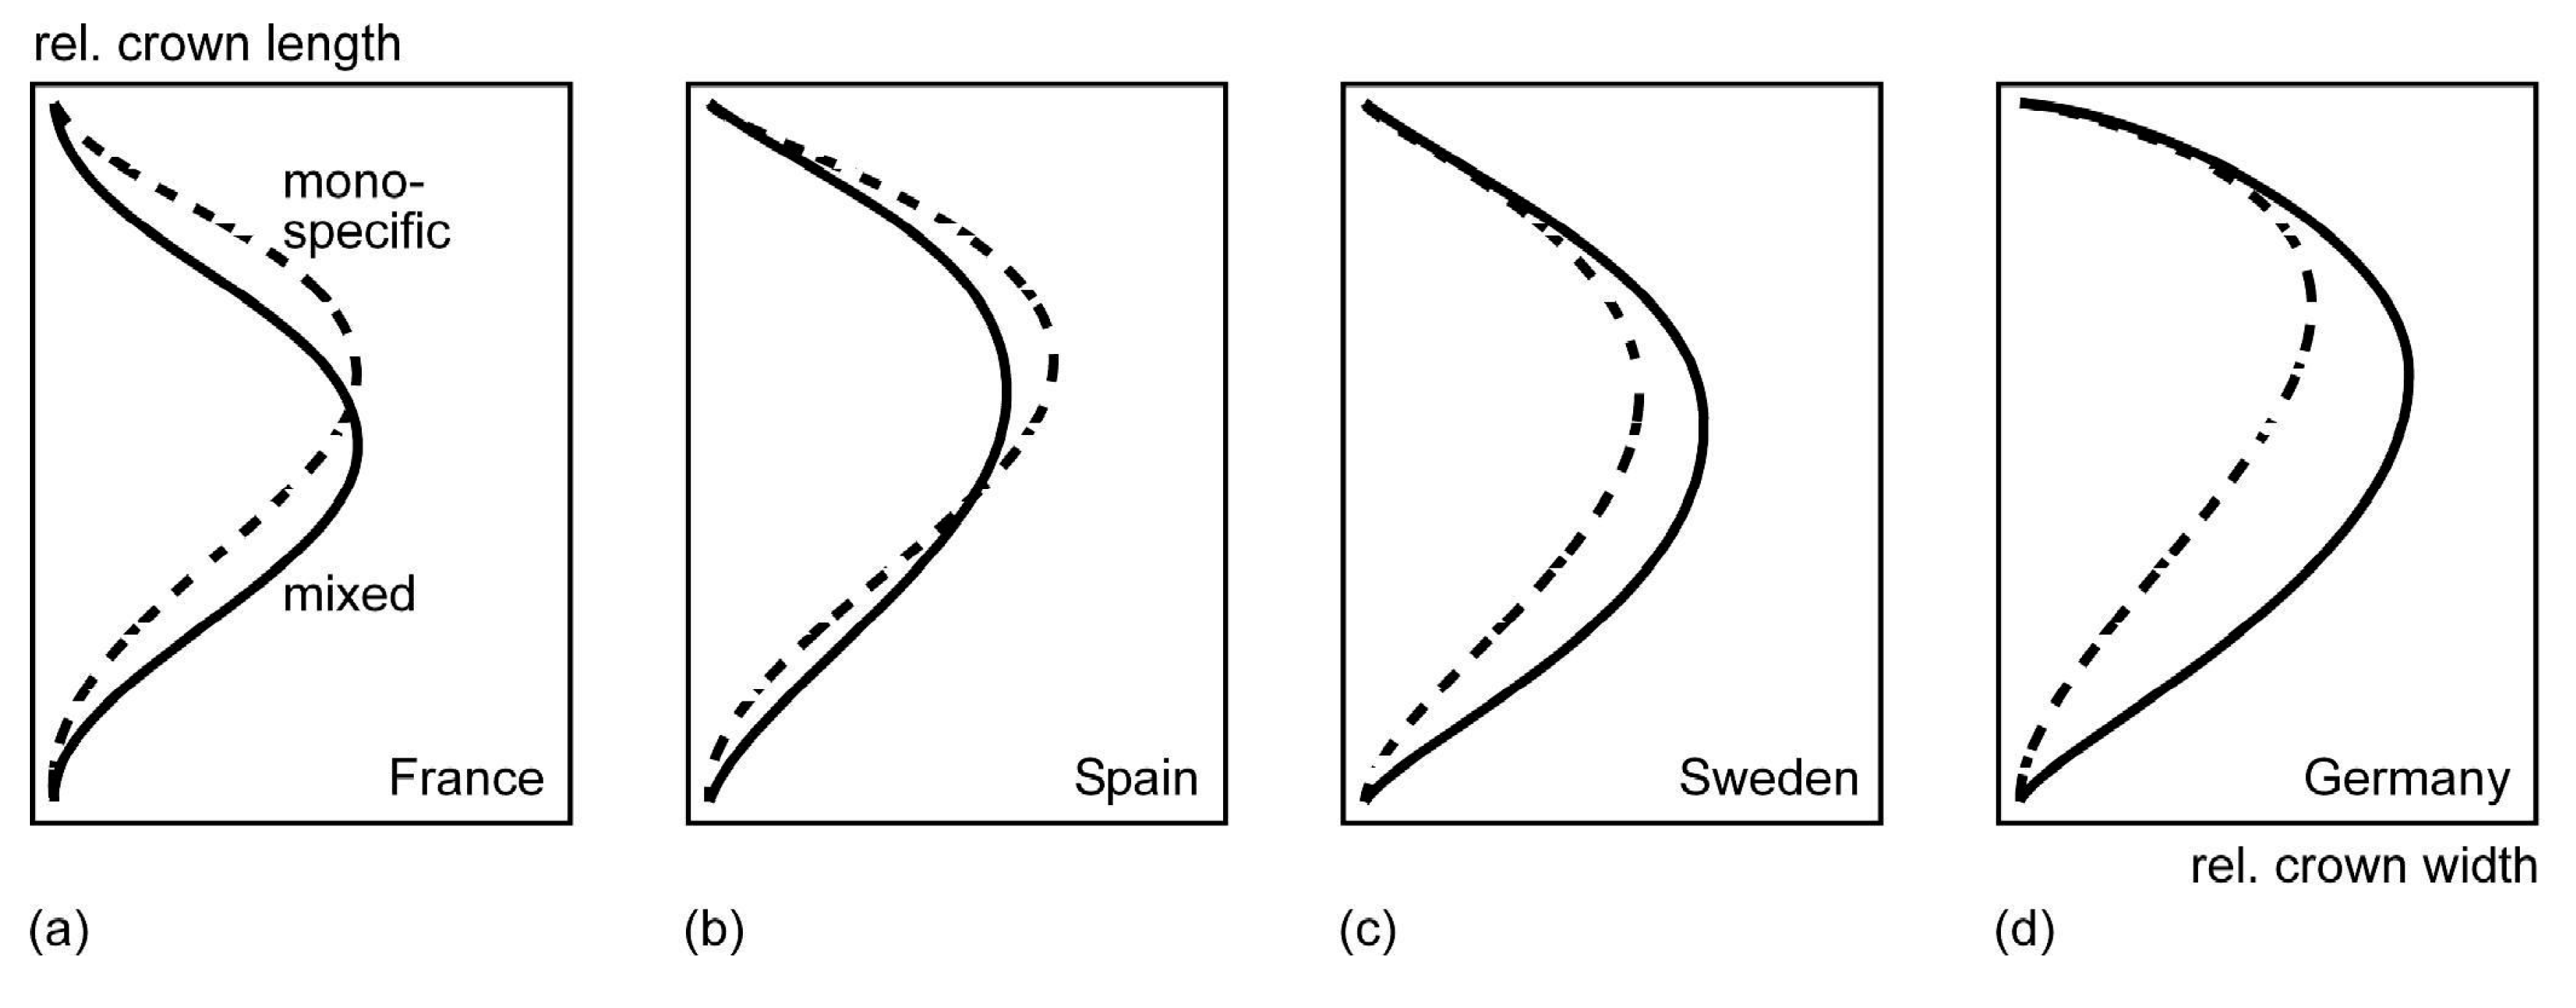
Second, we show how tree species mixing can modify the individual tree allometry.
(iii.)
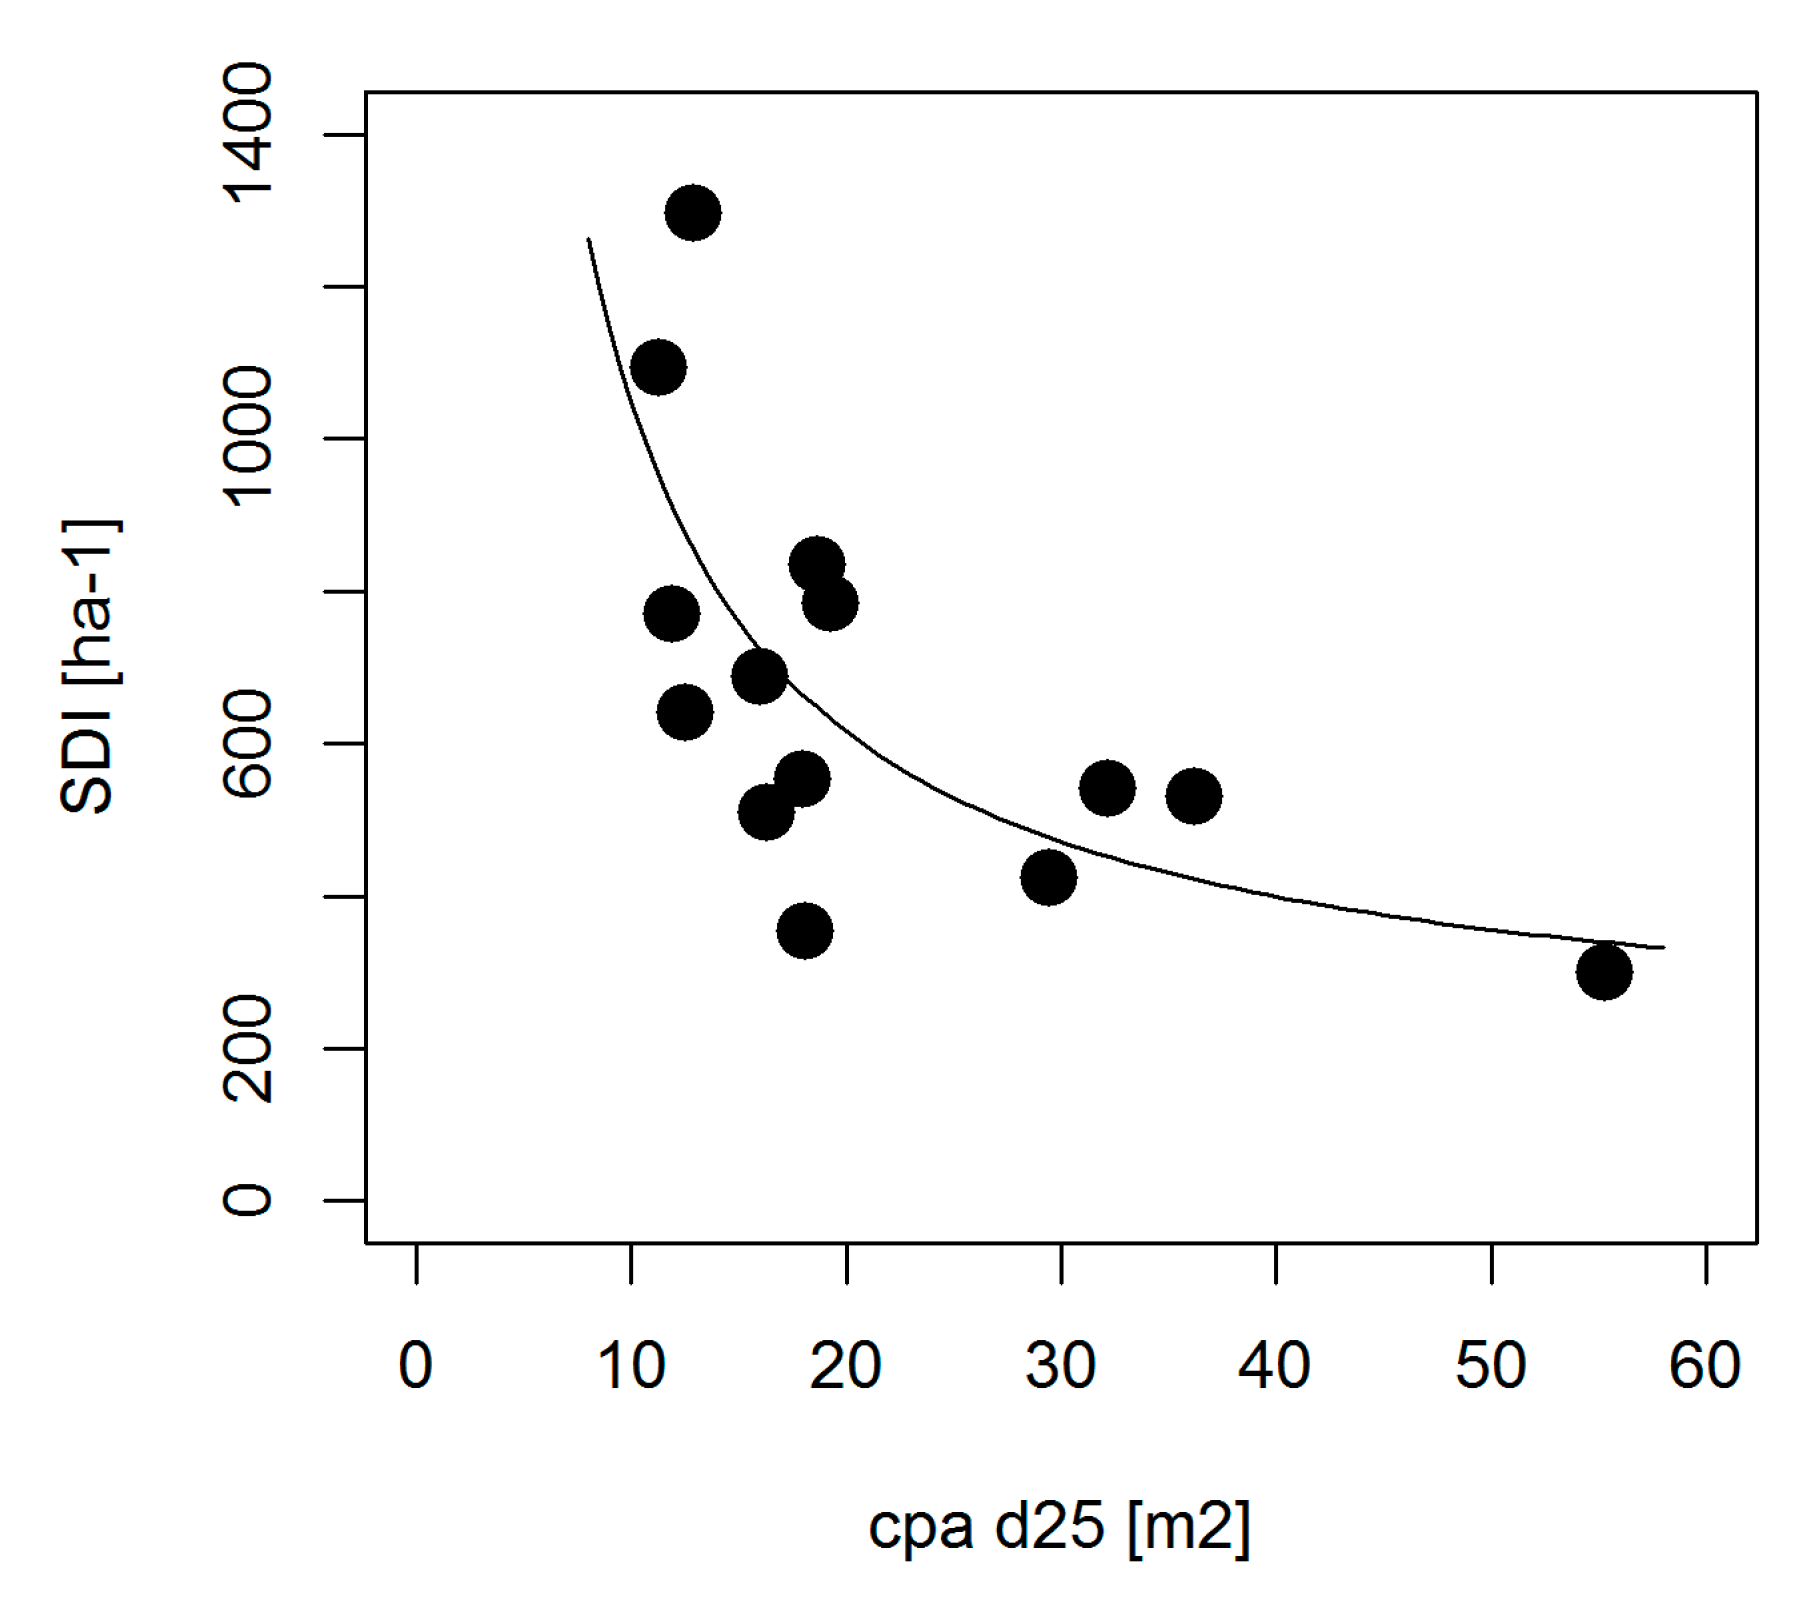
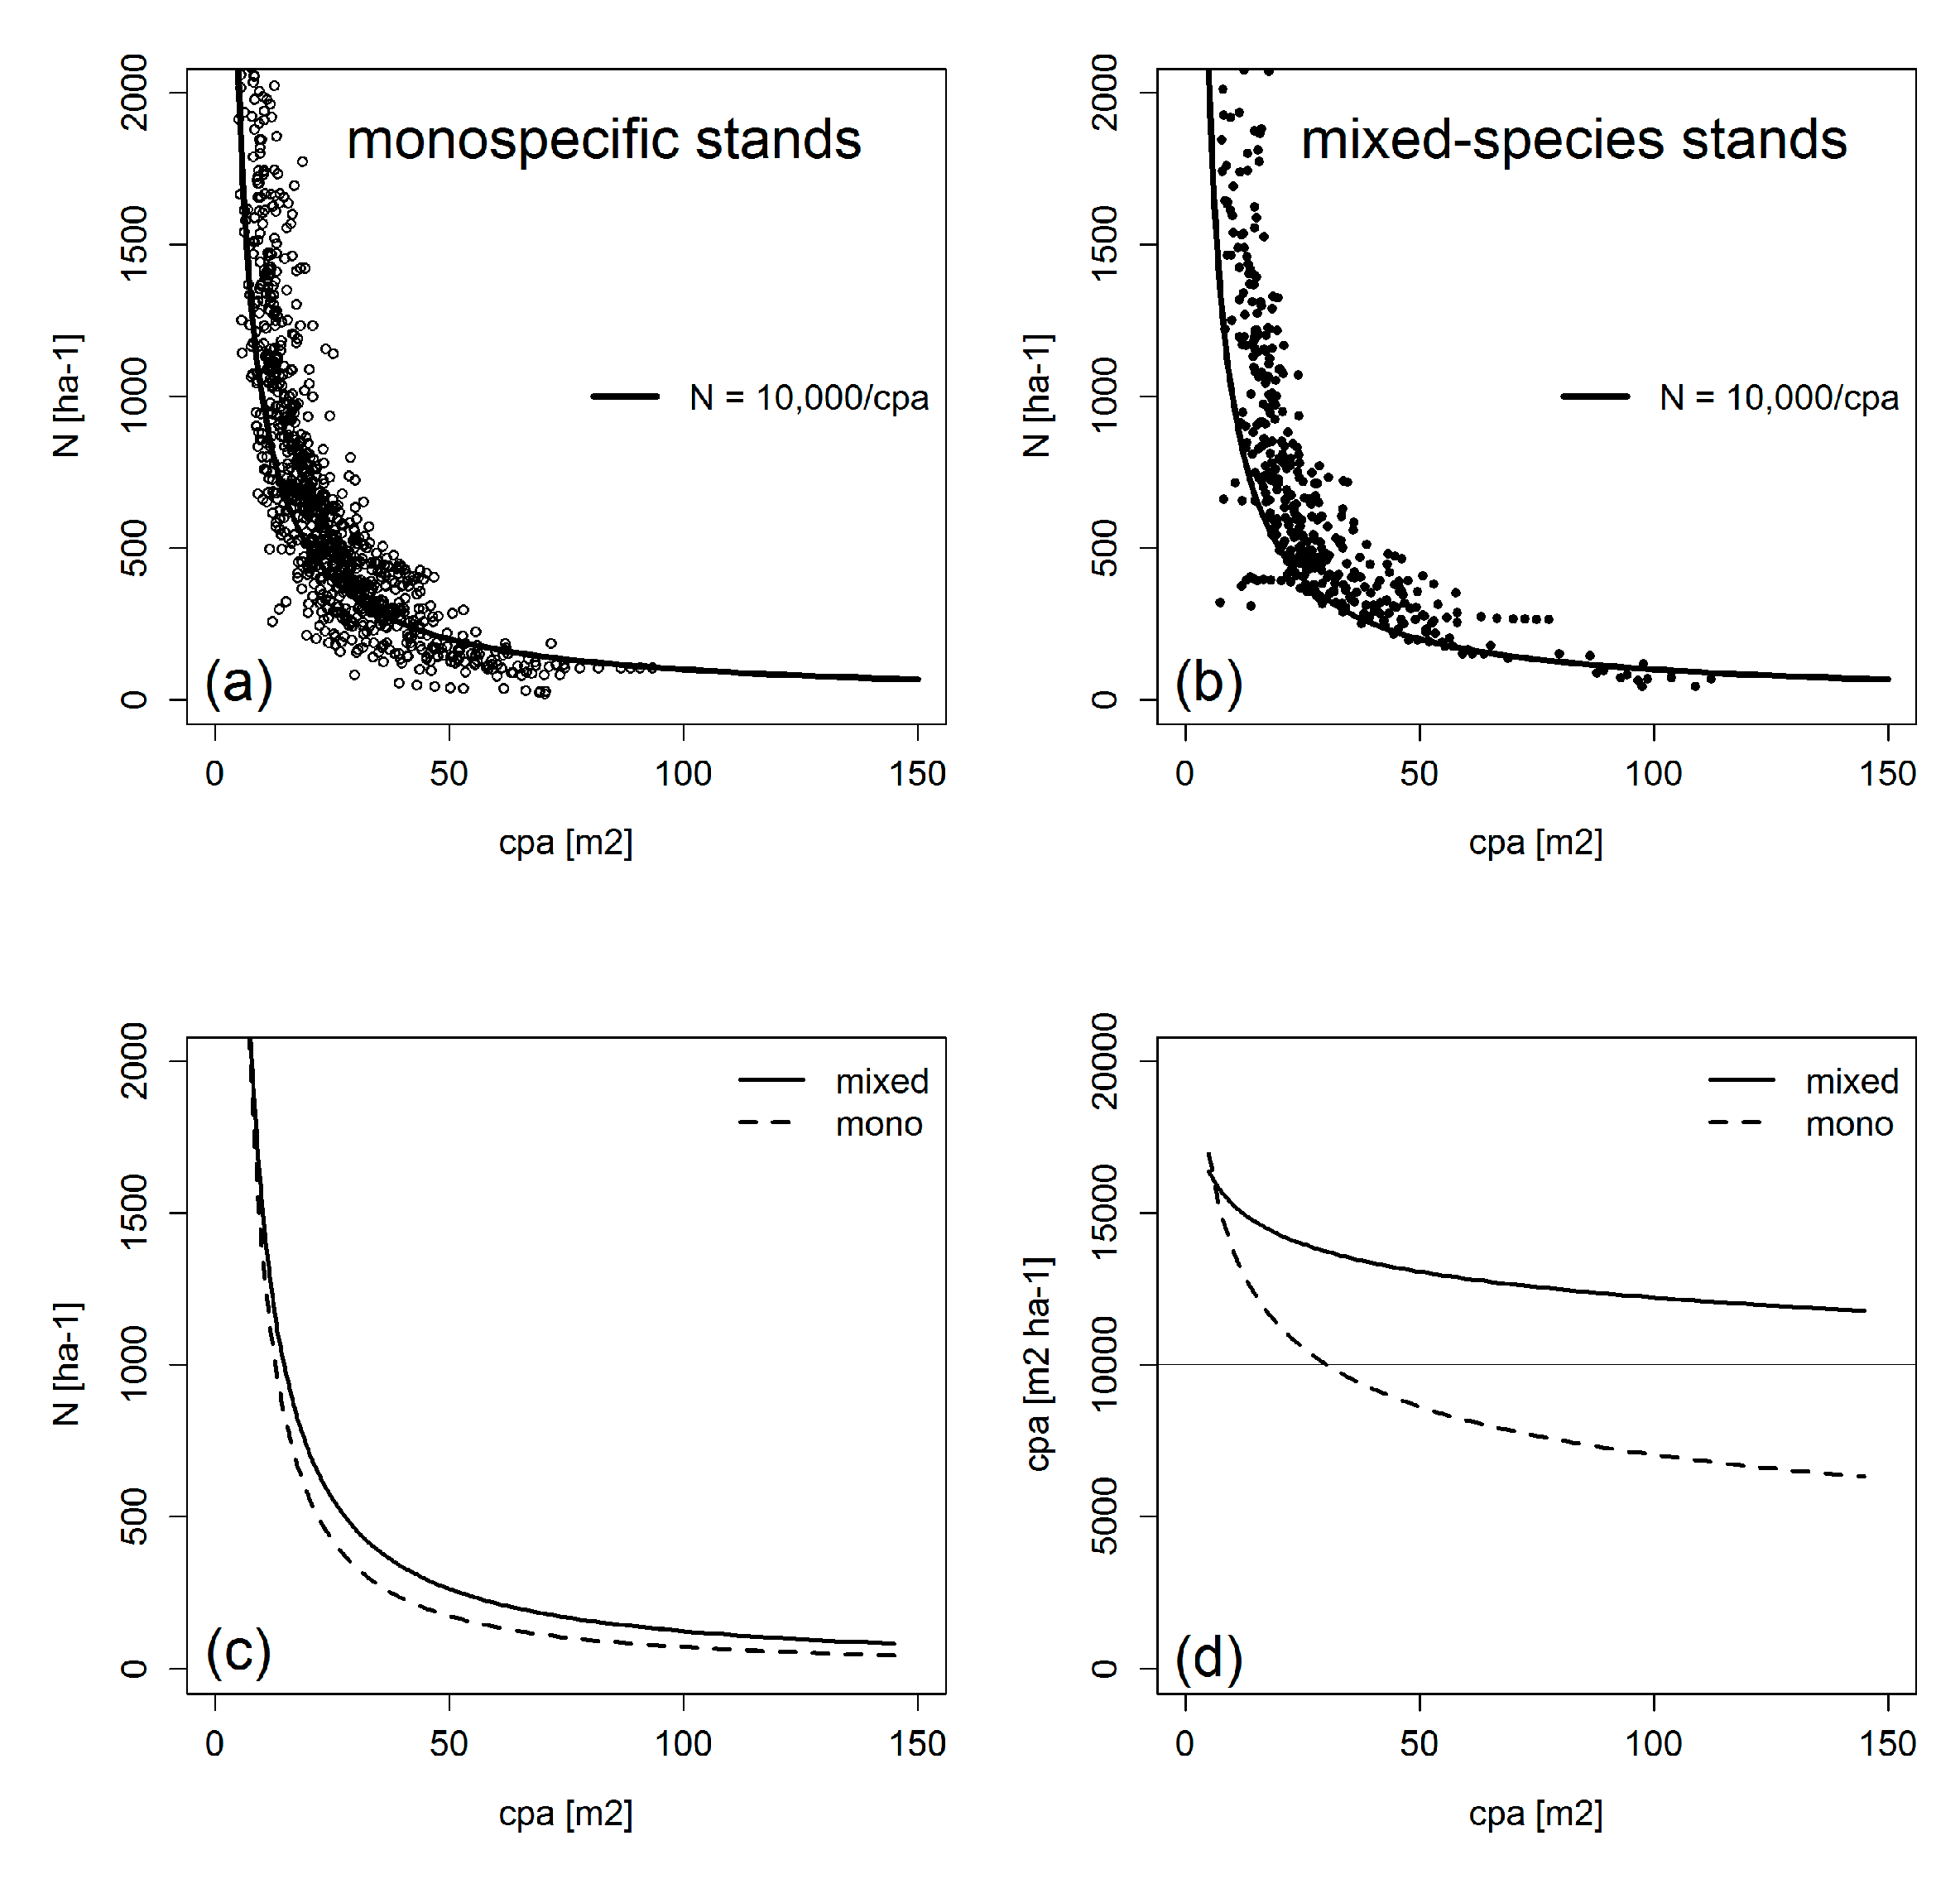
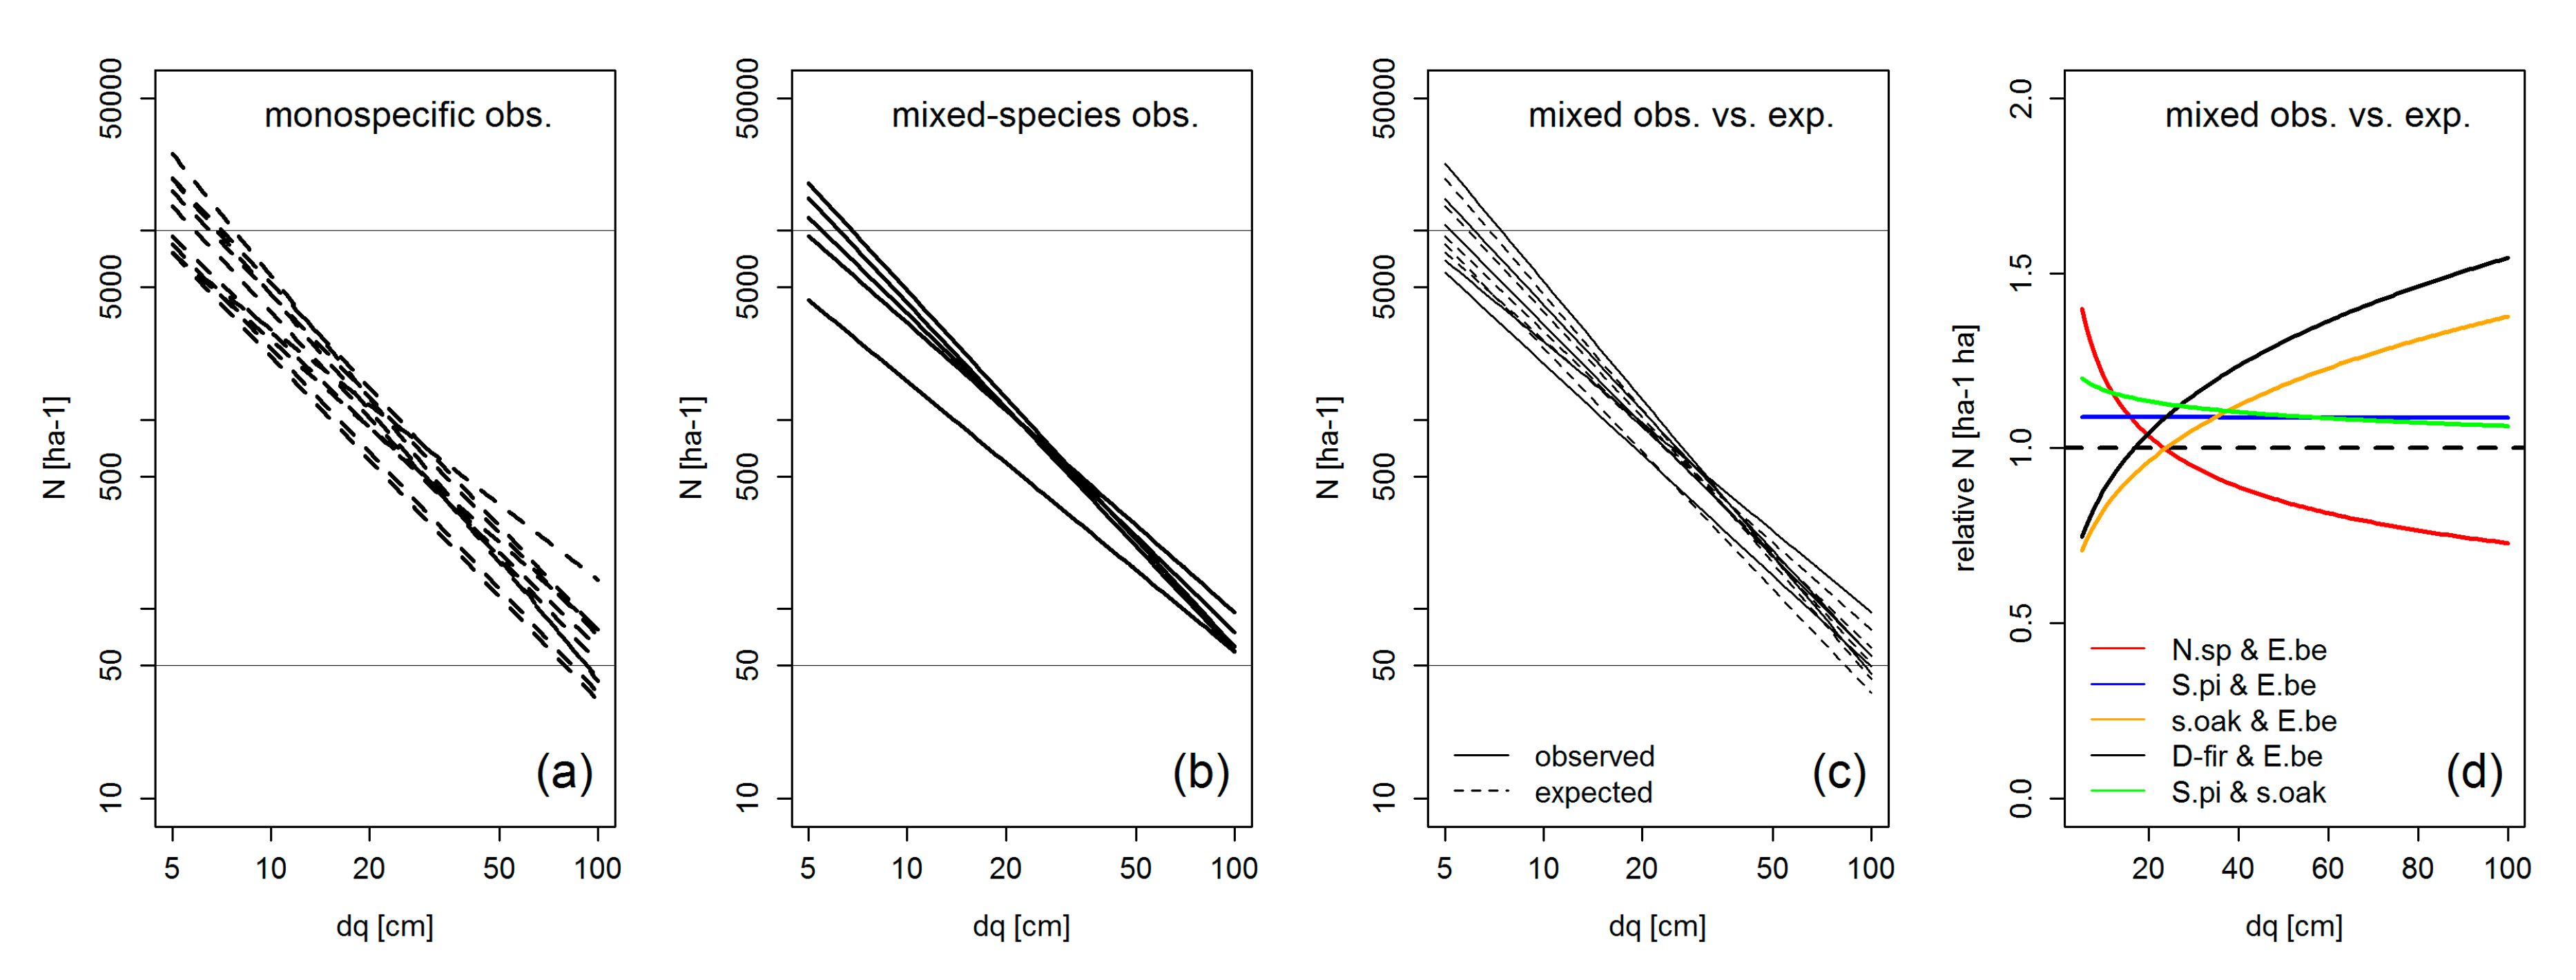
Third, we show how the individual tree crown allometry translates to species-specific stand density and self-thinning at the stand level in mixed-species stands compared with monocultures.
(iv.)
Fourth, we use equivalence coefficients for revelation and quantification species specific differences in density and growing space requirement and for converting them into a common currency.
(v.)
Fifth, we show how the species-specific crown allometry should be considered when regulating the density and mixing proportions in forest stands.
As mixed-species forests are on the advance, forest science should provide forest practice with appropriate methods for the establishment and regulation of mixed-species stands. Unfortunately, most of the existing knowledge of tree structure and dynamics is based on monospecific stands, where all individuals show a similar behavior to compete for the growing space and resources. Mixed-species stands fundamentally differ from this. In mixed-species stands, trees exhibit their full inter- and intra-specific structural variability and plasticity. Their traits have probably been developed by co-evolution in natural mixed-species stands, but have become less visible and important in artificial monocultures. As shown in this paper, the tree allometry in mixed-species stands can differ considerably from monospecific stands. The strong effects of crown allometry on the stand dynamics and stand density shown in this review underlines the relevance of crown allometry for a better understanding, modeling, and silvicultural regulation of mixed-species stands.

2. Materials and Methods

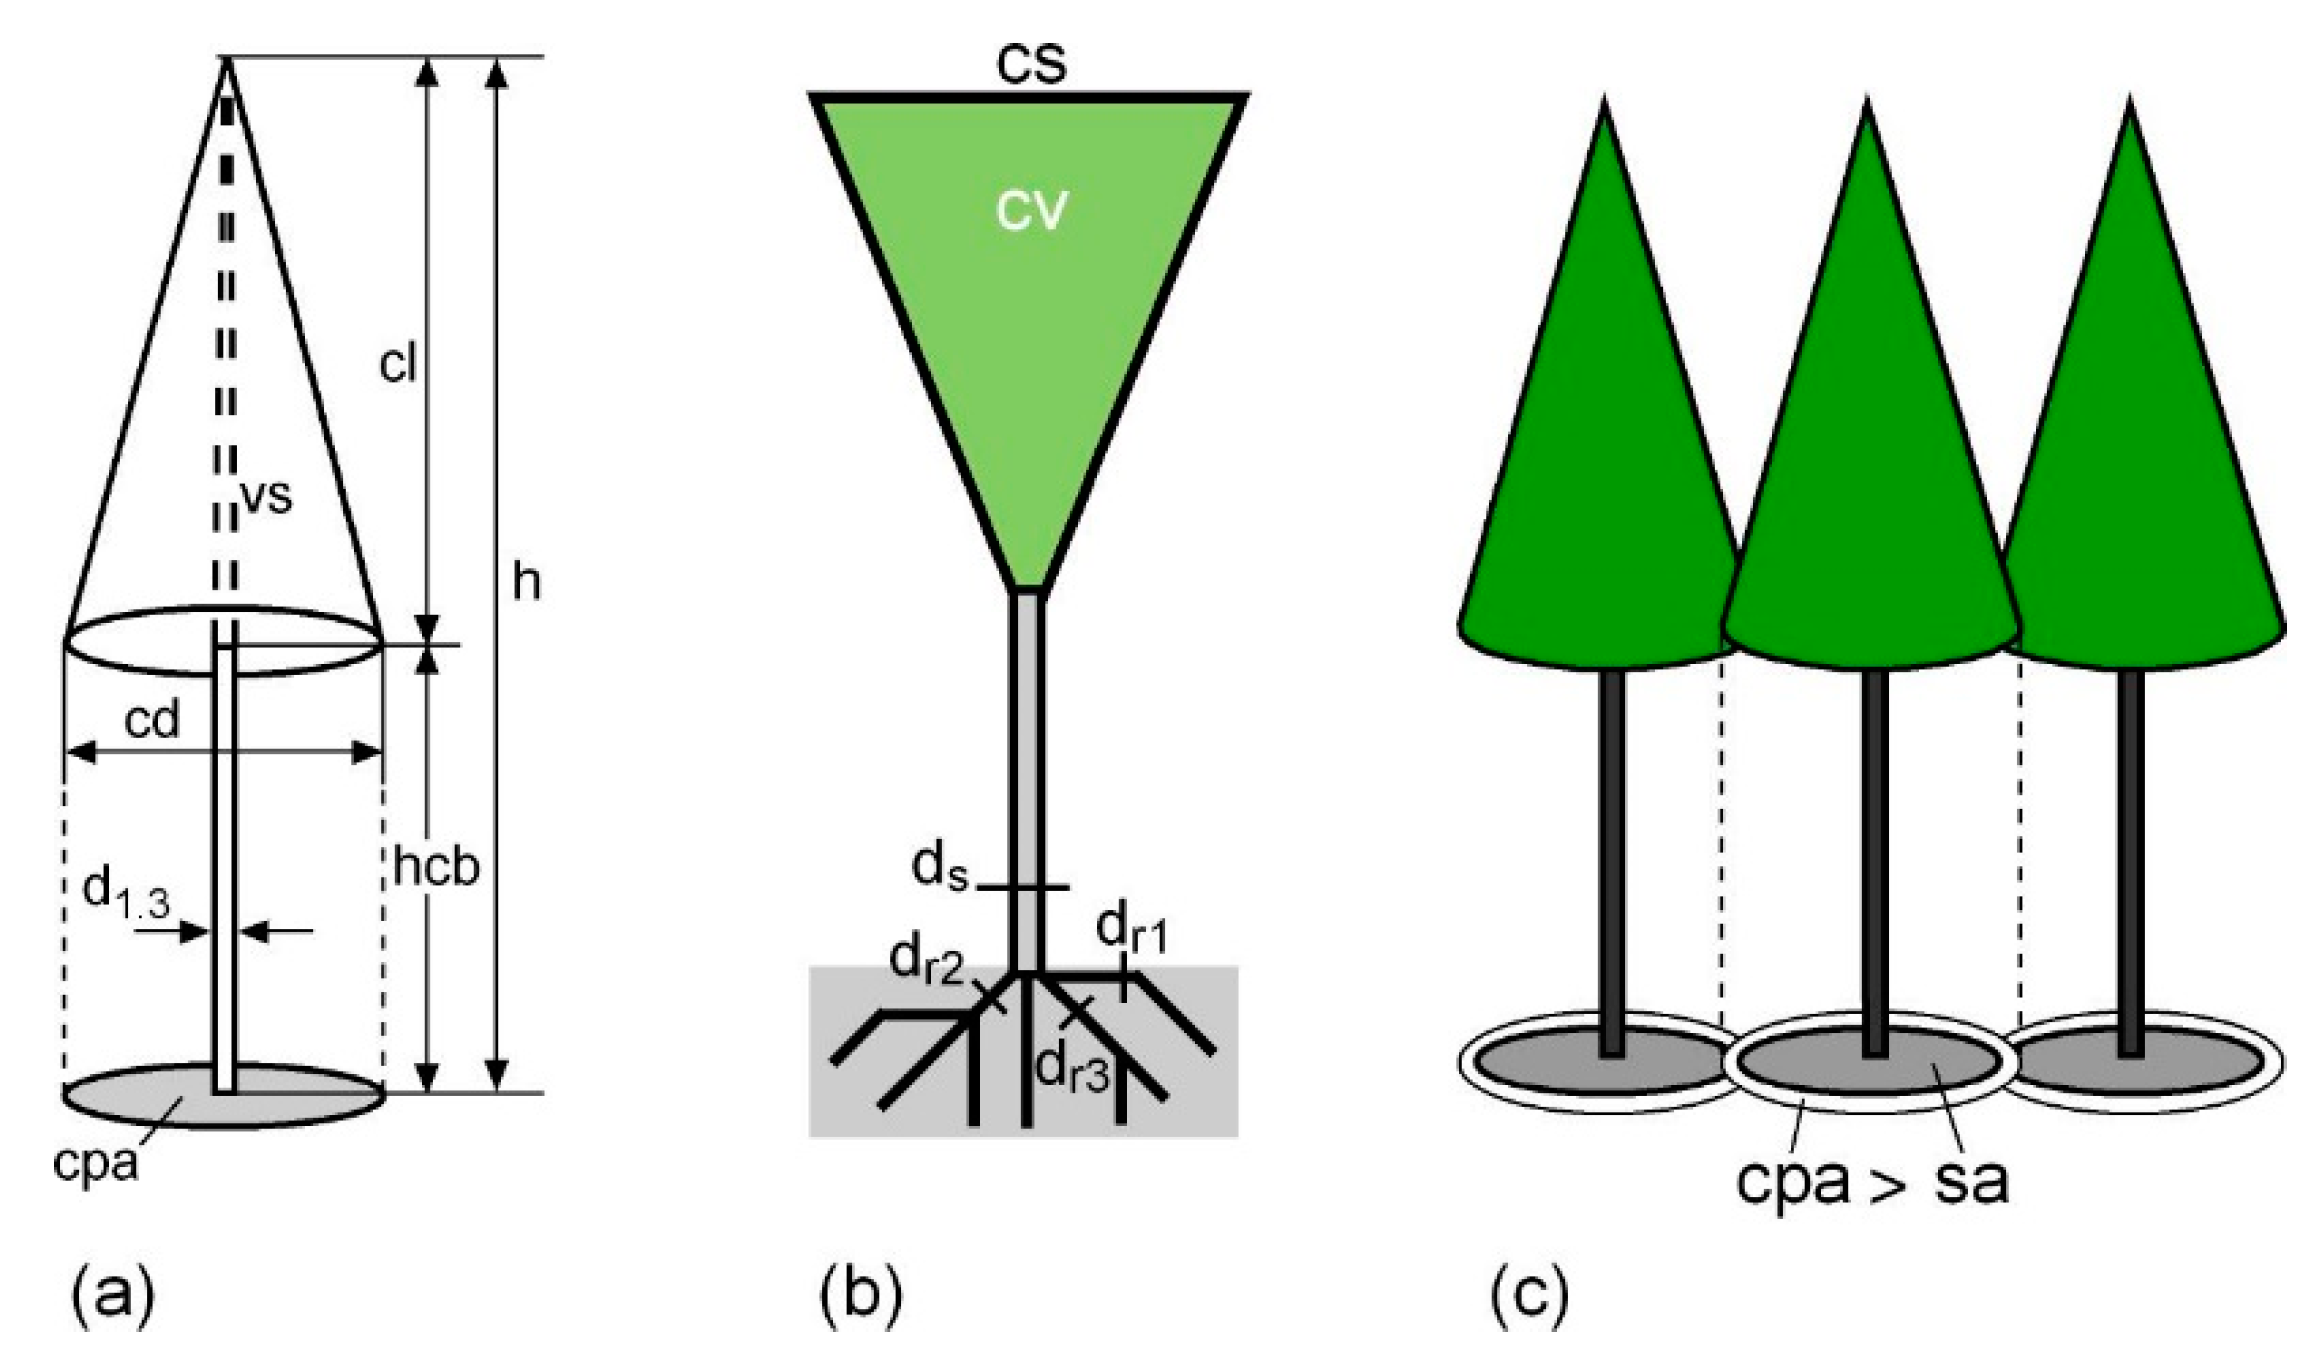
2.1. Dendrometrical Characteristics of Tree Crowns

The dendrometric description and analysis of tree structure, growth, and growth efficiency per growing area are mainly based on the tree variables shown in Figure 1. To compare the tree shape of different groups (e.g., mixed versus monospecific stands, thinned versus unthinned stands), the following tree allometries are frequently used. Of primary interest are the allometric relationships between tree height and stem diameter, h d ; between the crown projection area and the stem diameter, cpa d ; and between the height to crown base or crown length and the tree height, hcb h and cl h .
The relationships between dendrometric variables such as h, d, and cpa change nonlinearly with increasing size. Therefore, any ratios (e.g., h/d or cd/d) between them also underlie a sized-dependent allometric drift. If groups differ in these ratios, this could be simply an effect of size differences [12]. Differences in the allometric relationship y   =   a   ×   x α y , x x between groups, in contrast, indicate a real difference in shape or shape development. Accordingly, the commonly used ratio h/d (ratio of h (m) and stem diameter at breast height (cm)) as indicator for mechanical tree stability is less informative than the corresponding allometric relationships. The same applies for cd/d (ratio of crown diameter (m) and stem diameter (cm)) as indicators for crown extension.

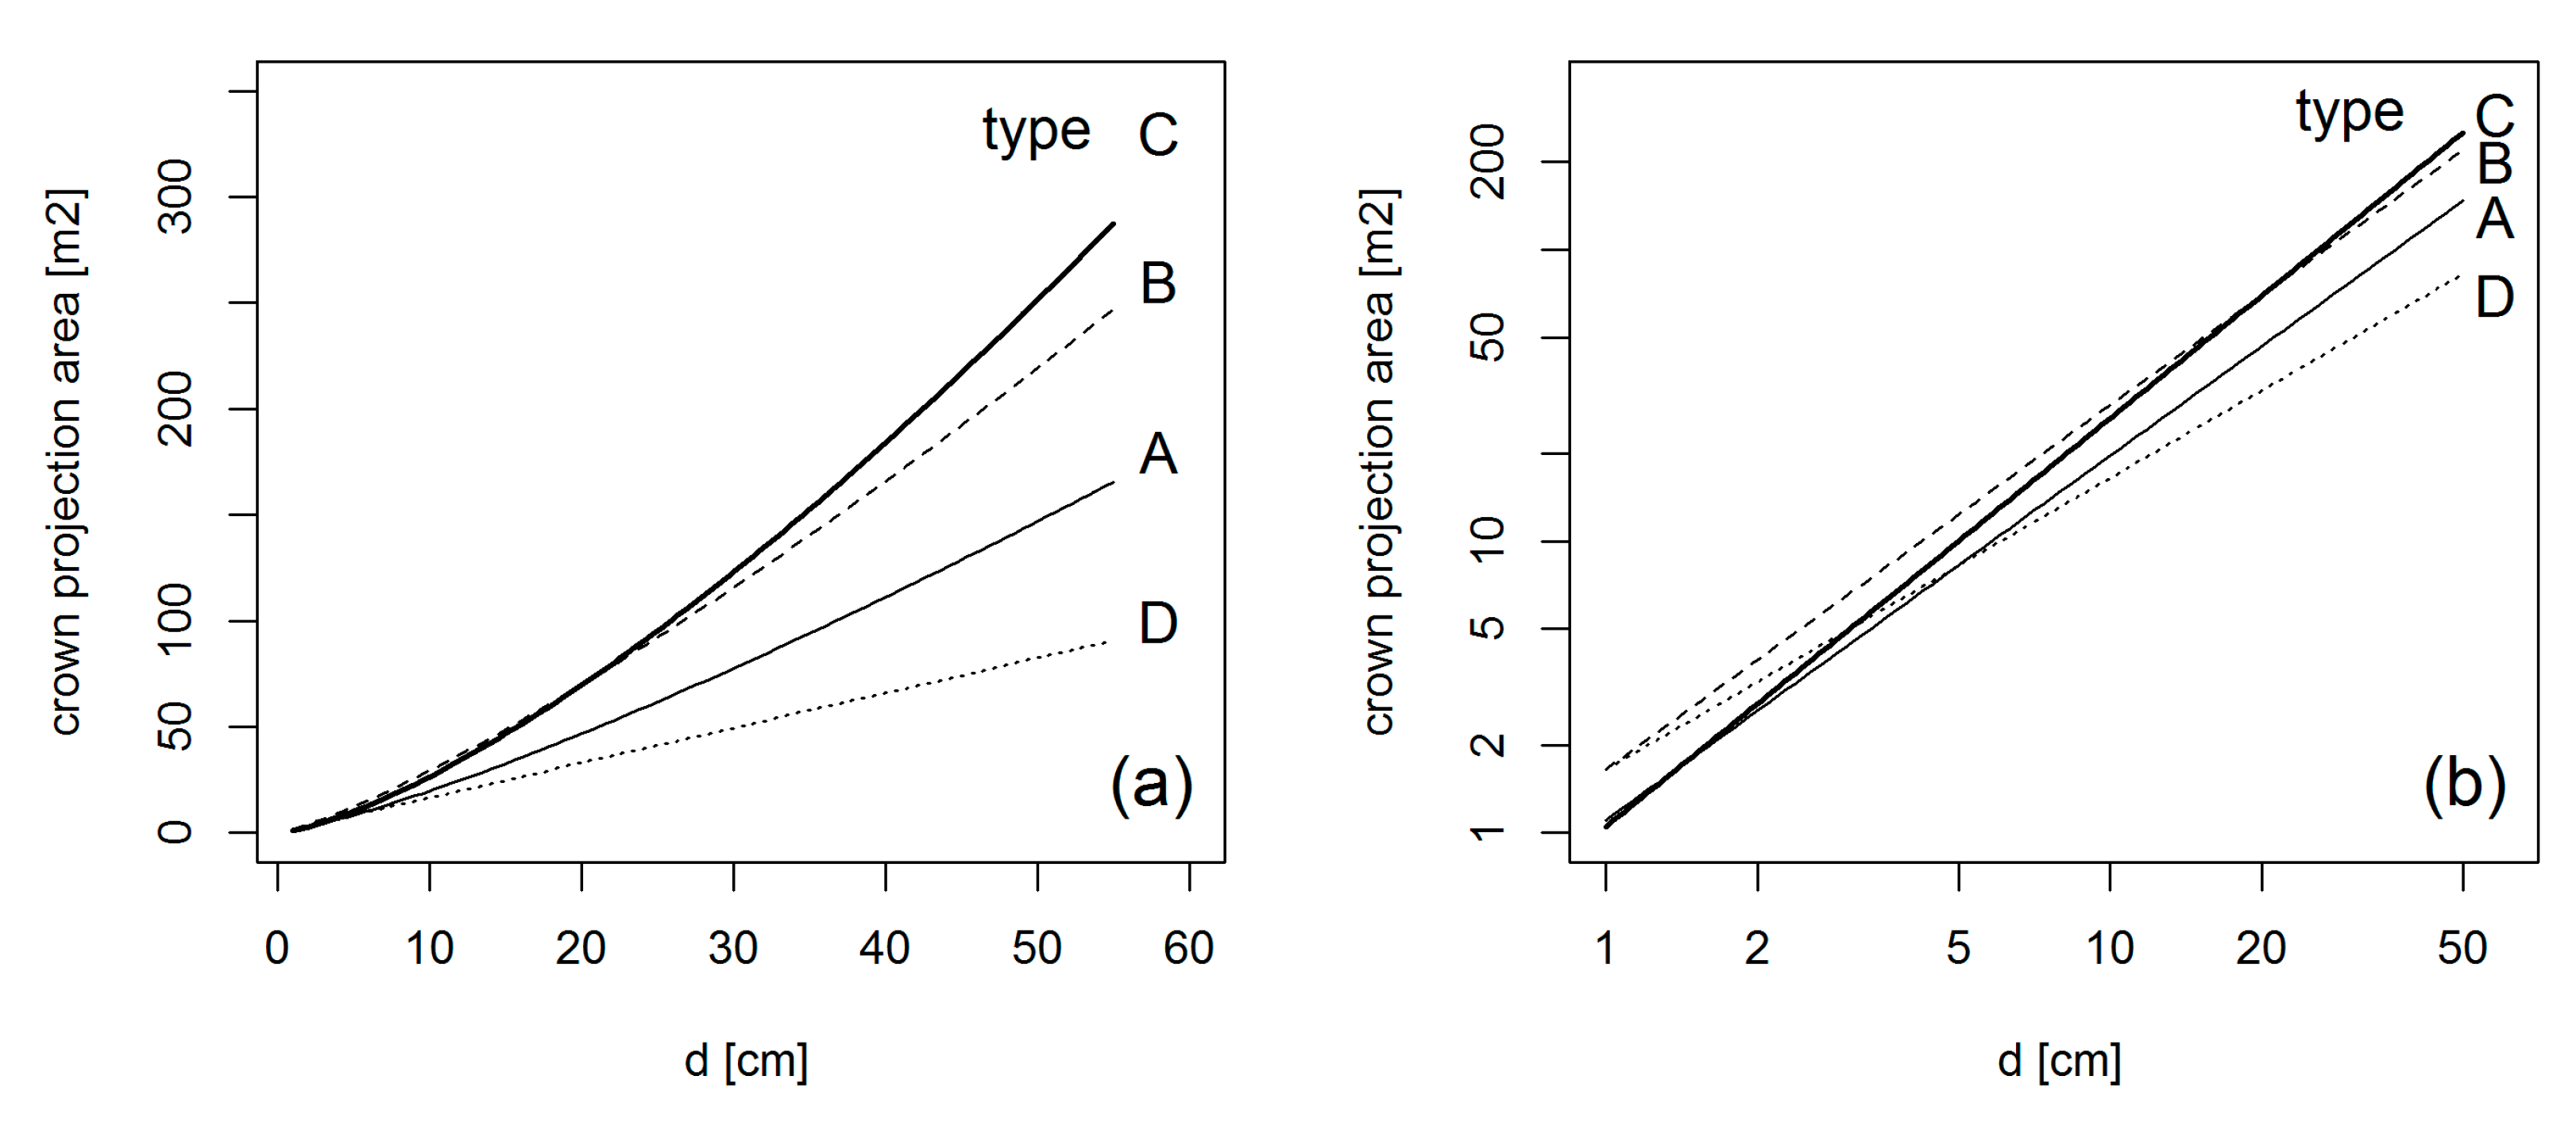
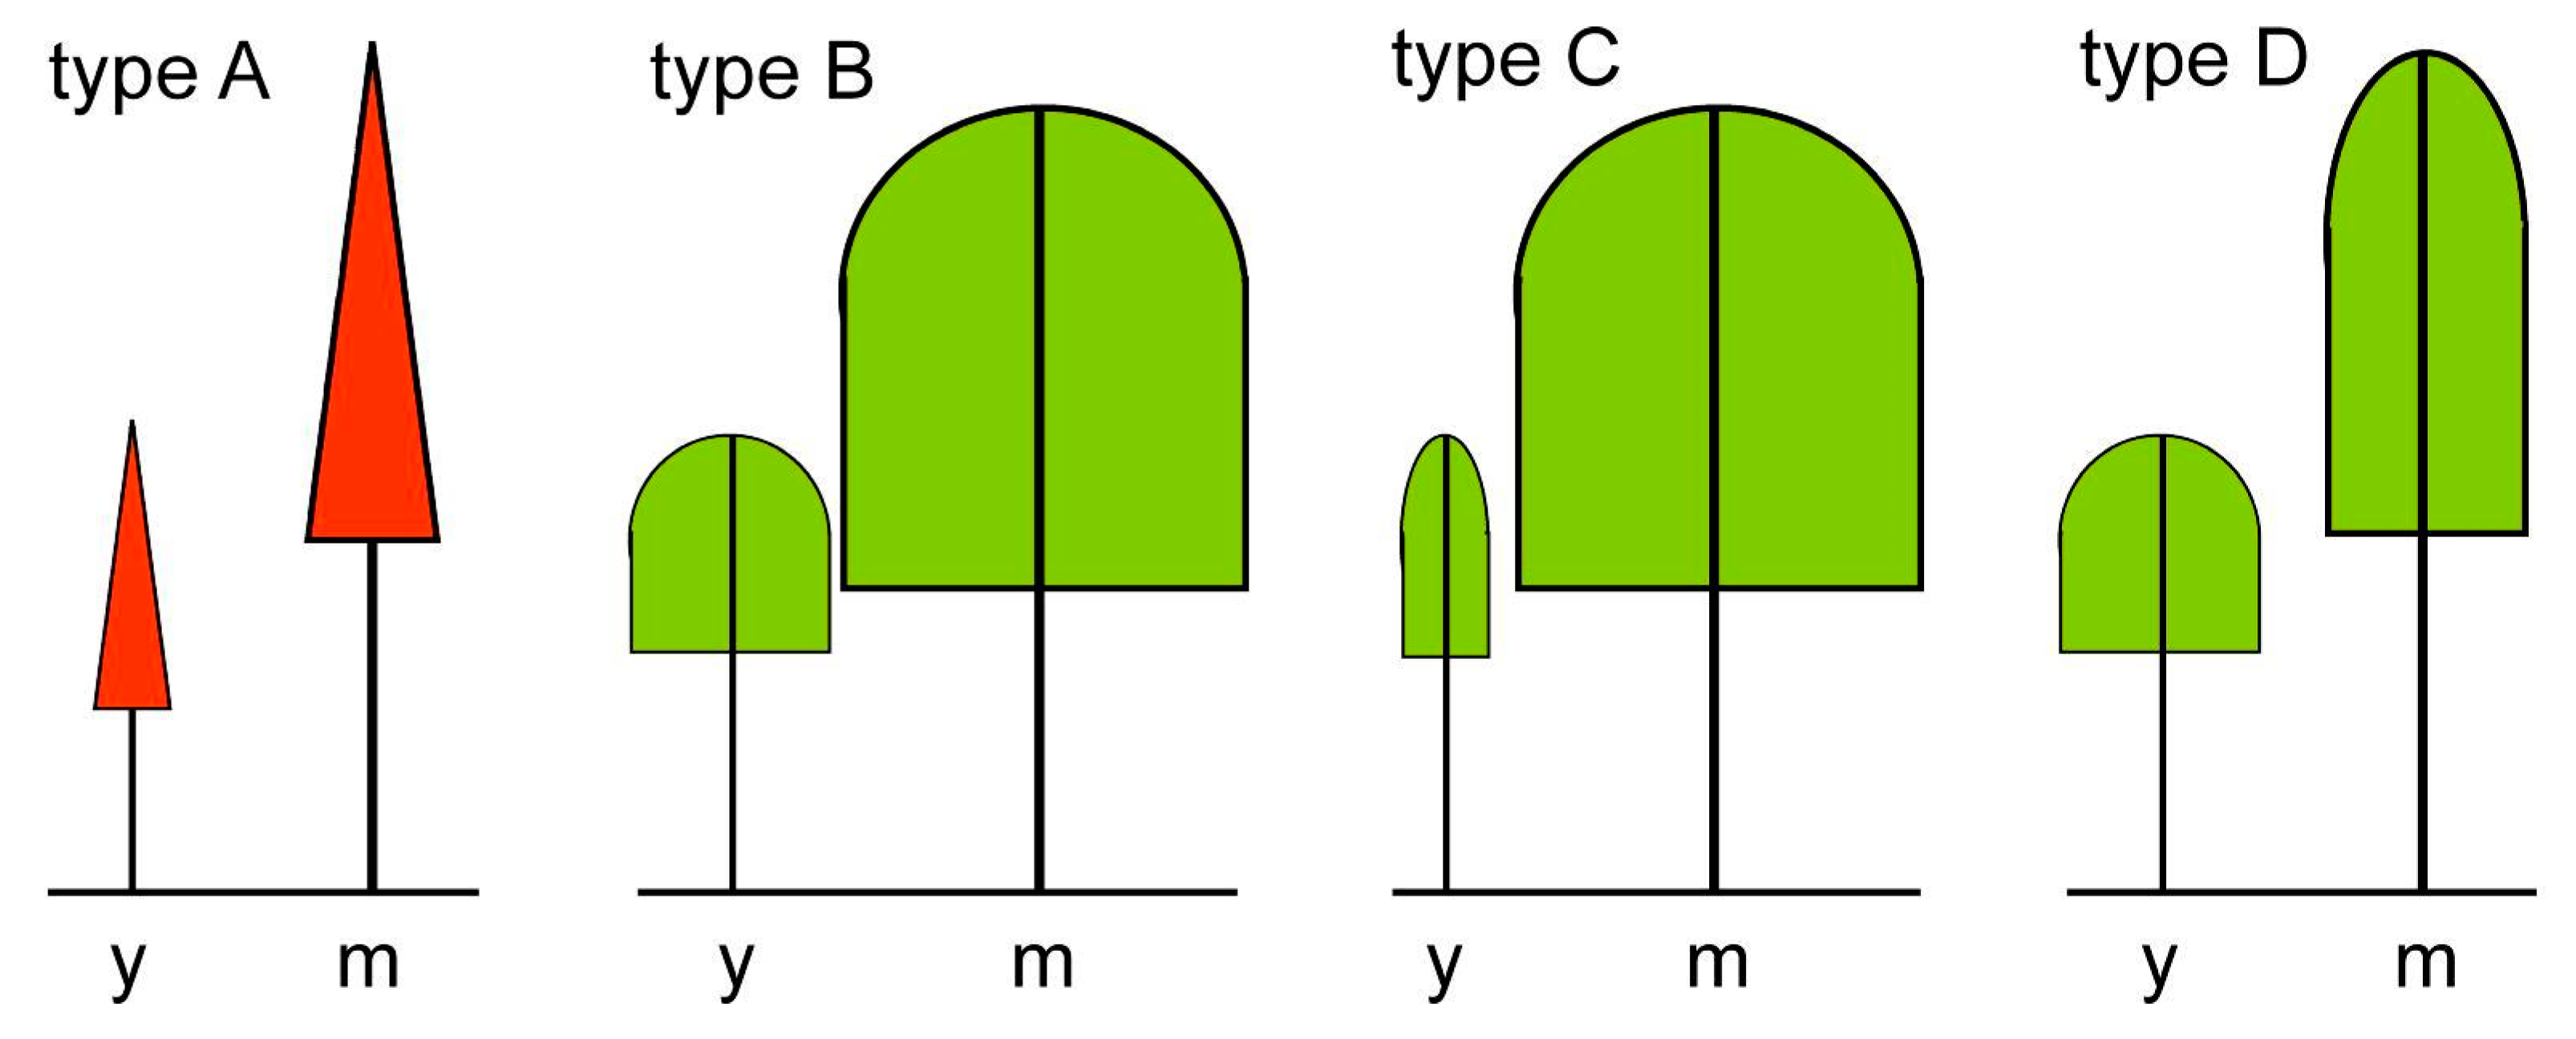
2.2. Basis Types of Crown Allometry

In the following, we introduce the general allometric relationship y   =   a   ×   x α y , x between the size y of one organ of an individual and the size x of another organ or the total size of the individual. We exemplify this for the relationship between the crown projection area, cpa, and the stem diameter, d. This relationship is essential for the effect of tree crown allometry on community dynamics.
The crown width allometry between crown projection area, cpa, and stem diameter, d, can be modeled by the allometric equation,   cpa   =   a cpa , d   ×   d α cpa , d x . The factor acpa,d describes the basic shape and size of the crown, e.g., whether the crown is generally rather slim or wide. The crown projection area cpa would be acpa,d if the diameter is 1, as cpa   =   a cpa , d for d = 1 ( 1 α cpa , d = 1 ). Low acpa,d values indicate slim crowns and high density, while high acpa,d values indicate large crowns and accordingly low stand densities. The slope α cpa , d indicates how the crown extends with progressing size develop of the tree. An exponent of α cpa , d = 1 would mean a linear and α cpa , d   = 2 a quadratic increase of crown area and growing area requirement with increasing stem diameter.
Curve A (acpa,d = 0.1, α cpa , d = 1.25), B (acpa,d = 0.5, α cpa , d = 1.25), C (acpa,d = 0.05, α cpa , d = 1.4), and D (acpa,d = 0.5, α cpa , d = 1.0).
Figure 2 shows four basic developments of cpa   =   a cpa , d   ×   d α cpa , d from the young to the mature development phase of trees. Figure 3 visualizes the respective crown extension types A–D. Allometric theory assumes for the allometric ideal plant a general α cpa , d value of 4/3 ( α cpa , d   = 1.33 ), and assigns species-specific differences just to the size coefficient acpa,d [4,13,14]. However, both coefficients acpa,d and α cpa , d are species-specific, and relevant for the trees’ capacity to cope with neighbors. This applies for mono-specific stands and even more for light interception in mixed-species stands [15,16,17].
Type A, for example, means a high packing density from the beginning on, many trees per hectare, low growing space requirement (e.g., Norway spruce Picea abies (L.) H. Karst.). Type B requires continuously more space than Type A (e.g., elm tree Ulmus or hornbeam Carpinus). Type C is slim in the young state and its increasing crown extension means a challenging competition, especially of neighbors of other species (e.g., European beech Fagus sylvatica L.). Admixed trees of other species can get more and more under pressure, as the type C species becomes continuously more space demanding. Type D is large at the beginning, but the crown extension with progressing stand development is just minor (e.g., silver birch Betula pendula Roth).
Large crowns can enable a better gathering of water and deposition, outcompeting or at least suppressing of neighboring trees, and impeding of competing forest floor vegetation. On the other hand, large crowns can mean higher maintenance costs and low numbers of individuals in a population. Type C represents a very successful behavior with low growing space requirement, high population numbers and high survival in the young phase. With progressing stand development, the crowns of this type extend widely and allow a dominance in the regeneration phase, a successful suppression of others, and high fitness by bringing many progenies into the next generation.
The allometric factor acpa,d reflects the spatial complementarity at a given point in time or in a specific stand development phase, whereas α cpa , d   indicates the shape development and any changes in niche complementarity or similarity over time. Imagine a combination of two species, one of type C the other of type D (e.g., European beech and silver birch). Due to their different α cpa , d values, they may use the limited space more completely and complementarily over time than mixtures of type B and C.

2.3. Crown Data

This paper is based on both a review of existing works about crown and stand growth and on the author’s own crown measurement data. The overview of the allometric behavior of different tree species is based on a dataset of in total 39,057 individual tree crown measurements on long term experiments in forests and urban areas [18]. Evidence of the effect of tree species mixing on crown allometry is based on triplets in mono-specific and mixed-species stands in mixtures of Scots pine and sessile/common oak Quercus petraea (Matt.) Liebl./Q. robur L. [19] and Scots pine Pinus sylvestris L. and European beech [17,20] covering in total 10,099 crown measurements in mixed and monospecific stands across Europe. Each triplet consists of three sample plots, two of them in monospecific stands of species 1 and 2, and one in mixed stands where species 1 occurs intermingled with tree species 2. The tracing of the crown size growth from the tree to the stand level is, in addition, based on the long-term mixing experiments of Norway spruce and European beech and sessile/common oak and European beech introduced by Pretzsch et al. (2010, 2013) [21,22], and of Douglas-fir Pseudotsuga menziesii (Mirb.) Franco and European beech published by Thurm et al. (2016, 2017) [23,24]. Most of the stands were derived from planted trees. The sample sizes, measurements, and some cases the original data are reported in the cited publications and not repeated here.

2.4. Statistical Models

We applied 10 different statistical models. For all models except model 5, we showed the fixed effects in Table 1. The results of the extensive regressions analyses based on model 5 were summarized in Supplementary Table S1.
Model 1
ln ( cpa k ) = a 0   +   a 1 × ln ( h k ) + ε k
We applied a 95% quantile regression in order to reveal the maximum species-specific crown expansion in dependence on the tree height.
Model 2
ln ( cpa ijk ) = a 0   +   a 1 × ln ( d ijk )   +   b i   +   b ij   +   ε ijk
This model quantifies the relationship between crown projection area and stem diameter. We applied random effects on a 0   at the experiment and the plot level in order to take into consideration spatial dependencies due to several successive crown measurements per experiment and on the same plot.
Model 3
ln ( hcb k ) = a 0   +   a 1   × ln ( h k ) +   ε k
Here we applied a 25% quantile regression in order to quantify the species-specific lowest height to crown base in dependence of tree height. Based on hcb = a 0   ×   h a 1 we also derived the relationship cl = h   hcb   = h     a 0   ×   h a 1 .
Model 4
Both cpa k = a 0   +   a 1   ×   R k   +   ε k and cr k = a 0   +   a 1   ×   R k   +   ε k were modelled by an ordinary OLS regression. R represents the specific wood density.
Model 5
Both the dependency between crown projection area and stem diameter and between crown radius and stem diameter were modelled by 95% quantile regression in order to describe the most extending crowns for given stem diameters. The model equations were ln ( cpa k ) = a 0   +   a 1 × ln ( d k ) + ε k and ln ( cr k ) = a 0   +   a 1 × ln ( d k ) +   ε k . See Supplementary Table S1 for the 14 considered tree species.
Model 6
ln ( cpa ijk ) = a 0   +   a 1 × ln ( d ijk ) +   a 2   × mix ij + a 3 × ln ( d ijk ) ×   mix ij   + b i +   b ij +   ε ijk .
This model described the dependency of the crown projection area on the stem diameter in monospecific and mixed-species stands. The fixed effect variable mix is categorical, with mix = 0 for monocultures as a reference, and mix = 1 for mixed-species stands. The model in general can be seen as a typical log-linear allometric relation between size variables (cpa, d), with mixture effects on both the intercept and the allometric slope. The fixed effects parameters are a0–a3. The random effects bi and bj cover the levels triplet (i) and plot (j). The level of the individual tree is represented by the index k. Model 6 was applied for Scots pine and oak and Scots pine and European beech.
Model 7
This model described the dependency of the crown projection area from the tree height in monospecific and mixed-species stands.
ln ( hcb ijk ) = a 0   +   a 1 × ln ( h ijk ) +   a 2   × mix ij +   a 3 × ln ( h ijk )   ×   mix ij   +   b i +   b ij +   ε ijk had the same structure as model 6.
Model 8
Here we used a simple liner OLS regression model SDI k   =   a 0   +   a 1 × ( l / cpa k )   +   ε k with a reciprocal relationship between SDI and cpa that described the hyperbola relationship between maximum tree number per unit area and growing area per tree.
Model 9
ln ( N ijk ) = a 0   +   a 1 × ln ( cpa ijk ) +   a 2   × mix ij +   a 3 × ln ( cpa ijk ) ×   mix ij   + b i + b ij +   ε ijk . This model described the relationship between tree number per unit area and the crown projection area in monospecific and mixed-species stands. The model considers random effects on a0 at the experiment and plot level in order to take into consideration spatial dependencies due to several crown measurements per experiment and plot. The model used the same approach as models 6 and 7 in order to test the effect of mixing on both intercept and slope of the N-cpa relationship.
Model 10
ln ( N ijk ) = a 0   +   a 1 × ln ( dq ijk )   +   b i + b ij +   ε ijk
This model described the tree number–mean stem diameter relationship. In this model, we consider random effects on a0 at the experiment and plot level in order to take into consideration spatial and temporal dependencies due to several plots per experiment and several successive measurements on the same plot.
The statistical software R 3.4.1 [25] was used for all calculations, in particular the function lme from the package nlme [26].

3. Tree Crown Allometry in Mixed versus Monospecific Stands

3.1. Allometric Plasticity

Figure 4 illustrates that crown plasticity can differ considerably between tree species. The data comes from crown measurements on long-term experimental plots in Germany and covers a broad range of tree ages and stand densities, in monospecific and mixed stands [10,17]. Based on the 95%- and 5%-quantiles of the cpa-d- allometry (Figure 4, upper and lower lines), the relative measure, CPL, for tree crown plasticity was derived. Based on the lower quantile line cpa 5 % =   a 5 %   ×   25 α 5 % and the upper one cpa 95 % =   a 95 % × 25 α 95 % , and using a reference stem diameter of 25 cm, the ratio CPL was formulated as follows: CPL = cpa 95 % , 25 / cpa 5 % , 25 = ( a 95 % / a 5 % ) × 25 α 95 % α 5 % . We chose a reference diameter of 25 cm as this is the well-known index diameter of the Stand Density Index, SDI, by Reineke [27]. For a tree with a reference diameter of 25 cm, CPL indicates how wide a crown can range in solitary conditions in relation to maximum restriction. By setting the 95% in relation to the 5% width, any species-specific differences in shape and form (e.g., that beech crowns are, a priori, wider than spruces) are eliminated. The relative measure for tree crown plasticity, CPL, indicates the relative potential for crown expansion which is of particular relevance for competing in mixture.
Analyses of CPL values for various tree species in Europe revealed a maximum value for European beech of CPL = 5.1, i.e., the upper crown area is more than 5-fold compared to the lower crown area under strong competition. With respect to CPL, the species represented in Figure 4 are ranked as follows: E. beech (CPL = 5.1) > s. fir Abies alba Mill. (4.7) > s. oak (4.5) > N. spruce (4.2) > sycomore maple Acer pseudoplatanus L (4.0) > S. pine (3.7). Out of the set of 14 species analyzed in this way by Pretzsch (2014) [10], beech (5.1) had the highest value, whereas alder Alnus (2.8) and birch (2.6) had the lowest.
For an explanation of the characteristic convergence of the upper and lower boundary lines in Figure 4, see Section 3.3.
The crown space requirement with increasing tree height can also differ considerably between tree species. Figure 5 shows over 30,000 crown sizes measured on long-term experiments in South Germany and the 95% quantile regression line for the cpa-h relationship (inverse function of model 1, see Section 2.4). Whereas the space requirement of Norway spruce (a) increased just moderately with progressing height growth, Scots pine and Douglas-fir (b and c) were more space consuming. The strongest increase of cpa with progressing height development showed European beech and sessile oak (d and e).
The different development patterns suggest complementarity but also competition when trees of different species are mixed.
Norway spruce showed the slimmest crown development, probably reinforced by crown shyness. The resulting gappy crown structures may be successfully closed by more crown expanding tree species as beech or Douglas-fir. Douglas-fir and European beech also appeared to be rather compatible, as the first can achieve higher heights and is less space consuming, while European beech was horizontally more expansive and may use the crown space below the Douglas-fir. In contrast, European beech achieved greater tree heights than Scots pine and sessile oak, so that the latter two species may be outcompeted by beech in advanced stand development stages if not promoted by silvicultural interventions.

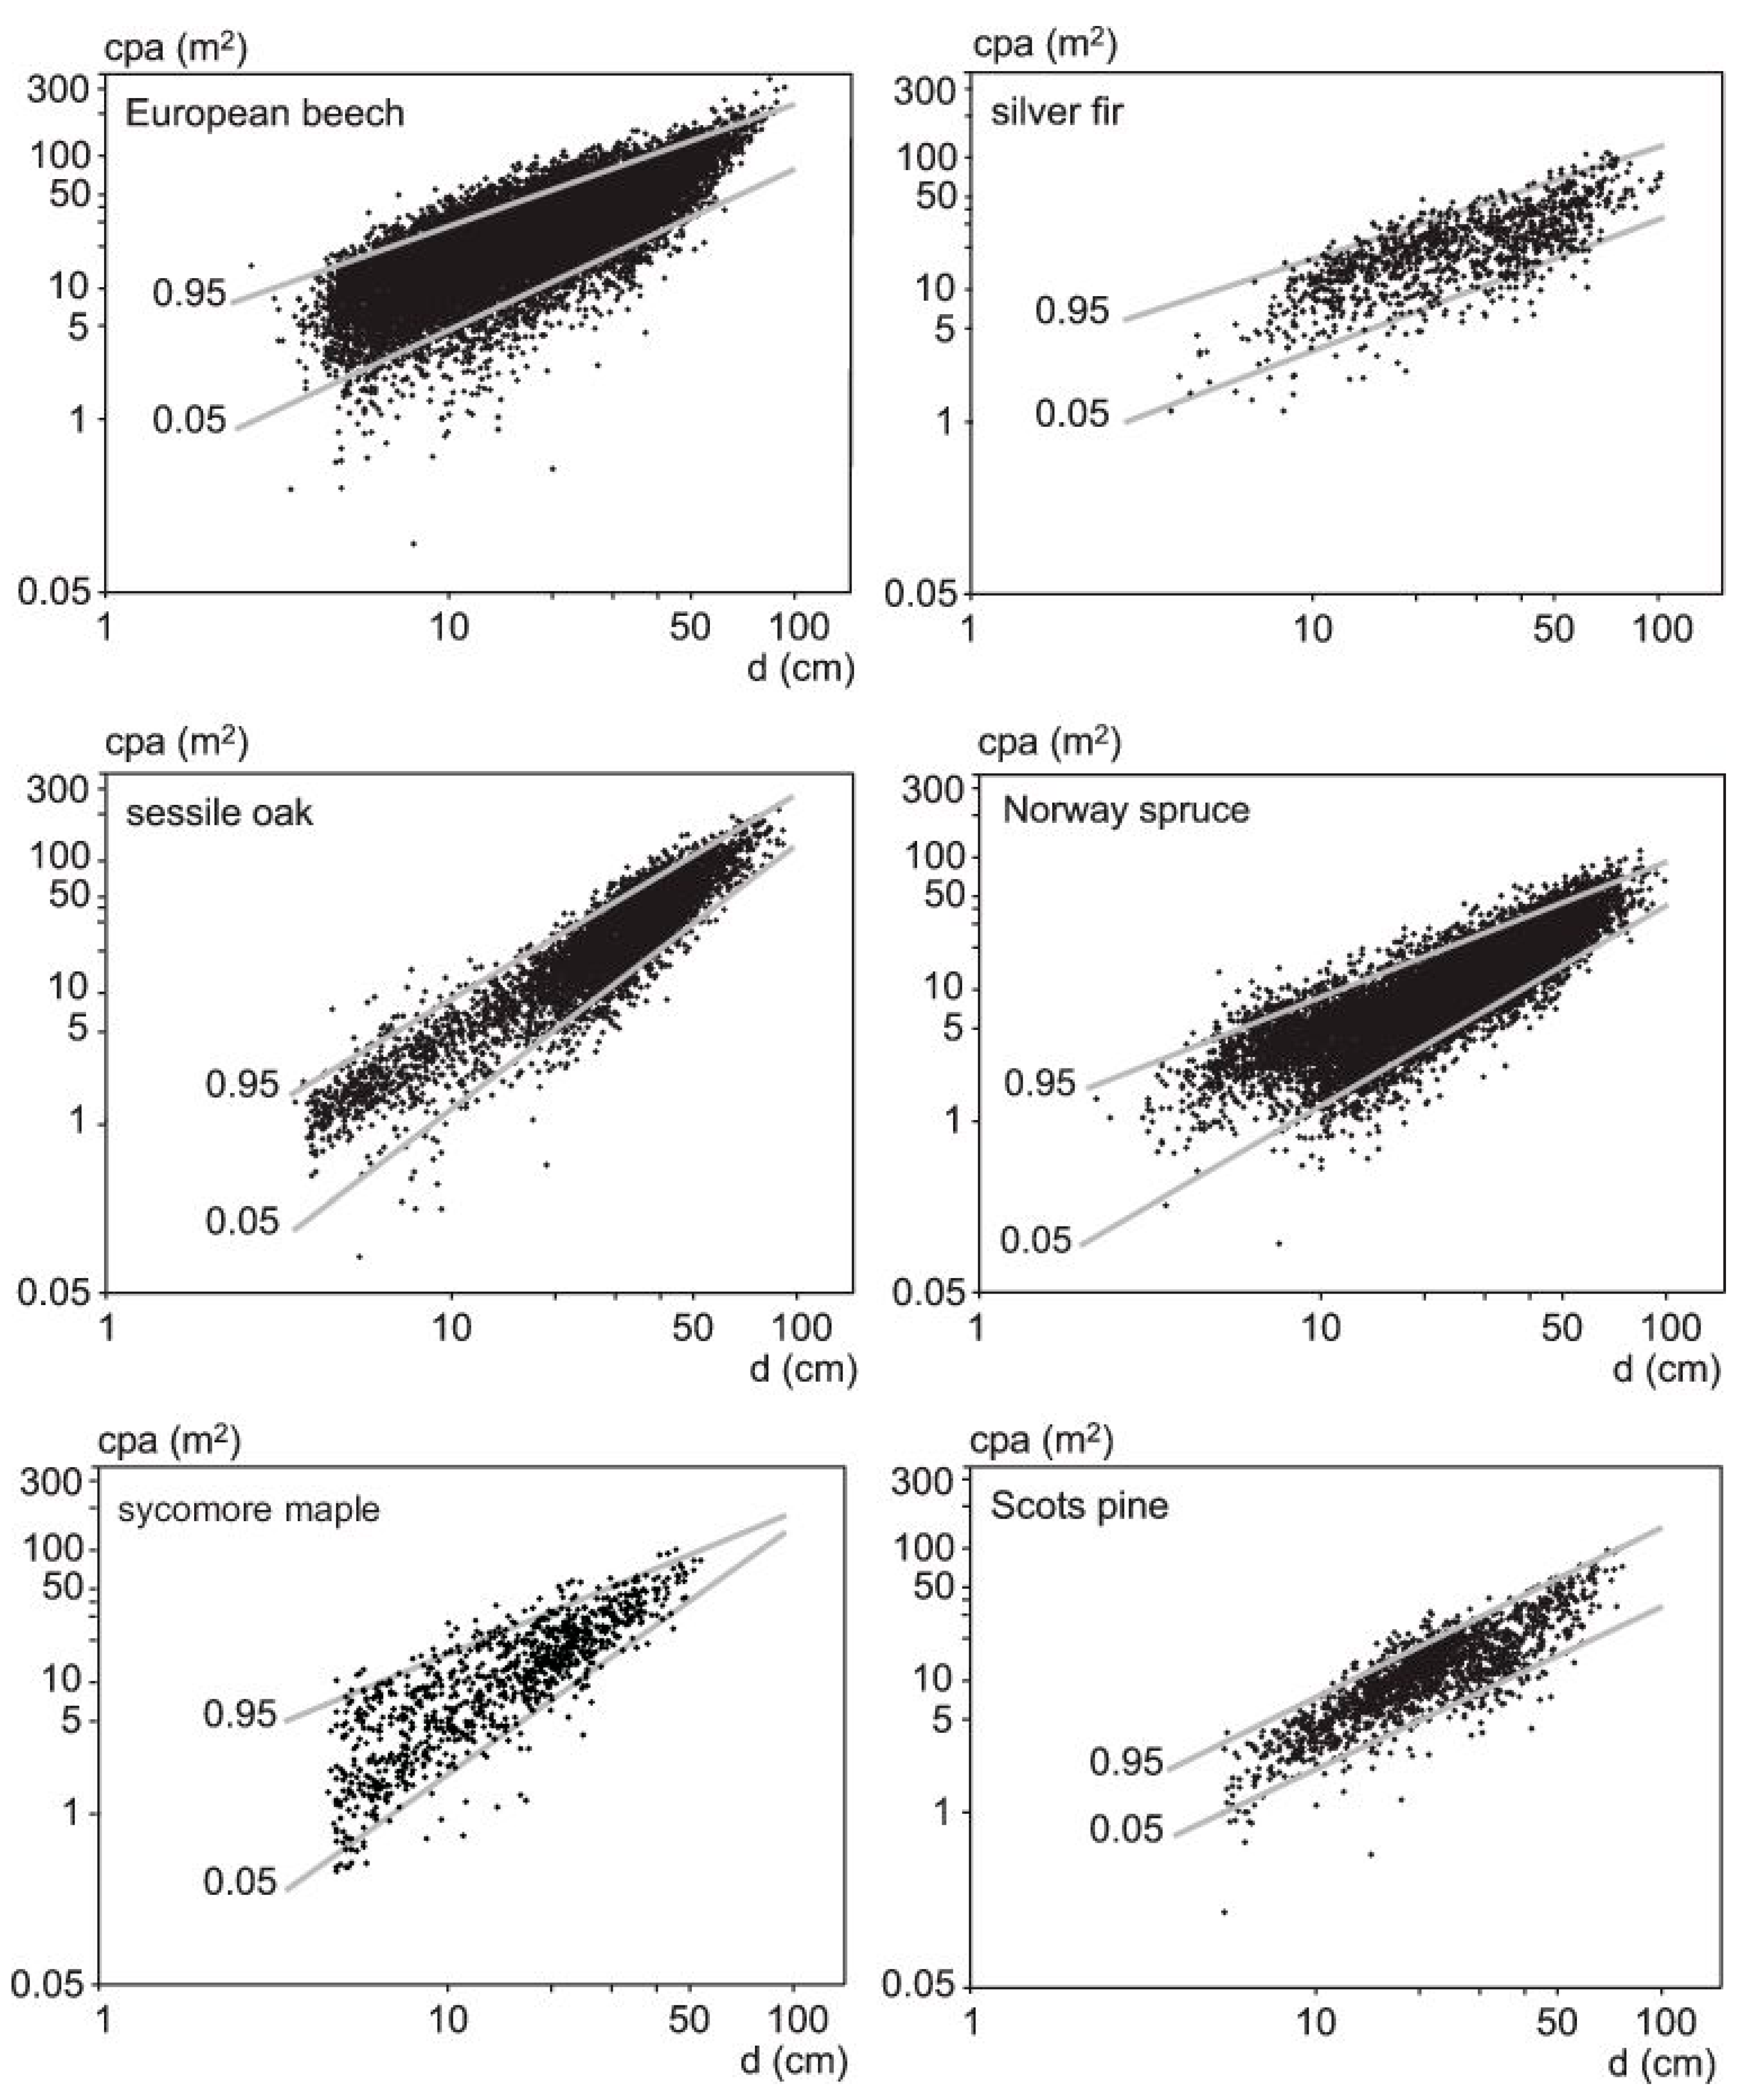
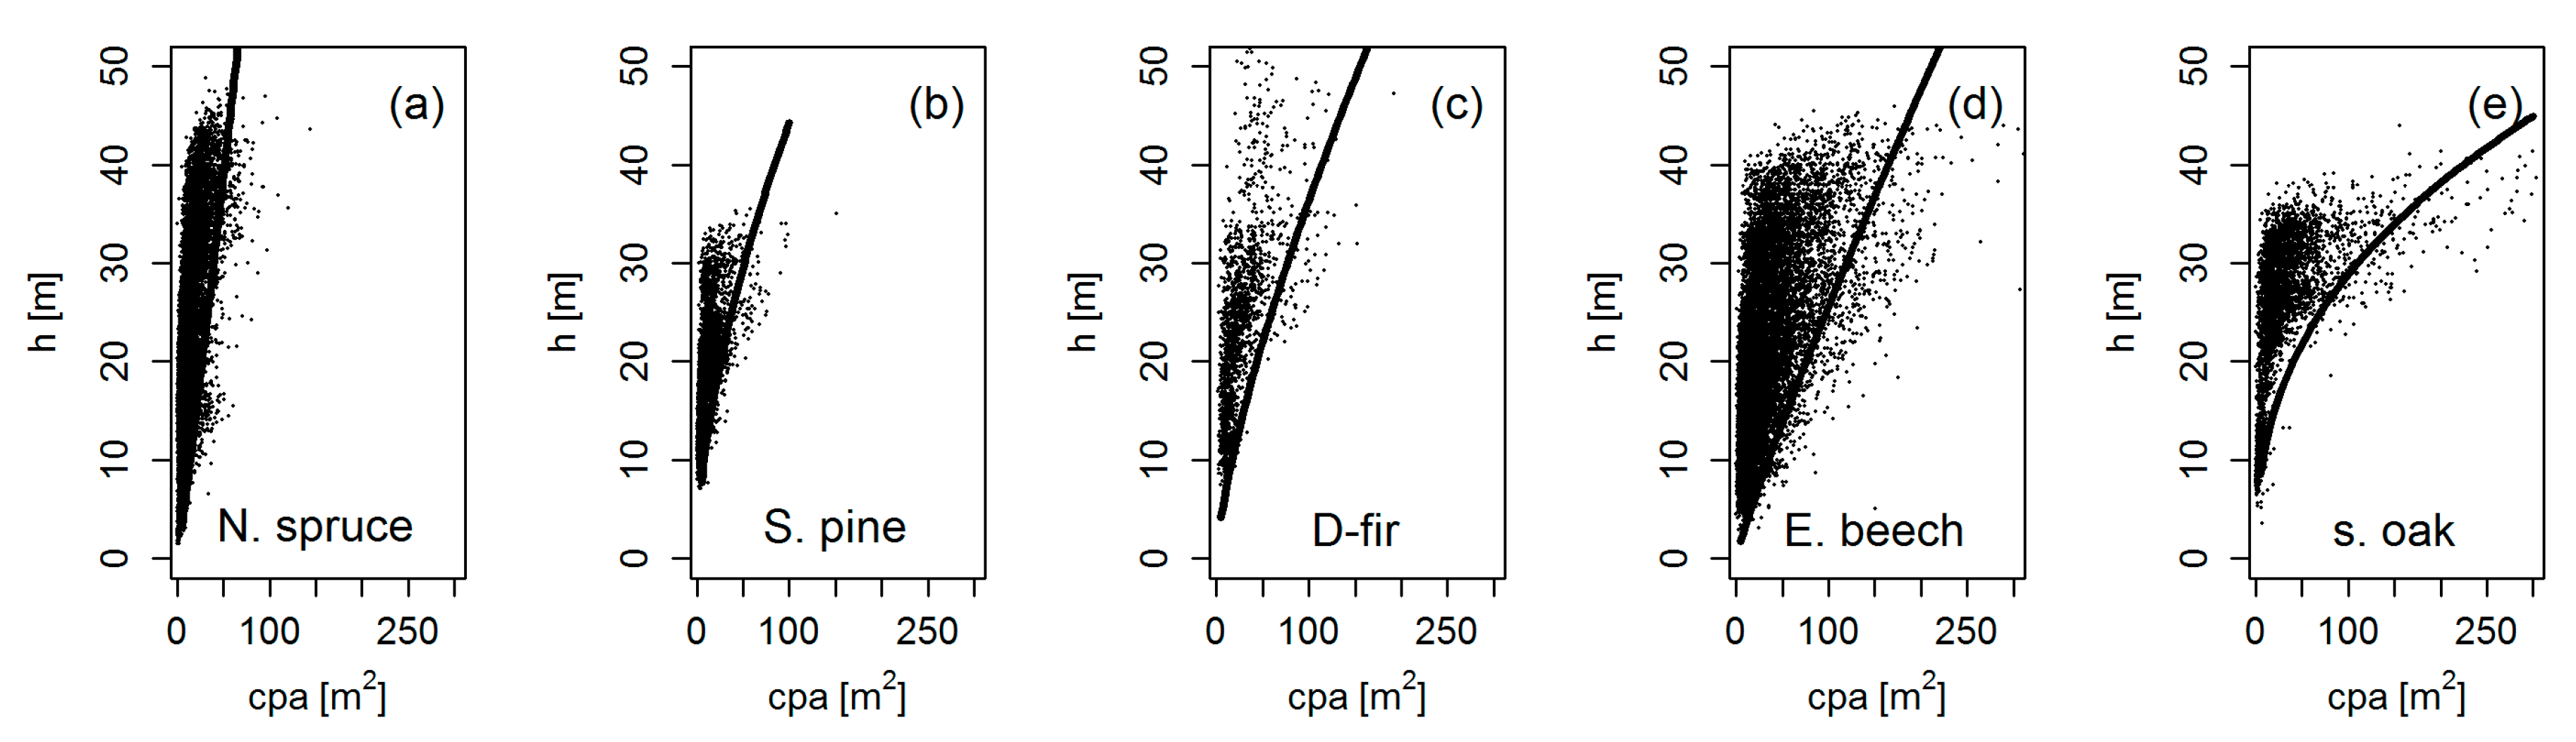
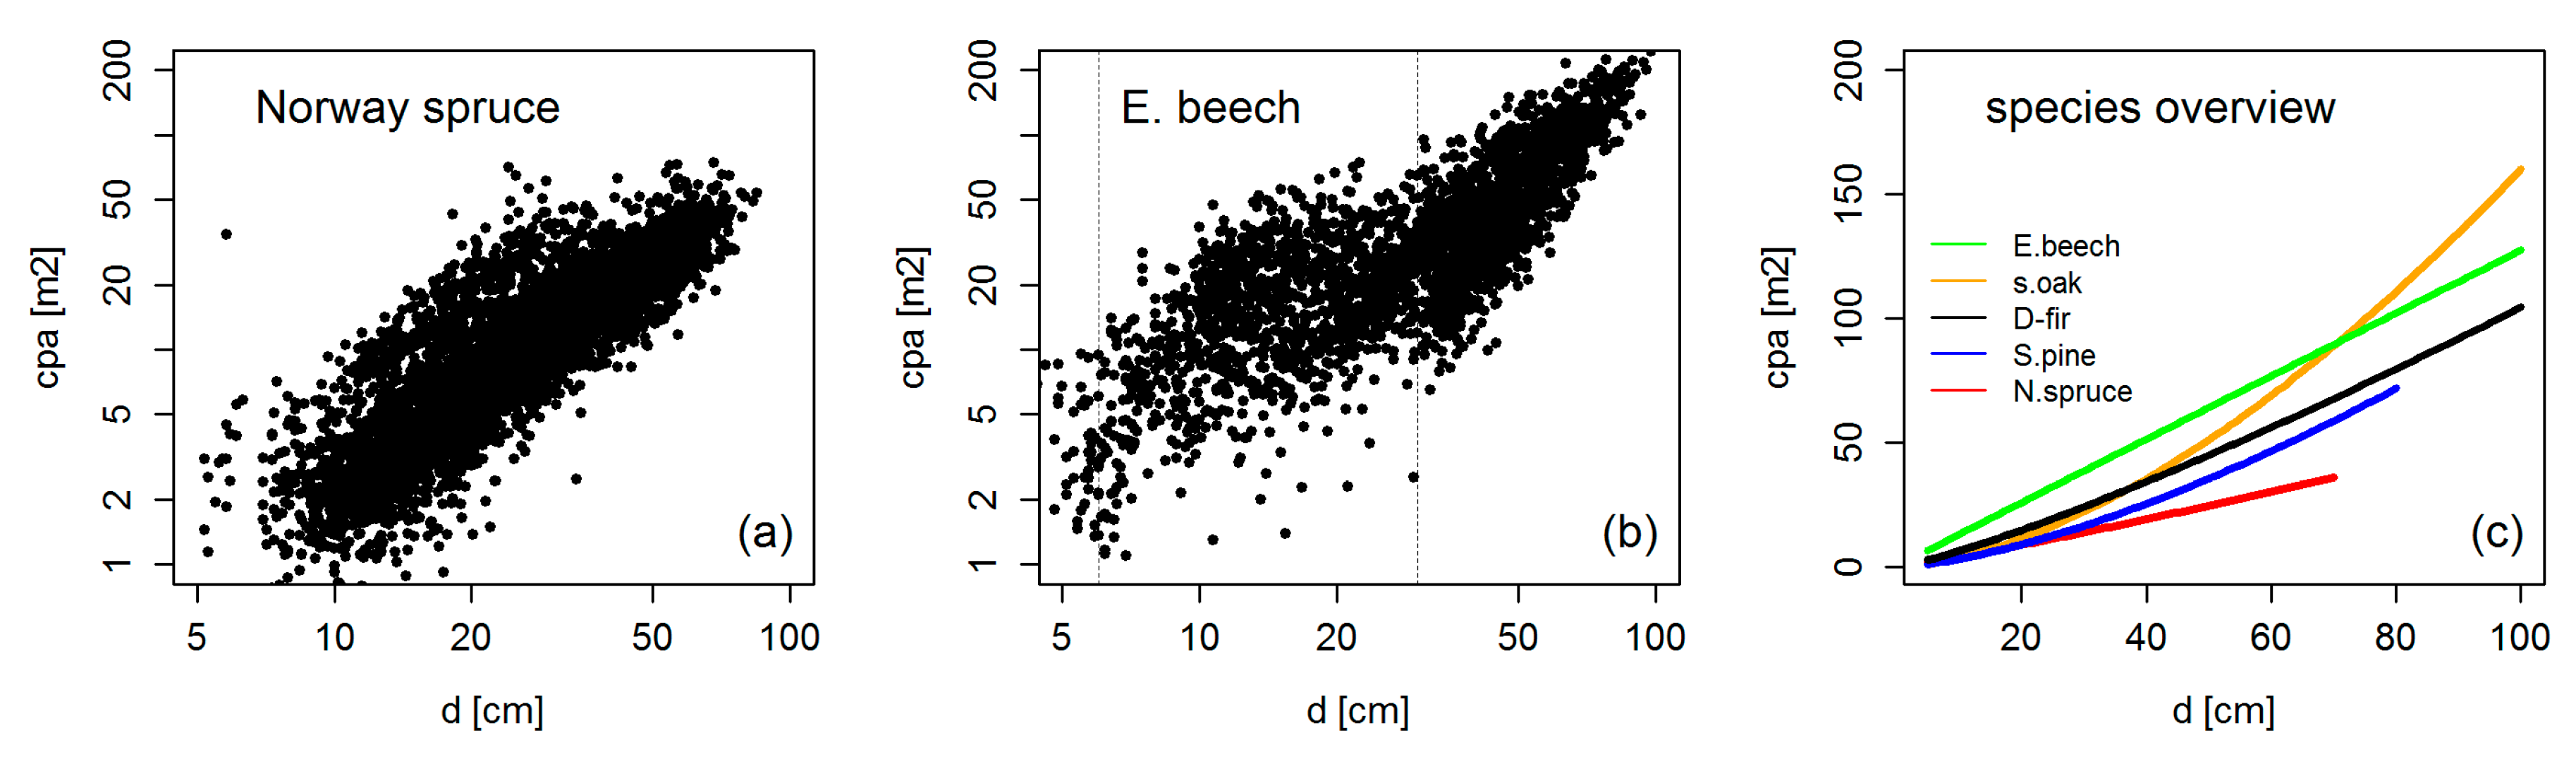
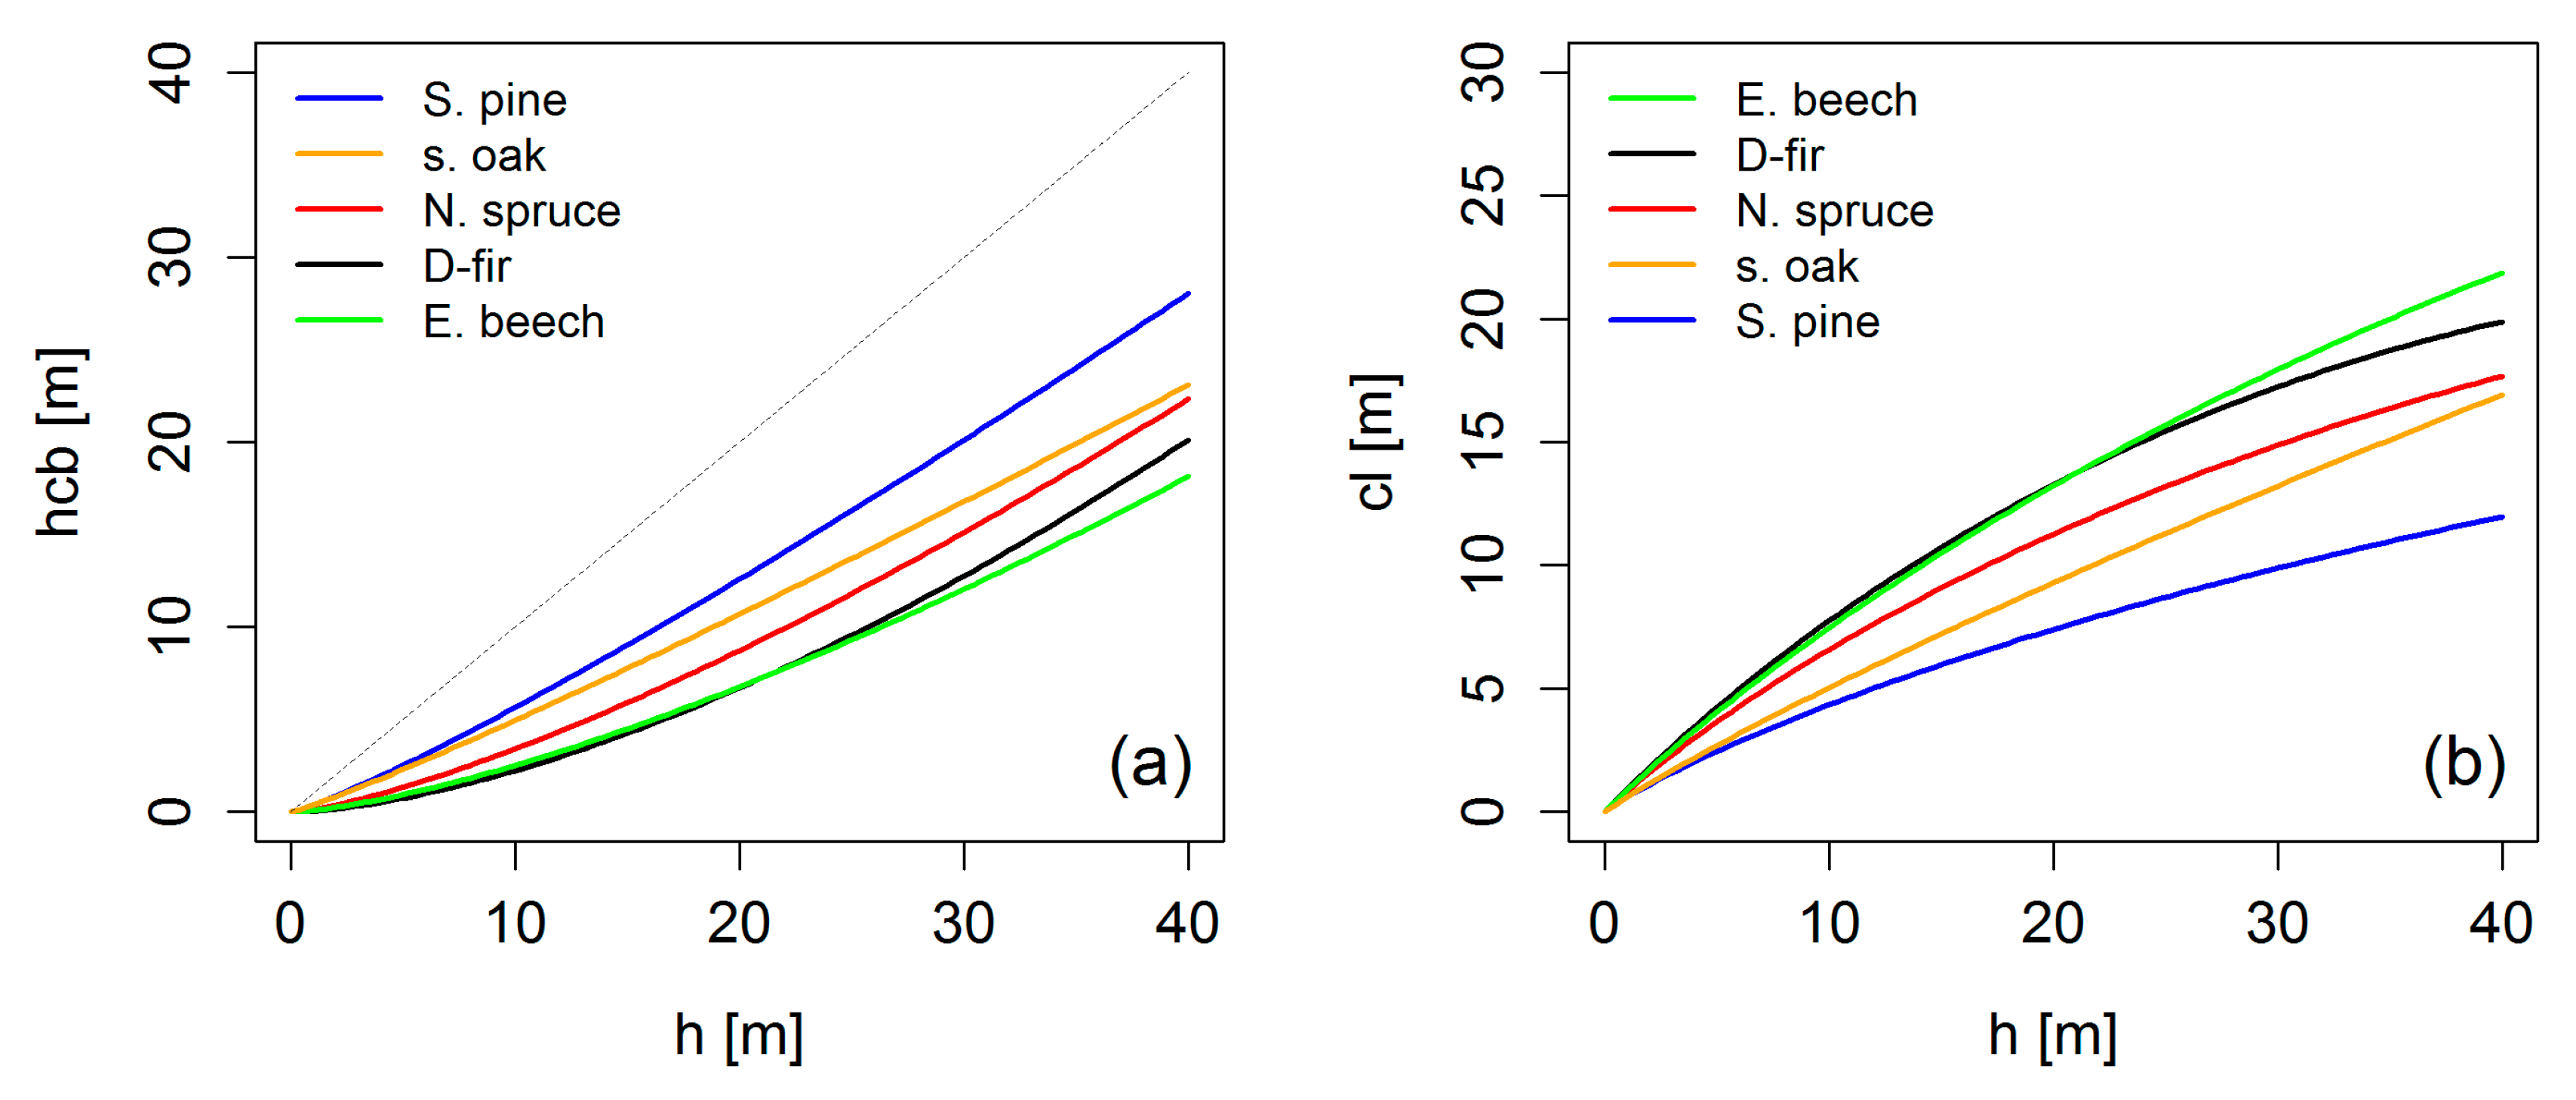
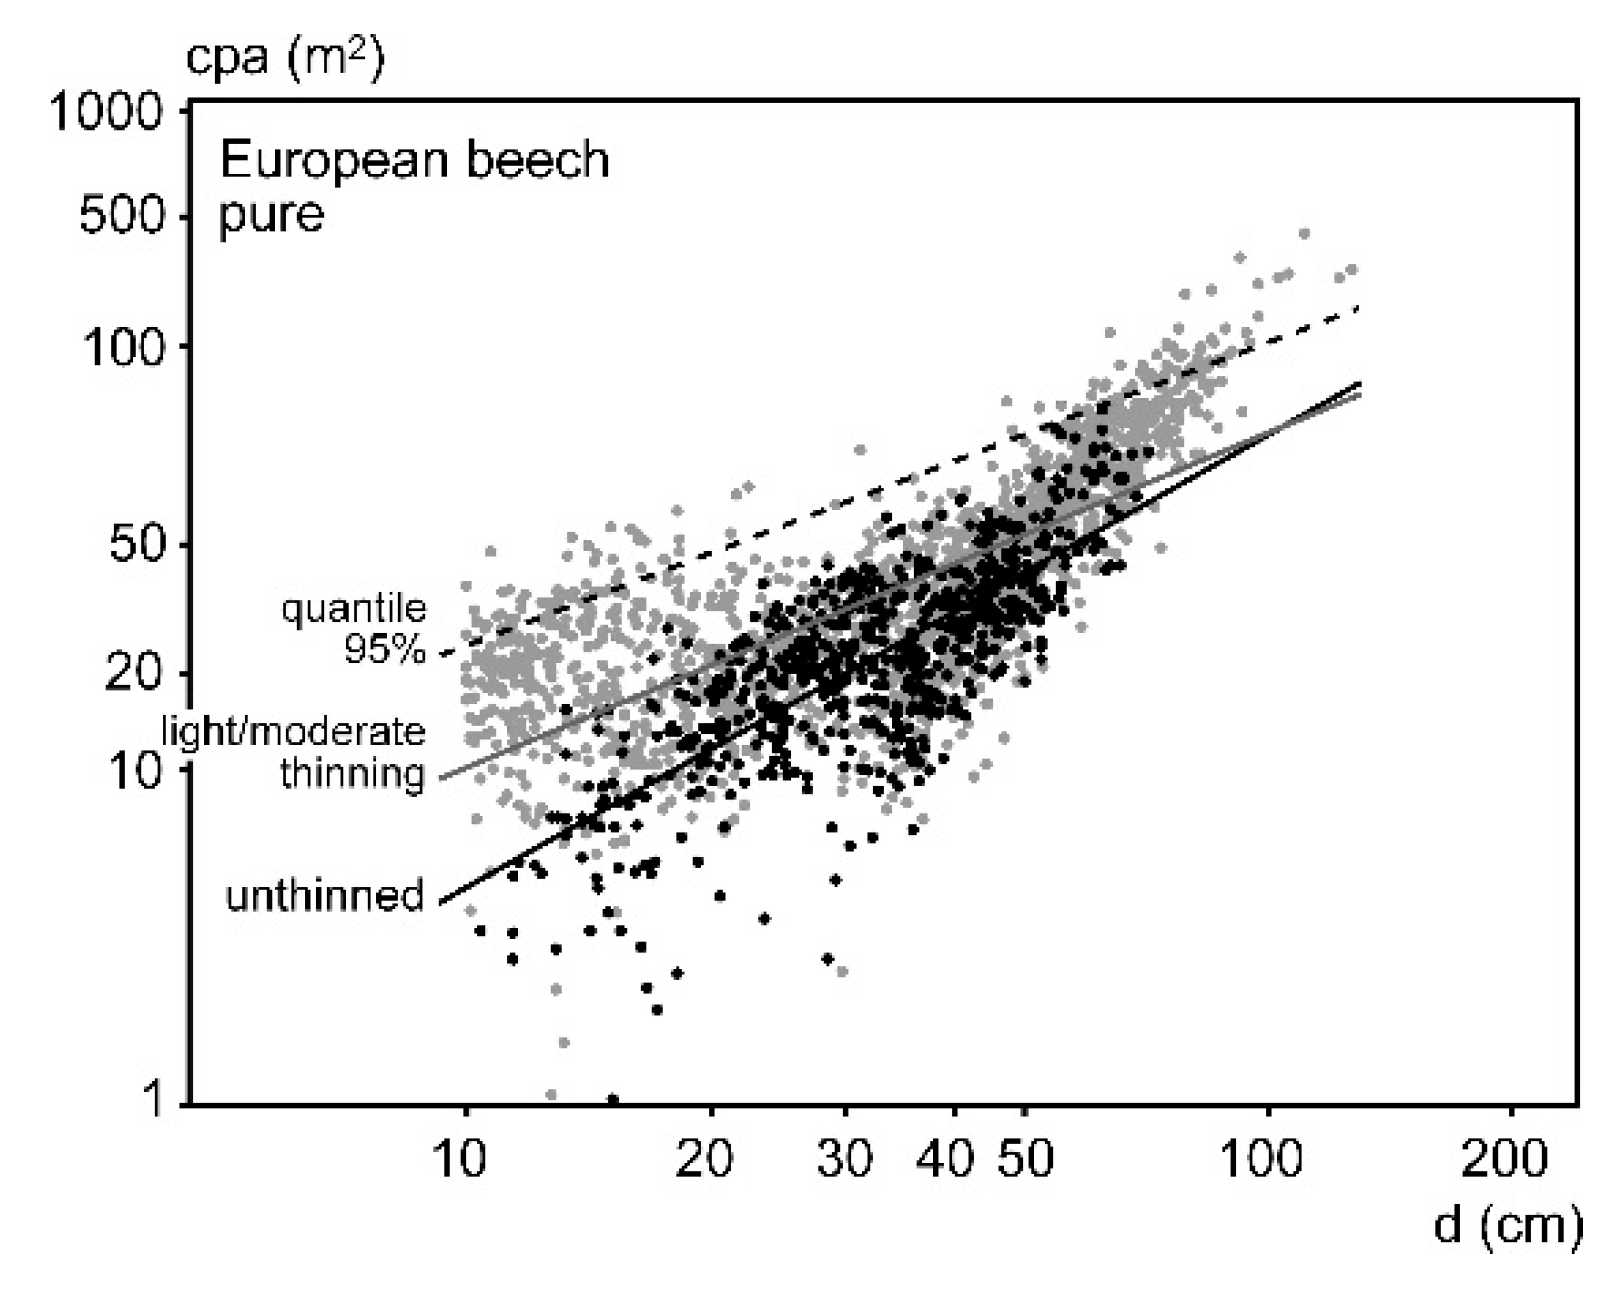
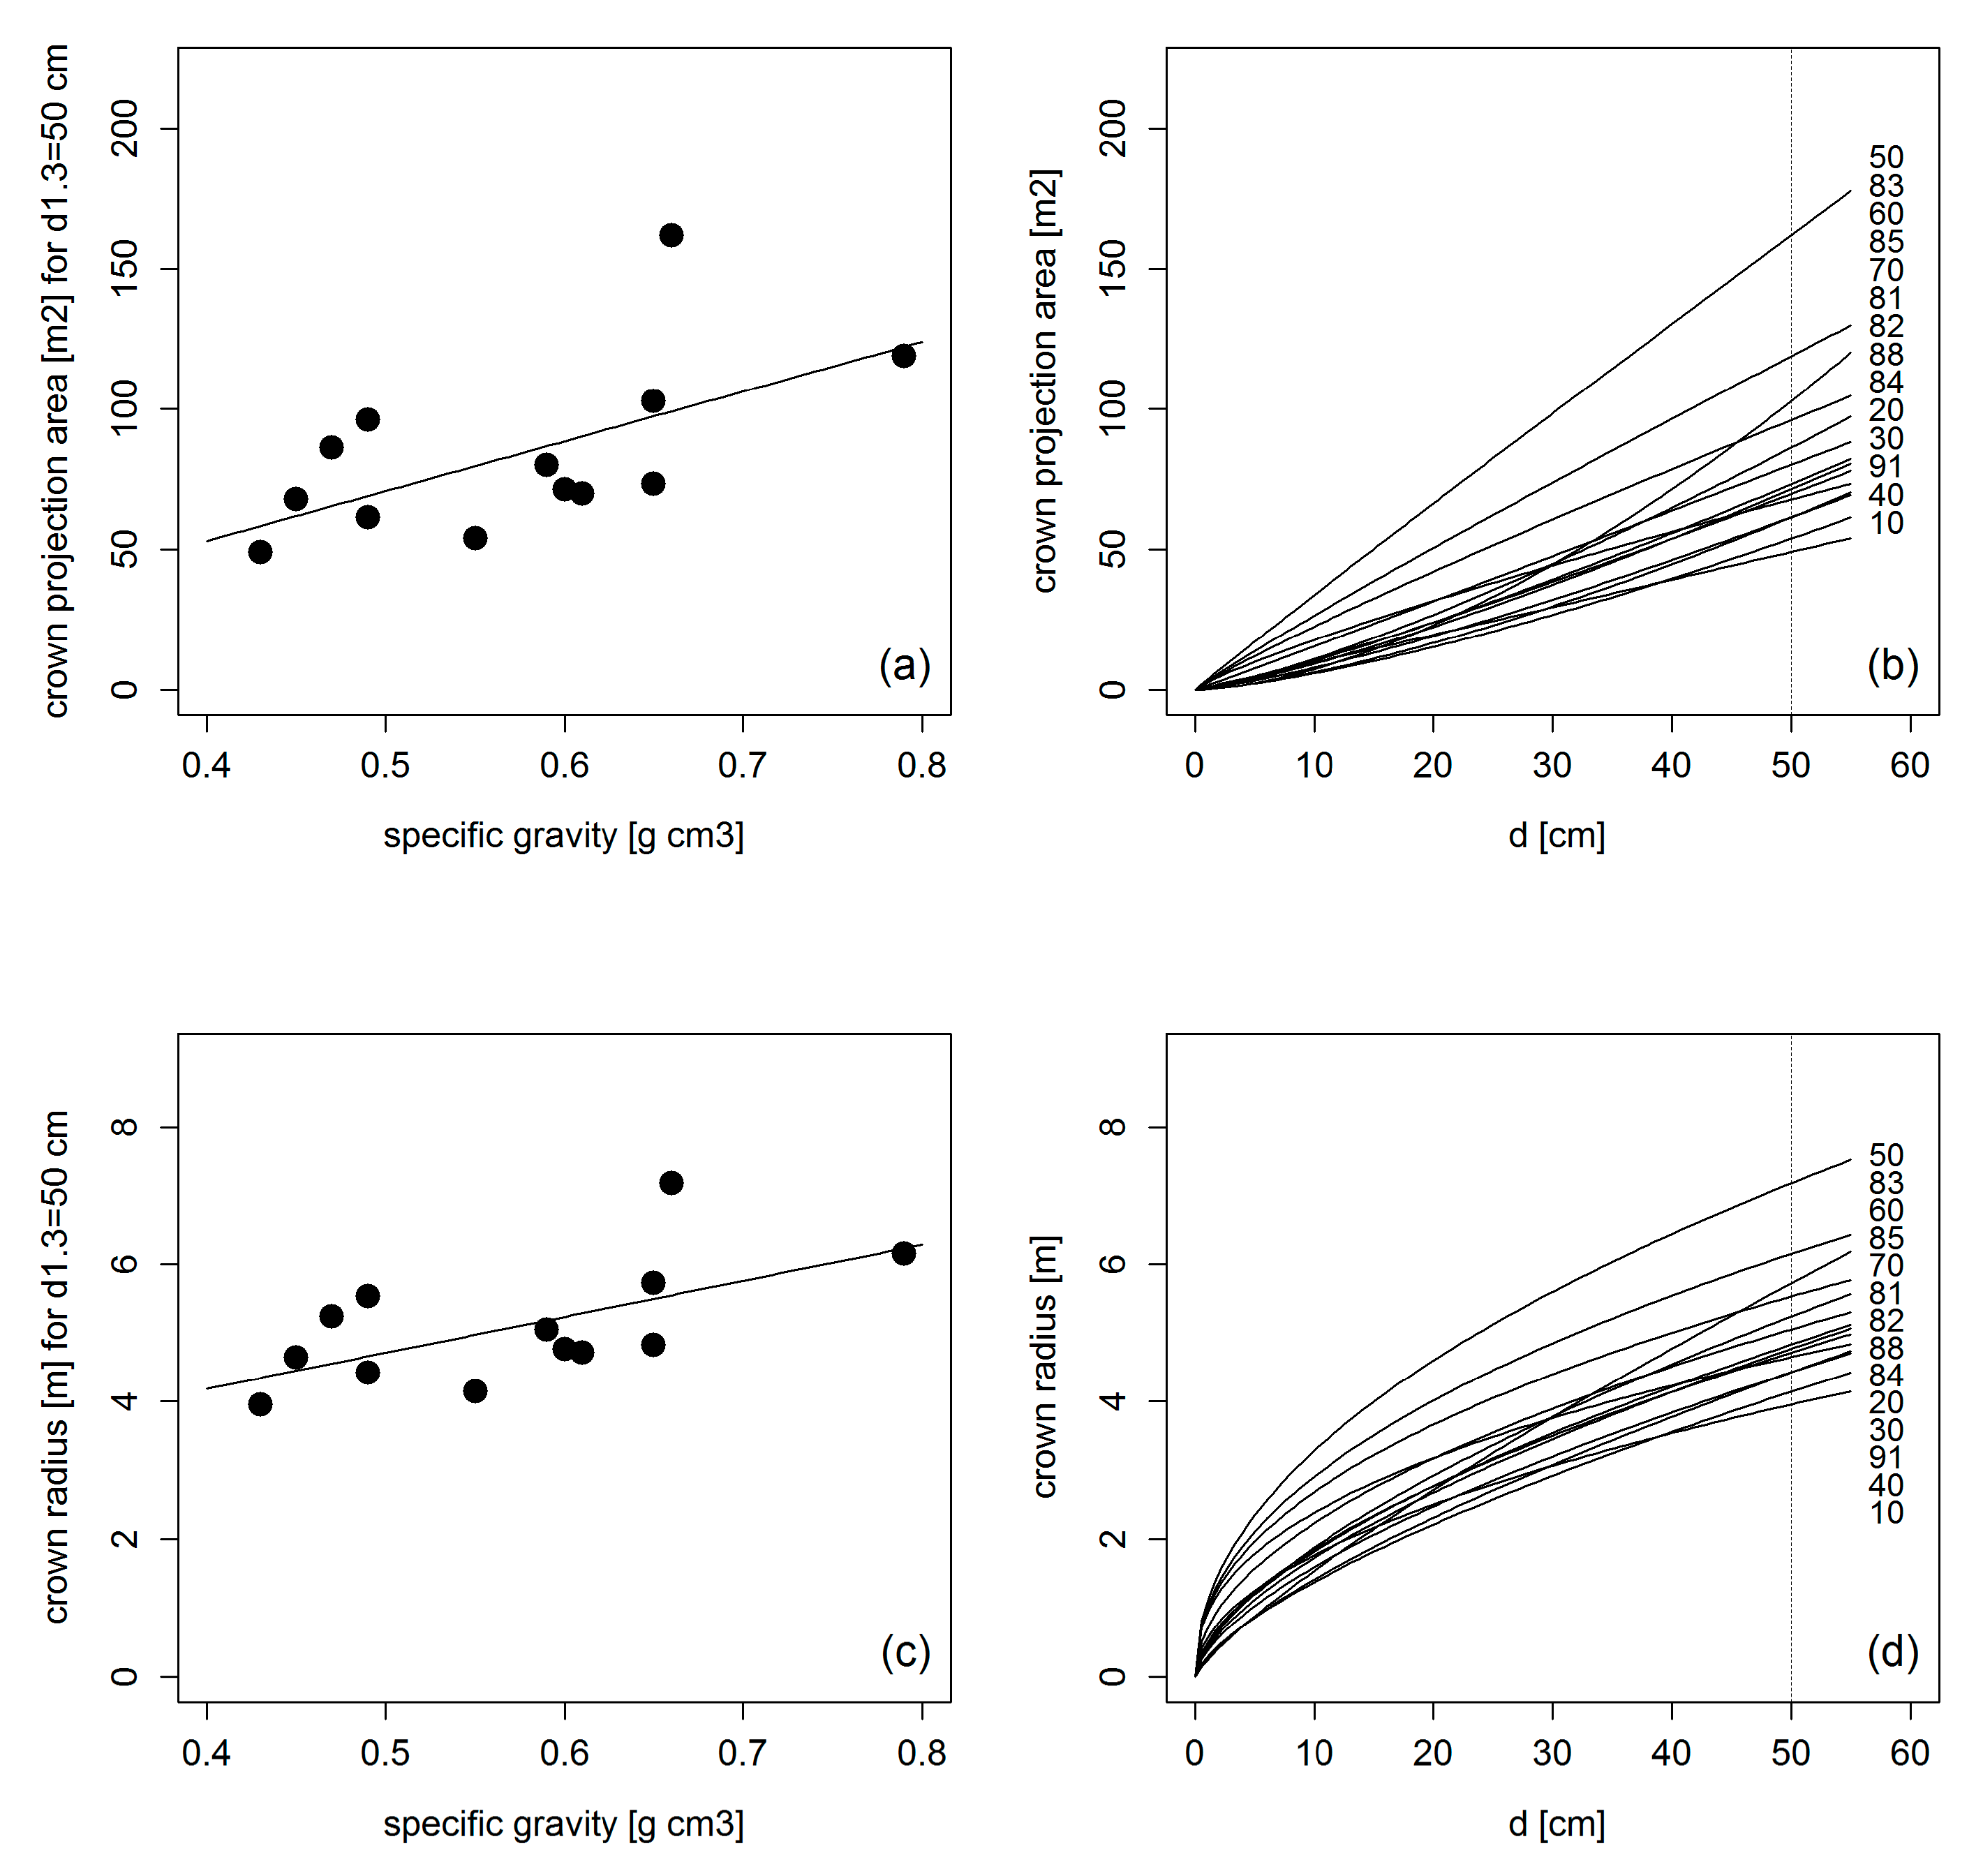
3.2. Crown Allometry in Mono-Specific Stands

Many works quantified the crown allometry in mono-specific stands for tree and stand growth modelling [27,28,29,30,31,32]. In particular, light modelling and spatially explicit competition indices can be improved by considering crown allometry [33,34,35]. Other studies were motivated by finding general scaling rules for trees at the tree level [36,37,38] and tracing them to the stand level [14,39,40]. Also, more practical reasons, such as designing tree removal by thinning [41], tree architecture [42], wood mechanics and wood quality estimation [43,44], and tree recognition by remote sensing [45,46,47], triggered the analyses of tree crown allometry. Furthermore, biomass, carbon and fuel wood estimation have recently promoted tree crown analysis [48,49,50,51]. Several overview papers document the tree crown allometry of various species [16,18,52,53].
Most of these research works were focused on monospecific stands. In such stands, especially when they are rather homogeneous in terms of genetics and tree size, it is implied that all individuals engage in similar behavior to compete for the limited growing space and resources. As the resource demands, physiological abilities and structural variability of competing trees are more similar in monocultures, canopy structure remains mostly homogeneous, competition rather size-asymmetric, and canopy depth low (Figure 6a).
In mixed stands, in contrast, the tree crowns’ space to expand can be wider. If the crown shapes and the light ecology of the combined species complement each other, the trees might simply have more canopy space to occupy. Their mechanical abrasion or penetration of neighboring crowns [54,55] may be lower, as shown in Figure 6b.
For the following analyses of the effect of tree crown allometry on community dynamics we selected tree species for which both tree and stand level data were available. We analyzed the crown allometry of the five primary tree species in Central Europe, Norway spruce, Scots pine, Douglas-fir, European beech, and sessile oak. For these species, long-term experiments provide repeated crown and stand measurements (Section 2.3). We first analyzed their behavior in mono-specific stands, and later we also used these tree species for tracing the effect of tree crown allometry on stand dynamics in mixed-species stands.
Figure 7c shows the cpa-d allometry in monospecific stands for Norway spruce, Scots pine, Douglas-fir, European beech, and sessile/common oak. This reveals clear species-specific differences in crown expansion that increased with progressing diameter development. In the advanced development stage, there was a size ranking of cpa oak > beech > Douglas-fir > pine > spruce.
Comparison of Figure 7b with Figure 7a revealed the specific sit-and-wait ability of European beech. European beech is able to slow down the height development in the understorey and survive by lateral crown expansion. This behavior resulted in a hump in the cpa-d pattern, visible in Figure 7b between 6 and 25 cm stem diameter, indicated by two vertical lines. This allometric plasticity may complicate the development of plausible general allometric relationships by simple double-logarithmic regressions.
The position of the lowest branches in a fully stocked stands indicates the depth of the canopy and the canopy space the trees have to find a niche for survival. A high hcb and corresponding narrow canopy space means insufficient growing conditions for members of this species in lower parts of the canopy. A deeper canopy means more space to arrange and overlap. This enables the establishment of a second or third layer that may compensate growth losses in case of damages and openings of the upper canopy.
Survival in deeper layers certainly requires shade tolerance; therefore, the hcb is higher for light demanding and lower for shade-tolerant tree species. The ranking of hcb Scots pine > sessile oak > Norway spruce > Douglas-fir > European beech (Figure 8a) correlated with the light compensation points, LCP, of the tree species and their relative minimum light requirement, MLR. The LCP decreases from 27 µmolm−2 s−1 for Scots pine to 13 µmolm−2 s−1 for European beech (Ellenberg and Leuschner 2010, pp. 103–105) [56]. The light compensation points refer to sun leaves/needles in summer for Amax (i.e., when light saturated photosynthesis under normal CO2-concentration). The MLR is 10% for Scots pine and 1.2–1.6% for European beech [57,58]. The MLR quantifies the minimum light requirement of the species in relation to the light above the canopy (100%). The individual trees in mono-specific stands are rather similar in their structural and functional traits. Therefore, apart from some genetic variation and acclimation trees of a light demanding tree species will not be able to survive and fill the canopy below a species-specific minimum of light. However, a second tree species with higher shade tolerance could survive and extend the canopy space, thereby lowering hcb.
The crown length, cl, resulted from the difference cl = h hcb = h a × h b . It was calculated based on the relationship between h and hcb. Latter was modelled by the allometric equation hcb = a × h b . The longer the crown the lower the slenderness of the stem and the higher the mechanical stability of a tree [3,8]. An economic disadvantage of longer crowns is certainly the higher number of branches and the shorter branchless stem length. The considered species show a clear ranking in crown length with Scots pine < s. oak < Norway spruce < Douglas-fir < European beech (Figure 8b).
The analyses of crown allometry in fully stocked stands showed characteristic inter-specific differences especially between conifers and broadleaved trees and between light demanding and shade tolerant tree species. Species may further differ in their reaction on a release of competition by spacing, thinning or other disturbances that increase their available growing space.

3.3. Crown Widening by Stand Density Reduction

The extent to which a tree may vary in crown extension in different environments is a crucial requirement for its success in coping with crowding. In the following, we use the cpa-d relationship to show the crowns’ reaction to stand density and competition. Figure 9 is based on 2346 crown projection area measurements of beech crowns in monospecific stands with spacing and thinning, ranging from solitary growing conditions to moderate thinning and self-thinning. The stand age ranged from 57 to 207 years. The data came from various thinning experiments in South Germany and was measured in the years 1980 to 2004 (see Pretzsch et al. 2015 [17]). Regressions for the upper 95% quantile ( cpa = 3.03 × d 0.92 ), the group of moderately and heavily thinned stands ( cpa = 1.05 × d 1.01 ) and the slightly and unthinned plots ( cpa = 0.21 × d 1.36 ) described the broad variation (Figure 9, upper, middle, and lower regression lines). According to these allometric equations, a beech with 25 cm stem diameter occupied 58 m2 when growing without lateral restriction, 27 m2 under medium stand density, and 16 m2 when growing in close to self-thinning conditions. This plasticity equips beech with high competitive strength in intra- and interspecific environments [59,60].
In fully stocked, even-aged monospecific stands the crowns are similar and they are also arranged in the same canopy layer (Figure 6). Therefore, their potential for lateral extension is rather restricted by the light conditions and by mechanical abrasion by neighbors. This strong limitation in fully stocked stands becomes obvious after strong thinning. Then the trees can extend their crowns to their species-specific maximum, determined by, among other things, the wood strength and wood density, as shown below.
The crown projection area, cpa, is a simple measure for the species-specific growing area requirement and area consumption of a tree in a given development status. The cpa area results from the length of the branches, i.e., from their range and mechanical stability. We hypothesize that a key variable for this is the wood strength determined mainly by the wood density. Higher wood density can cause lower swinging of the stem and accordingly lower crown size reduction by mechanical abrasion and also lower crown shyness [55,61]. In addition, wood density may enable longer branches of trees with equal stem and branch diameter [62].
Figure 10 shows a test of this hypothesis, based on mean wood density and allometric crown properties of primary central European tree species. There was a strong positive correlation between the specific wood density R of tree species and their crown projection area or crown radius when they have a stem diameter of 50 cm. To quantify the cpa and cr values for trees with a stem diameter of 50 cm, we calculated 95% quantile regressions, as shown in Figure 10b,d (see model 5 and coefficients in Supplementary Table S1). The wood density was characterized by the dry wood density according to Knigge and Schulz (1966) [63] and Trendelenburg and Mayer-Wegelin (1955) [64]. For the species codes in Figure 10, see column 3 in Supplementary Table S1.
The results in Figure 10 indicate that the crown width allometry may be estimated based on wood density, R. As the crown width allometry further determines the space requirement and species-specific self-thinning at the stand level, wood density turns out to be a species-specific trait that affects developments at the tree level and can be traced to the stand level. Linking the coefficients of allometric equations to structural or functional traits (e.g., shade tolerance, wood density) paves the way to general understanding and generic modeling of tree and stand dynamics.
The limitation of the branch length and crown expansion by the wood density contributes to understanding the characteristic convergence of the upper and lower cpa-d boundary lines in Figure 4 and Figure 9. In the young state, the crown extension can vary in a broad allometric corridor and is mainly determined and restricted by the neighborhood and competitive situation of the tree. With progressing size development, the variation of the crown extension decreases and is mainly restricted by the species-specific wood density (Supplementary Figure S1). Thus, the crown dimensions of trees with different development histories approach the same species-specific limitation and may converge (quantile regression lines in Figure 4 and Figure 9, from left to right.).
Tree species morphology can also depend on site conditions. In this way trees manage to reach the various resources [56,65]. To remedy a limitation by light or water they can extend their above or below ground structural system to even better reach the respective limiting resource by their leaves or roots, respectively [10]. Because of their longevity, they can increasingly adapt their morphology to overcome scarcity of water by expanding their root system on dry sites or overcome light limitation by crown expansion in the shade [45,66,67]. Allometric studies show that the relationship between leaves and fine roots is rather proportional (pipe model theory). However, the investment into the holding structure and pipe system like stem or branches to access light and coarse roots to access water is rather variable and prioritizes the growth of those above or below ground organs which remedy the best the current resource and growth limitation [68,69].
The morphological modifications, species interactions, and growth reactions further vary along gradients of resource supply as follows [70,71]. On sites with scarcity of water and mineral nutrients complementarity and below-ground adaptation are most useful, as they can remedy the limiting resource, while on more fertile sites the below-ground organs are less effective. The above-ground plasticity and interactions are more useful on sites with sufficient water and mineral nutrients supply were more light means more growth. On sites where growth is limited by water or nutrients, additional light interception is less effective.

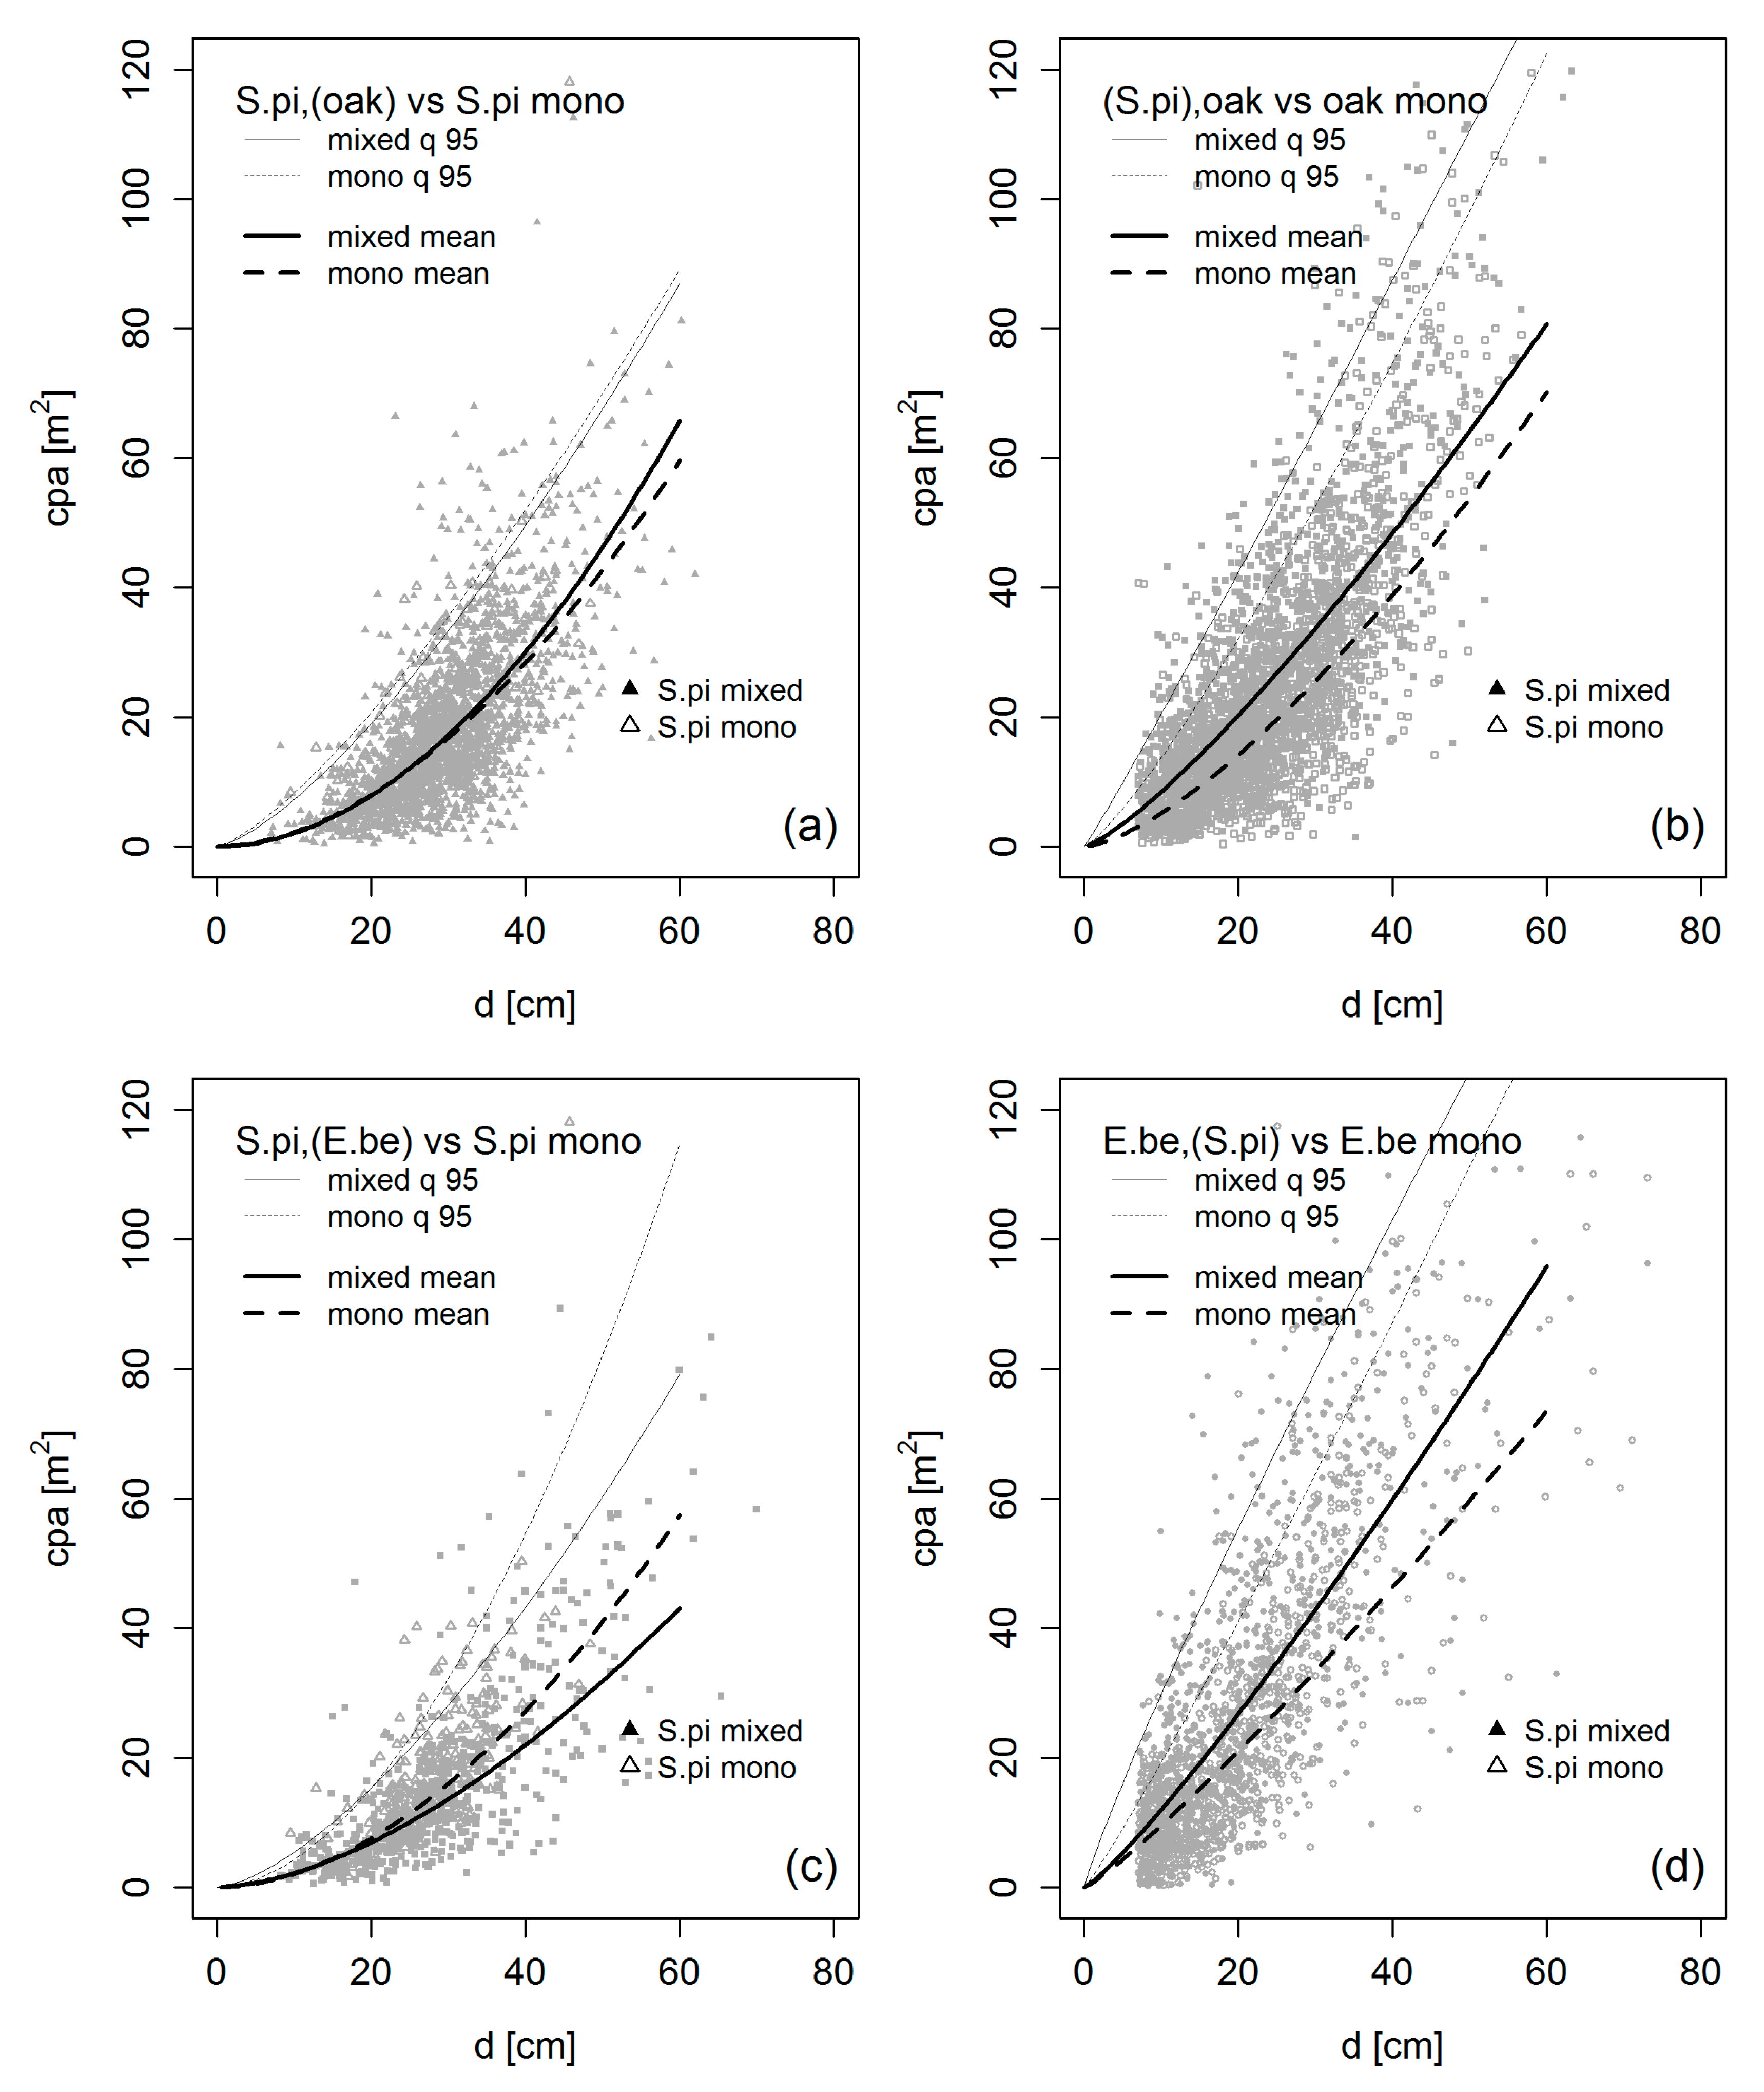
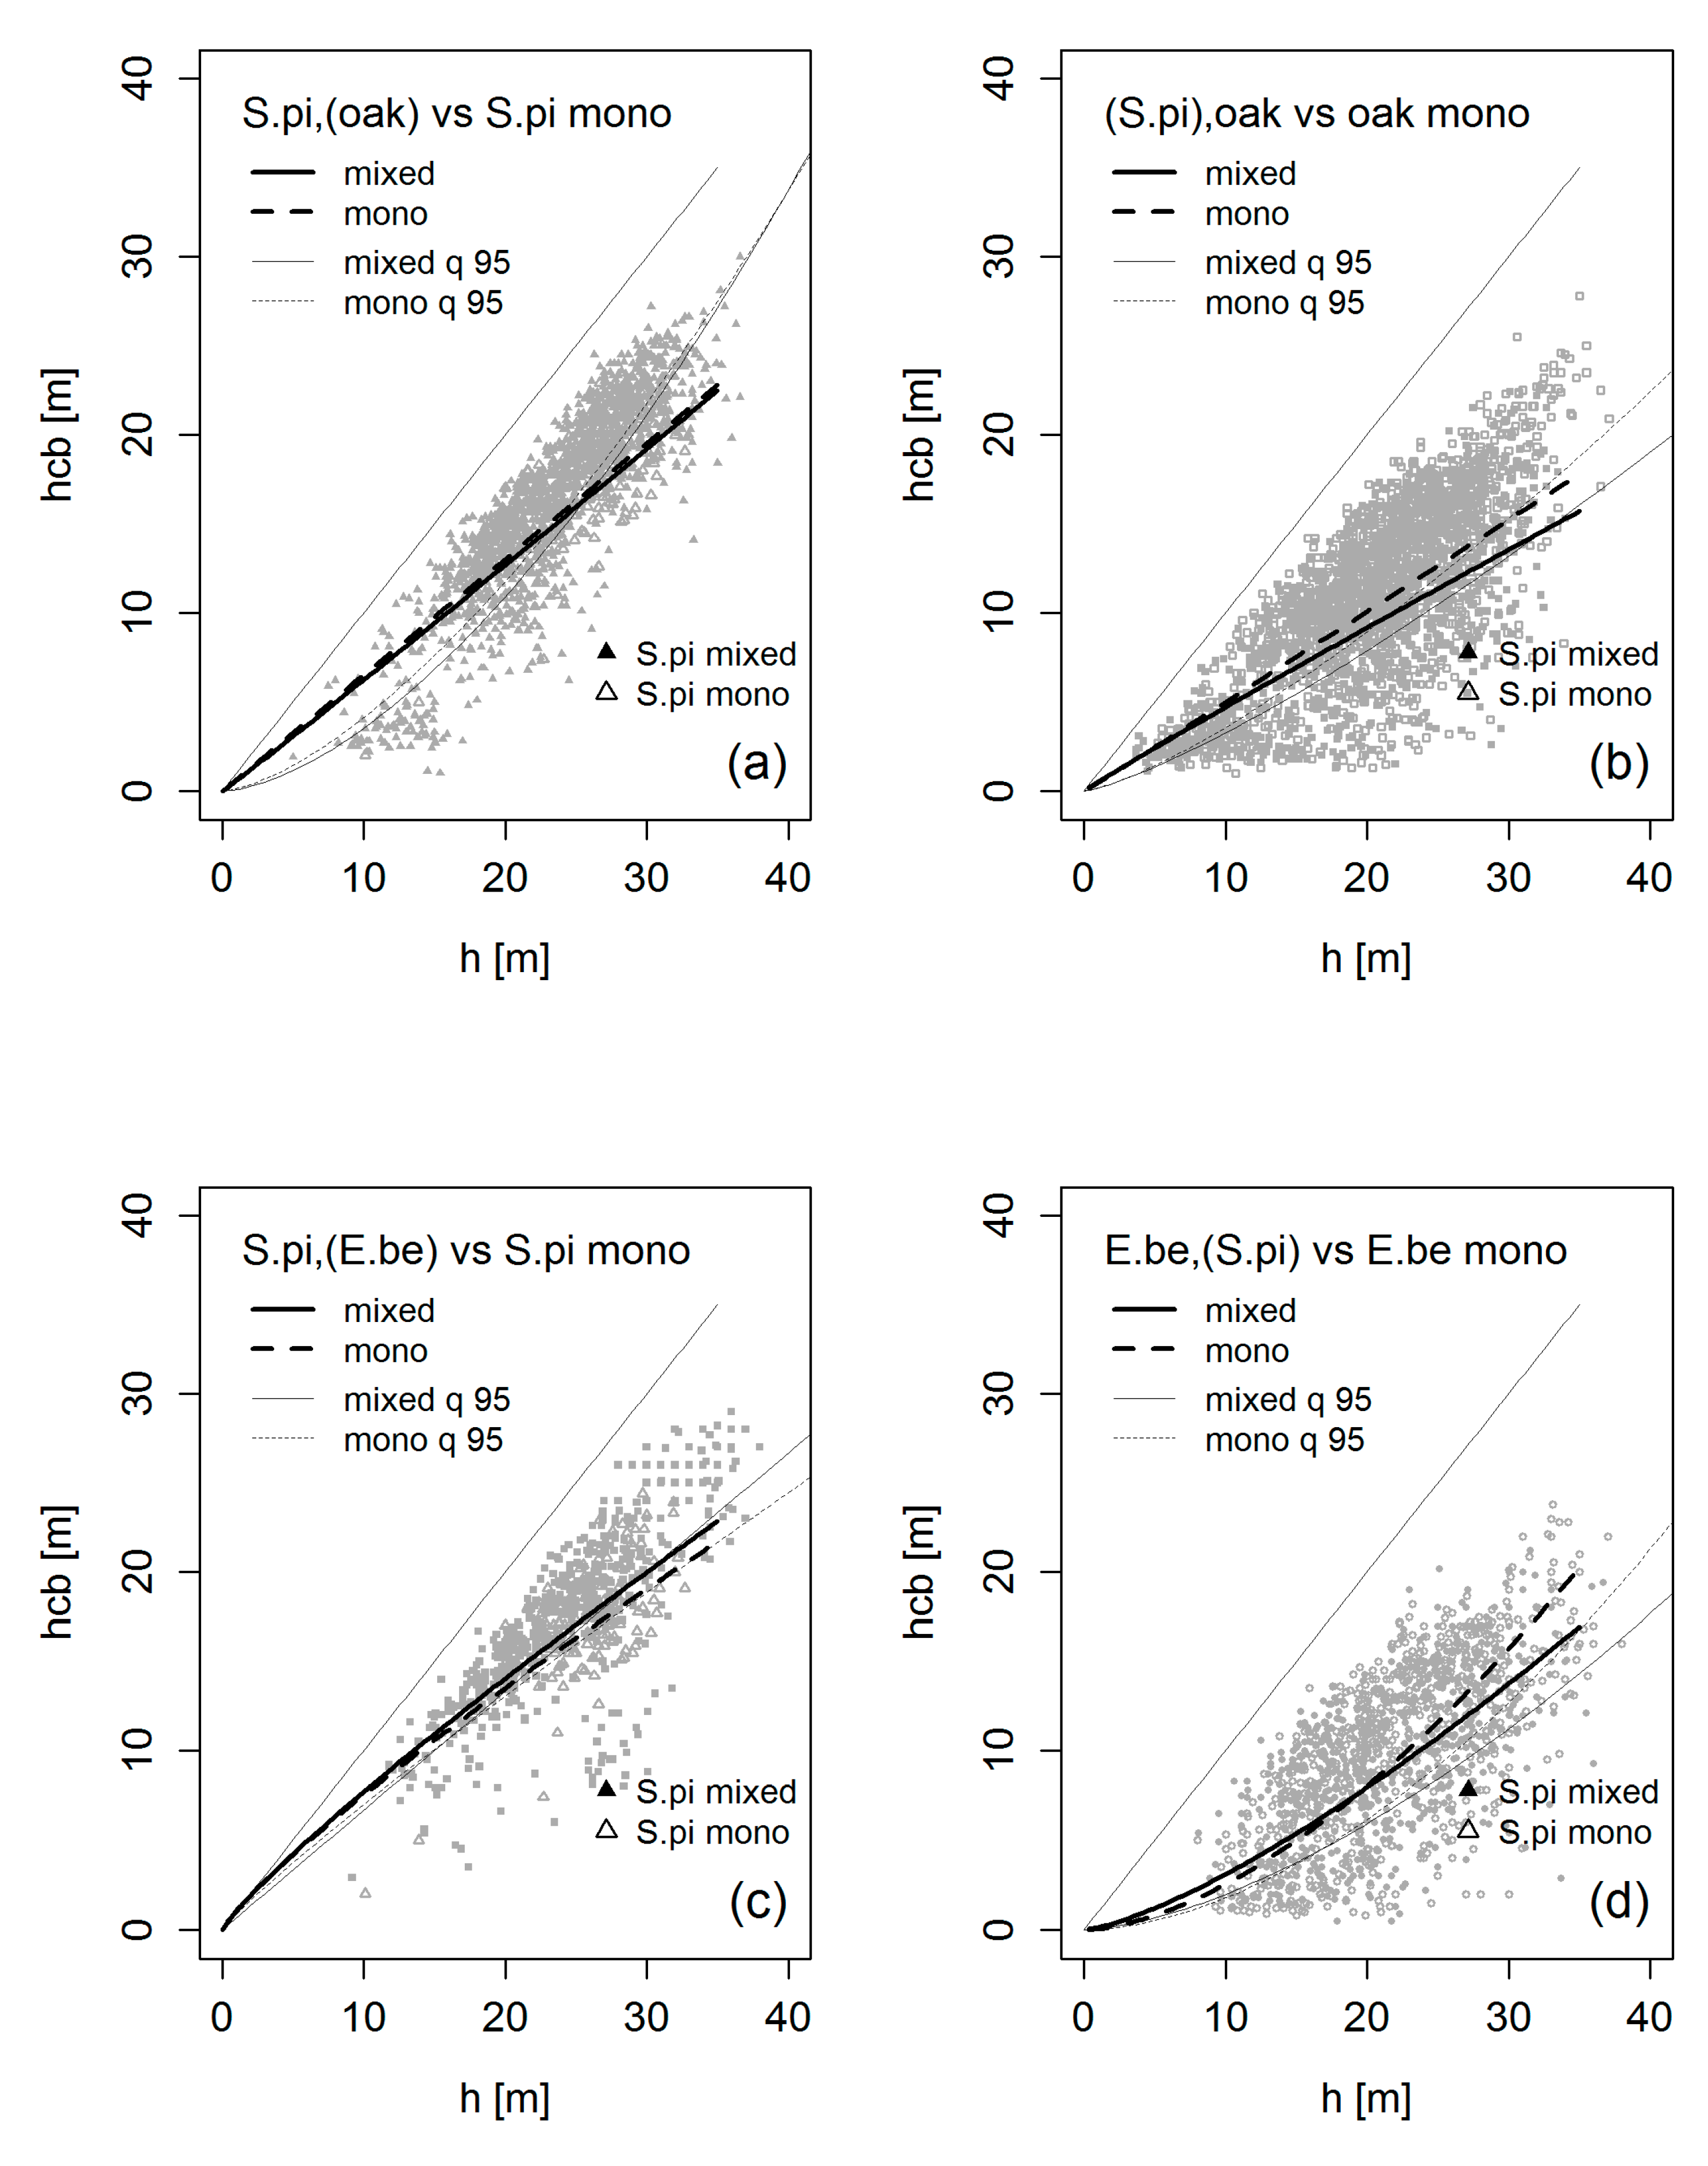
3.4. Crown Allometry in Mixed-Species Stands

The restriction by neighboring trees can be lower in mixed versus monospecific stands when the combined tree species have structural or functional complementary crowns. Figure 8 shows that the crowns of E. beech can be longer and may reach in layers where pine crowns could not survive. In mountain forests E. beech can grow below the crowns of silver fir; and yew tree is even more shade tolerant than E. beech and can live in another layer below beech [72,73]. The vertical and horizontal expansion may be less restricted in mixed-species stands compared with monocultures, where the crowns are similar and compete with similar means for the same space in the same canopy layer. The complementarity can be also temporal when species have different courses of growth within a year or rotation. Therefore, mixing tree species that are complementary in structural or functional traits can potentially reduce the competition, similar to competition release by thinning [10].
Compared with the numerous studies on tree allometry in monospecific stands, systematic analyses of tree allometry in mixed stands, e.g., that by Osunkoya et al. (2007) [74], and especially the effect of mixing on allometry, as analyzed by Sterba et al. (2019) [75], are rather rare. Recent studies suggest that tree species mixing can significantly modify the species-specific crown allometry known from monospecific stands. Bayer et al. (2013) [6], Juchheim et al. (2017) [60] and Metz et al. (2013) [76] exemplified this for European beech.
Figure 11 shows the effect of tree species mixing by comparing the crowns in mixed and monospecific stands of Scots pine and oak and Scots pine and European beech. The evaluation is based on triplets of mixed and monospecific stands sampled along a productivity gradient across Europe (see Heym et al. 2017 [20], Pretzsch et al. 2015, 2019 [17,77]). All stands were fully stocked, close to maximum stand density, and at medium stand age. This means that the crown sizes revealed the natural species-specific capacity to cope with and acclimate to crowding.
In the mixture of Scots pine and oak (Figure 11a,b), both tree species significantly increased their cpa compared to monospecific stands. The Figure shows the competition release based on the mean cpa-d relationships (solid line) and also based on the 95 quantile cpa-d relationship (thin lines).
In the mixture of Scots pine and European beech (Figure 11c,d), Scots pine lost and European beech gained in crown projection area. Table 1, model 6, reveals that mixing changed both, the level as well as the slope of the allometric cpa-d relationship.
Based on the same monospecific and mixed stands, Figure 12 shows similar reaction pattern for the hcb-d allometry. Both oak and beech achieved longer crowns and lower hcb values in mixed compared to monospecific stands. Pine, in contrast, hardly changed the hcb-h relationship in mixed compared to mono-specific stands.
Figure 13 underlines that in mixture, species can further acclimate to their spatial niche by modification of the center of gravity [5]. This analysis is based on the same plots as the previous two figures. It underlines that in addition to the length and width of the crowns, mixing can also modify the crown profile [5], crown eccentricity [10], and the number and angle of branches [6].
This section provided evidence that the mean crown reduction or expansion in mixed versus monospecific stands can be, e.g., 10–20 m2 in terms of cpa or 1–2 m in hcb in terms of height to crown base at the individual tree level. In the mixture of Scots pine and oak, both species benefited from the mixture, and in the mixture of Scots pine and European beech, pine reduced and beech expanded the crown size. In the next section, we analyze the relevance of this individual tree crown behavior for the total crown area, canopy density, and stand density.

4. Tracing the Effect of the Individual Tree Allometry to the Stand Level

4.1. Crowns and Self-Thinning in Mono-Specific Stands

Species-specific crown size and stand density in mono-specific stands are closely linked. The larger the species-specific crowns are, the lower the tree number per unit area is in a stand with a given quadratic mean diameter. Figure 14 shows the reciprocal relationship between the stand density index, SDI, by Reineke (1933) [27] and the crown projection area (for trees of 25 cm stem diameter) for the 14 common tree species Norway spruce, silver fir, Scots pine, European larch Larix decidua Mill., European beech, sessile/common oak, Douglas-fir, sycamore maple, common ash Fraxinus excelsior L., hornbeam, white birch Betula pendula Roth, lime tree Tilia cordata Mill., wild cherry Prunus avium L., red alder Alnus rubra Bong. For this purpose, we selected long-term experiments for which both fully stocked stands for derivation of N-dq and crown measurements for derivation of cpa-d relationships were available. The N-dq and cpa-d relationships were fitted by OLS regression. We then inserted 25 cm diameter as an independent variable into the respective equations, and read off the respective SDI and cpa d25 values. We then plotted SDI over cpa d25 and fitted the relationship by a hyperbola regression (see Figure 14 and Table 1, model 8).
In the case of a stand exactly onefold covered by crown area we can expect N × cpa   = 10,000   m 2 and N   = 10,000   /   cpa . Our regression analysis based on the empirical data yielded a slightly different but also reciprocal relationship SDI = 8637.4 + 183.4 × ( 1 / cpa ) . The deviation from the expected relationships may result among others from the fact that even fully stocked stands often have no full crown coverage due to crown shyness. By multiplying SDI = 8637.4 + 183.4   × ( 1 / cpa ) on both sides with cpa, we get to the sum of crown projection area of a stand per hectare. In our case we arrive at   SCPA = SDI × cpa   d 25 = 8637.4 + 183.4 = 8820.8 which indicates that on average (at that state of stand development of dq = 25 cm), the sum of crown projection area per stand in monocultures was 8821 m2 of 10,000 m2. This means that the sum of cpa amounts to 88% of the stand area.
The competition for growing space by crown expansion and the resulting self-thinning may often be more rigorous in monocultures where the trees compete with similar crowns for similar spatial niches. Structural complementarity may reduce this competition for space, increase the packing density and thereby increase also the number of surviving trees per unit area. Thus, there could certainly be cases in natural, mixed stands where competition for growing space is equal to or exceeds monocultures. With growing crown size certainly in both monospecific and mixed-species stands the tree number will continuously decrease. In mixed stands, this tree number reduction might be slower. The reason may be that the crowns can better expand if they have complementary structures, are arranged in different layers, or show complementarity in their shape development over time.

4.2. Crown Allometry and Stand Density in Mixed-Species Stands

Figure 14 showed for fully stocked monospecific stands as a rule a reciprocal relationship between the crown extension and the trees per hectare. The more crown space demanding a tree species is, the lower the potential number of surviving individuals per hectare. In the following we compare this pattern between mixed and monospecific stands. To understand how tree species mixing modifies the tree number-crown size-relationship we analyzed the N-cpa relationship for the mono-specific and neighboring mixed-species stands of the triplets introduced in Section 2.3.
The results for the monocultures (Figure 15a) also substantiated a clear reciprocal relationship between N-cpa and progressing stand development: the larger the crowns become, the fewer trees can survive per unit area. In the mixed-species stands (Figure 15b), the reaction pattern was similar, but mixed stands enable a higher number of survivors per unit area. Please note that the monospecific stands on the left and the mixed-species stands represent the same species and site conditions.
Statistical analysis showed a clear effect of mixing on both intercept and slope of the statistical relationship (see Table 1, model 9). The level of the tree number was higher and the slope of the N-cpa relationship was shallower in mixed stands. This means there were more trees per hectare in mixed stands, and there was a slower decrease of tree number with progressing stand development. For instance, for mean crown sizes of 25 m2, 50 m2, and 100 m2, the tree numbers were 32, 51, and 74% higher (560 vs. 423, 261 vs. 173, and 122 vs. 70 trees ha−1), respectively, in mixed compared to monospecific stands.
The relevance of this raised N-cpa relationship for the dynamics and management of forest stands becomes more obvious from the following transformation. N = a × cpa α N , cpa can be transformed to the sum of crown projection area, SCPA = ( a × cpa α N , cpa ) , by multiplication by cpa on both sides of the former equation. This multiplication yields the sum of crown projection area, SCPA, per hectare of the stands. SCPA = 10,000 m2 would indicate an average one-fold coverage of the stand area by crowns, SCPA = 5000 m2 would indicate a 0.5-fold and 15,000 m2 a 1.5-fold coverage by crowns.
Figure 15d shows that the SCPA values were always above 10,000 m2 in the mixed-species stands. This means a higher level and slower decrease of crown coverage in mixed compared with monospecific stands. Monospecific stands showed higher SCPA values just in young stands. Later, the SCPA values decreased strongly below full coverage (10,000 m2) due to reasons discussed in Section 3.1.
The consequences for stand growth and dynamics are obvious: mixed stands are less gappy and their canopy space more densely packed with crowns. This may equip mixed stands better than monospecific stands for keeping growth on a high level in an advanced stand development state [78,79], where in monospecific stands, crown density is reduced by accelerated self-thinning, crown shyness, and biotic or abiotic damage. This advantage of higher density of mixed stands applies even more in managed stands, where trees may be thinned in early state and the reduced number of remaining trees may become too low for achieving the potential maximum growth [80,81].
Analysis of the N-cpa relationship revealed higher tree numbers because of a higher sum of crown projection area in mixed compared to monospecific stands. The relationship between N and cpa is valuable for analysis and causal explanation. However, for forest practice, management and silvicultural guideline formulation the N-dq relationship is more common, as the tree diameter is easier to measure and mostly available in forest practice. Thus, we proceed with the effect of the specific N-cpa relationship on the N-dq relationship in mixed versus monospecific stand.
As a suitable measure for analyzing whether the density in terms of tree number and tree diameter differs between mixed and monospecific stands, we applied the relative RSDI   = SDI mixed / SDI mono [82]. The   SDI mixed was derived as the sum of SDI 1 , ( 2 ) + SDI ( 1 ) , 2 / DEC sp 1 sp 2 . SDI 1 , ( 2 ) and SDI ( 1 ) , 2 are the SDI’s of the respective tree species in the mixed stand and DEC sp 1 sp 2 is the equivalence coefficient for considering species-specific differences in the growing area requirement and maximum stand density. DEC values were derived directly from the pair of monospecific stands for each survey period ( DEC = SDI 2 / SDI 1 ). We used E. beech as reference species and standardized the other tree species to beech. In case of the mixture of Scots pine and s. oak we chose s. oak as standard species. For detailed derivation of this approach see Pretzsch (2019) [19] and Pretzsch and del Río (2019) [83].
The resulting SDI mixed values were divided by SDI mono so that RSDI = SDI mixed / SDI mono reflects the mean over- or underdensity of mixed compared to monospecific stands (Table 2). Interesting are especially the mean values of overdensity up to 28% in case of the mixture of Douglas-fir and European beech.
For density regulation of mixed-species stands, any over- or underdensity with progressing stand age is even more important than the mean effects shown in Table 2. Figure 16 shows characteristic differences between the N-dq relationship of mono- and mixed-species stands with progressing stand development. In the mono-specific stands (a) of European beech, Douglas-fir and European beech, and Scots pine and sessile oak the tree numbers were on a higher level and decreased on average more steeply compared with the mixed-species stands (b) of the same species. The results of the statistical tests of differences between the intercepts and slopes in mixed versus monospecific stands are presented in Table 1, model 10. For comparison of mixed with monospecific stands, we applied the standardization on E. beech and s. oak, respectively, by equivalence coefficients as introduced above.
Figure 16c visualizes the development of standardized observed and expected N-dq developments (for detailed derivation of the standardized observed and expected N-dq values see Supplement Explanation S1). We further used these N-dq lines for setting the standardized observed development in relation to the expected development of the mixed stands. Figure 16d shows the result in linear representation. This reveals the interesting finding that the density differences between mixed and monospecific stands changed over time. In case of the mixture of Norway spruce and European beech mixed stands were more dense in the early state and fall below monospecific stands with increasing stand development. In other mixtures the superiority in density increased with progressing stand development, and in case of Scots pine and s. oak and Scots pine and E. beech, the superiority remained constant along the dq-axis.
We found that by some tree species combinations, the maximum stand density can be reduced; for others, it can be considerably increased by mixing. The consequences for deriving maximum stand density, density regulation and development of silvicultural guidelines are demonstrated for three selected mixtures in Figure 17.
Figure 17 suggests that tree species mixing should be considered when quantifying and applying maximum stand density relationships and thinning guidelines for mixed-species stands [84]. Obviously, the maximum stand density can be at least temporarily lower but also higher in mixed compared to monospecific stands. The analyses of crown allometry and SCPA values in the previous sections explained why the density might be higher in mixture of complementary tree species. Examples of complementary tree species mixtures are s. oak and European beech or Douglas-fir and European beech, whereas Norway spruce and European beech are more similar and have a lower potential of overdensity. Note that the differences in density appear to be minor in the double-logarithmic N-dq representation, but more obvious and relevant in the BA-dq curves in Figure 17d–f.

5. Discussion

5.1. Crown Allometry and Stand Density in Mixed versus Monospecific Stands

The key drivers for tree and stand growth are available soil water, temperature, nutrients, light and CO2 [85]. To remedy a limitation by light or water they can extend their above or below ground structural system to even better reach the respective limiting resource by their leaves or roots, respectively [10]. Because of their longevity, trees can increasingly adapt their morphology to overcome scarcity of water by expanding their root system on dry sites or overcome light limitation by crown expansion in the shade [66,67,86].
In addition, space can be considered as a resource [87]. The widely extending crown of a mature beech can occupy a growing area of 200–250 m2 and easily 5000 m3 of canopy space. Due to the longevity and high shade tolerance of trees, this space is inaccessible for most other trees. This demonstrates well that space can be limited, contested, and a resource in itself. Crown extension means occupation of canopy space that is no longer available for competing neighbors, or at least not fully available for members of the same species. Those trees with continuous size growth and crown extension restrict the space and growth of others; thus, they may cause the dropout of neighbors, and drive self-thinning and tree number reduction.
In this review, we used crown size characteristics as a reasonable proxy for both leaf area (light interception) and canopy space requirement (space occupation). The crown projection area and crown length are much easier to measure at individual tree level then leaf area and they are often available from past inventories of long-term plots. The crown size and shape represent the holding fixture of leaves and the light interception and they also indicate the canopy space sequestration of individual trees as they result from tree-tree interaction. Therefore, they offered new insights into the behavior of trees in mixed compared with monospecific stands.
The forest stands analyzed for this review represent mainly sites where tree growth was limited by light and the necessary growing space, i.e., we can assume that crown growth is not primarily limited by water or mineral nutrients. In the even-aged monocultures, the morphology and structure of the individuals is rather similar, and the trees compete for resources in the same spatial and temporal niches (canopy layer, soil horizon, time of the growing season). In fully stocked young stands, the crown extension is concentrated in the same layer and closely restricted by light. The trees with more expanding crowns may outcompete their neighbors according to the principle “me or you” and drive the self-thinning process. In advanced stand development phases, the trees, if swaying in the same layer, can cause mechanical abrasion and crown shyness [55]. Meng et al. (2006) [88] showed that a prevention of crown collisions by fixing the trees by ropes can increases the crown cover and leaf area of mature stands. This underlines the importance of mechanical abrasion for natural density regulation [61]. In monospecific stands, the density and the level of the self-thinning line is closely related to crown size. The wider the crown expansion, the lower the tree number at a given mean diameter. The crown expansion with progressing stand development determines the intercept and slope of the self-thinning line.
In mixed stands, certainly, more space-demanding species also cause lower tree numbers per unit area and the tree number reduction also increases with species-specific crown expansion. However, in contrast to monospecific stands, there can be a reduction of competition simply because of the species’ differences in morphology and their preferred spatial niches for foraging [89,90]. Structural complementarity may modify the competition from a “me or you” to a “me and you” principle. It may increase the packing density and thereby the survival of more trees per unit area. With growing crown size, certainly, in both monospecific and mixed-species stands, the tree number will continuously decrease. However, in mixed stands, it may decrease slower, as the crowns can expand if they have complementary structures, are arranged in different layers, or show complementarity in their shape development over time.
Beyond this complementarity and competition reduction the trees in mixed-species stands may on the long modify their morphology compared with monocultures as they may be less restricted by neighbors. Trees can adapt to their spatial niche in a specific canopy layer or soil horizon [6,10]. Seen in the long term, their morphology and structure might become significantly different from monocultures, as they adapt to their inter-specific neighborhood. Growing in inter-specific neighborhood may allow a wider crown extension [60,76] and modify the root structure and reach [91,92]. In this way they may exploit the resources that neighbors of the other species are less able to access. The species-specific spatially complementary resource access and the morphological adaptation to growing in mixture both can increase the resource availability, growth and packing density of forest stands [11].
To what extent growth, crown morphology, and tree structure can be modified by tree species mixing depends mainly on the tree species, species combination, site conditions, stand development phase, and also on the stand structure (stand density, vertical and horizontal mixing pattern). Tree species with further reaching and more morphologically plastic crowns such as European beech or silver fir [10] can better occupy additional space emerging in mixture than less plastic species such as Norway spruce or Scots pine (silver birch). Regarding root reach and plasticity, sessile oak and Scots pine are more plastic than Norway spruce, hornbeam or willow species Salix [93,94]. Combinations of species with high complementarity have a higher potential for additional resource exploitation in mixtures compared with monocultures than other similar tree species. Mixtures of shallow and deep rooting, light demanding and shade tolerant, or seasonal and evergreen species have a higher potential of spatial or temporal separation of resource acquisition.
We found a higher packing density of canopies compared to monocultures especially in the mature stand phase of mixed stands. In the mature development phase canopies of monocultures often become gappy due to crown shyness or disturbances. In mixed stands, crowns are arranged in different layers so that the canopy is kept denser [10], and in contrast to monocultures, crown shyness is reported only occasionally for some species, and in special development phases in mixed stands [61].
The sum of crown projection area, SCPA, can become much higher in mixed compared to monospecific stands and can cause a growth resilience to disturbances of the canopy structure. Trees in the medium or lower layer may compensate losses by removed or dropped-out dominant trees. Therefore, the resources may be accessed more completely and with less initial outlay in terms of stem, branch and root growth for coping with similarly functioning neighbors. The competition reduction may be the stronger the more different the structure and functioning of the neighboring tree species [89,95].

5.2. Tracing Crown Allometry to the Stand Level

If two or more tree species grow in mixture, the resulting density, growth, and mortality of the mixed-species stands are often not just the weighted mean of the species behavior in monocultures [96]. The emerging multiplicative effects are among others caused by the species-specific structures of the tree crowns. In mixed stands, the species-specific crown shapes can complement each other in space occupation whereas in mono-specific they are rather similar. This complementarity can be further enhanced by the crowns’ acclimation to growing in mixture. For instance, crowns of European beech are often longer than the crowns of most other species even in monocultures. However, they can become even longer in mixed-species stands with light demanding species like pine or larch due to their crown transparency.
We saw that European beech can adapt its crown profile to mixture by shifting its center of gravity and widest extension some 5 m downwards along the stem axis (Figure 13). Such mixing reactions at the tree level were traced to the stand level. At the stand level, they may change the stand density, volume growth, and mortality by self-thinning. One option to consider these multiplicative effects of the species mixing on the characteristics of mixed stands is the application of correction factors (Table 2, Pretzsch 2016 [97]). This may provide silviculture and forest management with more appropriate information about mixed stands.
However, the number of mixed-species experiments for the statistical derivation of such correction factors or other statistical approaches for estimation of the maximum stand density in more complex forests [85] is still very limited. A second option is an improved integration of species-specific crown characteristics and behavior in individual tree models. This option allows the deduction of stand-level characteristics from individual tree behavior. In this review, we showed the potential of this option. The crown characteristics strongly traced from the tree to the stand level in mono-specific and even more clearly in mixed-species stands.

5.3. Consequences for Modelling

Recent studies showed for some common tree species combinations overyielding by 10–25% as a concomitant of overdensity by 10–20% of mixed versus monospecific stands [23,98,99,100]. Such findings at the stand level can be compiled and used as correction factors [97,101] when applying models originally developed for monospecific stands for mixed stands. For example, yield table data for the stand density and periodical annual volume increment of monocultures of Norway spruce and European beech may be applied for mixed stands of both species by calculating the weighted mean density and growth. This can be based on the yield data of the species-specific yield tables and the mixing proportions of the species in the respective stand. The resulting stand characteristics may be multiplied by generalized correction factors in order to consider any overyielding and overdensity compared with the applied yield tables. This represents a practical black box approach at the stand level that leaves the causes of the mixing effects and their dependency of site conditions, mixing proportions, mixing patterns and silvicultural treatment unconsidered.
Here, we showed how the behavior of the crown can be used for better understanding and modelling the stand dynamics-based and starting at the individual tree level but ending with stand level data. The crown shape and shape development seems to essentially contribute to better understanding and modelling tree species interactions in terms of complementarity. The tree species interaction effects observed at the individual tree level can be traced to the density, growth and self-thinning at the stand level.
Tree level-based models have the advantage that they can deduce the reaction patterns for the whole continuum of mono- and mixed-species stands mechanistically from the tree-tree interactions [102,103,104], and especially from the crown-crown interactions [105,106]. Another advantage is the suitability of individual tree models for modelling the silvicultural interventions in mixed stands. Common silvicultural measures such as individual tree selection, regulation of mixing patterns and proportions or regulation of threshold distances between future crop trees requires individual, spatially dependent model approaches.

5.4. Consequences for Stand Density Regulation

Mixed stands of tree species with complementary crown allometry can achieve higher canopy packing and stand density especially in the advanced development phase of forest stands. Mixed stands of the rather complementary species Scots pine and European beech or sessile oak and beech can be 10–25% denser in terms of standardized SDI values than monospecific stands. In contrast, mixtures of Norway spruce and European beech are less complementary and leave the maximum stand density close to the level of the respective monocultures. Any changes in maximum stand density are relevant for silvicultural stand assessment and density regulation.
The natural maximum stand density is commonly used as reference for defining density reduction and regulation for silvicultural guidelines. In this case, the site-specific maximum density is used as ceiling density and any desired density trajectories are formulated in relation (percental lowering in terms of basal area, tree number, or SDI) to the maximum.
Density may increase the size growth and stability of remaining trees but should be carefully assessed and regulated as density reduction can also cause stand growth decrease. Thus, any neglect or underestimation of the maximum stand density may cause growth losses. We showed that in the juvenile phase, monospecific stands may have similar or even higher stand densities as mixed stands. However, in the advanced stand age, monoculture canopies may become gappy and understocked due to previous silvicultural thinnings, calamities, or crown shyness. This density reduction can have negative effects on stand growth. Mixed-species stands, in contrast, may become superior because of their multilayered denser canopy, which can maintain a higher stand density and growth.

6. Conclusions

Mixed-species forests are on the advance, and this requires appropriate methods for their establishment and regulation. However, most of the existing knowledge of tree structure, crown variability, and space occupation is based on monospecific stands, where all individuals engage in rather similar behavior to compete for growing space and resources. In mixed-species stands, in contrast, trees may exhibit their full inter- and intra-specific structural variability and plasticity. Their traits probably developed by co-evolution in mixed-species stands but have become less visible and important in artificial monocultures. As shown in this paper, the tree crown allometry in mixed-species stands can considerably differ from monospecific stands. The tree crown allometry proved to be essential for understanding, appropriate modelling, and silvicultural regulation of mixed stands.
An important prerequisite for improving the knowledge of species-specific tree structure and space occupation in species mixture are continuous allometric analyses of various kinds of tree species mixtures as realized in ongoing studies [107,108,109]. For any generalization, a broad overview of the allometry of functionally different tree species in different mixing proportions, patterns and under different site conditions is needed. Of special value are species assemblages with rather similar and different structural traits. In this paper, we showed that the structural traits of a species, including its crown and root variability and plasticity, represents the species potential to acquire resources and occupy space. Depending on the species composition in its neighborhood and the resource supply at the given site, a species may exhaust its structural potential to acquire resources and occupy growing space that is not sufficient for all.
Compared with classical tree physiological measurements of fluxes of sap and water or measurement of assimilation of light and CO2, space occupation and structure of trees was much more difficult to access and therefore rarely measured in detail in the past. Especially terrestrial and airborne LiDAR technology considerably improved the access to the 3D structure of trees and forest stands. By repeated measurement, even the 4 D dynamics of trees and forests becomes measurable. So the information about the flux of the resources for tree growth and about their utilization for structural expansion of trees and their space occupation becomes more balanced. This may improve the understanding of the interactions between resource provision and structural assembly and promote the coupling of both aspects in tree and stand models. A better representation of tree structure, space occupation and the relationship between structure and the physiological processes has the potential to improve the further development and the application of spatially explicit tree and forest stand models. Multifunctional forest management requires information about many ecosystem services [110] beyond wood and timber. Many ecosystem services, such as structural diversity, protection against disturbances, habitat provision or recreation are linked with tree and stand structure and can be assessed, regulated, and predicted by spatially explicit models.

Supplementary Materials

The following are available online at https://www.mdpi.com/1999-4907/10/9/810/s1. Table S1: Allometric factors a0 and allometric exponents a1 resulting from the 95% quantile regression models 5: ln(crk ) = a0 + a1 × ln(dk) + εk and ln(cpak) = a0 + a1 × ln(dk) + εk. The tree species codes correspond with Figure 10. Figure S1: Visualization of a concept for the changing cpa-d relationship of trees with progressing size development. In the young state the crown extension can vary in a broad allometric corridor and is mainly determined and restricted by the neighborhood and competitive situation of the tree. With progressing size development the variation of the crown extension decreases and is mainly restricted by the species-specific wood density. Thus, the crown dimensions of trees with different development histories approach the same species-specific limitation and may converge. The limitation of the branch length and crown expansion by the wood density contributes to understanding the characteristic convergence of the upper and lower cpa-d boundary lines (see e.g., Figure 4 and Figure 9). Explanation S1: Detailed derivation of the standardized observed and expected N-dq values shown in Figure 16.

Author Contributions

H.P. conceptualized the study, developed the methods, acquired the data, invented the statistical analysis, wrote the paper, and acquired the funding.

Funding

This research was funded by the German Science Foundation (Deutsche Forschungsgemeinschaft), grant # PR 292/15-1 “Structure and dynamics of mixed-species stands of Scots pine and European beech compared with monospecific stands. Analysis along an ecological gradient through Europe”, the European Union grant # 2816ERA02S, PCIN2017-026 “Mixed species forest management. Lowering risk, increasing resilience (REFORM)” under the framework of Sumforest ERA-NET, and the Bavarian State Ministry for Nutrition, Agriculture, and Forestry, grant # 7831-22209-2013 ”Long-term experimental plots for forest growth and yield research W07“.

Acknowledgments

The author wishes to thank the German Science Foundation for funding the project “Structure and dynamics of mixed-species stands of Scots pine and European beech compared with monospecific stands. Analysis along an ecological gradient through Europe” (# DFG PR 292/15-1) and the European Union for funding the project “Mixed species forest management. Lowering risk, increasing resilience (REFORM)” (# 2816ERA02S, PCIN2017-026) under the framework of Sumforest ERA-NET. Thanks are also due to the Bayerische Staatsforsten (BaySF) for supporting the establishment of the plots and the Bavarian State Ministry for Nutrition, Agriculture, and Forestry for permanent support of the project W 07 ”Long-term experimental plots for forest growth and yield research“ (# 7831-22209-2013). Thanks also go to Hubert Sterba for initiating this special issue and to two anonymous reviewers for their constructive criticism.

Conflicts of Interest

The author declares no conflict of interest.

References

  1. White, E.P.; Ernest, S.M.; Kerkhoff, A.J.; Enquist, B.J. Relationships between body size and abundance in ecology. Trends Ecol. Evol. 2007, 22, 323–330. [Google Scholar] [CrossRef] [PubMed] [Green Version]
  2. Knoke, T.; Ammer, C.; Stimm, B.; Mosandl, R. Admixing broadleaved to coniferous tree species: A review on yield, ecological stability and economics. Eur. J. For. Res. 2008, 127, 89–101. [Google Scholar] [CrossRef]
  3. Pretzsch, H.; Rais, A. Wood quality in complex forests versus even-aged monocultures: Review and perspectives. Wood Sci. Technol. 2016, 50, 845–880. [Google Scholar] [CrossRef]
  4. Enquist, B.J.; Brown, J.H.; West, G.B. Allometric scaling of plant energetics and population density. Nature 1998, 395, 163–165. [Google Scholar] [CrossRef]
  5. Barbeito, I.; Dassot, M.; Bayer, D.; Collet, C.; Drössler, L.; Löf, M.; Pretzsch, H. Terrestrial laser scanning reveals differences in crown structure of Fagus sylvatica in mixed vs. pure European forests. For. Ecol. Manag. 2017, 405, 381–390. [Google Scholar] [CrossRef]
  6. Bayer, D.; Seifert, S.; Pretzsch, H. Structural crown properties of Norway spruce (Picea abies [L.] Karst.) and European beech (Fagus sylvatica [L.]) in mixed versus pure stands revealed by terrestrial laser scanning. Trees 2013, 27, 1035–1047. [Google Scholar] [CrossRef]
  7. Olivier, M.D.; Robert, S.; Fournier, R.A. Response of sugar maple (Acer saccharum, Marsh.) tree crown structure to competition in pure versus mixed stands. For. Ecol. Manag. 2016, 374, 20–32. [Google Scholar] [CrossRef]
  8. Rottmann, M. Wind—Und Sturmschäden im Wald; Verlag: Bad Orb, Germany, 1986. [Google Scholar]
  9. Zeide, B. Tolerance and self-tolerance of trees. For. Ecol. Mngt. 1985, 13, 149–166. [Google Scholar] [CrossRef]
  10. Pretzsch, H. Canopy space filling and tree crown morphology in mixed-species stands compared with monocultures. For. Ecol. Manag. 2014, 327, 251–264. [Google Scholar] [CrossRef] [Green Version]
  11. Morin, X.; Fahse, L.; Scherer-Lorenzen, M.; Bugmann, H. Tree species richness promotes productivity in temperate forests through strong complementarity between species. Ecol. Lett. 2011, 14, 1211–1219. [Google Scholar] [CrossRef]
  12. Pretzsch, H. Re-Evaluation of Allometry: State-of-the-Art and perspective regarding individuals and stands of woody plants. In Progress in Botany 71; Lüttge, U., Beyschlag, W., Büdel, B., Francis, D., Eds.; Springer: Berlin/Heidelberg, Germany, 2010; pp. 339–369, 400. [Google Scholar]
  13. West, G.B.; Brown, J.H.; Enquist, B.J. A general model for the origin of allometric scaling laws in biology. Science 1997, 276, 122–126. [Google Scholar] [CrossRef] [PubMed]
  14. West, G.B.; Enquist, B.J.; Brown, J.H. A general quantitative theory of forest structure and dynamics. Proc. Natl. Acad. Sci. USA 2009, 106, 7040–7045. [Google Scholar] [CrossRef] [PubMed] [Green Version]
  15. Dahlhausen, J.; Biber, P.; Rötzer, T.; Uhl, E.; Pretzsch, H. Tree Species and Their Space Requirements in Six Urban Environments Worldwide. Forests 2016, 7111, 111. [Google Scholar] [CrossRef]
  16. Poorter, L.; Bongers, F.; Sterck, F.J.; Wöll, H. Architecture of 53 rain forest tree species differing in adult stature and shade tolerance. Ecology 2003, 84, 602–608. [Google Scholar] [CrossRef]
  17. Pretzsch, H.; del Río, M.; Ammer Ch Avdagic, A.; Barbeito, I.; Bielak, K.; Brazaitis, G.; Coll, L.; Dirnberger, G.; Drössler, L.; Fabrika, M.; et al. Growth and yield of mixed versus pure stands of Scots pine (Pinus sylvestris L.) and European beech (Fagus sylvatica L.) analysed along a productivity gradient through Europe. Eur. J. For. Res 2015, 134, 927–947. [Google Scholar] [CrossRef]
  18. Pretzsch, H.; Biber, P.; Uhl, E.; Dahlhausen, J.; Rötzer, T.; Caldentey, J.; Koike, T.; van Con, T.; Chavanne, A.; Seifert, T.; et al. Crown size and growing space requirement of common tree species in urban centres, parks and forests. Urban For. Urban Green. 2015, 14, 466–479. [Google Scholar] [CrossRef]
  19. Pretzsch, H.; (Centre of Life and Food Sciences Weihenstephan, Technical University of Munich, Hans-Carl-von-Carlowitz-Platz 2, 85354 Freising, Germany). Weiterentwicklung der Dichte—und Mischungsregulierung forstwirtschaftlich wichtiger Baumarten. Äquivalenz-Koeffizienten und Dichte-Steigerungs-Koeffizienten für generische waldbauliche Behandlungsalgorithmen, Allgemeine Forst- und Jagdzeitung. Unpublished work. 2019. [Google Scholar]
  20. Heym, M.; Ruiz-Peinado, R.; del Rio, M.; Bielak, K.; Forrester, D.I.; Dirnberger, G.; Barbeito, I.; Brazaitis, G.; Ruskytke, I.; Coll, L.; et al. EuMIXFOR empirical forest mensuration and ring width data from pure and mixed stands of Scots pine (Pinus sylvestris L.) and European beech (Fagus sylvatica L.) through Europe. Ann. For. Sci. 2017, 74, 9. [Google Scholar] [CrossRef]
  21. Pretzsch, H.; Block, J.; Dieler, J.; Dong, P.H.; Kohnle, U.; Nagel, J.; Spellmann, H.; Zingg, A. Comparison between the productivity of pure and mixed stands of Norway spruce and European beech along an ecological gradient. Ann. For. Sci. 2010, 67, 712. [Google Scholar] [CrossRef]
  22. Pretzsch, H.; Bielak, K.; Block, J.; Bruchwald, A.; Dieler, J.; Ehrhart, H.P.; Kohnle, U.; Nagel, J.; Spellmann, H.; Zasada, M.; et al. Productivity of mixed versus pure stands of oak (Quercus pretraea (Matt.) Liebl. and Quercus robur L.) and European beech (Fagus sylvatica L.) along an ecological gradient. Eur. J. For. Res. 2013, 132, 263–280. [Google Scholar] [CrossRef]
  23. Thurm, E.A.; Pretzsch, H. Improved productivity and modified tree morphology of mixed versus pure stands of European beech (Fagus sylvatica) and Douglas-fir (Pseudotsuga menziesii) with increasing precipitation and age. Ann. For. Sci. 2016, 73, 1047–1061. [Google Scholar] [CrossRef]
  24. Thurm, E.A.; Biber, P.; Pretzsch, H. Stem growth is favored at expenses of root growth in mixed stands and humid conditions for Douglas-fir (Pseudotsuga menziesii) and European beech (Fagus sylvatica). Trees 2017, 31, 349–365. [Google Scholar] [CrossRef]
  25. R Core Team. R: A Language and Environment for Statistical Computing; R Foundation for Statistical Computing: Vienna, Austria, 2019. [Google Scholar]
  26. Pinheiro, J.; Bates, D.; DebRoy, S.; Sarkar, D.; R Core Team. Linear and Nonlinear Mixed Effects Models. R Package Version 3.1–131. 2017. Available online: https://CRAN.R-project.org/package=nlme> (accessed on 23 July 2019).
  27. Reineke, L.H. Perfecting a stand-density index for even-aged forests. J. Agric. Res. 1933, 46, 627–638. [Google Scholar]
  28. Antonio, N.; Tomé, M.; Tomé, J.; Soares, P.; Fontes, L. Effect of tree, stand, and site variables on the allometry of Eucalyptus globulus tree biomass. Can. J. For. Res. 2007, 37, 895–906. [Google Scholar] [CrossRef]
  29. Hasenauer, H.; Monserud, R.A. A crown ratio model for Austrian forests. For. Ecol. Manag. 1996, 84, 49–60. [Google Scholar] [CrossRef]
  30. Hasenauer, H. Dimensional relationships of open-grown trees in Austria. For. Ecol. Manag. 1997, 96, 197–206. [Google Scholar] [CrossRef]
  31. Hynynen, J. Predicting tree crown ratio for unthinned and thinned Scots pine stands. Can. J. For. Res. 1995, 25, 57–62. [Google Scholar] [CrossRef]
  32. Longetaud, F.; Seifert, T.; Leban, J.M.; Pretzsch, H. Analysis of long-term dynamics of crowns of sessile oaks at stand level by means of spatial statistics. For. Ecol. Manag. 2008, 255, 2007–2019. [Google Scholar] [CrossRef]
  33. Russell, M.B.; Weiskittel, A.R. Maximum and largest crown width equations for 15 tree species in Maine. North. J. Appl. For. 2011, 28, 84–91. [Google Scholar] [CrossRef]
  34. Biging, G.S.; Dobbertin, M. Evaluation of competition indices in individual tree growth models. For. Sci. 1995, 41, 360–377. [Google Scholar]
  35. Grote, R. Estimation of crown radii and crown projection area from stem size and tree position. Ann. For. Sci. 2003, 60, 393–402. [Google Scholar] [CrossRef] [Green Version]
  36. Monserud, R.A.; Marshall, J.D. Allometric crown relations in three northern Idaho conifer species. Can. J. For. Res. 1999, 29, 521–535. [Google Scholar] [CrossRef]
  37. Gargaglione, V.; Peri, P.L.; Rubio, G. Allometric relations for biomass partitioning of Nothofagus antarctica trees of different crown classes over a site quality gradient. For. Ecol. Manag. 2010, 259, 1118–1126. [Google Scholar] [CrossRef]
  38. Mäkelä, A.; Valentine, H.T. Crown ratio influences allometric scaling in trees. Ecology 2006, 87, 2967–2972. [Google Scholar] [CrossRef]
  39. Pretzsch, H.; Dieler, J. Evidence of variant intra-and interspecific scaling of tree crown structure and relevance for allometric theory. Oecologia 2012, 169, 637–649. [Google Scholar] [CrossRef] [PubMed]
  40. Muller-Landau, H.C.; Condit, R.S.; Chave, J.; Thomas, S.C.; Bohlman, S.A.; Bunyavejchewin, S.; Harms, K.E. Testing metabolic ecology theory for allometric scaling of tree size, growth and mortality in tropical forests. Ecol. Lett. 2006, 9, 575–588. [Google Scholar] [CrossRef] [PubMed]
  41. Osawa, A.; Allen, R.B. Allometric theory explains self-thinning relationships of mountain beech and red pine. Ecology 1993, 74, 1020–1032. [Google Scholar] [CrossRef]
  42. Hein, S.; Spiecker, H. Crown and tree allometry of open-grown ash (Fraxinus excelsior L.) and sycamore (Acer pseudoplatanus L.). Agrofor. Syst. 2008, 73, 205–218. [Google Scholar] [CrossRef]
  43. Archibald, S.; Bond, W.J. Growing tall vs. growing wide: Tree architecture and allometry of Acacia karroo in forest, savanna, and arid environments. Oikos 2003, 102, 3–14. [Google Scholar] [CrossRef]
  44. Van Gelder, H.A.; Poorter, L.; Sterck, F.J. Wood mechanics, allometry, and life-history variation in a tropical rain forest tree community. N. Phytol. 2006, 171, 367–378. [Google Scholar] [CrossRef]
  45. White, P.S. Corner’s rules in eastern deciduous trees: Allometry and its implications for the adaptive architecture of trees. Bull. Torrey Bot. Club 1983, 1, 203–212. [Google Scholar] [CrossRef]
  46. Bayer, D.; Reischl, A.; Rötzer, T.; Pretzsch, H. Structural response of black locust (Robinia pseudoacacia L.) and small-leaved lime (Tilia cordata Mill.) to varying urban environments analyzed by terrestrial laser scanning: Implications for ecological functions and services. Urban For. Urban Green. 2018, 35, 129–138. [Google Scholar] [CrossRef]
  47. Jucker, T.; Bouriaud, O.; Coomes, D.A. Crown plasticity enables trees to optimize canopy packing in mixed-species forests. Funct. Ecol. 2015, 29, 1078–1086. [Google Scholar] [CrossRef]
  48. Verma, N.K.; Lamb, D.W.; Reid, N.; Wilson, B. An allometric model for estimating DBH of isolated and clustered Eucalyptus trees from measurements of crown projection area. For. Ecol. Manag. 2014, 326, 125–132. [Google Scholar] [CrossRef]
  49. Forrester, D.I.; Benneter, A.; Bouriaud, O.; Bauhus, J. Diversity and competition influence tree allometric relationships–developing functions for mixed-species forests. J. Ecol. 2017, 105, 761–774. [Google Scholar] [CrossRef]
  50. Goodman, R.C.; Phillips, O.L.; Baker, T.R. The importance of crown dimensions to improve tropical tree biomass estimates. Ecol. Appl. 2014, 24, 680–698. [Google Scholar] [CrossRef] [PubMed] [Green Version]
  51. Jiménez, E.; Vega, J.A.; Fernández-Alonso, J.M.; Vega-Nieva, D.; Álvarez-González, J.G.; Ruiz-González, A.D. Allometric equations for estimating canopy fuel load and distribution of pole-size maritime pine trees in five Iberian provenances. Can. J. For. Res. 2012, 43, 149–158. [Google Scholar] [CrossRef]
  52. Mitsopoulos, I.D.; Dimitrakopoulos, A.P. Allometric equations for crown fuel biomass of Aleppo pine (Pinus halepensis Mill.) in Greece. Int. J. Wildland Fire 2007, 16, 642–647. [Google Scholar] [CrossRef]
  53. Aiba, S.I.; Kohyama, T. Crown architecture and life-history traits of 14 tree species in a warm-temperate rain forest: Significance of spatial heterogeneity. J. Ecol. 1997, 85, 611–624. [Google Scholar] [CrossRef]
  54. Condés, S.; Sterba, H. Derivation of compatible crown width equations for some important tree species of Spain. For. Ecol. Manag. 2005, 217, 203–218. [Google Scholar] [CrossRef]
  55. Putz, F.E.; Parker, G.G.; Archibald, R.M. Mechanical abrasion and intercrown spacing. Am. Midl. Nat. 1984, 112, 24–28. [Google Scholar] [CrossRef]
  56. Fish, H.; Lieffers, V.J.; Silins, U.; Hall, R.J. Crown shyness in lodgepole pine stands of varying stand height, density, and site index in the upper foothills of Alberta. Can. J. For. Res. 2006, 36, 2104–2111. [Google Scholar] [CrossRef]
  57. Ellenberg, H.; Leuschner, C. Vegetation Mitteleuropas mit den Alpen: In ökologischer, dynamischer und historischer Sicht; Utb: Stuttgart, Germany, 2010. [Google Scholar]
  58. Lyr, H.; Polster, H.; Fiedler, H.J. Gehölzphysiologie; VEB Gustav Fischer Verlag: Jena, Germany, 1967; 337p. [Google Scholar]
  59. Mitscherlich, G. Wald, Wachstum und Umwelt. 2. Band, Waldklima und Wasserhaushalt; JD Sauerländer’s Verlag: Frankfurt am Main, Germany, 1971; 365p. [Google Scholar]
  60. Dieler, J.; Pretzsch, H. Morphological plasticity of European beech (Fagus sylvatica L.) in pure and mixed-species stands. For. Ecol. Manag. 2013, 95, 97–108. [Google Scholar] [CrossRef]
  61. Juchheim, J.; Annighöfer, P.; Ammer, C.; Calders, K.; Raumonen, P.; Seidel, D. How management intensity and neighborhood composition affect the structure of beech (Fagus sylvatica L.) trees. Trees 2017, 31, 1723–1735. [Google Scholar] [CrossRef]
  62. Hajek, P.; Seidel, D.; Leuschner, C. Mechanical abrasion, and not competition for light, is the dominant canopy interaction in a temperate mixed forest. For. Ecol. Manag. 2015, 348, 108–116. [Google Scholar] [CrossRef]
  63. Bravo-Oviedo, A.; Condés, S.; del Rio, M.; Pretzsch, H.; Ducey, M.J. Maximum stand density strongly depends on species-specific wood stability, shade and drought tolerance. Forestry 2018, 91, 459–469. [Google Scholar] [CrossRef]
  64. Knigge, W.; Schulz, H. Grundriss der Forstbenutzung; Verlag Paul Parey: Hamburg/Berlin, Germany, 1966; 584p. [Google Scholar]
  65. Trendelenburg, R.; Mayer-Wegelin, H. Das Holz als Rohstoff; Hanser Verlag: München, Germany, 1955; 541p. [Google Scholar]
  66. Larcher, W. Ökophysiologie der Pflanzen, 5th ed.; Verlag Eugen Ulmer: Stuttgart, Germany, 1994; 394p. [Google Scholar]
  67. Canham, C.D. Growth and canopy architecture of shade-tolerant trees: Response to canopy gaps. Ecology 1988, 69, 786–795. [Google Scholar] [CrossRef]
  68. Delagrange, S.; Messier, C.; Lechowicz, M.J.; Dizengremel, P. Physiological, morphological and allocational plasticity in understory deciduous trees: Importance of plant size and light availability. Tree Physiol. 2004, 24, 775–784. [Google Scholar] [CrossRef]
  69. McCarthy, M.C.; Enquist, B.J. Consistency between an allometric approach and optimal partitioning theory in global patterns of plant biomass allocation. Funct. Ecol. 2007, 21, 713–720. [Google Scholar] [CrossRef]
  70. Gedroc, J.J.; McConnaughay, K.D.M.; Coleman, J.S. Plasticity in root/shoot partitioning: Optimal, ontogenetic, or both? Funct. Ecol. 1996, 10, 44–50. [Google Scholar] [CrossRef]
  71. Forrester, D.I.; Tachauer, I.H.H.; Annighoefer, P.; Barbeito, I.; Pretzsch, H.; Ruiz-Peinado, R.; Saha, S. Generalized biomass and leaf area allometric equations for European tree species incorporating stand structure, tree age and climate. For. Ecol. Manag. 2017, 396, 160–175, Frankfurt a. Main. 128 p. [Google Scholar] [CrossRef]
  72. Forrester, D.I.; Ammer, C.; Annighöfer, P.J.; Barbeito, I.; Bielak, K.; Bravo-Oviedo, A.; Hurt, V. Effects of crown architecture and stand structure on light absorption in mixed and monospecific Fagus sylvatica and Pinus sylvestris forests along a productivity and climate gradient through. Eur. J. Ecol. 2018, 106, 746–760. [Google Scholar] [CrossRef]
  73. Magin, R. Struktur und Leistung mehrschichtiger Mischwälder in den bayerischen Alpen. Mitt Staatsforstverwalt. Bayerns 1959, 30, 161p. [Google Scholar]
  74. Preuhsler, T. Die Entwicklung von Oberstand und Naturverjüngung in Bergmischwald-Verjüngungsbeständen des Forstamtes Kreuth. Centralbl Für Das Ges Forstwes 1989, 106, 23–54. [Google Scholar]
  75. Osunkoya, O.O.; Omar-Ali, K.; Amit, N.; Dayan, J.; Daud, D.S.; Sheng, T.K. Comparative height–crown allometry and mechanical design in 22 tree species of Kuala Belalong rainforest, Brunei, Borneo. Am. J. Bot. 2007, 94, 1951–1962. [Google Scholar] [CrossRef]
  76. Sterba, H.; Dirnberger, G.; Ritter, T. Vertical Distribution of Leaf Area of European Larch (Larix decidua Mill.) and Norway Spruce (Picea abies (L.) Karst.) in Pure and Mixed Stands. Forests 2019, 10, 570. [Google Scholar] [CrossRef]
  77. Metz, J.; Seidel, D.; Schall, P.; Scheffer, D.; Schulze, E.D.; Ammer, C. Crown modeling by terrestrial laser scanning as an approach to assess the effect of aboveground intra-and interspecific competition on tree growth. For. Ecol. Manag. 2013, 310, 275–288. [Google Scholar] [CrossRef]
  78. Silva Pedro, M.; Rammer, W.; Seidl, R. Disentangling the effects of compositional and structural diversity on forest productivity. J. Veg. Sci. 2017, 28, 649–658. [Google Scholar] [CrossRef]
  79. Zeller, L.; Pretzsch, H. Effect of forest structure on stand productivity in Central European forests depends on developmental stage and tree species diversity. For. Ecol. Manag. 2019, 434, 193–204. [Google Scholar] [CrossRef]
  80. Sterba, H. Assmanns Theorie der Grundflächenhaltung und die “Competition-Density-Rule” der Japaner Kira, Ando und Tadaki. Cbl für das ges Forstwes. 1975, 92, 46–62. [Google Scholar]
  81. Sterba, H. Natürlicher Bestockungsgrad und Reinekes SDI. Cbl für das ges Forstwes 1981, 98, 101–116. [Google Scholar]
  82. Pretzsch, H.; Steckel, M.; Heym, M.; Biber, P.; Ammer, C.; Ehbrecht, M.; Bielak, K.; Bravo, F.; Ordóñez, C.; Collet, C.; et al. Stand growth and structure of mixed-species and monospecific stands of Scots pine (Pinus sylvestris L.) and oak (Q. robur L., Quercus petraea (MATT.) LIEBL.) analysed along a productivity gradient through Europe. Eur. J. For. Res. 2019. under review. [Google Scholar]
  83. Pretzsch, H.; del Río, M. Density regulation of mixed and mono-specific forest stands as a continuum. A concept based on species-specific coefficients of density equivalence and density modification. Forestry 2019. under review. [Google Scholar]
  84. Sterba, H.; Monserud, R.A. The maximum density concept applied to uneven-aged mixed-species stands. For. Sci. 1993, 39, 432–452. [Google Scholar]
  85. Fatichi, S.; Leuzinger, S.; Körner, C. Moving beyond photosynthesis: From carbon source to sink-driven vegetation modelling. N. Phytol. 2014, 201, 1086–1095. [Google Scholar] [CrossRef]
  86. Jucker, T.; Caspersen, J.; Chave, J.; Antin, C.; Barbier, N.; Bongers, F.; Higgins, S.I. Allometric equations for integrating remote sensing imagery into forest monitoring programmes. Glob. Chang. Biol. 2017, 23, 177–190. [Google Scholar] [CrossRef]
  87. Grams, T.E.; Lüttge, U. Space as a resource. In Progress in Botany 72; Springer: Berlin/Heidelberg, Germany, 2010; pp. 349–370. [Google Scholar]
  88. Meng, S.X.; Rudnicki, M.; Lieffers, V.J.; Reid, D.E.; Silins, U. Preventing crown collisions increases the crown cover and leaf area of maturing lodgepole pine. J. Ecol. 2006, 94, 681–686. [Google Scholar] [CrossRef]
  89. Kelty, M.J. Comparative productivity of monocultures and mixed-species stands. In The Ecology and Silviculture of Mixed-Species Forests; Springer: Dordrecht, The Netherlands, 1992; pp. 125–141. [Google Scholar]
  90. Richards, A.E.; Forrester, D.I.; Bauhus, J.; Scherer-Lorenzen, M. The influence of mixed tree plantations on the nutrition of individual species: A review. Tree Physiol. 2010, 30, 1192–1208. [Google Scholar] [CrossRef]
  91. Bauhus, J.; Khanna, P.K.; Menden, N. Aboveground and belowground interactions in mixed plantations of Eucalyptus globulus and Acacia mearnsii. Can. J. For. Res. 2000, 30, 1886–1894. [Google Scholar] [CrossRef]
  92. Schmid, I.; Kazda, M. Vertical distribution and radial growth of coarse roots in pure and mixed stands of Fagus sylvatica and Picea abies. Can. J. For. Res. 2001, 31, 539–548. [Google Scholar] [CrossRef]
  93. Gale, M.R.; Grigal, D.F. Vertical root distributions of northern tree species in relation to successional status. Can. J. For. Res. 1987, 17, 829–834. [Google Scholar] [CrossRef]
  94. Stone, E.L.; Kalisz, P.J. On the maximum extent of tree roots. For. Ecol. Manag. 1991, 46, 59–102. [Google Scholar] [CrossRef]
  95. Williams, L.J.; Paquette, A.; Cavender-Bares, J.; Messier, C.; Reich, P.B. Spatial complementarity in tree crowns explains overyielding in species mixtures. Nat. Ecol. Evol. 2017, 1, 0063. [Google Scholar] [CrossRef]
  96. Pretzsch, H.; Biber, P. Tree species mixing can increase maximum stand density. Can. J. For. Res. 2016, 46, 1179–1193. [Google Scholar] [CrossRef] [Green Version]
  97. Pretzsch, H. Ertragstafel-Korrekturfaktoren für Umwelt- und Mischungseffekte. Available online: https://www.semanticscholar.org/paper/Ertragstafel-Korrekturfaktoren-f%C3%BCr-Umwelt-und-Pretzsch/93cead166218f3c96f2ed502a064d234e0d800cc (accessed on 23 July 2019).
  98. Drössler, L.; Agestam, E.; Bielak, K.; Dudzinska, M.; Koricheva, J.; Liziniewicz, M.; Löf, M.; Mason, B.; Pretzsch, H.; Valkonen, S.; et al. Over- and Underyielding in Time and Space in Experiments with Mixed Stands of Scots Pine and Norway Spruce. Forests 2018, 9, 495. [Google Scholar] [CrossRef]
  99. Liang, J.; Crowther, T.W.; Picard, N.; Wiser, S.; Zhou, M.; Alberti, G.; Schulze, E.D.; McGuire, A.D.; Bozzato, F.; Pretzsch, H.; et al. Positive biodiversity-productivity relationship predominant in global forests. Science 2016, 354, 1–12. [Google Scholar] [CrossRef]
  100. Bravo-Oviedo, A.; Pretzsch, H.; del Río, M. Dynamics, Silviculture and Management of Mixed Forests, Managing Forest Ecosystems 31; Springer Nature: Cham, Germany, 2018; 420p. [Google Scholar]
  101. Pretzsch, H. Growth and Structure in Mixed-Species stands compared with monocultures: Review and perspectives. In Dynamics, Silviculture and Management of Mixed Forests, Managing Forest Ecosystems 31; Bravo-Oviedo, A., Pretzsch, H., del Río, M., Eds.; Springer Nature: Cham, Germany, 2018; pp. 131–183. [Google Scholar]
  102. Cole, W.G.; Lorimer, C.G. Predicting tree growth from crown variables in managed northern hardwood stands. For. Ecol. Manag. 1994, 67, 159–175. [Google Scholar] [CrossRef]
  103. Maguire, D.A.; Brissette, J.C.; Gu, L. Crown structure and growth efficiency of red spruce in uneven-aged, mixed-species stands in Maine. Can. J. For. Res. 1998, 28, 1233–1240. [Google Scholar] [CrossRef]
  104. Pretzsch, H.; Biber, P.; Ďurský, J. The single tree-based stand simulator SILVA: Construction. application and evaluation. For. Ecol. Manag. 2002, 162, 3–21. [Google Scholar] [CrossRef]
  105. Thorpe, H.C.; Astrup, R.; Trowbridge, A.; Coates, K.D. Competition and tree crowns: A neighborhood analysis of three boreal tree species. For. Ecol. Manag. 2010, 259, 1586–1596. [Google Scholar] [CrossRef]
  106. Bravo, F.; Fabrika, M.; Ammer, C.; Barreiro, S.; Bielak, K.; Coll, L.; Pach, M. Modelling approaches for mixed forests dynamics prognosis. Research gaps and opportunities. For. Syst. 2019, 28, eR002. [Google Scholar] [CrossRef] [Green Version]
  107. Pretzsch, H.; Zenner, E.K. Toward managing mixed-species stands: From parametrization to prescription. For. Ecosyst. 2017, 4, 19. [Google Scholar] [CrossRef]
  108. Pretzsch, H. Grundlagen der Waldwachstumsforschung; Springer: Berlin, Germany, 2019; 664p. [Google Scholar]
  109. del Río, M.; Bravo-Oviedo, A.; Ruiz-Peinado, R.; Condés, S. Tree allometry variation in response to intra-and inter-specific competitions. Trees 2019, 33, 121–138. [Google Scholar] [CrossRef]
  110. Biber, P.; Borges, J.; Moshammer, R.; Barreiro, S.; Botequim, B.; Brodrechtova, Y.; Eriksson, L. How sensitive are ecosystem services in European forest landscapes to silvicultural treatment? Forests 2015, 6, 1666–1695. [Google Scholar] [CrossRef]
Figure 1. Dendrometrical tree characteristics. (a) Tree height, h, crown length, cl, height to crown base, hcb, crown diameter, cd, tree diameter at breast height, d1.3, and stem volume vs. variable cpa represents the crown projection area. (b) Crown volume, cv, crown surface area, cs, diameter of the stem, ds = d1.3, and diameter of the three tallest roots, dr1 … dr3. (c) Tree stand area equivalent to growing area, sa, and crown projection area, cpa. Particularly in densely packed stands, cpa is often larger than sa.
Forests 10 00810 g001
Figure 2. Allometric relationship cpa   =   a   ×   d α cpa , d   for four basic types of crown development shown in (a) linear and (b) double-logarithmic representation. The curves A–D correspond with the size and shape development from young to mature trees shown in Figure 3.
Forests 10 00810 g002
Figure 3. Visualization of 4 basic types of crown width allometry ( cpa   =   a   ×   d α cpa , d ) from the young (y) to the mature (m) tree development phase. (a) Continuously slim crown from young to mature phase, associated with low acpa,d and low α cpa , d values (see curves A in Figure 2a,b). (b) Continuously large crown from the young to the mature phase, associated with high acpa,d and low α cpa , d values (see curves B in Figure 2a,b). (c) Initially small crown extending with progressing size growth associated with low acpa,d but high α cpa , d values (see curves C in Figure 2a,b). (d) Relatively large crowns in the young phase and just moderate extension with further size development, associated with high acpa,d but low α cpa , d values (see curves D in Figure 2a,b).
Forests 10 00810 g003
Figure 4. Allometric relationships between stem diameter, d, and crown projection area, cpa, for European beech (Fagus sylvatica L.) (n = 14,898), silver fir (Abies alba Mill.) (n = 1079), sessile oak (Quercus petraea (MATT.) LIEBL.) (n = 4485), Norway spruce (Picea abies (L.) Karst.) (n = 10,724), sycomore maple (Acer pseudoplatanus L.) (n = 942), and Scots pine (Pinus sylvestris L.) (n = 1609) in even-aged and uneven-aged stands. The graph shows the range of crown dimensions measured on long-term experimental plots which cover dense as well as very sparsely spaced stands. The upper and lower lines represent the results of the 95% and 5% quantile-regression ln ( cpa ) = a + α × ln ( d ) . The width of the scattering and the distance between the 95% and 5% quantile regression represents the crown plasticity, CPL. For the statistical characteristics of the quantile regressions see Pretzsch (2014) [10].
Forests 10 00810 g004
Figure 5. Species-specific development of crown projection area with increasing tree height for five primary tree species in Europe. Data from long-term experimental plots in South Germany. The black line indicates the 95% quantile of the cpa-h relationship (see model 1 in Table 1).
Forests 10 00810 g005
Figure 6. In even-aged monospecific stands (a) the crowns are similar and in the same layer. This can restrict the crown expansion in young stands and may cause mechanical abrasion and crown shyness in mature stands. In mixed-species stands; (b) the crowns’ space to grow may be less restricted and the crown size less reduced by mechanical abrasion. The crowns are often arranged in different layers in both young and mature stands.
Forests 10 00810 g006
Figure 7. Observations of crown projection area, cpa, and stem diameter, d, on mono-specific long-term experimental plots in South Germany. (a,b) Measurements exemplarily shown for Norway spruce and European beech. (c) Allometric relationships cpa-d for five primary tree species fitted by regression analysis (see model 2 in Table 1).
Forests 10 00810 g007
Figure 8. Species-specific (a) height to crown base, hcb, and (b) crown length, cl, for selected tree species growing in fully stocked mono-specific stands. (See model 3 in Table 1).
Forests 10 00810 g008
Figure 9. Allometric relationship between tree crown projection area, cpa, and stem diameter, d, of European beech derived from crown measurements on long-term experimental plots in Germany. As the database includes solitary trees as well as trees in thinned and unthinned stands, the ln ( cpa )   ln ( d ) relationships were derived for solitary trees (upper line: 95%-quantile regression: ln ( cpa ) = 1.11 + 0.92   ln ( d ) ), for trees in moderately heavily (B/C-grade, n = 1685) thinned stands (middle line: ln ( cpa ) = 0.05 + 1.01 × ln ( d ) ), and for trees in unthinned stands (A-grade, n = 661) (lower line: ln ( cpa ) = 1.59 + 1.36 × ln ( d ) ).
Forests 10 00810 g009
Figure 10. Relationship between dry wood density R and the crown extension of primary forest tree species. (a) cpa of trees of 50 cm stem diameter depending on R, (b) crown projection area cpa depending on stem diameter, (c) crown radius of trees of 50 cm stem diameter plotted over wood density R, (d) crown radius cr depending on stem diameter. The vertical line indicates stem diameter 50 cm and the cr values used for (c). (see model 4 in Table 1 for (a) and (c) and model 5 in Supplementary Table S1 for (b) and (d)).
Forests 10 00810 g010
Figure 11. Crown projection area plotted over stem diameter in mixed-species versus monospecific stands of (a,b) Scots pine and sessile/common oak, and (c,d) Scots pine and European beech. The curves were based on the mean (solid lines) and 95% quantile (thin lines) regression analyses of the cpa-d relationship. The analysis was based on crown measurement in monospecific and mixed-species stands across Europe (see model 6 in Table 1).
Forests 10 00810 g011
Figure 12. Height to crown base over tree height in mixed-species versus monospecific stands of (a,b) Scots pine and sessile/common oak and (c,d) Scots pine and European beech. The curves represent the mean (solid lines) and 95% quantile (thin lines) regression analyses of the hcb-h relationship. The thin bisector line indicates the minimum crown length (hcb = h). The analyses are based on crown measurement in mixed and monospecific stands across Europe (see model 7 in Table 1).
Forests 10 00810 g012
Figure 13. Effect of tree species mixing on the crown of European beech on experimental plots in France (a), Spain (b), Sweden (c) and Germany (d) detected by TLidar measurement. The curves show wider and lower-reaching crowns of beech in mixed compared with monospecific stands (according to Barbeito et al. 2017 [5]).
Forests 10 00810 g013
Figure 14. The reciprocal relationship between SDI and crown projection area for stands with dq = 25 cm quadratic mean stem diameter for the 14 common tree species. Data from long-term experiments with both tree crown measurements and stand inventory. Regression analysis yielded SDI = 8637.4   + 183.4   × ( 1 / cpa )   for the decrease of stand density, SDI, with increasing crown projection area, cpa. (see Table 1, model 8).
Forests 10 00810 g014
Figure 15. Relationship between tree number, N, and mean crown projection area, cpa, shown for (a) monospecific stands of Norway spruce, Douglas-fir, Scots pine, European beech, and sessile oak and for (b) mixed-species stands of the same species on similar sites. The black curve reflects the theoretical reciprocal relationship N = 10,000 / cpa . (c) The mean N-cpa was higher and shallower for mixed compared to mono-specific stands. (d) The sum of crown projection areas per hectare was significantly higher (above one-fold coverage) in mixed stands but decreasing down to 2/3 coverage (7500 m2 per ha-1) in the monospecific stands (see Table 1, model 9).
Forests 10 00810 g015
Figure 16. Self-thinning lines in mixed compared with monospecific stands of Norway spruce and European beech, Scots pine and European beech, sessile oak and European beech, Douglas-fir and European beech, and Scots pine and sessile oak. (a) Self-thinning lines of monospecific stands, (b) more shallow self-thinning lines of neighboring mixed-species stands, (c) standardized, observed versus expected self-thinning lines for mixed stands, and (d) standardized, observed compared with expected tree numbers (1.0-line) in mixed-species stands (see Table 1, model 10).
Forests 10 00810 g016
Figure 17. Observed (solid lines) versus expected (broken lines) development of the tree number and stand basal area development plotted over quadratic mean tree diameter. (ac) N-dq relationships for mixed-species stands of Norway spruce and European beech, s.oak and European beech, and Douglas-fir and European beech. (df) BA-dq relationships for the respective tree species combinations. The raise of maximum stand density by mixing tree species increases from left to right.
Forests 10 00810 g017
Table 1. Statistical characteristics of the models 1–4 and 6–10. The model numbers refer to Section 2.4 where the models are introduced in detail. For the results of model 5, see Supplementary Table S1. For reasons of space, the table reports onl the fixed effect variables of the respective models. se is the standard error.
ModelSpeciesVariablesna0se (a0)p-Valuea1se (a1)p-Valuea2se (a2)p-Valuea3se (a3)p-Value
1N. spcpa~h117841.2100.1000.0000.8320.0330.000
1S. picpa~h2734−0.9920.8500.2431.4890.2800.000
1D-fircpa~h1480−0.3770.1960.0541.5070.0680.000
1E. becpa~h118021.4580.5310.0061.0810.1700.000
1s. oakcpa~h3920−1.9000.6380.0032.0570.1890.000
2N. spcpa~d4734−2.0170.1080.0001.3960.0130.000
2S. picpa~d2734−3.6910.0910.0001.9630.0290.000
2D-fircpa~d1480−1.6060.1400.0001.3410.2180.000
2E. becpa~d2830−0.4340.0800.0001.1600.0140.000
2s. oakcpa~d692−4.4080.3220.0002.2040.0750.000
3N. sphcb~h11783−1.8900.0540.0001.3540.0160.000
3S. pihcb~h4483−0.9270.0370.0001.1550.0120.000
3D-firhcb~h1689−2.8360.1290.0001.5820.0380.000
3E. behcb~h11802−2.3470.0460.0001.4220.0140.000
3s. oakhcb~h3919−0.9530.0350.0001.1090.0110.000
4various speciescpa~R14−17.8738.650.652177.3667.310.022
4various speciescr~R142.0901.0970.0815.2431.9110.018
6S. pi mono-mixcpa~d3801−2.9370.1680.0001.6930.0460.000−0.7170.2350.0060.2070.0670.002
6s. oak mono-mixcpa~d3098−1.8990.1440.0001.5150.0410.0001.2890.1840.000−0.3030.0550.000
6S. pi mono-mixcpa~d1382−3.3400.1840.0001.7950.0500.000−0.1520.0690.039
6E. be mono-mixcpa~d1818−0.3230.1360.0171.1270.0320.0000.2450.0550.000
7S. pi mono-mixhcb~h3152−0.6650.0890.0001.0810.0250.0000.7580.1240.000−0.2610.0380.000
7s. oak mono-mixhcb~h2486−0.9810.1440.0001.0970.0430.0000.4860.1620.007−0.1950.0520.000
7S. pi mono-mixhcb~h11940.2270.1050.0320.7950.0310.0000.0530.0220.024
7E. be mono-mixhcb~h1335−3.0380.2960.0001.6700.0930.0001.6040.3800.000−0.5260.1200.000
8various speciesSDI~cpa148637.42622.50.0068637.42622.50.006
9various speciesN~cpa191010.2120.0550.000−1.2940.0180.000−0.3510.1060.0000.1960.0340.000
10N.sp (N.sp, E. be)N~dq17812.8140.1630.000−1.8410.0480.000
10E.be (N.sp, E. be)N~dq17811.4100.1010.000−1.5330.0330.000
10S.pi (S.pi, E. be)N~dq3213.5940.5270.000−2.1430.1610.000
10E.be(S.pi, E. be)N~dq3212.4940.4540.000−1.8560.1430.000
10D-fir (D-fir, E. be)N~dq1811.0620.4250.000−1.3260.1160.000
10E.be (D-fir, E. be)N~dq1811.8310.5390.000−1.6720.1700.000
10s.oak (s.oak, E. be)N~dq25411.8690.2070.000−1.8200.0620.000
10E.be (s.oak, E. be)N~dq25411.9790.1780.000−1.8230.0520.000
10S.pi (S.pi, s. oak)N~dq3612.5990.7300.000−1.8080.2190.000
10s.oak (S.pi, s. oak)N~dq3613.1140.4730.000−2.0330.1460.000
10N.sp & E. be, exp.N~dq17812.0810.1290.000−1.6850.0400.000
10S.pi & E. be, exp.N~dq3212.5680.5540.000−1.8410.1730.000
10D-fir & E. be, exp.N~dq1811.6070.6660.000−1.5300.2030.000
10s.oak & E.be, exp.N~dq25410.6610.1480.000−1.4280.0490.000
10S.pi & s. oak, exp.N~dq3612.8170.8210.000−1.8840.2470.000
10N.sp & E. be, obs.N~dq17811.3160.1290.000−1.5050.0430.000
10S.pi & E. be, obs.N~dq3212.0550.5570.000−1.6910.1810.000
10D-fir & E. be, obs.N~dq1811.0170.6690.000−1.3840.2220.000
10s.oak & E.be, obs.N~dq25411.4970.1760.000−1.6480.0610.000
10S.pi & s. oak, obsN~dq3613.3600.5720.000−2.0730.1790.000
Table 2. Mean ratios and standard errors of mixed versus monospecific stand density, DMC, for species combinations represented by data and analyzed so far.
Species
Combination
N. spruce
E. beech
s. oak
E. beech
S. pine
E. beech
Douglas-fir
E. beech
S. pine
s. oak
n178254321836
mean1.0201.2571.1301.2811.137
se0.0150.0460.0540.1410.040

