Article

Does Deforestation Trigger Severe Flood Damage at Hoeryeong City in North Korea?

1
Inter-Korean Forest Research Team, Division of Global Forestry, Department of Forest Policy and Economics, National Institute of Forest Science, 57 Hoegi-ro, Dongdaemun-gu, Seoul 02455, Korea
2
Department of Landscape Architecture, Graduate School, Sungkyunkwan University, Suwon 16419, Korea
*
Author to whom correspondence should be addressed.
Forests 2019, 10(9), 789; https://doi.org/10.3390/f10090789
Submission received: 4 August 2019 / Revised: 26 August 2019 / Accepted: 9 September 2019 / Published: 11 September 2019
(This article belongs to the Section Forest Ecology and Management)

Abstract

:
North Korea has suffered flood damage every year since 1995. It is assumed that this damage is linked to deforestation. Therefore, the purpose of this study was to investigate the effects of deforestation on the occurrence of floods in North Korea using spatial statistical techniques. The research was conducted at Hoeryeong City, which experienced disastrous flooding in 2016. A land-use change map was produced using two Landsat data sets from 1977 and 2016. The flood-damaged areas map, landform map, and the distance from the nearest stream map were also used in the spatial statistical analysis. In the deforestation zone, area of soil loss over 200 tons/yr increased by 14 km2 (16.6%), while that under 50 tons/yr decreased by 25 km2 (29.3%). In addition, the land-use change, runoff coefficient, and peak time runoff increased from 0.31 to 0.46, 56.3 mm/hr to 60.8 mm/hr, and 128.2 m3/sec to 206.6 m3/sec, respectively. Also, spatial statistical analysis results showed that land-use change was concluded to strongly affect the occurrence of floods. In conclusion, deforestation at Hoeryeong City contributed to severe flooding due to changes in land-use policy. The results of this study will help decision makers to establish the North Korean forest restoration policy and countermeasures against flood damage.

1. Introduction

North Korea has suffered flood damage every year since 1995, with serious damage occurring in 1995, 2007, 2012, and 2016 [1,2]. Hoeryeong City in particular experienced heavy rains brought by Typhoon Lionrock, which overflowed the Tumen River and brought enormous amounts of water into the plains on August 30, 2016. Due to that flood, some 68,900 people lost their homes, 11,600 houses were destroyed, and 29,800 other houses suffered massive damage [3]. This damage has been attributed to deforestation in North Korea [1,2,4,5,6]. Forests have been changed to newly developed croplands along the gentle hillslope for national economic difficult after 1980 in North Korea [1,2,4,5,7,8,9]. The developed croplands are named Darakbat (terraced crop field with embankment) and Bitalbat (titled crop field developed on the original hillslope) [9].
Flooding by deforestation has been studied by several research groups [10,11,12]. Bradshaw et al. [10] showed that deforestation has a negative correlation with flood frequency using generalized linear and mixed-effects models with data collected from 1990 to 2000 from 56 developing countries. The most frugal models estimated that for over 65% of the variation in flood frequency, almost 14% was due to forest cover variables alone.
Tan-Soo et al. [11] investigated the effects of deforestation on flood-mitigation services in Peninsular Malaysia using detailed data on both flood events and land-use change for 31 river basins. They found that the change of inland tropical forests to oil palm and rubber plantations significantly raised the number of flood days during the wettest months of the year.
De la Paix et al. [12] analyzed soil degradation and changed flood risks as a result of deforestation. Their results showed that deforestation caused by the use of fuelwood and competition for agriculture land led to increased soil erosion and floods.
Besides, land-use change effects on flooding have been studied by comparing runoff change and flood occurrence [13,14,15,16]. Lin et al. [13] investigated runoff responses on daily, annual, and monthly time scales using SWAT (Soil and Water Assessment Tool) at Jinjiang, a coastal catchment of southeast China. They found that, between 1985 and 2006, in land-use scenarios, daily runoff changes were more significant than monthly or annual time scales. Moreover, their simulations showed that deforestation decreased evapotranspiration, percolation loss to depth, and led to high runoff.
Ye et al. [14] investigated runoff changes due to development in Mt. Kyeryong National Park in South Korea, finding that increased runoff volume was due to deforestation by development.
Guo et al. [15] used the SWAT model to investigate the effects of climate, land-use, and land-cover on hydrology and streamflow in the Xinjiang River basin of the Poyang Lake. A notable finding of this study is that deforestation increases flood potential and also enhances the impact of drought.
Nirupama and Simonovic [16] showed a relationship between an impervious area and river flows using remote sensing techniques and the relevant meteorological and hydrological data. A floods risk has been considerably elevated between 1974 and 2000 due to dense urbanization in the watershed of the Upper Thames River in the City of London, Ontario in Canada.
However, no statistically valid or numerical approach has been used to test deforestation effects on flooding. Thus, it is necessary to investigate a spatial statistical and numerical approach for this assumption. The K-function [17,18] has been widely used to study the spatial correlation of mapped point data [19]. Okabe and Yamada [20] developed a method to conduct the K-function analysis of point correlation in a network. This technique is used in various fields for investigating the relationship between two spatial groups [19,21,22]. Spooner et al. [19] investigated a spatial analysis of roadside Acacia populations on a road network using the network K-function for univariate analysis and network cross K- function for bivariate analysis. The point location data for roadside populations of three Acacia species in a fragmented agricultural landscape of south-eastern Australia were used in this study. They suggested that the network K-function method will become a useful statistical tool for the analyses of ecological data along roads, field margins, streams, and other networks.
Yamada and Thill [21] compared planar and network K-function in traffic accident analysis to illustrate the risk of false-positive detection associated with the use of a statistic designed for a planar space to analyze a network constrained phenomenon. Analyses were implemented based on Monte Carlo simulation and applied to 1997 traffic accident data in the Buffalo, NY area. Their results indicated that the planar K-function analysis is problematic since it entails a significant change of over detection clustered patterns. The network K-function can be regarded as the most reliable method to analyze traffic accident data.
Dai et al. [22] investigated the impact of the built environment on pedestrian crashes and the identification of crash clusters on an urban university campus of Georgia State University. They used pedestrian crash data with network kernel density estimation and network K-function. They suggested that the findings can be used to understand the correlation between the built environment and pedestrian safety to prioritize the high-density zones for intervention efforts and to formulate research hypotheses for investigating pedestrian crashes.
As we have seen in the literature review, network cross K-function can be used to analyze the correlation between the two spatial data. However, there were no studies to investigate the deforestation effect on Flood-damaged Areas (FDAs) using network cross K-function yet.
Therefore, the purpose of this study was to investigate the effects of deforestation on the occurrence of floods at Hoeryeong City in North Korea through spatial statistical techniques. This study was an extension of the previous study [2]. Ultimately this study was implemented to help decision-makers to establish the North Korean forest restoration policy and countermeasures against flood damage.

2. Materials and Methods

2.1. Study Area

The research was conducted at Hoeryeong City (42° 26’ N, 129° 45’ E, 1,754 km2) in northern North Korea (Figure 1), which experienced disastrous flood damage in 2016 by Typhoon Lionrock. The city has a typical temperate continental climate with four distinct seasons. Temperatures range from lows between −5 and −17°C in January to highs between 16 and 25°C in August. Due to moist air coming from the Pacific Ocean, the summer is hot and humid [23]. The yearly average rainfall of approximately 1077 mm occurs predominantly during the July and August monsoon season [2,24]. Due to air masses coming from Siberia, the winter is dry and cold [25]. Geographically, the city is mountainous with high peaks and hills of Mt. Obong and Mt. Sanbang [26] with an elevation ranging from 210 m to 1450 m. Tumen River flows beside the city, and there are adjacent villages, which are relatively low flat areas. In the southeastern mountainous area, where elevation is 500 m or more, the geology composes of granitic rock and Paleozoic sedimentary rock layers. Also, the geology consists of tertiary sedimentary rock layers in the lower region [26]. In the study site with high altitude and slope, fertility can be lowered due to the loss of soil and organic matters after clearing mountain slopes, yield can be reduced, and landslides are more likely due to repeated erosion. Also, the eroded materials can be transported into the river and sedimentation proceeds, which is likely to lead to flooding during rainfall [8].

2.2. Study Methods

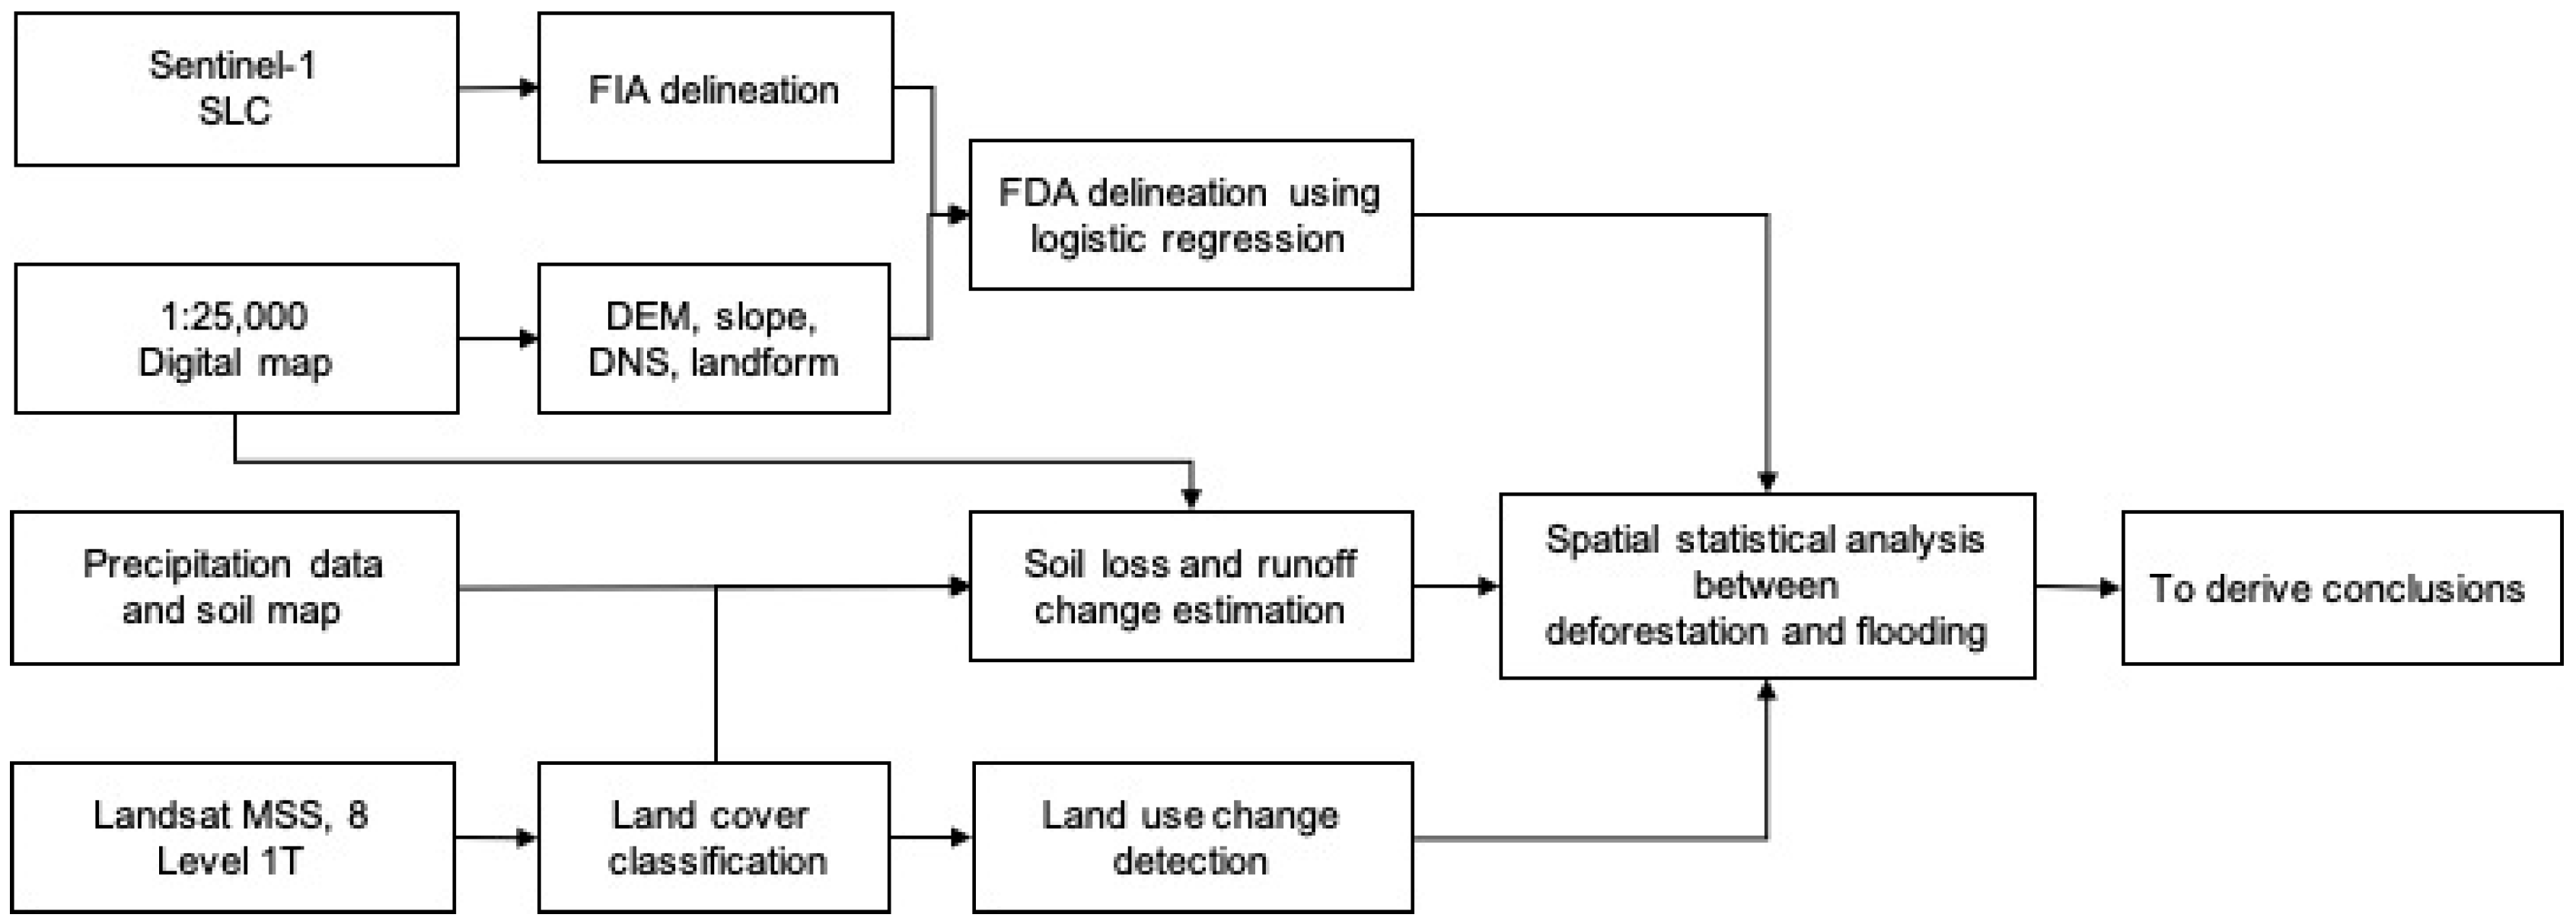
This study is to investigate deforestation effects on FDAs using spatial statistics. As a preliminary step, FDAs were delineated after the Geographic Information System (GIS) database development, and deforestation effects on FDAs at Hoeryeong City were investigated. Figure 2 shows this study procedure.
A logistic regression model was used to delineate FDAs. In the logistic regression model, the flood inundated area map was derived from the radar backscattering coefficient (σ0) difference, elevation map, slope map, Distance from the Nearest Stream (DNS) map, and landform map. After that, land-use change detection from 1977 to 2016 was done by comparing land cover classification maps of 1977 and 2016. Then, the relationship between deforestation and FDAs was investigated using the network cross K-function method. Soil loss and runoff change were also estimated.

2.2.1. Delineation of Flood-Damaged Areas and Build Database Establishment

To apply the results of this research, a GIS database was established. First, an FDA map, which was derived in a previous study [2] using logistic regression, was used. Second, a digital elevation map, slope gradient map, landform map, and a map of the DNS were produced using digital topographic data of North Korea provided by the South Korean National Geographic Information Institute (NGII) (Table 1). The landform map was produced using Geomorphon [27] in GRASS GIS 7.0.3 with a 1:25,000 scale, digital topographic map from NGII. The map classified landforms into ten classes based on cell patterns of height comparisons between the center and surrounding cells [27] and calculated zenith and nadir angles to define the correct primary compass directions among the eight direction likelihoods. The DNS map was produced using virtual points, which were generated for every pixel in the study area. Then, the distances between the nearest stream and virtual points were calculated with the “Near” function in ArcGIS. These point data were transformed into grid data to produce a DNS map. Also, for estimating soil ross and runoff change, annual precipitation data were provided by the National Oceanic and Atmospheric Administration (NOAA) through Climate Engine (http://clim-engine.appspot.com/). Soil data was provided by the Food and Agriculture Organization of the United Nations (FAO, http://www.fao.org/soils-portal/soil-survey/soil-maps-and-databases/harmonized-world-soil-database-v12/en/).

2.2.2. Investigation of the Effects of Land-Use Change on Flooding

To test whether deforestation affected the occurrence of floods, a land-use change map was produced using two Landsat data: Landsat Multispectral Scanner System (MSS) image data gathered on May 22, 1977, and Landsat 8 image data gathered on May 28, 2016. These images were obtained from the United States Geological Survey (USGS) Landsat homepage (http://earthexplorer.usgs.gov/). Level 1T data were processed using radiometric and geometric corrections. The land-use change map from 1977 to 2016 was derived first by comparing the land cover classification maps of 1977 and 2016 using a Post Classification Comparison Change Detection (PCCCD) method [28]. This method compares the pixel class in the prior image and present maps and logs changes in the pixels. The resulting map generates change assessments, including “forest to crop field” and “crop field to forest” based on the following three classification categories: crop field, forest, and water. Image classification was performed using an Iterative Self-Organizing Data Analysis Technique Algorithm (ISODATA). To assess land cover classification accuracy, 1976’s topographic map from NGII and a high-resolution Google Earth imagery were used for the 1977 land-use map and 2016 land-use map, respectively. Accuracy assessments were performed with the confusion matrix, which provides the overall accuracy and kappa statistic value [28]. A landform map was overlaid with the land-use change map to figure out the landforms of the land-use changed area.
To investigate deforestation effects on the FDAs, the network cross K-function [20] was used through SANET v.4.1. ST is the stream channels in the study area. Two kinds of points, A ( d e f o r e s t a t i o n ) =   { a 1 ,   , a n } and B ( F D A s ) =   { b 1 , , b n } , were analyzed on ST in network cross K-function analyses. A is randomly generated points in deforestation area, and B is that on FDAs. Rainfall can flow only in a certain watershed and cannot affect any other watershed. Surface flow materials can only affect the associated watershed areas during flow along the stream channel. That is why network cross K-function was used with stream channels as a network factor in this study. This technique tests the Complete Spatial Randomness (CSR) hypothesis, which asserts that the configuration of areas exhibiting land-use change (i.e., forest to crop field) does not affect the distribution of the FDAs. If the observed curve is above the upper expected curve, the CSR hypothesis is rejected. Okabe and Yamada [20] defined the network cross K-function K b a ( t ) as follows:
K b a ( t )   =   1 ρ a E ( t h e   n u m b e r   o f   p o i n t   A   w i t h i n   n e t w r o k   d i s t a n c e   t   t o   a   p o i n t   b i   i n   B )
where E(.) is the expected value with respect to b 1 , , b n ( b i B ) , which follows the binomial point process:
ρ a is the density of point A, such that ρ a   =   n a | S T | .
For the observed data set P, the observed network cross K-function, K ^ b a ( t ) , is as follows:
K ^ b a ( t )   =   | S T | n a n b i   =   1 n b ( t h e   n u m b e r   o f   p o i n t s   o f   A   o n   S b i ( t ) )  
The Standard Deviation (SD) of the normal distribution was calculated to obtain an approximation of the 95% confidence envelope, and the maximum and minimum values of ± 1.65   ×   SD using one-sided tests were accepted for assessing the statistical significance of departures of K ^ b a ( t ) from CSR. If K ^ b a ( t ) > K b a ( t ) and is outside of the trust envelope, points A and B are significantly related. If K ^ b a ( t ) < K b a ( t ) and is outside the confidence envelope, points A and B are not significantly related [19].
Upon testing the relationship between land-use change and FDAs, the authors also compared the differences in soil loss and runoff estimate among pre- (1977) and post- (2016) land-use changes in this study. The soil loss difference of the study area was investigated using the Revised Universal Soil Loss Equation (RUSLE) model, developed by Wischmeier and Smith [29] as follows:
A   =   R × K × L S × C × P
where A is average annual soil loss (tones/ha/year), R is the rainfall runoff erodibility factor, K is the soil erodibility factor, LS is the slope length and steepness factor, C is the land cover and management factor, and P is the erosion control practice factor.
The rainfall factor R is obtained from the temporal distribution of precipitation and is mean annual erodibility (EI30) divided by 100 [30]. EI30 is expressed as the product of kinetic energy when rain falls on the surface and the maximum rainfall intensity for 30 minutes [29]. However, this study used the equation proposed by Toxopeus [31], which uses annual mean precipitation, because there was no long-term measured rainfall data calculated using this method for more than 20 years. The equation is as follows:
R   =   3.85 + 0.35 × P a
where R is the rainfall runoff erodibility factor, and Pa is the annual mean precipitation data.
In this study, K values were determined according to the classification system of soil conservation service criteria of the United States [26,32] (Table 2) based on grain size composition and organic matter content of soil from the database of the numerical soil map.
The topographic factor LS is the ratio of slope length and slope to soil loss, which is the ratio of expected soil loss per unit compartment to slope length factor (L) and slope factor (S). The slope length is the distance from the point where the flow starts to that where deposition occurs, and the slope is the average slope of the surface, expressed as a percentage altitude difference relative to the horizontal distance. The formula is as follows [33]:
L S   =   ( X 22.13 ) m × ( 0.065 + 0.045 × S + 0.0065 × S 2 )
where S is slope (%), X is slope length (m), and m is 0.2 (slope <1), 0.3 (1 ≤ slope < 3), 0.4 (3 ≤ slope < 5), or 0.5 (slope ≥ 5).
The land cover and management factor C quantitatively indicates the degree of erosion prevention by vegetation cover. An increase in factor, C, is indicative of a decrease in surface or aqueduct, leading to an increase in soil erosion rate. Vegetation cover represents the vegetation canopy, the density of the cover, the structure, and the type and amount of coverings associated with the soil [32]. C was classified as crop field (0.4), forest (0.1), and water (0) based on a study by [26] (Table 3).
The erosion control factor, P, considers the cultivated form and is calculated as a percentage of the slope. The type of erosion of the land varies depending on the type of tillage: terraced, contour, and contour strip. In the study area, P was calculated using the contour tillage criteria (Table 4) because this was the main type in the study area [26].
The runoff difference for the sub-watershed in the study area was estimated using the Rational Method, which has often been used to calculate peak runoff in South Korea. The equation is as follows [34]:
Q   =   0.2778   ×   C   ×   I   ×   A  
where Q is peak runoff (m3/sec), C is the runoff coefficient, I is rainfall intensity (mm/hr), and A is a tributary area (km2).
In this study, the runoff coefficient relies on land-use type. The criteria presented by Kim [35] were applied to runoff coefficient calculation. Rainfall intensity was calculated based on the criteria derived from Choopoongryeong in South Korea [36] since its terrain is similar to that of Hoeryeong City.

3. Results and Discussion

3.1. Geographic Properties of Land-Use Change Area

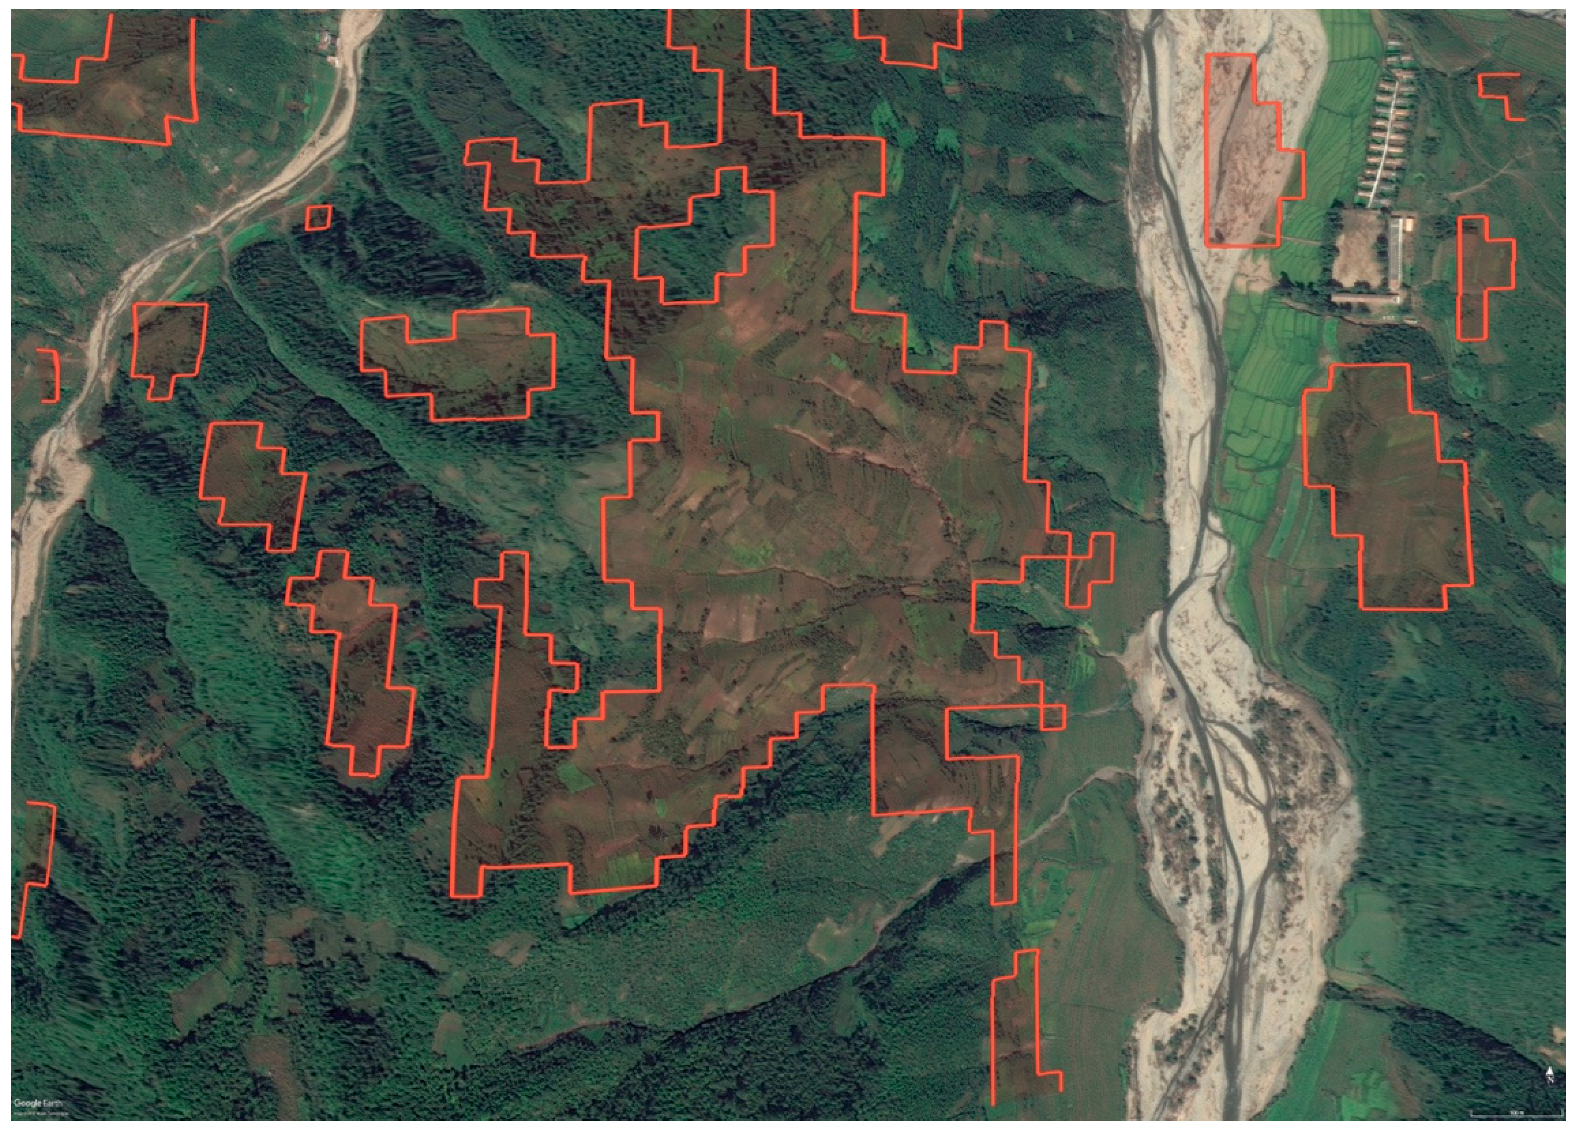
Land cover classification results were the same as the land-use type of the study area. The 1977 and 2016 classification results showed 95% and 98.7% overall accuracy with a Kappa coefficient of 0.94 and 0.97, respectively, indicating a satisfactory level of accuracy. In order to confirm the result of the land-use change from forest to crop field, land-use change map was overlaid on the high-resolution Google Earth imagery and visually interpreted. Orange regions illustrated deforestation (Figure 3). There is some miss detected region on the stream. However, deforestation was detected well.
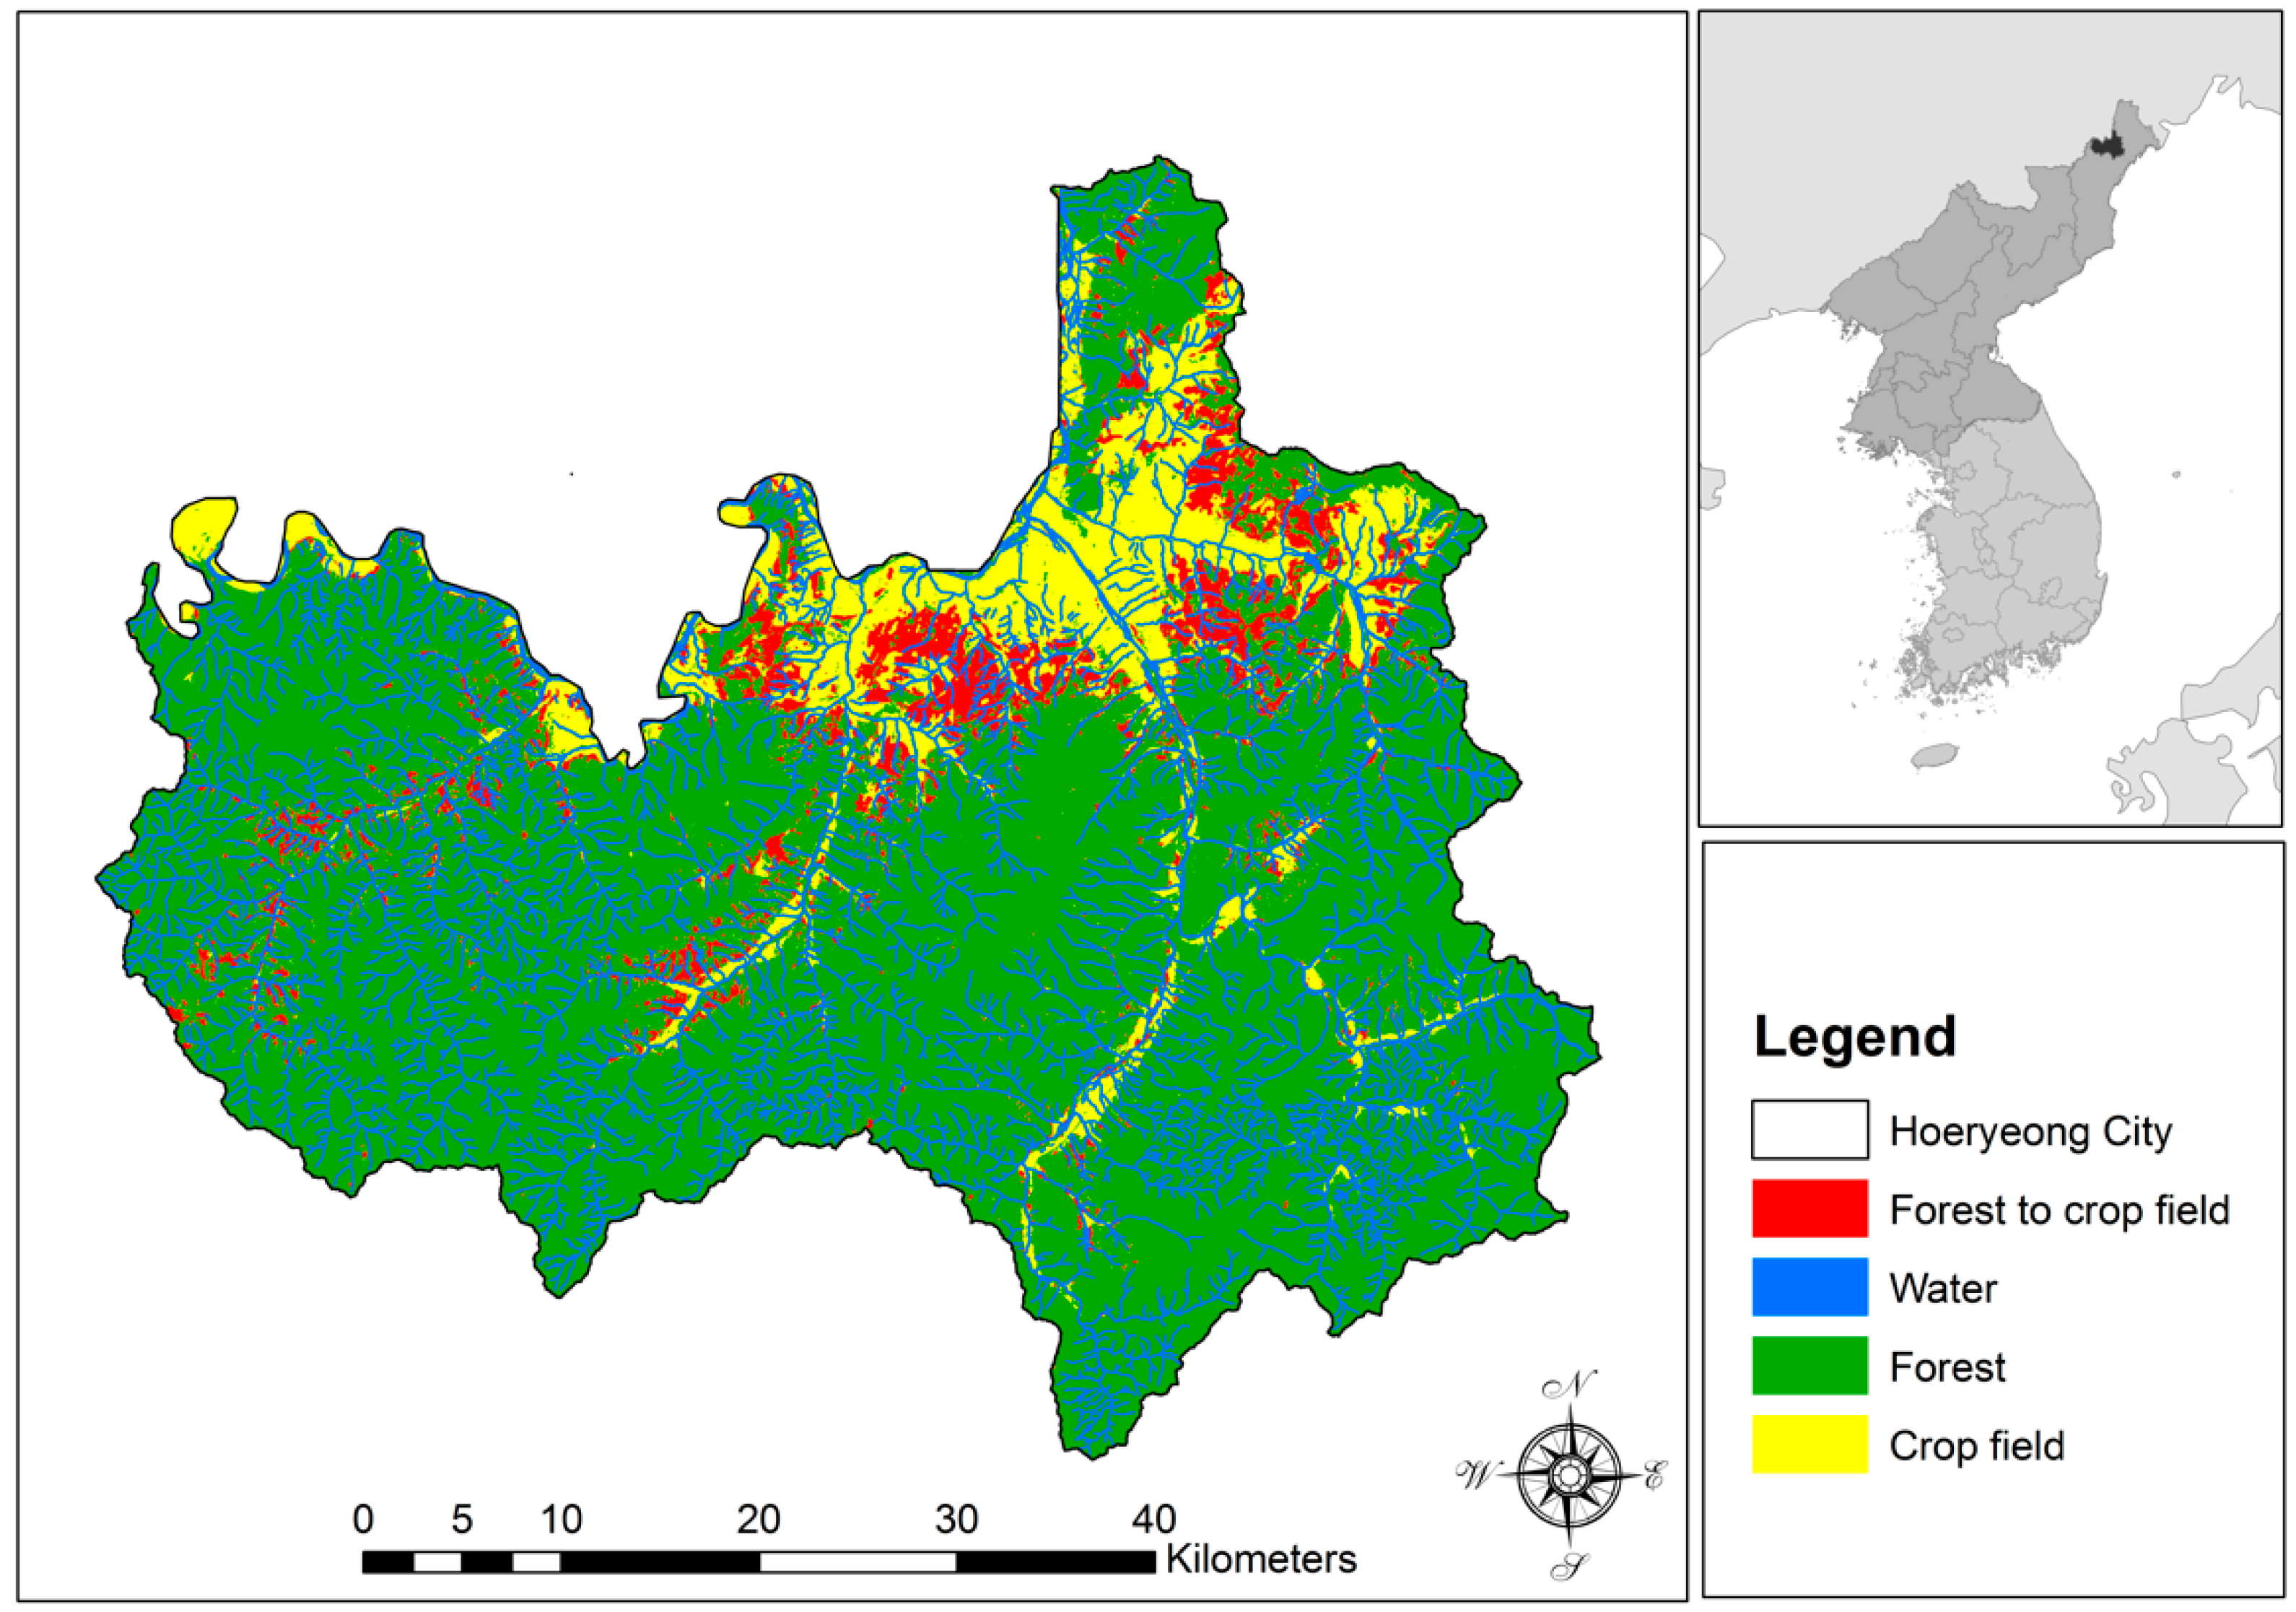
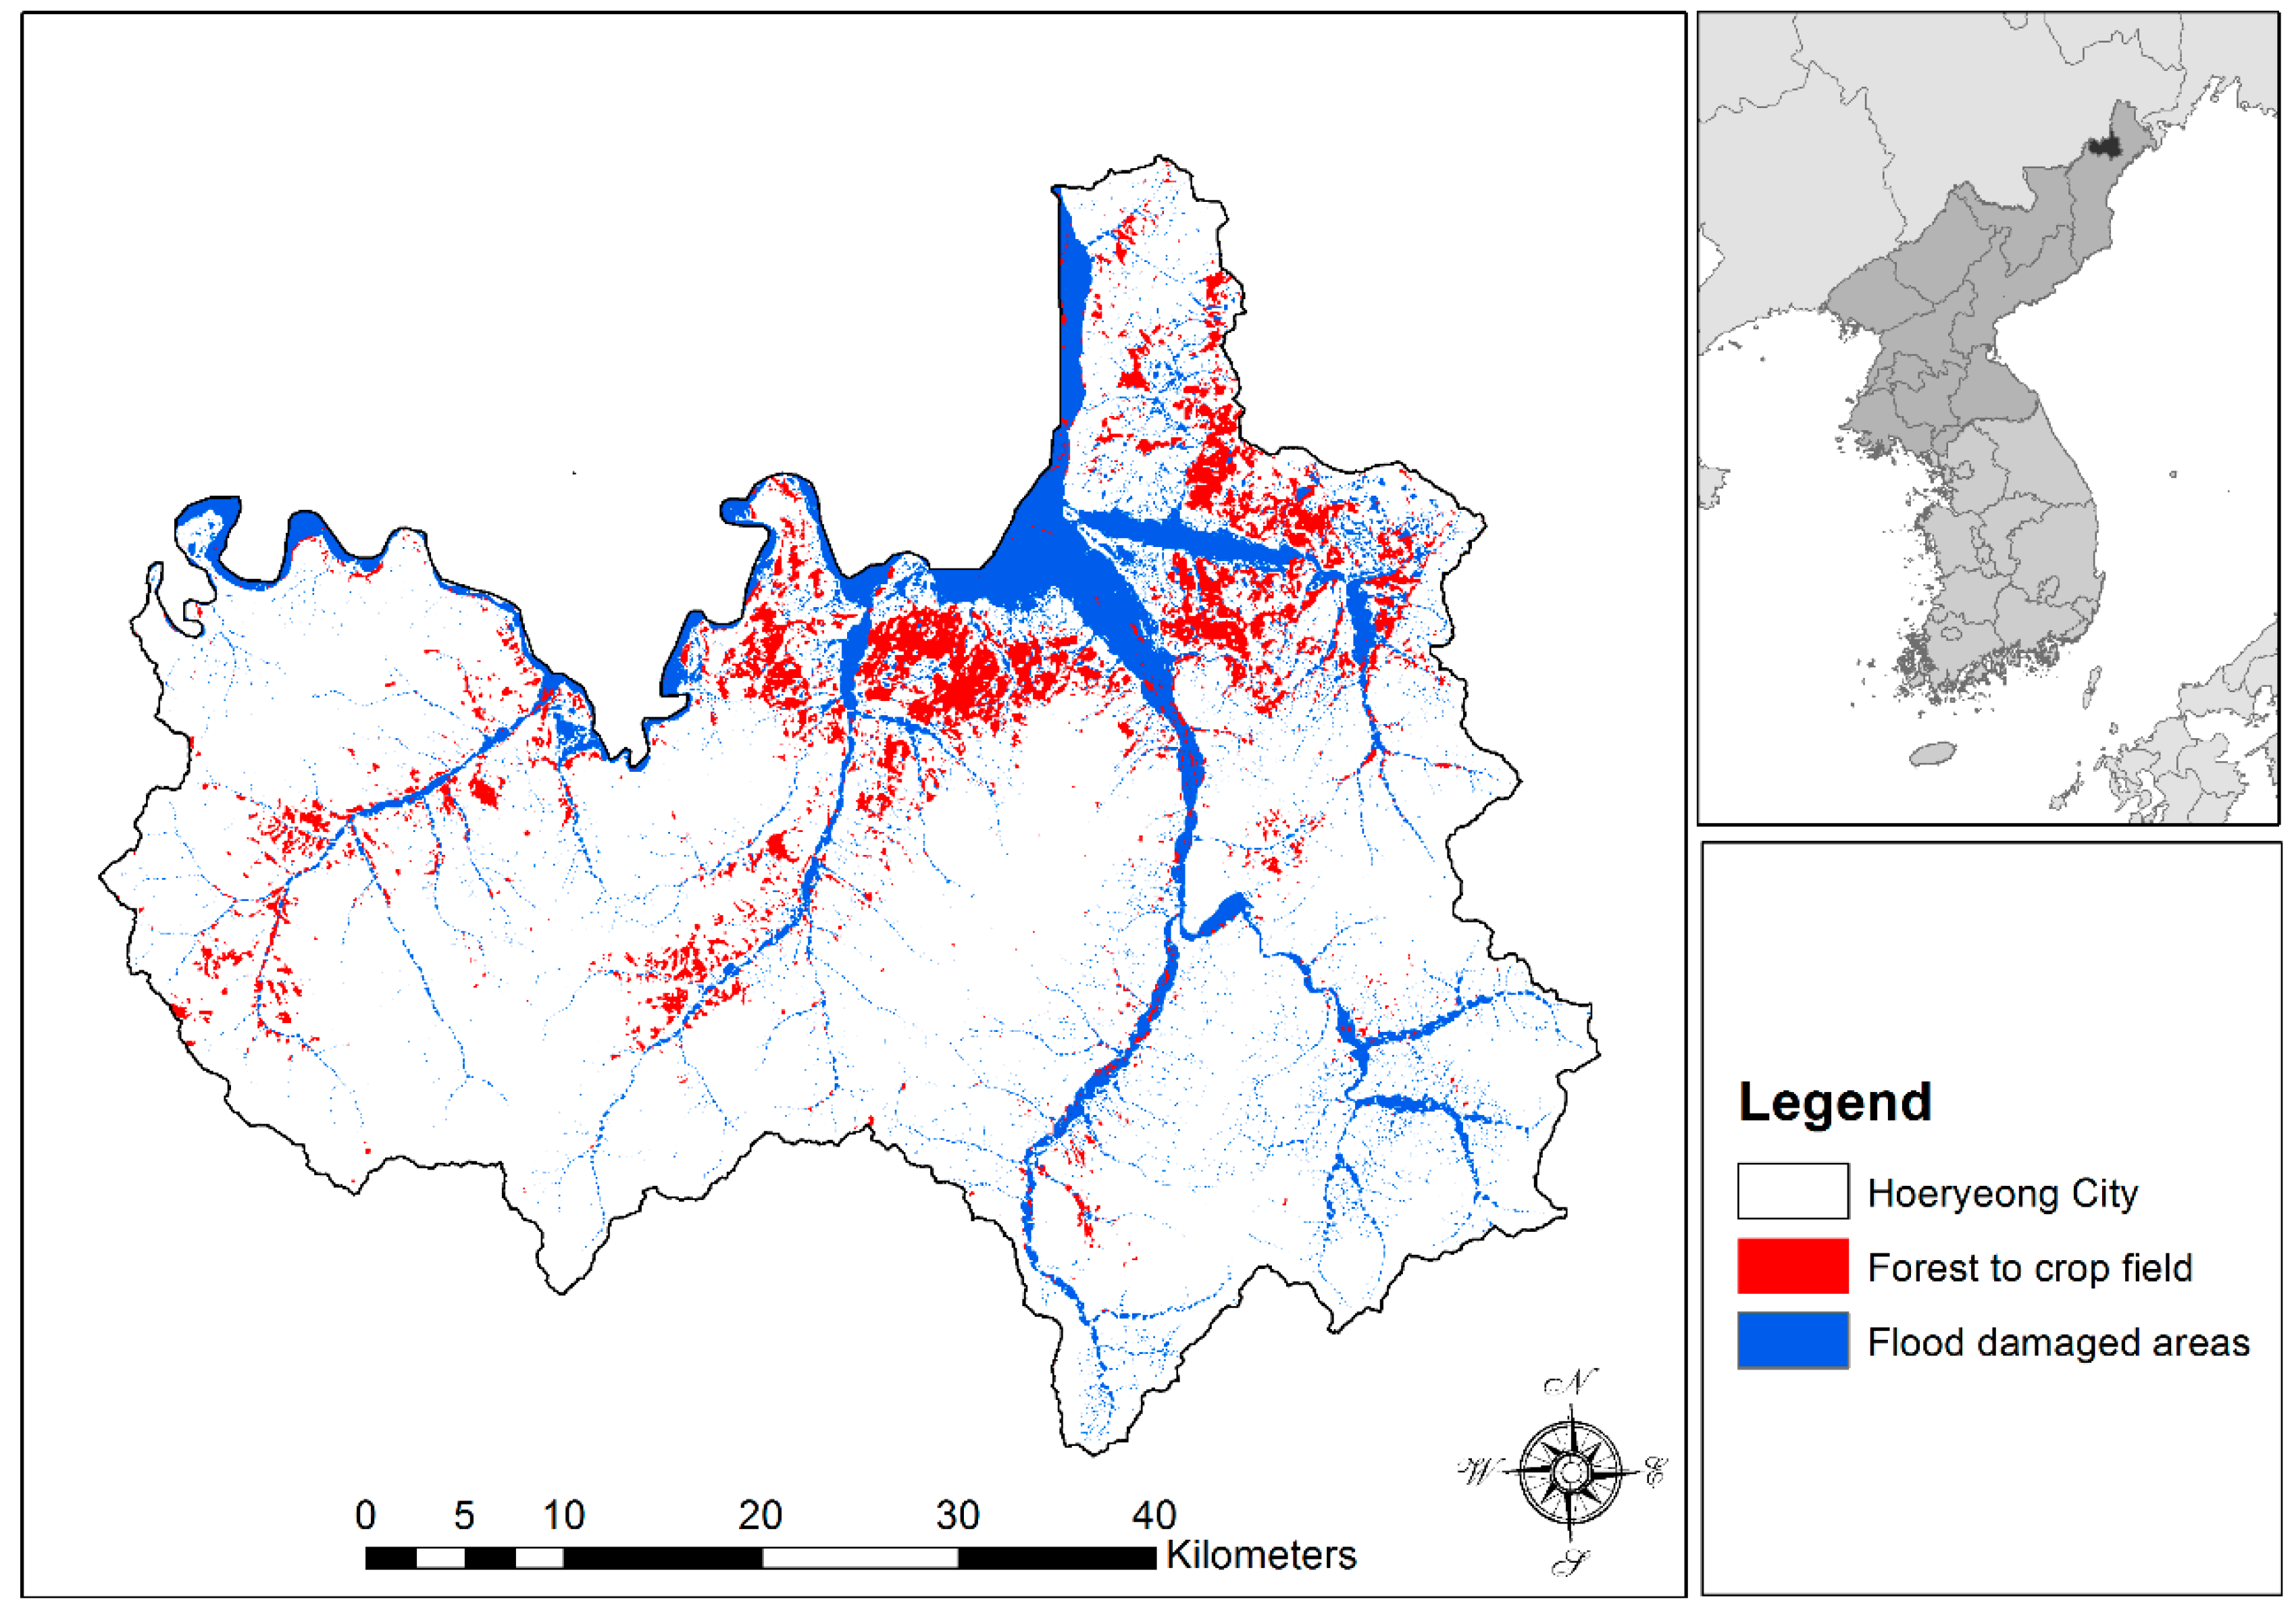
Classification results for the 1977 map were as follows: 4.4 km2 (0.3%) of water, 1156.8 km2 (84.6%) of forest, and 205.7 km2 (15.1%) of crop field, while the 2016 map yielded the following results: 5.3 km2 (0.4%) of water, 1098.4 km2 (80.4%) of forest, and 262.5 km2 (19.2%) of crop field. There were many changes in land-use within the study area from 1977 to 2016, particularly a 56.8 km2 (4.9%) change from forest to crop field (Figure 4).
The land-use change areas (i.e., forest to crop field) were 25.35 km2 (29.15%), 49.64 km2 (57.09%), 9.30 km2 (10.70%), 2.16 km2 (2.49%), 0.47 km2 (0.54%), and 0.03 km2 (0.03%) in elevation groups of 210 m to 400 m, 400 m to 600 m, 600 m to 800 m, 800 m to 1000 m, 1000 m to 1200 m, and 1200 m to 1450 m, respectively.
The land-use change areas were dispersed by 12.2 km2 (14.0%), 24.9 km2 (28.6%), 22.5 km2 (25.8%), 17.4 km2 (20.1%), and 10.0 km2 (11.5%) at slopes of 0° to 5°, 5° to 10°, 10° to 16°, 16° to 25°, and 25° to 80°, respectively.
The land-use change areas near the main stream and the 2nd, 3rd, 4th, 5th, and 6th streams were 0.6 km2 (0.7%), 8.7 km2 (10.0%), 26.6 km2 (30.7%), 37.7 km2 (43.3%), 11.8 km2 (13.6%), and 1.5 km2 (1.7%), respectively. The maximum change was observed in forest areas near the upper streams with a relatively high elevation (400–600 m) and a steep slope (5–25°).
After the collapse of the Soviet Union in 1989, food aid to North Korea was cut off. In response, the North Korean government changed forest land-use policy, resulting in deforestation of steep slopes to provide land for farms [37]. According to a report released by the South Korean government in 2004 [7], 7.9% (972 thousand ha) of North Korea’s total area (12,298 thousand ha) was classified as deforested (i.e., as terraced crop fields).
The reason why the North Korean government changed mountainous forest areas to crop fields has to do with the overall landform of the area. According to the Geomorphon landform classification scheme, the area consists mainly of slopes (509.75 km2, 37.3%), followed by spurs (249.5 km2, 18.3%), hollows (207.6 km2, 15.2%), valleys (153.7 km2, 11.3%), ridges (129.7 km2, 9.5%), flats (63.6 km2, 4.7%), footslopes (28.8 km2, 2.1%), peaks (13.3 km2, 0.9%), shoulders (6.0 km2, 0.4%), and pits (4.8 km2, 0.3%).
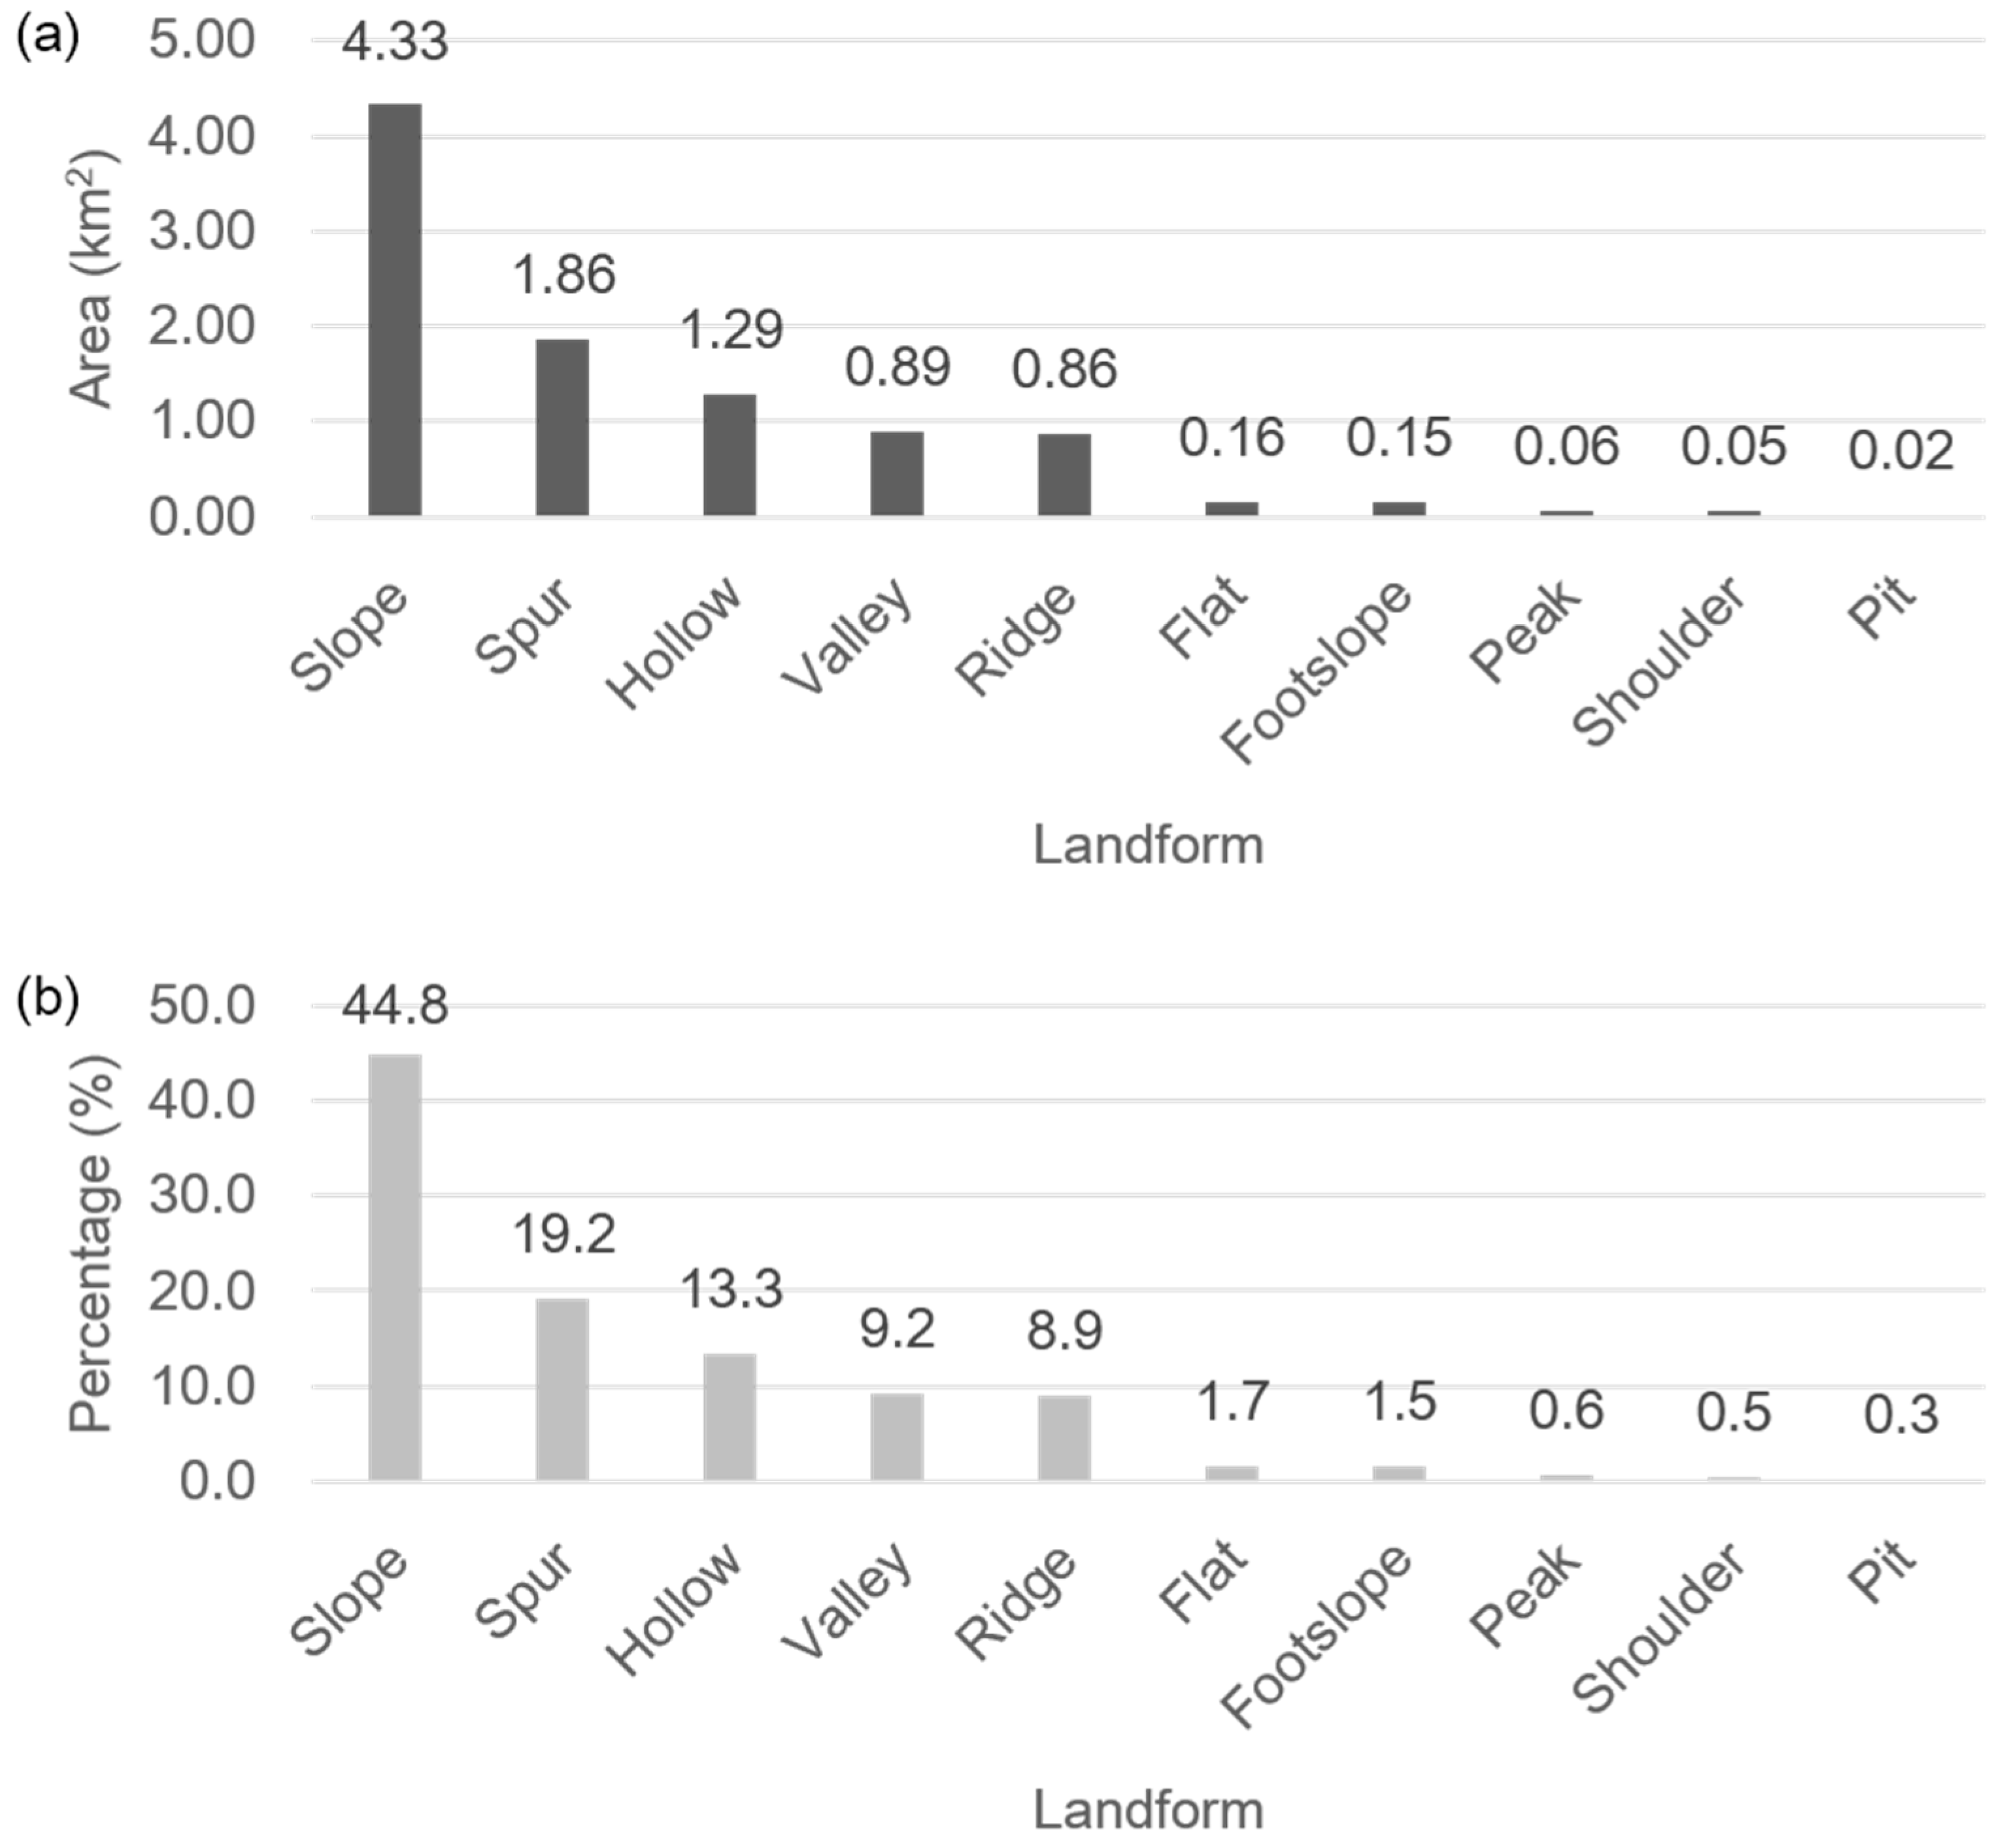
Thus, the North Korean government cleared mountainous forest areas for crop fields to solve their food supply problem. The landform of the change area mostly consisted of slopes (4.33 km2, 44.8%), followed by spurs (1.86 km2, 19.2%), hollows (1.29 km2, 13.3%), valleys (0.89 km2, 9.2%), ridges (0.86 km2, 8.9%), flats (0.16 km2, 1.7%), footslopes (0.15 km2, 1.5%), peaks (0.06 km2, 0.6%), shoulders (0.05 km2, 0.5%), and pits (0.02 km2, 0.3%) (Figure 5). These results suggest that the areas of land-use change have been transformed into terraced crop fields.

3.2. Spatial Correlation, Soil Loss, and Runoff Change

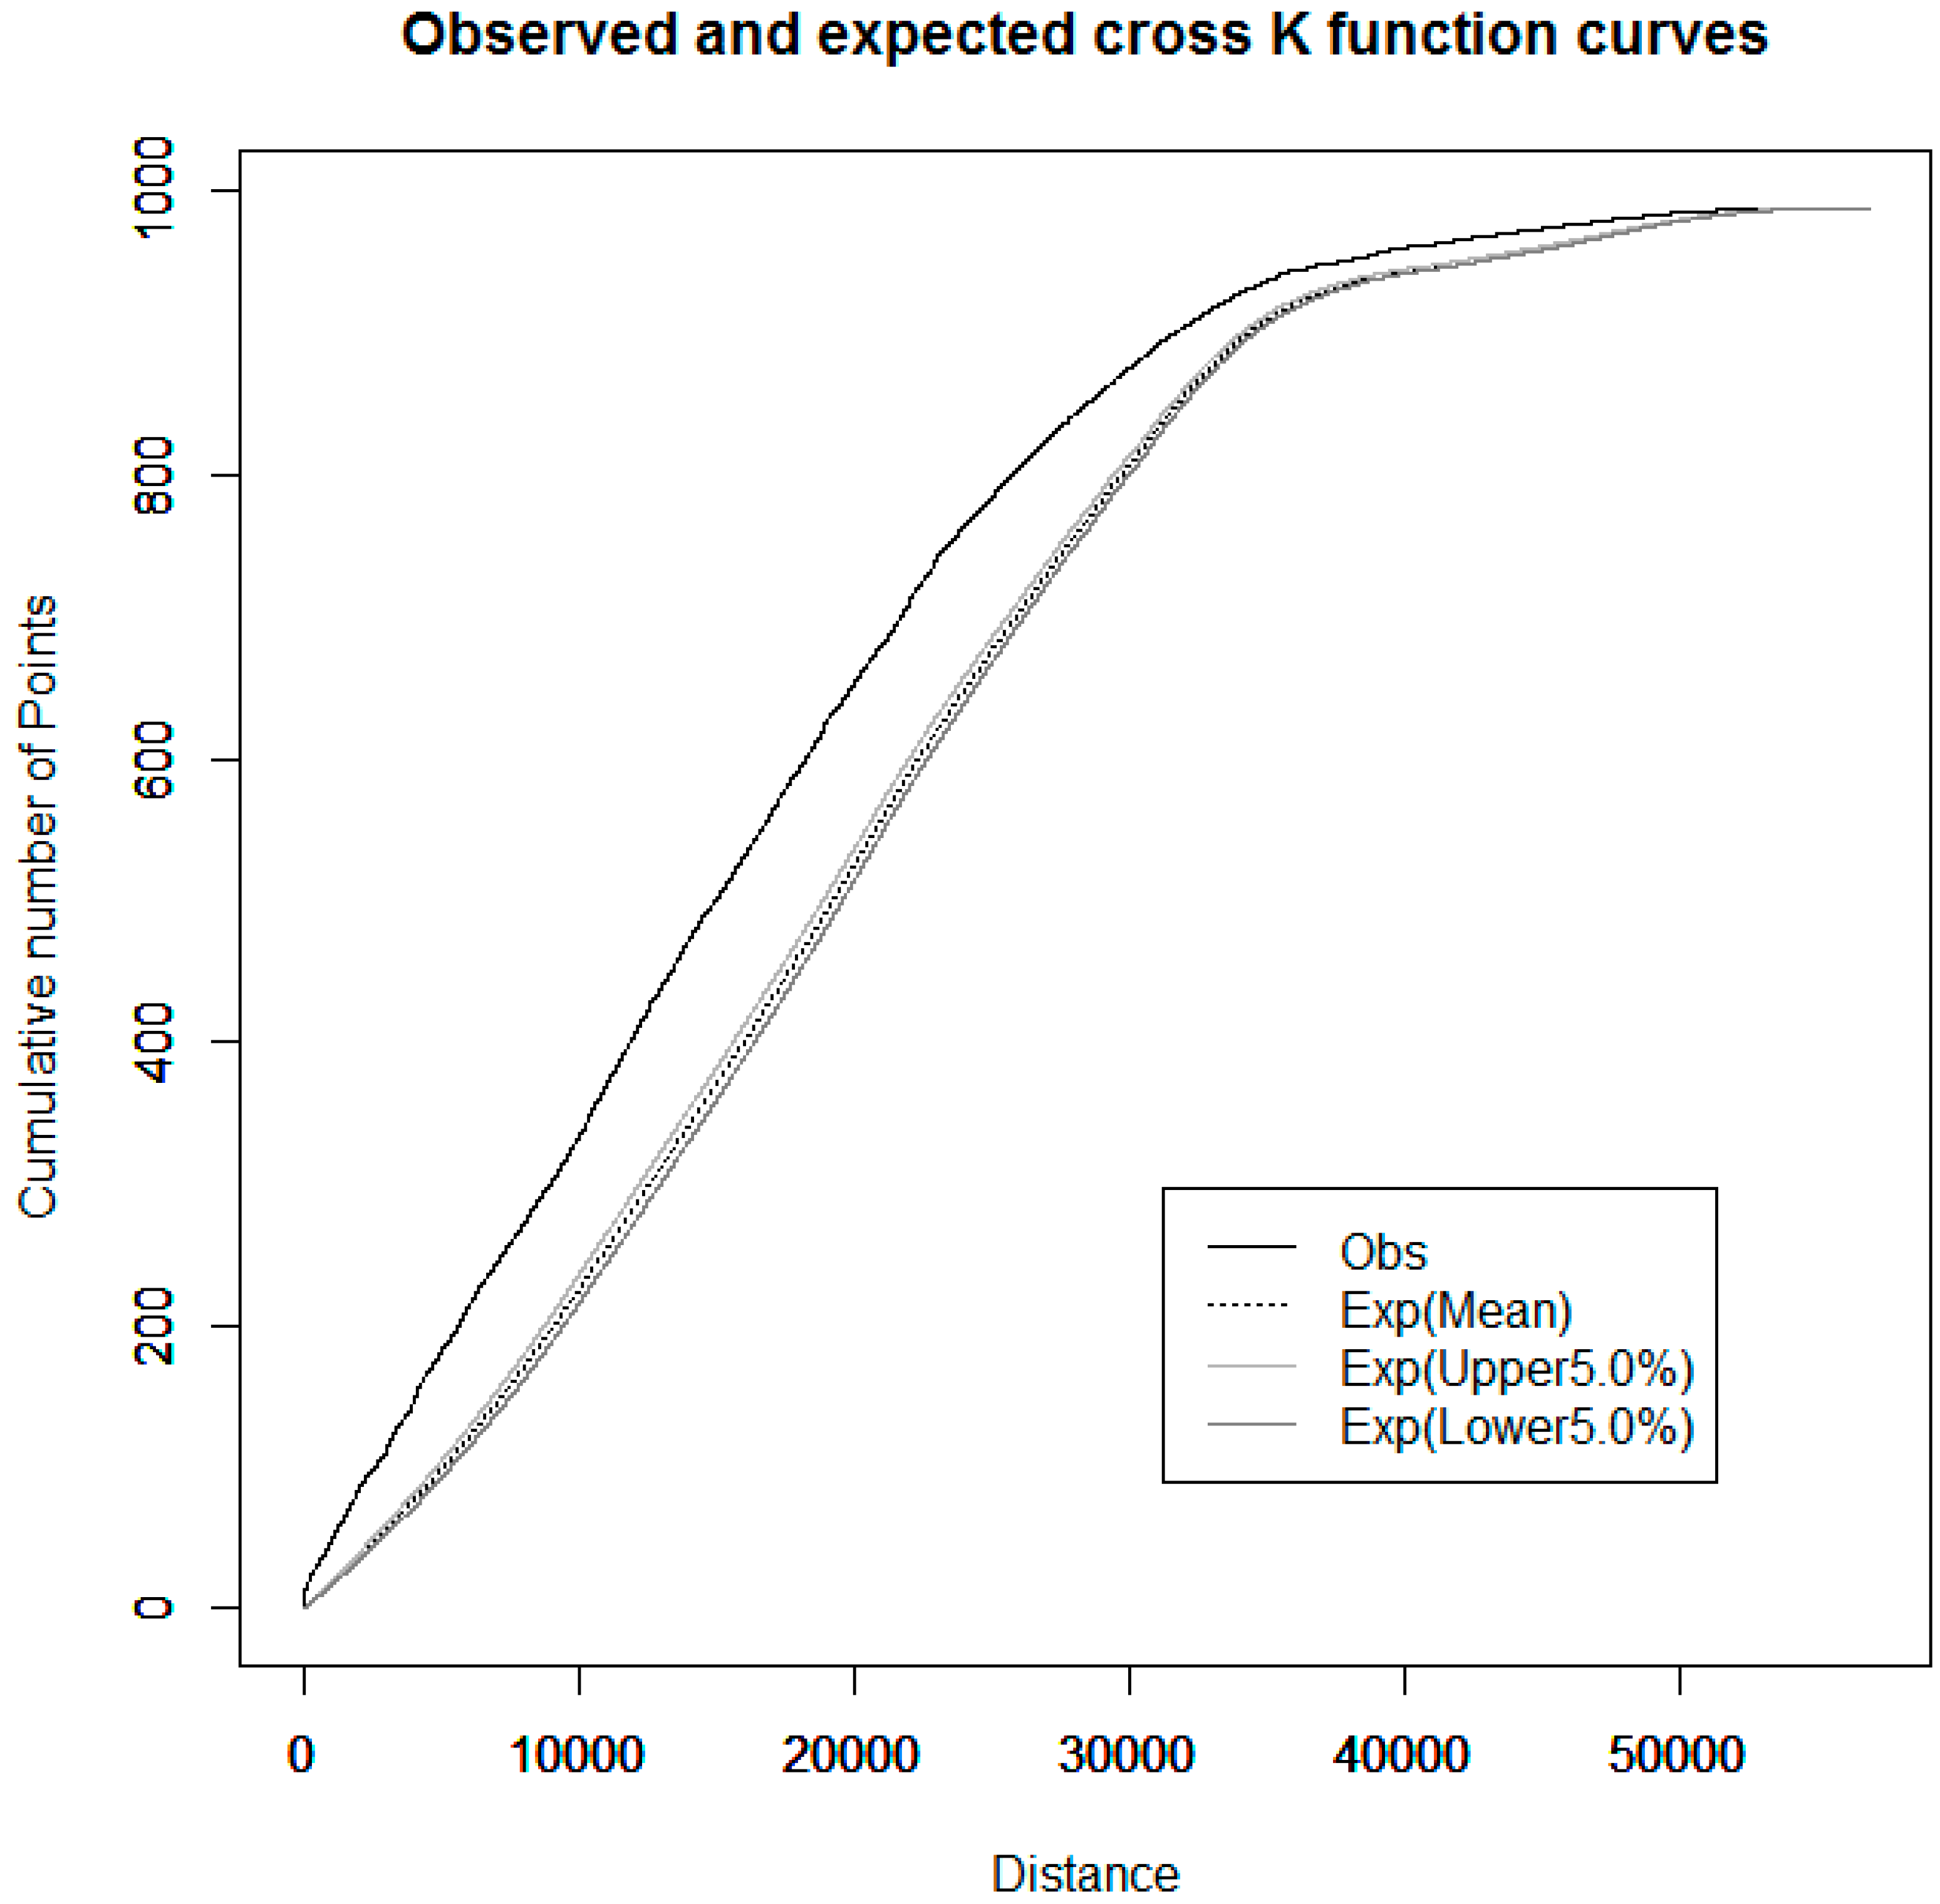
Network cross K-function analysis was carried out to determine the effects of land-use change at Hoeryeong City on FDAs. As shown in Figure 6, the curve of observed flooding was above the upper expected curve; therefore, the CSR hypothesis was rejected. Thus, the land-use change was concluded to strongly affect the occurrence of floods. Figure 7 shows the land-use change areas in relation to the FDA locations. Since the topography of the study area was dominated by mountains and most of the river lengths were short and traversed steep slopes, there was a high risk of flood damage [4,8]. In addition, the location of terraced crop fields on steep slopes and at high elevations has led to a decline in fertility and productivity [7]. Inadequate countermeasures against soil loss and post-management strategies have also contributed to devastation in the mountain areas [7].
To support the study results, the effects of land-use change on soil loss and runoff change were estimated. Regarding soil loss class, loss of less than 50 tons occurred in 608 km2 (45.1%), 50 to 100 tons in 356 km2 (26.4%), 100 to 150 tons in 198 km2 (14.7%), 150 to 200 tons in 97 km2 (7.2%), and over 200 tons in 88 km2 (6.6%) in 1977. In 2016, the respective affected areas were 576 km2 (42.7%), 359 km2 (26.6%), 202 km2 (15%), 101 km2 (7.5%), and 110 km2 (8.2%). The decrease of less than 50 tons (32 km2, 4.4%) and the increase of more than 200 tons (32 km2, 1.6%) were noticeable.
Regarding land-use change area (i.e., forest to crop field), that losing 50 tons decreased by 25 km2 (29.3%) and that increased by more than 200 tons increased by 14 km2 (16.6%). These results indicate that land-use change brought about the increase in soil loss.
In addition, due to deforestation, the runoff coefficient increased from 0.31 to 0.46. Deforestation involved removing vegetative cover, which made the land cover become bare soil. Bare soil increased the runoff coefficient sharply. It increased surface runoff, which causes erosion of the land surface. As a result, eroded materials were deposited in the stream or river in the study site. It lowered the stream or river depth and overflowed river water flooded in the study site. Rainfall intensity is affected by the time of concentration, which is affected by land cover such as runoff coefficients. If forests are changed to crop fields, the time of concentration decreases, and rainfall intensity increases [35]. In this study, rainfall intensity increased from 56.3 mm/hr to 60.8 mm/hr because of land-use change. Lastly, peak time runoff increased from 128.2 m3/sec to 206.6 m3/sec (Table 5). Consequently, land-use change from forest to crop field on a steep slope increased soil loss and peak time runoff.
In the summer monsoon season, deforestation results in the vulnerability of the land to flooding and landslides [13,14,15,38]. As such, steep-slope and forest-to-crop field land-use changes increased soil loss, contributing to flood damage by way of mass wasting, including rockslides and debris flows from terraced crop fields. It was assumed that the rise in riverbed elevation resulting from sediments carried and deposited by heavy rainfall in North Korea monsoon events reduced river and stream drainage capacities [1,2,39].
In 2016, the study area also experienced levee breaches that contributed to extreme flood damage. As previously mentioned, the North Korean state media described the 2016 flood as the largest natural disaster since 1945 [3].
Based on these findings, we concluded that: (1) peak time runoffs and amount of soil loss involving mass wasting (including rockslides and debris flows) have increased in terraced crop fields that were previously forests; (2) debris sediments from upper streams caused an increase in riverbeds and a reduction in drainage capacity; and (3) dike breaches resulted in severe flood damage in the study area. Thus, although the transformation of mountain and hill forests to terraced crop fields in North Korea over the past 30 years has increased agricultural production [4,5,7], these measures have increased the risk of flood disasters and have failed to solve food shortages.
These phenomena have affected change in land-use policy of North Korea. The North Korean government started to consider supporting local communities to restore forest cover on cleared steep slopes [37]. In 2002, the government initiated the Sloping Land Management Program (SLMP), which aimed to improve ecosystem services on sloping lands by large-scale afforestation of land with a slope greater than 15 degrees [40,41]. However, this program was not very successful due to the continuing agricultural activities that rapidly encroached upon sloping lands [37]. In 2004, the North Korean Ministry of Land and Environment Protection (MoLEP) and the Swiss Agency for Development and Cooperation (SDC) collaborated to implement the SLMP. In 2008, SDC and MoLEP invited the World Agroforestry Centre’s East and Central Asia Office (ICRAF-ECA) to join the SLMP to provide technical advice for land-use planning and agroforestry development [37]. Consequently, several positive outcomes were observed in the Hwanghae Province, such as an increase in forest cover and establishment of protective grass strips that have helped to reduce soil erosion [37]. In addition, the North Korean Government developed a National Agroforestry Strategy (NAS) in 2014 to ensure SLMP implementation. The NAS aims to apply agroforestry development to improve people’s livelihoods and food security and to restore upland forest ecosystems by granting user groups the land-use rights to 360,000 ha of sloping land by 2023 [37].
The deforestation effects on flood was just investigated at Hoeryeong City. These results can be adapted on the similar geographic properties region in North Korea, especially the east mountainous region. However, deforestation effect on flood at the west of North Korea, where are low elevation and flat regions, should be investigated in the future study. Besides, deforestation was defined forest to crop field in this study; however, deforestation of North Korea has three kinds of patterns such as cultivated (terrace field), unstocked land, and bare mountain. Thus, deforestation should be classified into three categories in the future study.
Despite these limitations in the study, this study is meaningful for the first time to try to investigate the effects of deforestation on the occurrence of floods in North Korea through spatial statistical techniques, changes in soil loss, and the runoff coefficient. Besides, it is meaningful to lay the foundation for evaluating the interrelationship between deforestation and flood in North Korea.

4. Conclusions

Natural disasters like flooding can be due to changes in forest land-use policy. In this study, we tried to identify the effects of deforestation on flooding at Hoeryeong City in North Korea through spatial statistical and numerical analysis methods. The results of this study showed that the land-use change of deforestation was strongly related to the occurrence of flooding. In the deforestation area, the area of the soil loss class over 200 tons/yr increased by 14 km2 (16.6%), while that of areas losing less than 50 tons/yr decreased by 25 km2 (29.3%). This result indicates that deforestation brought about an increase in soil loss. In addition, due to the land-use changes, the runoff coefficient increased, rainfall intensity increased, and peak time runoff increased. In conclusion, deforestation at Hoeryeong City in North Korea caused severe flooding due to changes in land-use policy. To achieve effective inter-Korean forest cooperation in the future, it is necessary to seek ways to appropriately support the SLMP in North Korea. In addition, flood risk assessment should be performed when selecting forest restoration priorities, and priority should be given to high-risk areas.

Author Contributions

Conceptualization, J.L.; methodology, J.L. and K.-S.L.; resources, K.-S.L. and K.-M.K.; software, J.L.; validation, J.L., K.-S.L. and K.-M.K.; formal analysis, J.L.; investigation, J.L.; writing—original draft preparation, J.L.; writing—review and editing, J.L., K.-S.L. and K.-M.K.; visualization, J.L.; supervision, K.-S.L.; project administration, K.-S.L.

Funding

This research received no external funding.

Conflicts of Interest

The authors declare no conflict of interest.

References

  1. Lim, J.; Lee, K.S. Investigating flood susceptible areas in inaccessible regions using remote sensing and geographic information systems. Environ. Monit. Assess. 2017, 189, 96. [Google Scholar] [CrossRef] [PubMed]
  2. Lim, J.; Lee, K.S. Flood mapping using multi-source remotely sensed data and logistic regression in the heterogeneous mountainous regions in north korea. Remote. Sens. 2018, 10, 1036. [Google Scholar] [CrossRef]
  3. Kim, M.S. N. Korea Reeling from Flood Damage. Available online: http://english.chosun.com/site/data/html_dir/2016/09/19/2016091901010.html (accessed on 8 November 2016).
  4. Myeong, S.; Hong, H.; Choi, H.; Jeong, J. Estimation of Flood Vulnerable Areas in North Korea and Collaboration Strategies between South Kkorea and North Korea; Korea Environment Institute: Seoul, Korea, 2008; pp. 142–144. [Google Scholar]
  5. Myeong, S.J.; Kim, J.Y.; Lim, M.Y.; Hwang, S.H.; Son, G.W.; Ahn, J.H.; Gang, S.D.; Joo, G.S. A Study on Constructing a Cooperative System for South and North kKoreas to Counteract Climate Change on the Korean Peninsula III; Korea Environment Institute: Seoul, Korea, 2013; pp. 68–79. [Google Scholar]
  6. UNRCDPRK. Joint Assessment North Hamgyong Floods 2016; UN Resident Coordinator for DPR Korea: Pyeongyang, Korea, 2016; pp. 2–30. [Google Scholar]
  7. Lee, S.H. Situation of degraded forest land in dprk and strategies for forestry cooperation between south and north korea. J. Agric. Life Sci. 2004, 38, 101–113. [Google Scholar]
  8. Lee, M.B.; Kim, N.S.; Cho, Y.C.; Cha, J.Y. Landform and environment in border region of n. Korea and china. J. Korean Geogr. Soc. 2016, 51, 761–777. [Google Scholar]
  9. Lee, M.B.; Kim, N.S.; Lee, G.R.; Han, U. A study on the surface erosion by the development of cropland on the hillslope in the west coast area of north korea using quick bird satellite images. J. Korean Assoc. Reg. Geogr. 2005, 11, 453–462. [Google Scholar]
  10. Bradshaw, C.J.A.; Sodhi, N.S.; Peh, K.S.H.; Brook, B.W. Global evidence that deforestation amplifies flood risk and severity in the developing world. Glob. Chang. Biol. 2007, 13, 2379–2395. [Google Scholar] [CrossRef]
  11. Tan-Soo, J.-S.; Adnan, N.; Ahmad, I.; Pattanayak, S.K.; Vincent, J.R. Econometric evidence on forest ecosystem services: Deforestation and flooding in malaysia. Environ. Resour. Econ. 2016, 63, 25–44. [Google Scholar] [CrossRef]
  12. de la Paix, M.J.; Lanhai, L.; Xi, C.; Ahmed, S.; Varenyam, A. Soil degradation and altered flood risk as a consequence of deforestation. Land Degrad. Dev. 2013, 24, 478–485. [Google Scholar] [CrossRef]
  13. Lin, B.; Chen, X.; Yao, H.; Chen, Y.; Liu, M.; Gao, L.; James, A. Analyses of landuse change impacts on catchment runoff using different time indicators based on swat model. Ecol. Indic. 2015, 58, 55–63. [Google Scholar] [CrossRef]
  14. Ye, W.S.; Lee, H.S.; Lee, K.S. Application of the gis in the hydrologic effects caused by the second collective facility area development in mt. Kyeryong national park. J. Environ. Impact Assess. 1994, 3, 57–68. [Google Scholar]
  15. Guo, H.; Hu, Q.; Jiang, T. Annual and seasonal streamflow responses to climate and land-cover changes in the poyang lake basin, china. J. Hydrol. 2008, 355, 106–122. [Google Scholar] [CrossRef]
  16. Nirupama, N.; Simonovic, S.P. Increase of flood risk due to urbanisation: A canadian example. Nat. Hazards. 2006, 40, 25. [Google Scholar] [CrossRef]
  17. Ripley, B.D. Spatial Statistics; John Wiley & Sons: New York, NY, USA, 1981. [Google Scholar]
  18. Ripley, B.D. The second-order analysis of stationary point processes. J. Appl. Probab. 1976, 13, 255–266. [Google Scholar] [CrossRef] [Green Version]
  19. Spooner, P.G.; Lunt, I.D.; Okabe, A.; Shiode, S. Spatial analysis of roadside acacia populations on a road network using the network k-function. Landsc. Ecol. 2004, 19, 491–499. [Google Scholar] [CrossRef]
  20. Okabe, A.; Yamada, I. The k-function method on a network and its computational implementation. Geogr. Anal. 2001, 33, 271–290. [Google Scholar] [CrossRef]
  21. Yamada, I.; Thill, J.C. Comparison of planar and network k-functions in traffic accident analysis. J. Transp. Geogr. 2004, 12, 149–158. [Google Scholar] [CrossRef]
  22. Dai, D.; Taquechel, E.P.; Steward, J.; Strasser, S. The impact of built environment on pedestrian crashes and the identification of crash clusters on an urban university campus. West. J. Emerg. Med. 2010, 11, 294–301. [Google Scholar]
  23. Gunjal, K.; Goodbody, S.; Hollema, S.; Ghoos, K.; Wanmali, S.; Krishnamurthy, K.; Turano, E. Fao/Wfp Crop and Food Security Assessment Mission to the Democratic People’s Republic of Korea; Food and Agriculture Organization of the United Nations/World Food Programme: Rome, Italy, 2013; p. 11. [Google Scholar]
  24. Wikipedia. Hoeryong. Available online: https://en.wikipedia.org/wiki/Hoeryong (accessed on 8 March 2019).
  25. Wikipedia. North korea. Available online: https://en.wikipedia.org/wiki/North_Korea#Climate (accessed on 8 June 2016).
  26. Lee, M.B.; Kim, N.S.; Kang, C.S.; Shin, K.H.; Choe, H.S.; Han, U. Estimation of soil loss due to cropland increase in hoeryeung, northeast korea. J. Korean Assoc. Reg. Geogr. 2003, 9, 373–384. [Google Scholar]
  27. Jasiewicz, J.; Stepinski, T.F. Geomorphons—a pattern recognition approach to classification and mapping of landforms. Geomorphology 2013, 182, 147–156. [Google Scholar] [CrossRef]
  28. Jensen, J.R. Introductory Digital Image Processing: A Remote Sensing Perspective., 4th ed.; Pearson Education: Glenview, IL, USA, 2016. [Google Scholar]
  29. Wischmeier, W.H.; Smith, D.D. Predicting Rainfall Erosion Losses-A Guide to Conservation Planning; USDA, Science and Education Administration: Hyattsville, MD, USA, 1978. [Google Scholar]
  30. Morgan, R.; Davidson, D. Soil Erosion and Conservation; Longman Scientific & Technical co-published with John Wiley & Sons: Essex, UK; New York, NY, USA, 1986. [Google Scholar]
  31. Toxopeus, A.G. Ism: An Interactive Spatial and Temporal Modelling System as a Tool in Ecosystem Management; ITC: Kolkata, India, 1996. [Google Scholar]
  32. Lee, M.B.; Kim, N.S.; Jin, S.; Kim, H.D. A study on the soil erosion by landuse in the imjin river basin, dmz of cental korea. J. Korean Geogr. Soc. 2008, 43, 263–275. [Google Scholar]
  33. Ogawa, S.; Saito, G.; Mino, N.; Uchida, S.; Khan, N.M.; Shafiq, M. Estimation of Soil Erosion Using Usle and Landsat Tm in Pakistan. Available online: https://www.geospatialworld.net/article/estimation-of-soil-erosion-using-usle-and-landsat-tm-in-pakistan/ (accessed on 1 September 2009).
  34. Landphair, H.C.; Klatt, F. Landscape Architecture Construction, 2nd ed.; Elsevier: New York, NY, USA, 1988; pp. 112–122. [Google Scholar]
  35. Kim, J. A Study on Runoff Coefficient Estimation of Rational Method in the Korean River Basins. Ph.D. Thesis, Hongik University, Seoul, Korea, 2003. [Google Scholar]
  36. MOLIT. 1999 Report on the Development of Water Resources Management Techniques, Volume 1: Supplementary Appendix, Korea Probability Rainfall Rate; Ministry of Land, Infrastructure and Transport: Gwacheon, Korea, 2000; pp. 2–10. [Google Scholar]
  37. He, J.; Xu, J. Is there decentralization in north korea? Evidence and lessons from the sloping land management program 2004–2014. Land Use Policy 2017, 61, 113–125. [Google Scholar] [CrossRef]
  38. Shankman, D.; Liang, Q. Landscape changes and increasing flood frequency in china’s poyang lake region. Prof. Geogr. 2003, 55, 434–445. [Google Scholar] [CrossRef]
  39. Kwak, I.O. Spatial Structure and Function of Heoryong Market. Ph.D. Thesis, Korea University, Seoul, Korea, 2013. [Google Scholar]
  40. Xu, J.; van Noordwijk, M.; He, J.; Kim, K.-J.; Jo, R.-S.; Pak, K.-G.; Kye, U.-H.; Kim, J.-S.; Kim, K.-M.; Sim, Y.-N.; et al. Participatory agroforestry development for restoring degraded sloping land in dpr korea. Agrofor. Syst. 2012, 85, 291–303. [Google Scholar] [CrossRef]
  41. He, J.; Ho, M.H.; Xu, J. Participatory selection of tree species for agroforestry on sloping land in north korea. Mt. Res. Dev. 2015, 35, 318–327. [Google Scholar] [CrossRef]
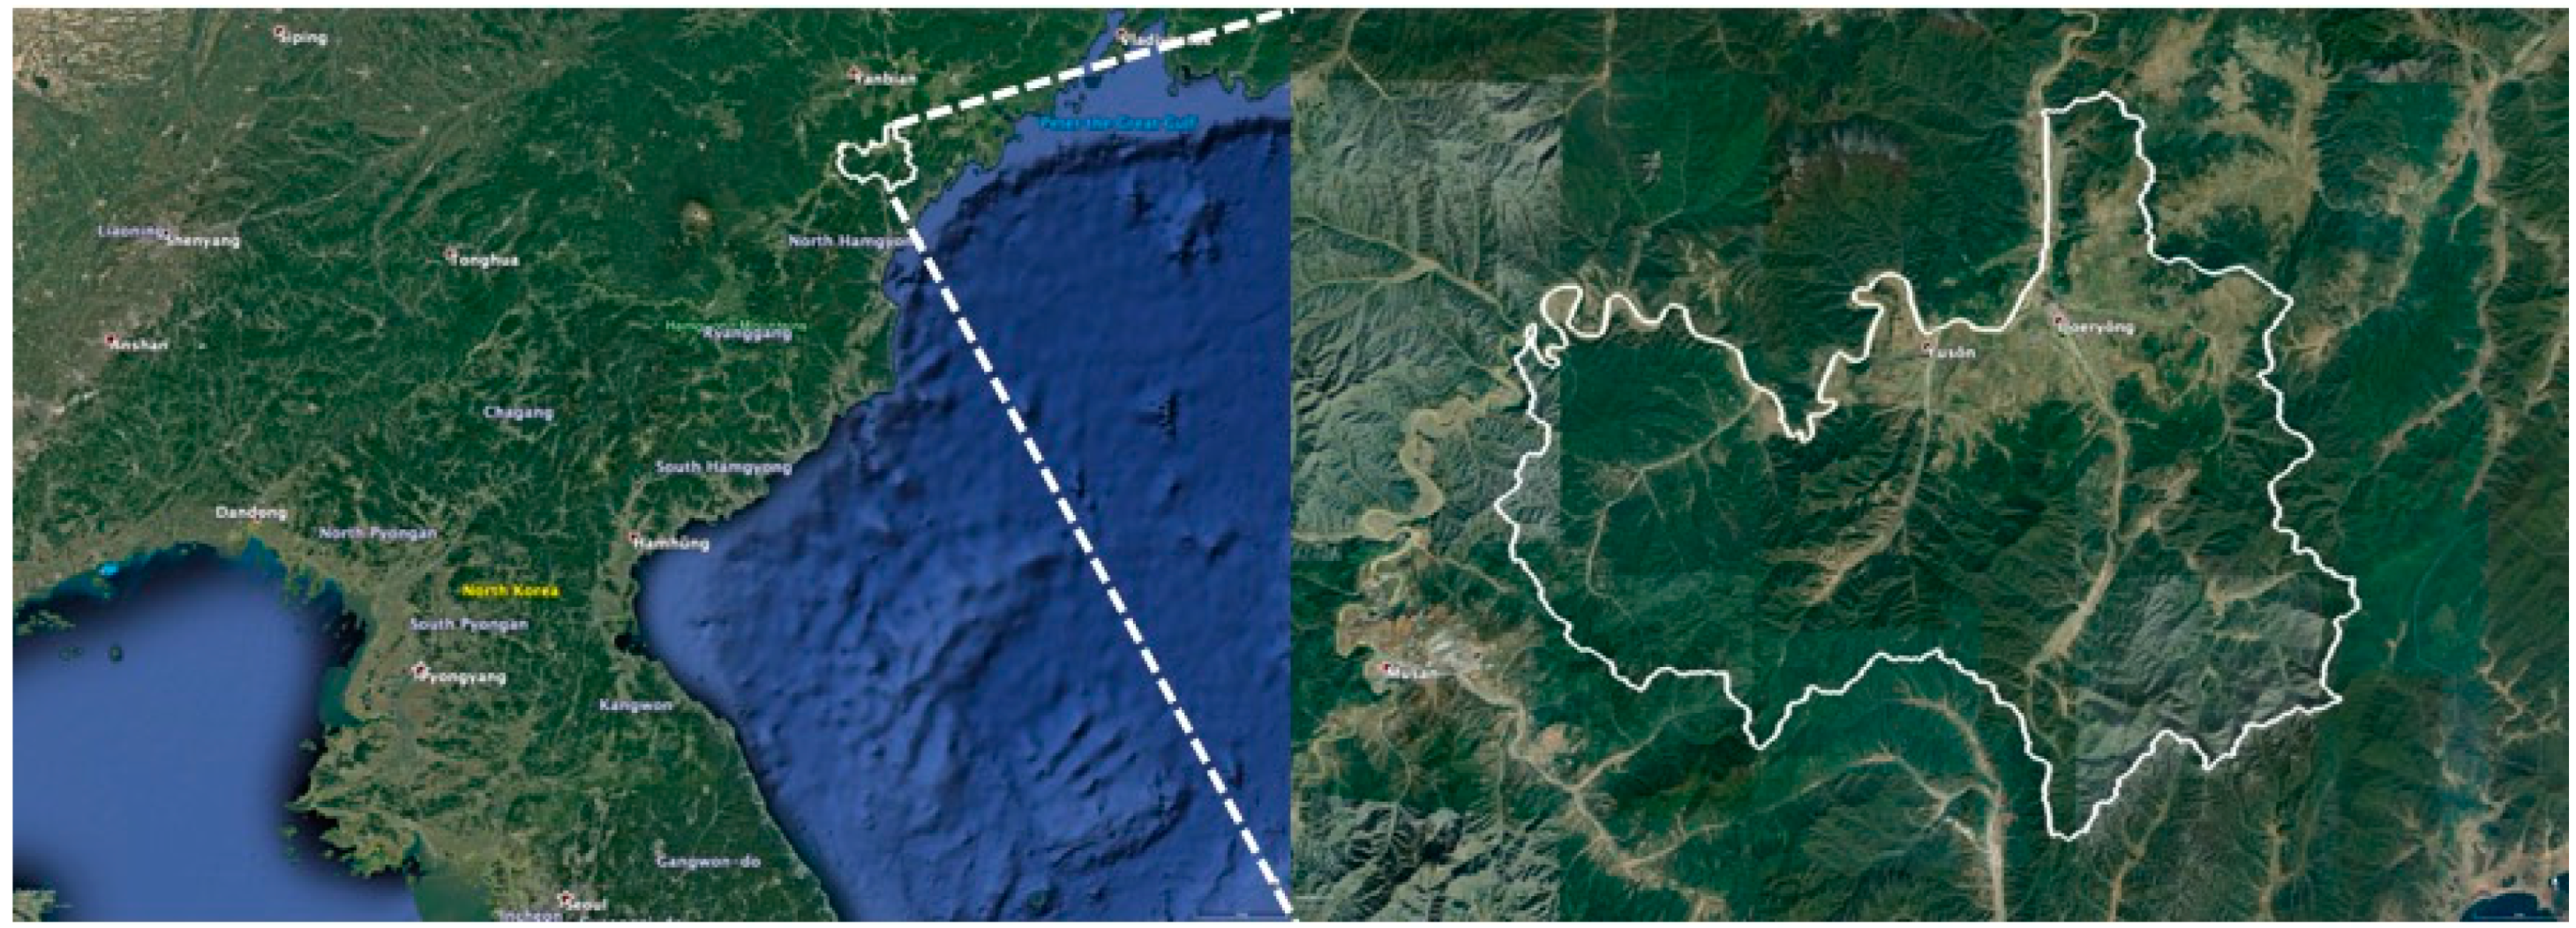
Figure 1. Satellite images of the study area (source: Google Earth imagery).
Forests 10 00789 g001
Figure 2. Flow chart showing study procedure and data processing. DEM: Digital Elevation Model, DNS: Distance from the Nearest Stream, FDA: Flood-damaged Areas, FIA: Flood Inundated Areas, MSS: Multispectral Scanner System, SLC: Single Look Complex.
Forests 10 00789 g002
Figure 3. Visual interpretation of deforestation with high-resolution Google Earth imagery.
Forests 10 00789 g003
Figure 4. Map of land-use change (i.e., forest to crop field) within the study area.
Forests 10 00789 g004
Figure 5. Landform of the change area. (a) area (km2) and (b) percentage (%).
Forests 10 00789 g005
Figure 6. Results of the network cross K-function analysis between land-use change and flood damage.
Forests 10 00789 g006
Figure 7. Flood-damaged areas map with land-use change.
Forests 10 00789 g007
Table 1. Database in this study. DNS: Distance from the Nearest Stream, FAO: Food and Agriculture Organization of the United Nations, GIS: Geographic Information System, MSS: Multispectral Scanner System, NGII: National Geographic Information Institute, RS: Remote Sensing, USGS: United States Geological Survey, UTM: Universal Transverse Mercator, WGS: World Geodetic System.
DataPeriod or YearSpatial ResolutionCoordinate ProjectionLevelSource
RSLandsat MSS1977.05.2279 mWGS84/UTM Zone 52N1TUSGS
Landsat 82016.05.2830 m
GISFDAs map201630 mWGS84/UTM Zone 52N Lim and Lee [2]
Elevation map 1:25,000WGS84/UTM Zone 52N NGII
Digital topographic data
Slope map
DNS map
Landform map
Annual mean precipitation data1977–2016Before 2011: 28.8 km grid (3/10-deg)
After 2011: 19.2 km grid (1/5 deg)
WGS84 NOAA
Soil data 30 arc secondsWGS84 FAO
Table 2. Soil erodibility factor K [26,32].
Grain Size CompositionOrganic Matter Content (%)
Textural class<0.5<2<4
Sand0.050.030.02
Fine sand0.160.140.10
Very fine sand0.420.360.28
Loamy sand0.120.100.08
Loamy fine sand0.240.200.16
Loamy very fine sand0.440.380.30
Sandy loam0.270.240.19
Fine sandy loam0.350.300.24
Very fine sandy loam0.470.410.33
Loam0.380.340.29
Silty loam0.480.420.33
Silt0.600.520.42
Sandy clay loam0.270.250.21
Clay loam0.280.250.21
Silty clay loam0.370.320.26
Sandy clay0.140.130.12
Silty clay0.250.230.19
Clay 0.13–0.2
Table 3. Land cover and management factor C [26].
Land Cover TypeC Value
Crop field0.4
Forest0.1
Water0
Table 4. Erosion control factor P [26,29].
Slope (%)Contour TillageContour Strip TillageTerraced Tillage
1–20.600.300.12
3–80.500.250.10
9–120.600.300.12
13–160.700.350.14
17–200.800.400.16
21–250.900.450.18
Table 5. Runoff coefficient, rainfall intensity, and runoff of sub-watershed areas in the study area.
Runoff CoefficientRainfall Intensity (mm/hr)Runoff (m3/sec)
19770.3156.3128.2
20160.4660.8206.6
Difference0.154.478.4